Article

Mapping Potential Zones for Ecotourism Ecosystem Services as a Tool to Promote Landscape Resilience and Development in a Brazilian Municipality

by
João Vitor Roque Guerrero
1,*,
António Alberto Teixeira Gomes
2,
José Augusto de Lollo
3 and
Luiz Eduardo Moschini
1
1
Department of Environmental Sciences, Federal University of São Carlos, São Carlos 13565-905, Brazil
2
Department of Geography, Porto University, 4150-564 Porto, Portugal
3
Department of Civil Engineering, Universidade Estadual Paulista at Ilha Solteira, Ilha Solteira 15385-000, Brazil
*
Author to whom correspondence should be addressed.
Sustainability 2020, 12(24), 10345; https://doi.org/10.3390/su122410345
Submission received: 22 October 2020 / Revised: 27 November 2020 / Accepted: 27 November 2020 / Published: 11 December 2020
(This article belongs to the Section Environmental Sustainability and Applications)

Abstract

:
In recent decades, with the increasing global need for sustainable development, ecotourism has emerged as one of the most efficient activities that can be used to reconcile economic development with environmental conservation. A growing interest in the ecotourism and ecosystem services provided by landscapes makes such services increasingly necessary within municipal planning processes. This study aims to construct a geoenvironmental model based on geographic information systems (GISs) to spatially identify areas with greater capacity to promote ecotourism, with a practical case study of the city of Brotas, Brazil. The model can produce an integrated analysis of landscape components using geoenvironmental, topographic, and urban data. As a result, four zones were classified according to their ecotourism potential, with 81% of the overall local territory showing great potential, which not only reinforces the territory’s resilience regarding sustainable development, but also demonstrates that ecotourism should be included in discussions related to environmental planning in Brotas, as well as in other municipalities that have ecotourism potential.

1. Introduction

Due to its spatial magnitude, the Brazilian territory has favorable conditions for the occurrence of tropical landscapes and ecologies [1]. However, disorderly population growth and economic development based on agriculture and industrialization in the last five decades have caused large-scale changes in ecosystems and the services they provide [2].
Ecosystem services (ES) are understood to provide a wide range of benefits from terrestrial ecosystems, which are of fundamental importance for human well-being, subsistence, health, development, and survival—making them a crucial subject for study and analysis [2,3,4].
Despite the increasing interest in ES [5,6], there has been a significant reduction in the quantity and quality of ES on a global scale [7,8,9].
The greatest impacts on ES in nature come from land use changes made by humans without rational planning [7], which in Brazil essentially refers to the conversion of natural systems into agricultural areas [10,11,12]. These changes are continuously producing landscapes that are less resilient to anthropic interventions, increasing the natural and anthropogenic risks and directly affecting the quality of life [13].
Landscape resilience can be defined as the ability of an environment to withstand disturbances and reorganize itself while being subject to forces of change, ultimately maintaining its essential functions, structure, identity, and mechanisms [14]. Thus, resilience is a subject that is increasing in significance in geographic studies [15], since it provides the theoretical basis for new ways of defining degraded landscapes through the development and implementation of territorial planning instruments.
As such, the systematic and methodological integration of the fundamental concepts of ecosystem services and landscape resilience can provide important tools for socioenvironmental analysis, which can directly contribute to the adaptation of sustainable practices to specific territories, especially those that are excessively anthropized [16,17,18].
The analysis of ecotourism and ecosystem services as agents promoting land sustainability has contributed to the advancement of the topic of territory resilience. This is because ecotourism is considered an activity that balances economic development, natural resource conservation, and the institutional valorization of local communities [19,20,21,22].
Considering that territorial management is typically related to spatial decisions, it is crucial to cartographically or spatially demonstrate how we can change the current landscape to improve ecosystem services [23]. Thus, tools used to analyze landscape components, such as geographic information systems (GISs), have gained greater recognition for this type of research.
The application of cartographic techniques and GIS analysis to ecotourism planning is relatively recent, with an exponential increase in publications since 2015. The main focuses have included the analysis and identification of suitable areas for ecotourism, as presented by Çetinkaya et al. [24] and Aliani et al. [25]; the effects of land use changes in relation to public policies, as discussed by Kertezs et al. [26]; the effects of CO2 emissions, as discussed by Paramati et al. [27]; and ES in watersheds, as discussed by Paudyal [28].
As examples of the effectiveness of GISs, several papers have used this technique to analyze aspects of ecotourism and land planning, such as Gigovic et al. [29], who used a multicriteria model to identify appropriate areas for the development of ecotourism in Serbia in order to reduce the negative impacts caused by mass tourism. Jeong et al. [30] developed an operational GIS model to support ecotourism planning in Spain, while Bunruamkaew and Murayama [31] used a GIS and the analytic hierarchy process (AHP) to assess favorable areas for sustainable tourism in Thailand.
GIS approaches with the application of geoenvironmental data (internal structure, topography, and land use data) have been of particular interest for ecotourism and decision-making processes. As examples of these applications, Çetinkaya et al. [24] and Gigovic et al. [29] used the internal composition of the landscape as an essential parameter in their analyses, while Suriale et al. [32] and Sahani [33] applied topographic and geoenvironmental remote sensing data in their AHP models. In addition, studies by Nahuelhal et al. [34] and Thompson and Friess [35] are highlighted; they used geoenvironmental data from the perspective of ecotourism ecosystem services (EES).
Few papers have dealt with the introduction of tourism and ecosystem services in the Brazilian environmental planning process, partly because the lack of researchers and managers involved in the subject still poses a challenge [23]. According to Bocco et al. [36], the lack of adequate environmental planning is an imminent risk to developing countries, which are usually under severe environmental and demographic strain. In addition, as proposed by Kosmus et al. [37], the inclusion of an ecosystem services perspective in the planning processes is essential, because it clearly demonstrates the importance of the conservation of natural resources for local economic development, which is an important part of sustainable development.
Regarding Brazilian ecotourism, the situation is the same as outlined above. The lack or inefficiency of territorial planning means that there is no integrated development in relation to ecotourism activities. The current Brazilian strategy consists of stimulating private ecotourism, which covers significant areas of interest but neglects the rest of the territory, creating only specific points of development [38].
Thus, it is of vital importance to give scientific support and to encourage policy makers (through municipalities) to be protagonists of the ecotourism process, promoting its implementation at the municipal scale. Based on these assumptions, this study applies a geoenvironmental model using GIS capabilities to evaluate the landscape’s current capacity to provide ecosystem services for ecotourism in a Brazilian municipality, i.e., identify the best places where locals and tourists can obtain ecosystem benefits regarding a sustainable touristic exploitation of the territory.
The research is applied to Brotas, a municipality in southeastern Brazil, characterized by its considerable potential to promote ecotourism ecosystem services, such as waterfalls, viewpoints, canoeing, and zip lines, among others.
However, such potential for ecotourism faces conflicts with the current configuration of land use, which, being primarily dedicated to intensive agriculture and pastures and without proper planning has caused degradation processes such as contamination by pesticides [39], deforestation, and soil erosion [40].
The results obtained here are intended as a framework guide for sustainable territorial management, cartographically demonstrating the local potential of EES to encourage an efficient and resilient use of the landscape as well as to promote sustainable development on a local scale.

2. Materials and Methods

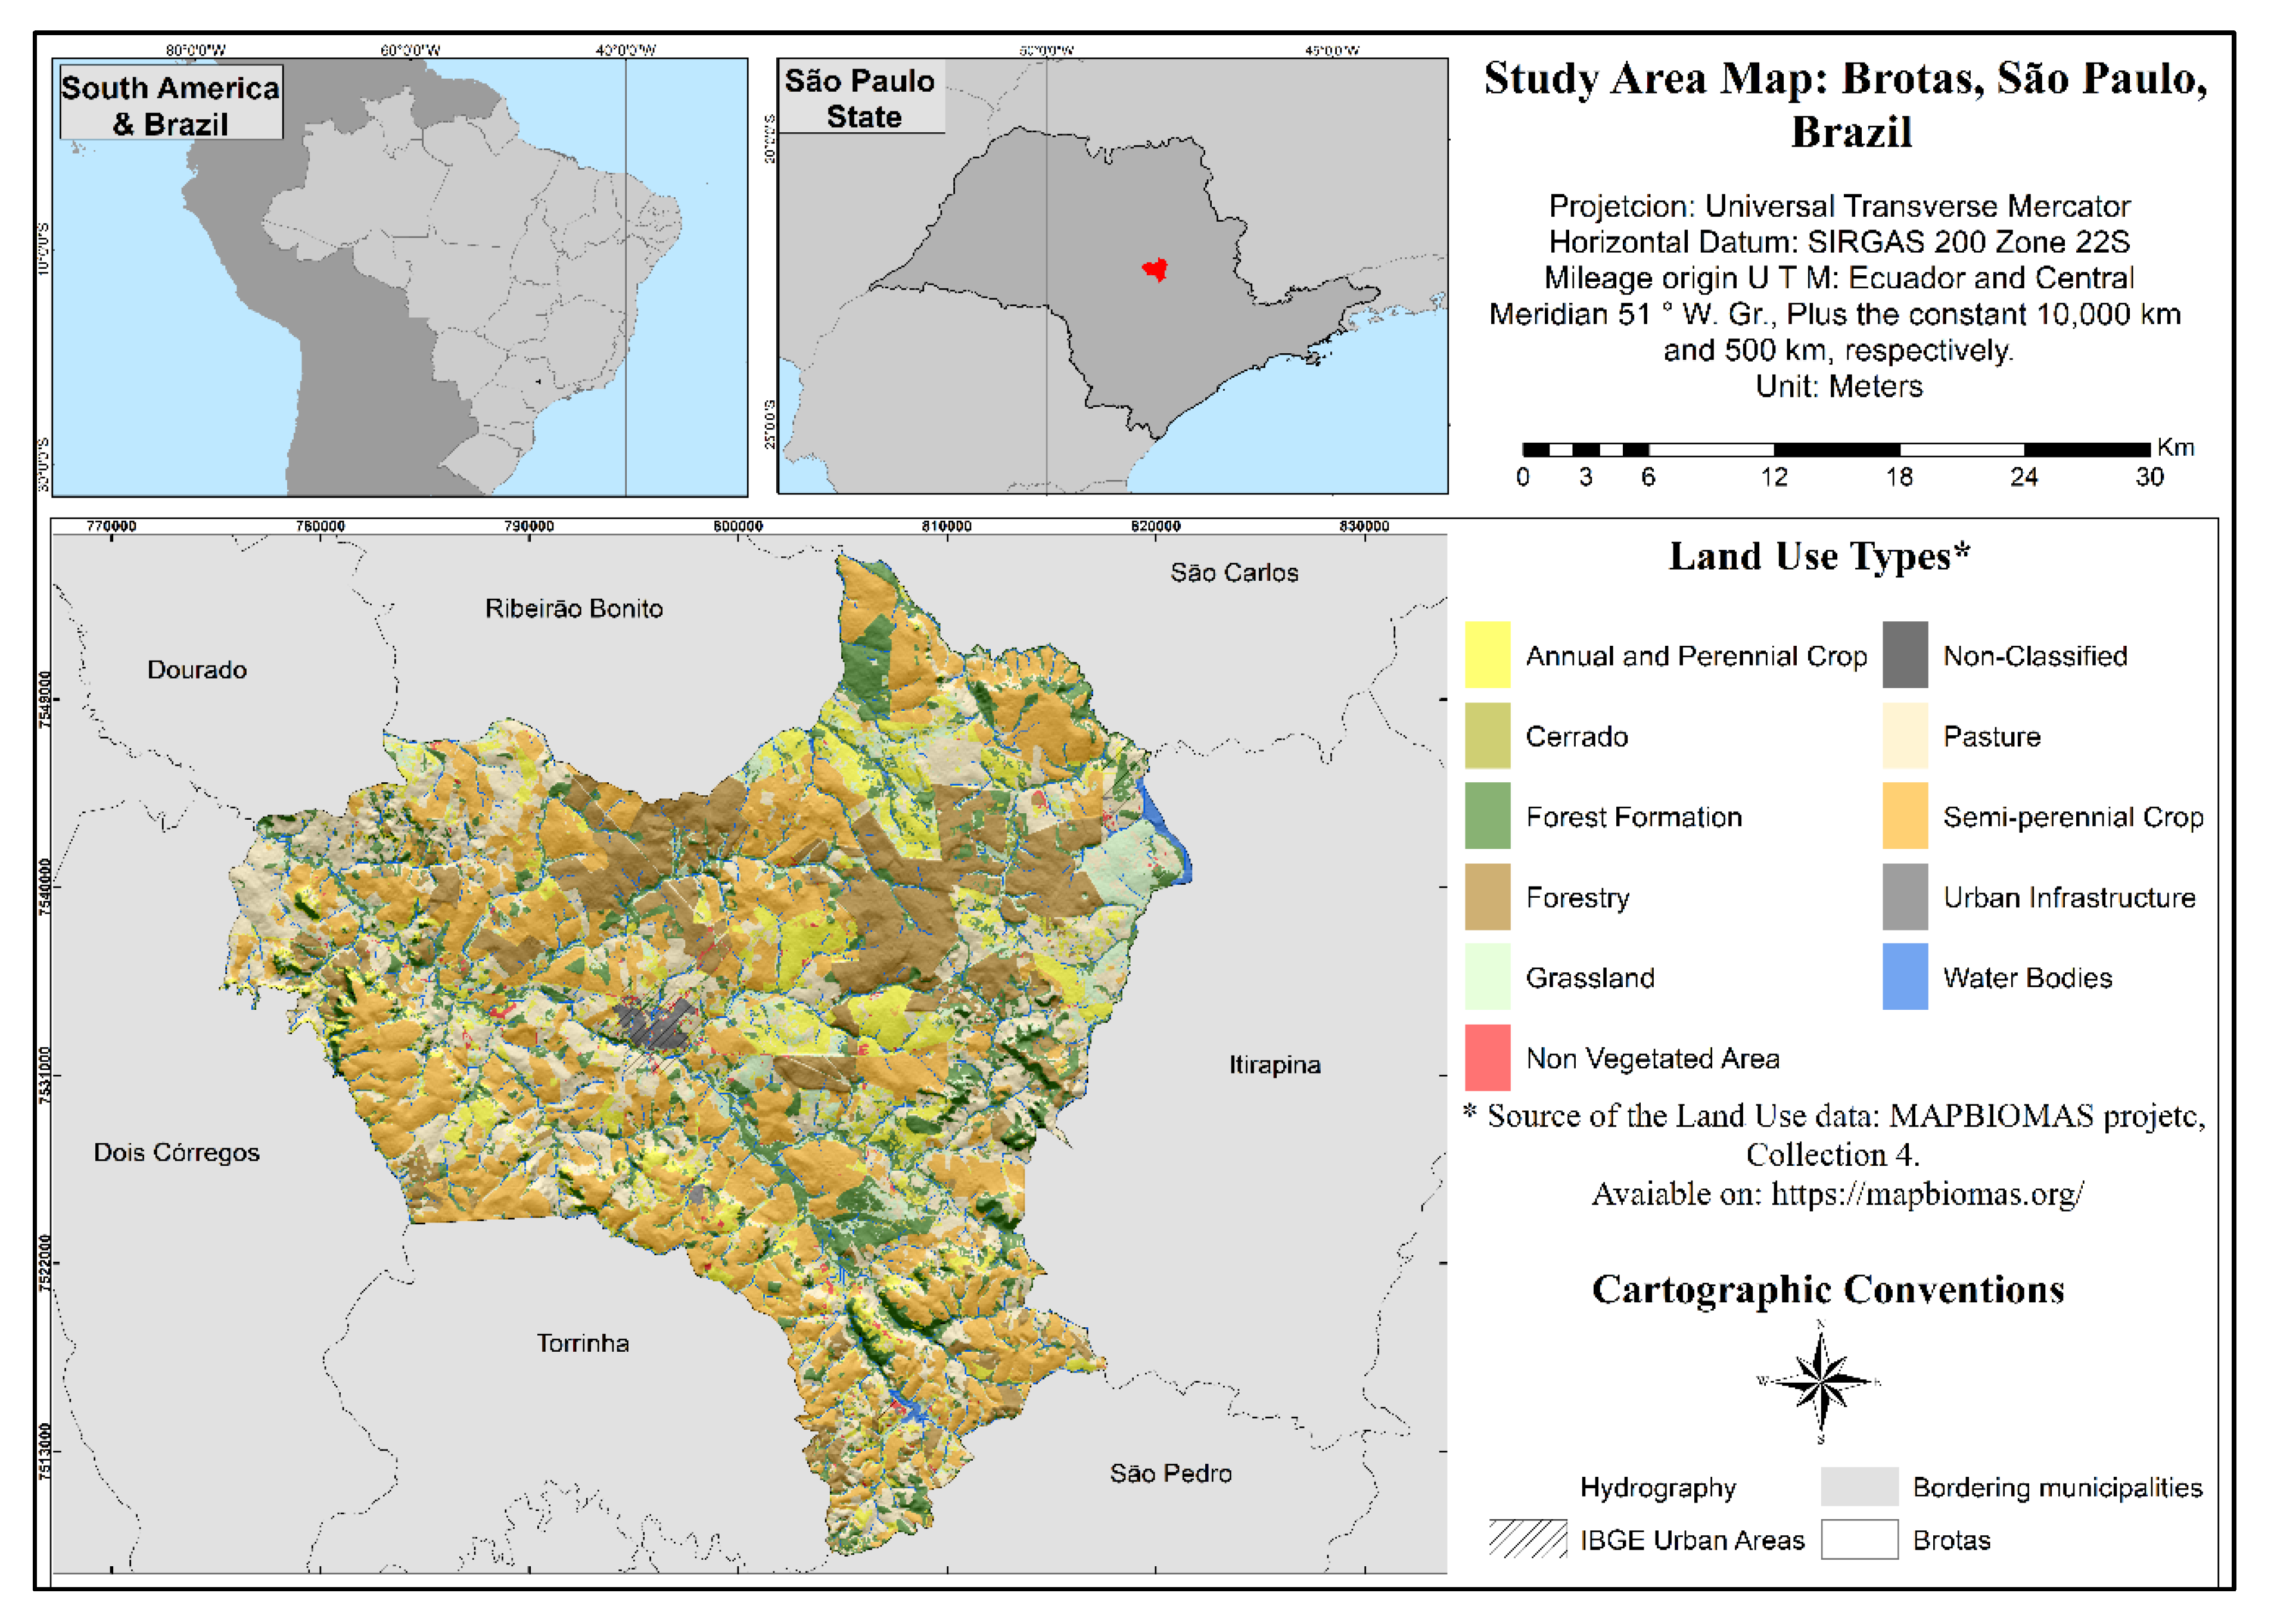
2.1. Study Area: Brotas, São Paulo State, Brazil

The study area comprises the municipality of Brotas, located in the central region of the state of São Paulo, southeastern Brazil (Figure 1). It was chosen due to its richness of landscape elements that are extremely favorable for the promotion of ecosystem services linked to ecotourism.
Geomorphologically, low dissected plateaus, hills, and degraded escarpments predominate in the study area [40]; these are a direct reflection of the modeling history of local lithology, mainly composed of sandstones of Botucatu and Pirambóia formations and sandy-conglomeratic deposits of Itaqueri formation [41].
In this relief-geology relationship, it is worth noting that, in many areas in the municipality, the contact between Botucatu and Pirambóia formations with great topographic steps corresponds to several waterfalls and attractive sights [42,43,44].
According to [45], the climate in Brotas corresponds to the characteristics of the CWA climate, which is described, according to the Koppen climate classification, as humid summer subtropical, with a dry winter; it is the predominant climatic type in the central, eastern and western regions of São Paulo State [46].
In relation to local ecotourism, Brotas is nationally known for being one of the preferred destinations when it comes to adventure tourism and landscape contemplation in Brazil [47,48]. Its main attractions are waterfalls, water sports (rafting, canoeing), high vantage points, rural tourism, zip lines, among others, which already correspond to a significant percentage of the municipality income.

2.2. Methodological Framework

The structure of this work aims to identify, applying geospatial data modeling, homogeneous zones in terms of landscape capacity to promote suitable sites for the development of ecotourism activities, i.e., areas where ecosystem services for leisure and recreation are promoted, contributing to landscape resilience and sustainable development.
For this, we applied a five-step geoenvironmental model: data acquisition; mapping parameters; weight assignment and parameters normalization: cartographic parameters overlapping; and definition and analysis of the potential zones for ES.
Figure 2 demonstrates the methodological procedures.

2.2.1. Step 1: Data Acquisition

The first step was the acquisition of spatial data in three different groups: geoenvironmental, topographic, and socioeconomic. The data used reflects the landscape structural organization according to its importance for ecotourism activity implementation, as proposed by [29], adapted to the Brazilian context.
Geoenvironmental data represent the local physical environment i.e., the landscape structure regarding geological, pedological, and geomorphological processes.
The topographic data aimed to evaluate the terrain relief from altimetry records, demonstrated in georeferenced lines and columns where each pixel of the image has an elevation value [49].
Finally, socioeconomic data exposed the most relevant human actions regarding the territory ecotourism potential, such as highways and urbanization.
Table 1 presents the data used, sources, year of production, and the approximate cartographic scale.

2.2.2. Step 2: Mapping Parameters and Cartographic Treatment

This step consisted of obtaining primary products from the previously acquired data, building a geographic database, and standardizing the new maps produced. The Brazilian cartographic norm [50] suggests the standardization process to unify the geometric and geographic characteristics of cartographic documents in order to minimize errors and distortions that might harm the final analysis.
Geology and relief maps are primary documents from Brazilian research institutions. These data required clipping for the study area, re-projection, and Datum conversion. The soil map, as it is available in a .tiff image, required georeferencing and manual vectorization of its attributes before insertion in the project database.
The ALOS-PALSAR data were pre-processed using spatial analysis tools in ArcGis 10.6, producing secondary data related to aspect, elevation, and slopes.
For the production of road distance maps and distance from negative factors, we processed data on roads, urban areas, and negative land uses with the Euclidean distance tool, which calculates, for each cell, the Euclidean distance to the closest source.
Finally, all products were standardized for the universal transverse mercator projection, Datum Horizontal SIRGAS 2000 (Brazilian standard), and Zone 22 south.

2.2.3. Step 3: Weight Assignment and Fuzzy Normalization of Parameters

The overlapping of cartographic products in a GIS requires standardization values, based on mathematical weighting, to be assigned for both the parameter classes and the spatial parameters themselves [51].
The standardization of the parameter classes consists of defining adequate factor values for a common scale to allow comparisons. Thus, we defined four classes (values) according to land suitability for the implementation of ecosystem services related to ecotourism: Low (1), Moderate (2), High (3), and Very High (4).
When evaluating the structure and spatial distribution of the parameters that were used, we observed that the potential zones of ecotourism ecosystem services would be properly distributed in four classes, avoiding as much as possible subjugated classes with spatial distributions so statistically irrelevant that they make their analysis impossible.
To assist with weight allocation, we mapped the ecotourism attractions registered in the Brotas Tourist Inventory [52] and applied a spatial correlation to the analyzed parameters, mapping only officially registered ecotourism attractions despite the fact that there were several unregistered attractions in the municipality.
Table 2 shows the justifications for the assignment of weights to each parameter:
From the classification key shown above, we assigned values for each attribute of the analyzed parameters, presented in Table 3:
Considering that the landscape spatial characteristics do not have clearly defined limits and that many of these geographic phenomena show a high degree of inaccuracy (especially in transitory zones), it is evident that such data cannot be properly expressed with clear set class limits, such as Boolean logic sets [55].
As a solution, several authors such as [55,56] indicates fuzzy inference as an instrument for cartographic normalization, capable to solve this problem caused by traditional Boolean analysis.
Zadeh [57] introduced fuzzy inference to deal with inaccurate concepts, which is a methodology for characterizing classes that, for different reasons, do not contain exact limits or borders. Thus, [58] stated that whenever there is ambiguity, ambivalence, or abstraction in mathematical models, scientists should implement fuzzy sets.
The fuzzy inference systematization in GISs requires the normalization of the parameters analyzed on a scale that reflects a decision rule, which in this study corresponds to the potential classes for the occurrence of ecotourism ecosystem services. Among the various fuzzy normalization functions available, we used the linear function, with the aid of the fuzzy membership tool in the ArcGis 10.8 software.

2.2.4. Step 4: Overlapping of Cartographic Parameters

Map overlay is a geospatial analysis function that considers that the landscape can be modeled by overlaying geographic layers, where each layer is an analyzed spatial parameter [59].
In this study, we used the analytic hierarchy process (AHP) to support the cartographic overlap of the analyzed parameters. Created by [60], the AHP is a mathematical theory, based on paired comparison logic, which allows organizing and evaluating the relative importance among all the geospatial layers of the model [61].
The application of this technique consists of elaborating a paired comparison between the used parameters (2 in 2), and using a scale of values corresponding to the relative importance between the elements, thus building a correlation matrix. Table 4 shows the classes of relative importance with assigned values.
For the correlation matrix construction, we inquired seven specialists, such as geographers, geologists, and biologists, with prior knowledge of the physiographic structure of the study area. Their opinions were about the relative importance of each element analyzed, taking into account factors such as the propensity to implement infrastructure, environmental risks and the landscape ability to promote attractions.
The built-in pair interactions are shown in Table 5:
The consistency ratio, which is a single numerical index to check for consistency of the pair-wise values, was 0.019, demonstrating the consistency of the relationships proposed in the model. Finally, Figure 3 indicates the relative importance of the parameters (in percentage), diagnosed by the AHP.

2.2.5. Step 5: Ecotourism Ecosystem Services Potential Zones and Supporting Decision Making

The fifth step consisted of analyzing the cartographic products and establishing the contribution of geoenvironmental cartography to the decision-making process (DMP). The DMP is defined as “a spatially based computer application or data that assist a researcher or manager in making decisions” [62].
In the context of this research, the decision-making process starts from the concern that the territory and its natural resources must be used sustainably, based on technical and scientific criteria.
Thus, the definition of ecotourism ecosystem services potential zones assists territorial planning processes by identifying local potential and restrictions regarding the implementation of ecotourism activities.
Furthermore, considering ecotourism as a form of landscape resilience in the face of anthropic degradations, it is understood that the DMP based model is a direct contributor to encourage sustainable territories through efficient environmental planning.

3. Results

The model parameters were normalized using fuzzy inference, as shown in Figure 4. The process of numerical allocation to space occurred respecting the transition zones between the attributes of each data, predicted during methodological application and proven by several authors as [29,55,63].
The result of the geoenvironmental model application is the Ecotourism Ecosystem Services Potential chart for the municipality of Brotas, São Paulo, Brazil (Figure 5). It shows the most suitable areas for ecotourism attractions implementation, contributing to sustainable territorial planning and to landscape resilience at a local scale.
Strengthening landscape resilience through territory spatial planning is a viable alternative to sustainable development in Brazil, as discussed by [42,64,65], although it is still a challenge to planning processes of municipalities.
Seeking to reconcile the resignification of the landscape promoted by ecotourism with local sustainable development, our chart presents four zones of interest, classified as Z1 (Low), Z2 (Moderate), Z3 (High), and Z4 (Very High) that represent only the region potential and do not necessarily reflect the current use of the territory for ecotourism attractions.
The analysis of human interventions on-site made it possible to identify, with the assistance of the land use chart [66], that Brotas is in an advanced stage of anthropization, with 22% of the remaining types of natural use (forests, fields, savannah and water bodies). It also indicated that the main driving force of the local economy was the agricultural activity, especially impacting the vast areas of sugarcane crops; agriculture is a traditional activity in the state of São Paulo with considerable potential for degrading landscapes [67,68,69].
The final map identified the potential zones to promote ecosystem services associated with ecotourism and their relative percentages (Figure 6), showing that 81.5% of the territory has High or Very High potential.
Such an expressive result comes from geological, geomorphological, and local climate conditions that allow the occurrence of morphological features of ecotourism interest (on a punctual or regional scale), such as river rapids, waterfalls, fishing sites, scenic beauty derived from topographic differences, among others.
To support the results, we performed Pearson’s correlation analysis among the potential classes and the number of attractions contained in each class. Given the differences between the sizes of the areas of classes, we adopted as standard the number of attractions/km area, for each class, thus creating a comparable unit. Table 6 shows the data used in the correlation.
The result of Pearson’s linear correlation was 0.83, indicating a positive correlation of the geoenvironmental model, that is, the greater the potential, the greater the proportion of occurrence of ecotourism attractions

3.1. Z1—Low Potential for Ecotourism Ecosystem Services

Zone 1 (Figure 7) shows the areas where exploiting ecosystem services provided by ecotourism features is less viable. These areas occupy 1% of the study area and their main characteristic is the fragility of their geoenvironmental structure, mainly due to the susceptibility to the occurrence of periodic floods, as proposed by [40]. One factor that proves the inadequacy of these areas for ecotourism is that no active tourist attractions were identified there by the municipal touristic inventory.
These areas present a lack of accessibility and consist of flood plains, fragile soils, low elevations and geological formations with a sandy surface resulting from deposition in valley bottoms. Researchers such as [63,70,71] point out that such areas present high environmental vulnerability regarding erosion processes, posing risks if tourism infrastructure is implemented.
This characteristic occurrence in valley bottoms coincides with permanent preservation areas (APP) established by law 12.651 [72], which are specially protected territorial spaces with restricted use, designed to preserve the environmental services of sensitive areas [73].
The recommendation is that reforestation actions must be implemented in these areas, aiming at the environmental conservation of these fragile areas and at the landscape composition that can enhance other areas with greater ecotourism potential. Several authors demonstrate the effectiveness of reforestation in combating various environmental problems, such as [74,75,76,77], reinforcing the importance of forest restoration for local ecosystem services.
Due to the impacts of poorly planned anthropic interventions, it is also fundamental to develop mechanisms of environmental impact assessment and to recuperate degraded areas, mainly with effective social participation in these actions [78].

3.2. Z2—Moderate Potential to Ecotourism Ecosystem Services

Considering the 1102 km2 of the study area, 17.5% has moderate potential for the occurrence of ecosystem services. The spatial distribution of this zone occurs throughout the municipality, but its highest concentration occurs in the center, northeast, and northwest of the territory (Figure 8). It covers areas considered as environmentally restricted due to their structural characteristics (fragile soils, sandy geology); however, they still have some potential for ecotourism.
The lower degree of the slopes reflects the minor possibility of large waterfalls, river rapids, and extreme sports, among others. However, its landscape has potential for activities such as fishing and rural tourism.
In this area, only one tourist attraction was mapped, which is a waterfall, but with low amplitude due to its low topographic step. This occurrence demonstrates that even in moderate areas there is the prospect of ecotourism exploration, however, due to the potential fragility of their land, precautionary measures should be taken aimed at the safety of visitors and focused on low environmental impact.

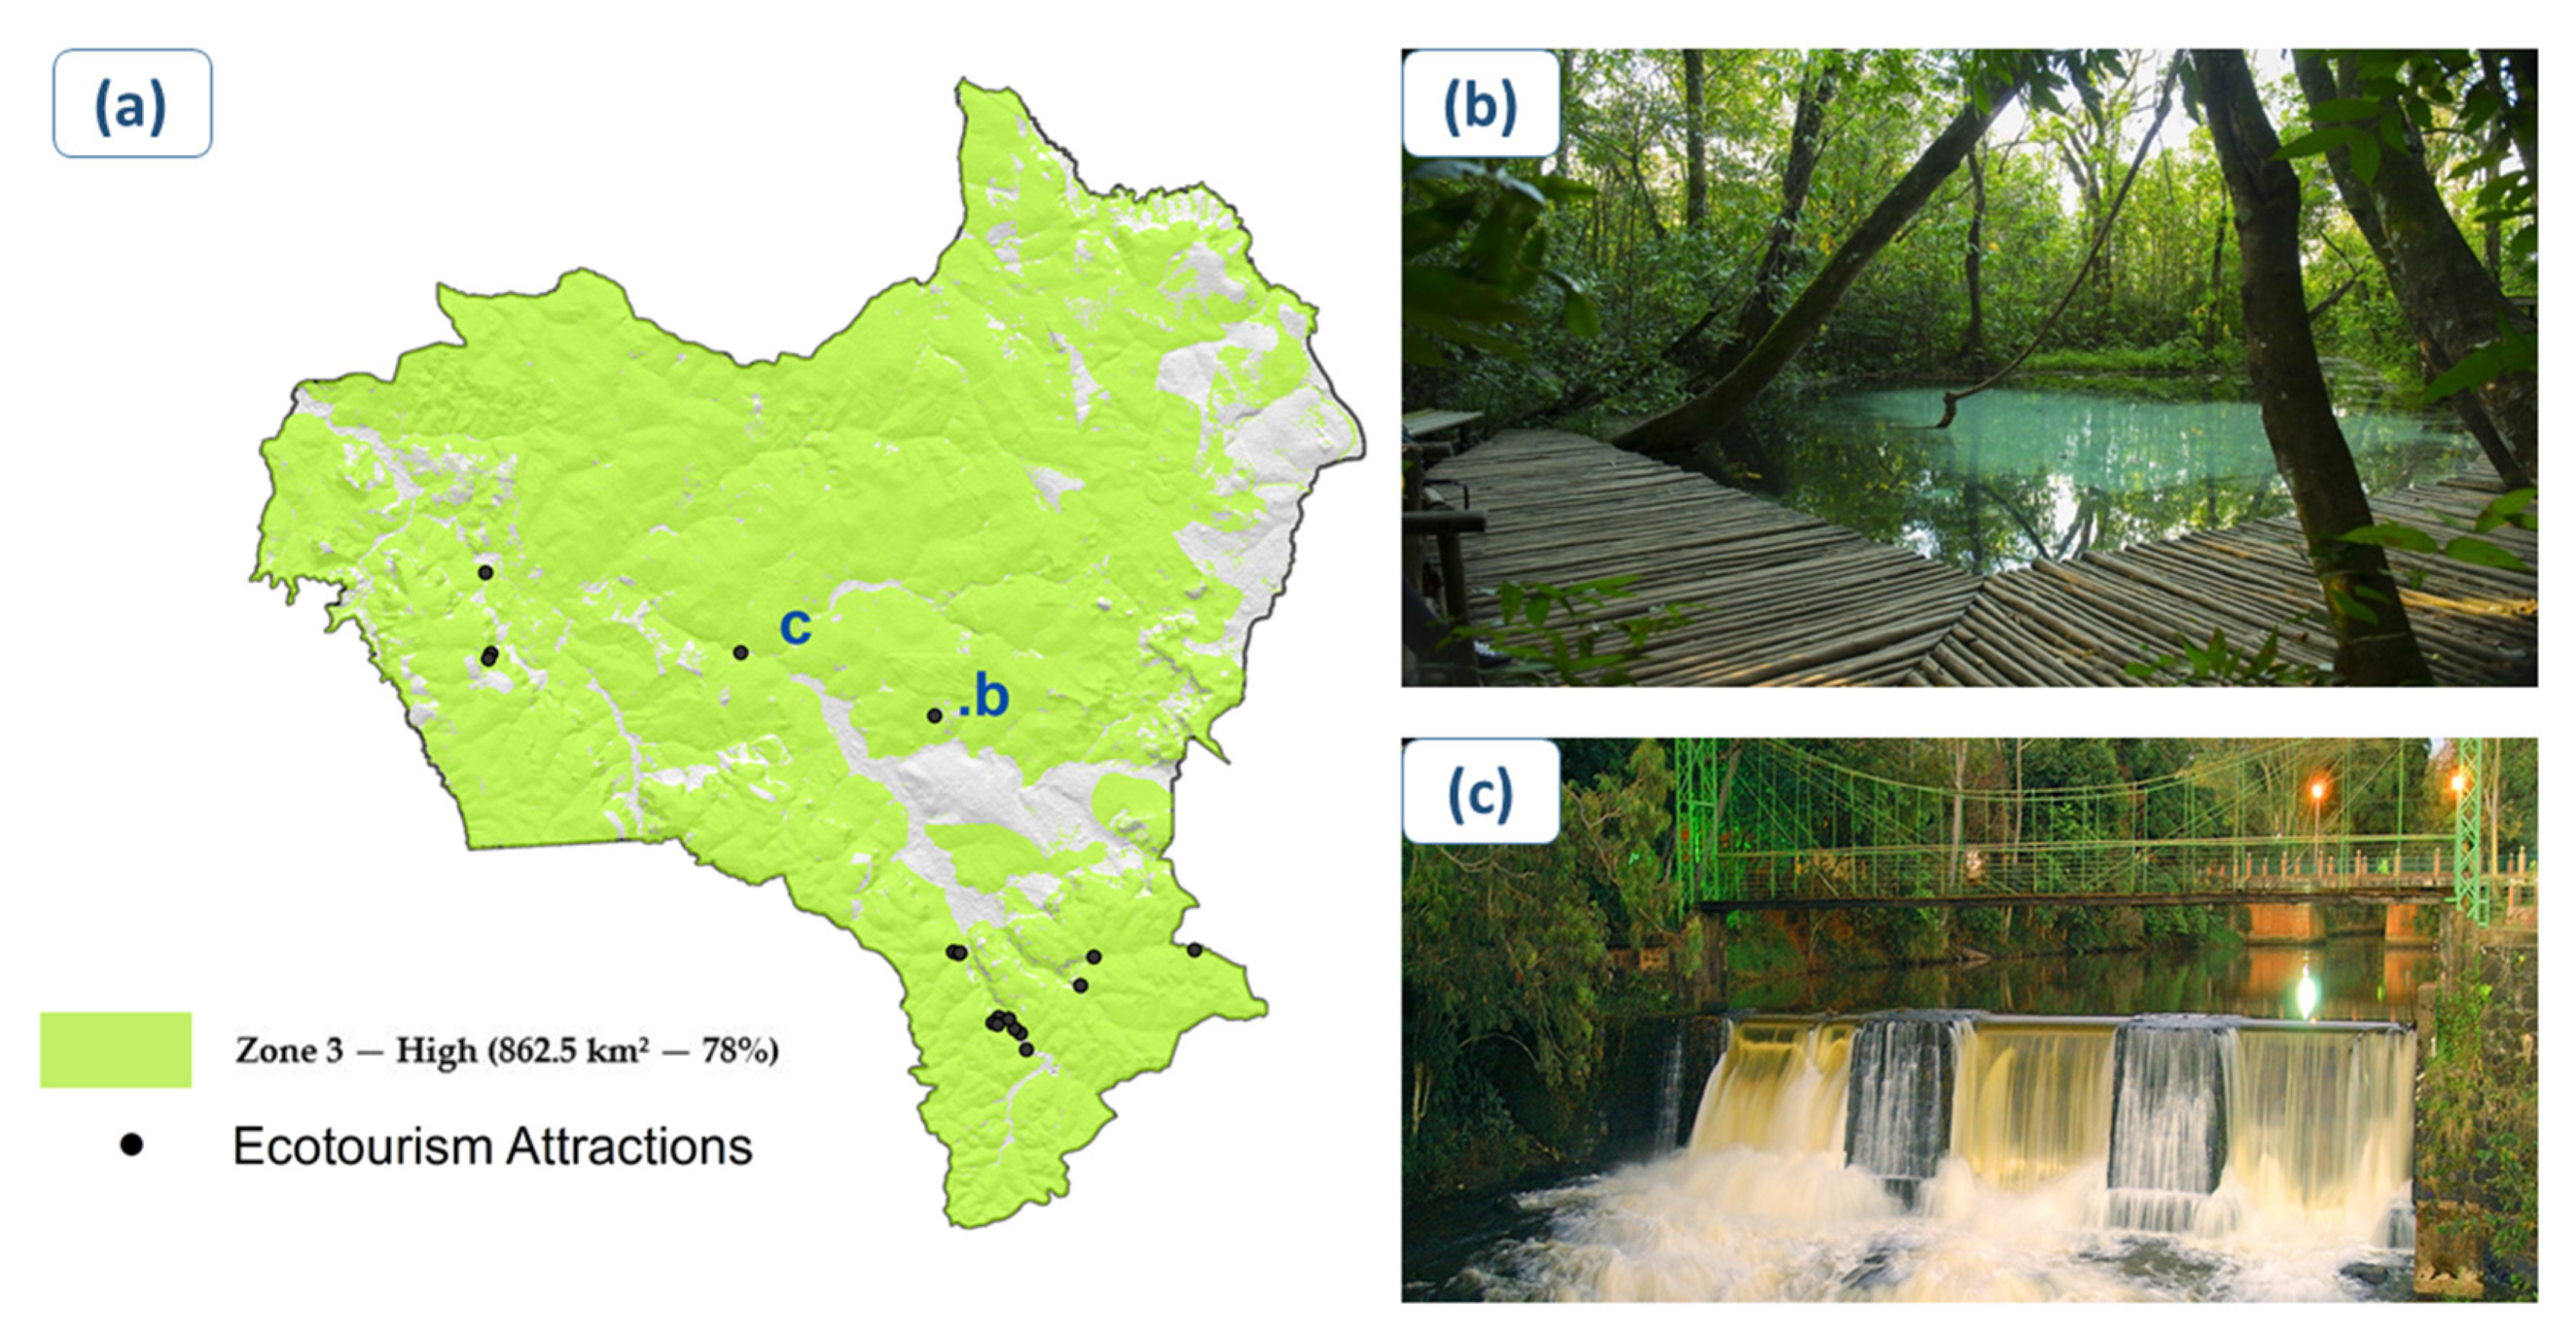
3.3. Z3—High Potential for Ecotourism Ecosystem Services

Zone 3 (High Potential), illustrated in Figure 9, occurs in 78% of the territory of Brotas, indicating that the set of factors that form the local geoenvironmental structure superficially reflects in favorable conditions to the presence of touristic interest morphologies. The spatial correlation applied indicates that 70% of the mapped tourist activities are in these locations.
The structure of this zone consists of hills, escarpments, and low dissected plateaus; the features include the Red-Yellow Latosols, the relative proximity to water resources, good accessibility, and favorable geological formations. In this region, the presence of springs with landscape potential (Figure 9b), waterfalls (Figure 9c), rapids, and areas of landscape contemplation (in the highest elevation) stand out.
It is in this area that the main flow of the Jacaré-Pepira River can be observed, considered by [47] as a determining element of the landscape and as an arrangement of socialization, leisure and cultural identity for the local population and visitors, and where several companies promote leisure/sport activities in boats, canoeing, rafting, among others.
The limiting factor observed is that, despite the potential for ecotourism, the current pattern of land use is concentrated on an area of extensive agricultural cultivation, mainly sugar cane.
Although ecotourism allows maintaining traditional rural activities [80], a paradigm shift is currently taking place with the appreciation of nature aesthetics, due to travelers’ desires to reconnect with what is considered natural.
This reconnection is a reflection of the global environmental crisis experience, where what was previously considered “bush” or “jungle” has become a pleasant counterpoint to the total urban and degraded landscapes witnessed daily by people [81].
One possibility for facing this spatial/economic dichotomy is the development of rural tourism as a planning strategy, which allows appreciating the historical value of the municipality, adding value to the traditions and customs of local communities. Several projects related to this theme have been developed in the Brazilian territory, with relative success in supporting sustainable development, such as [82,83,84].

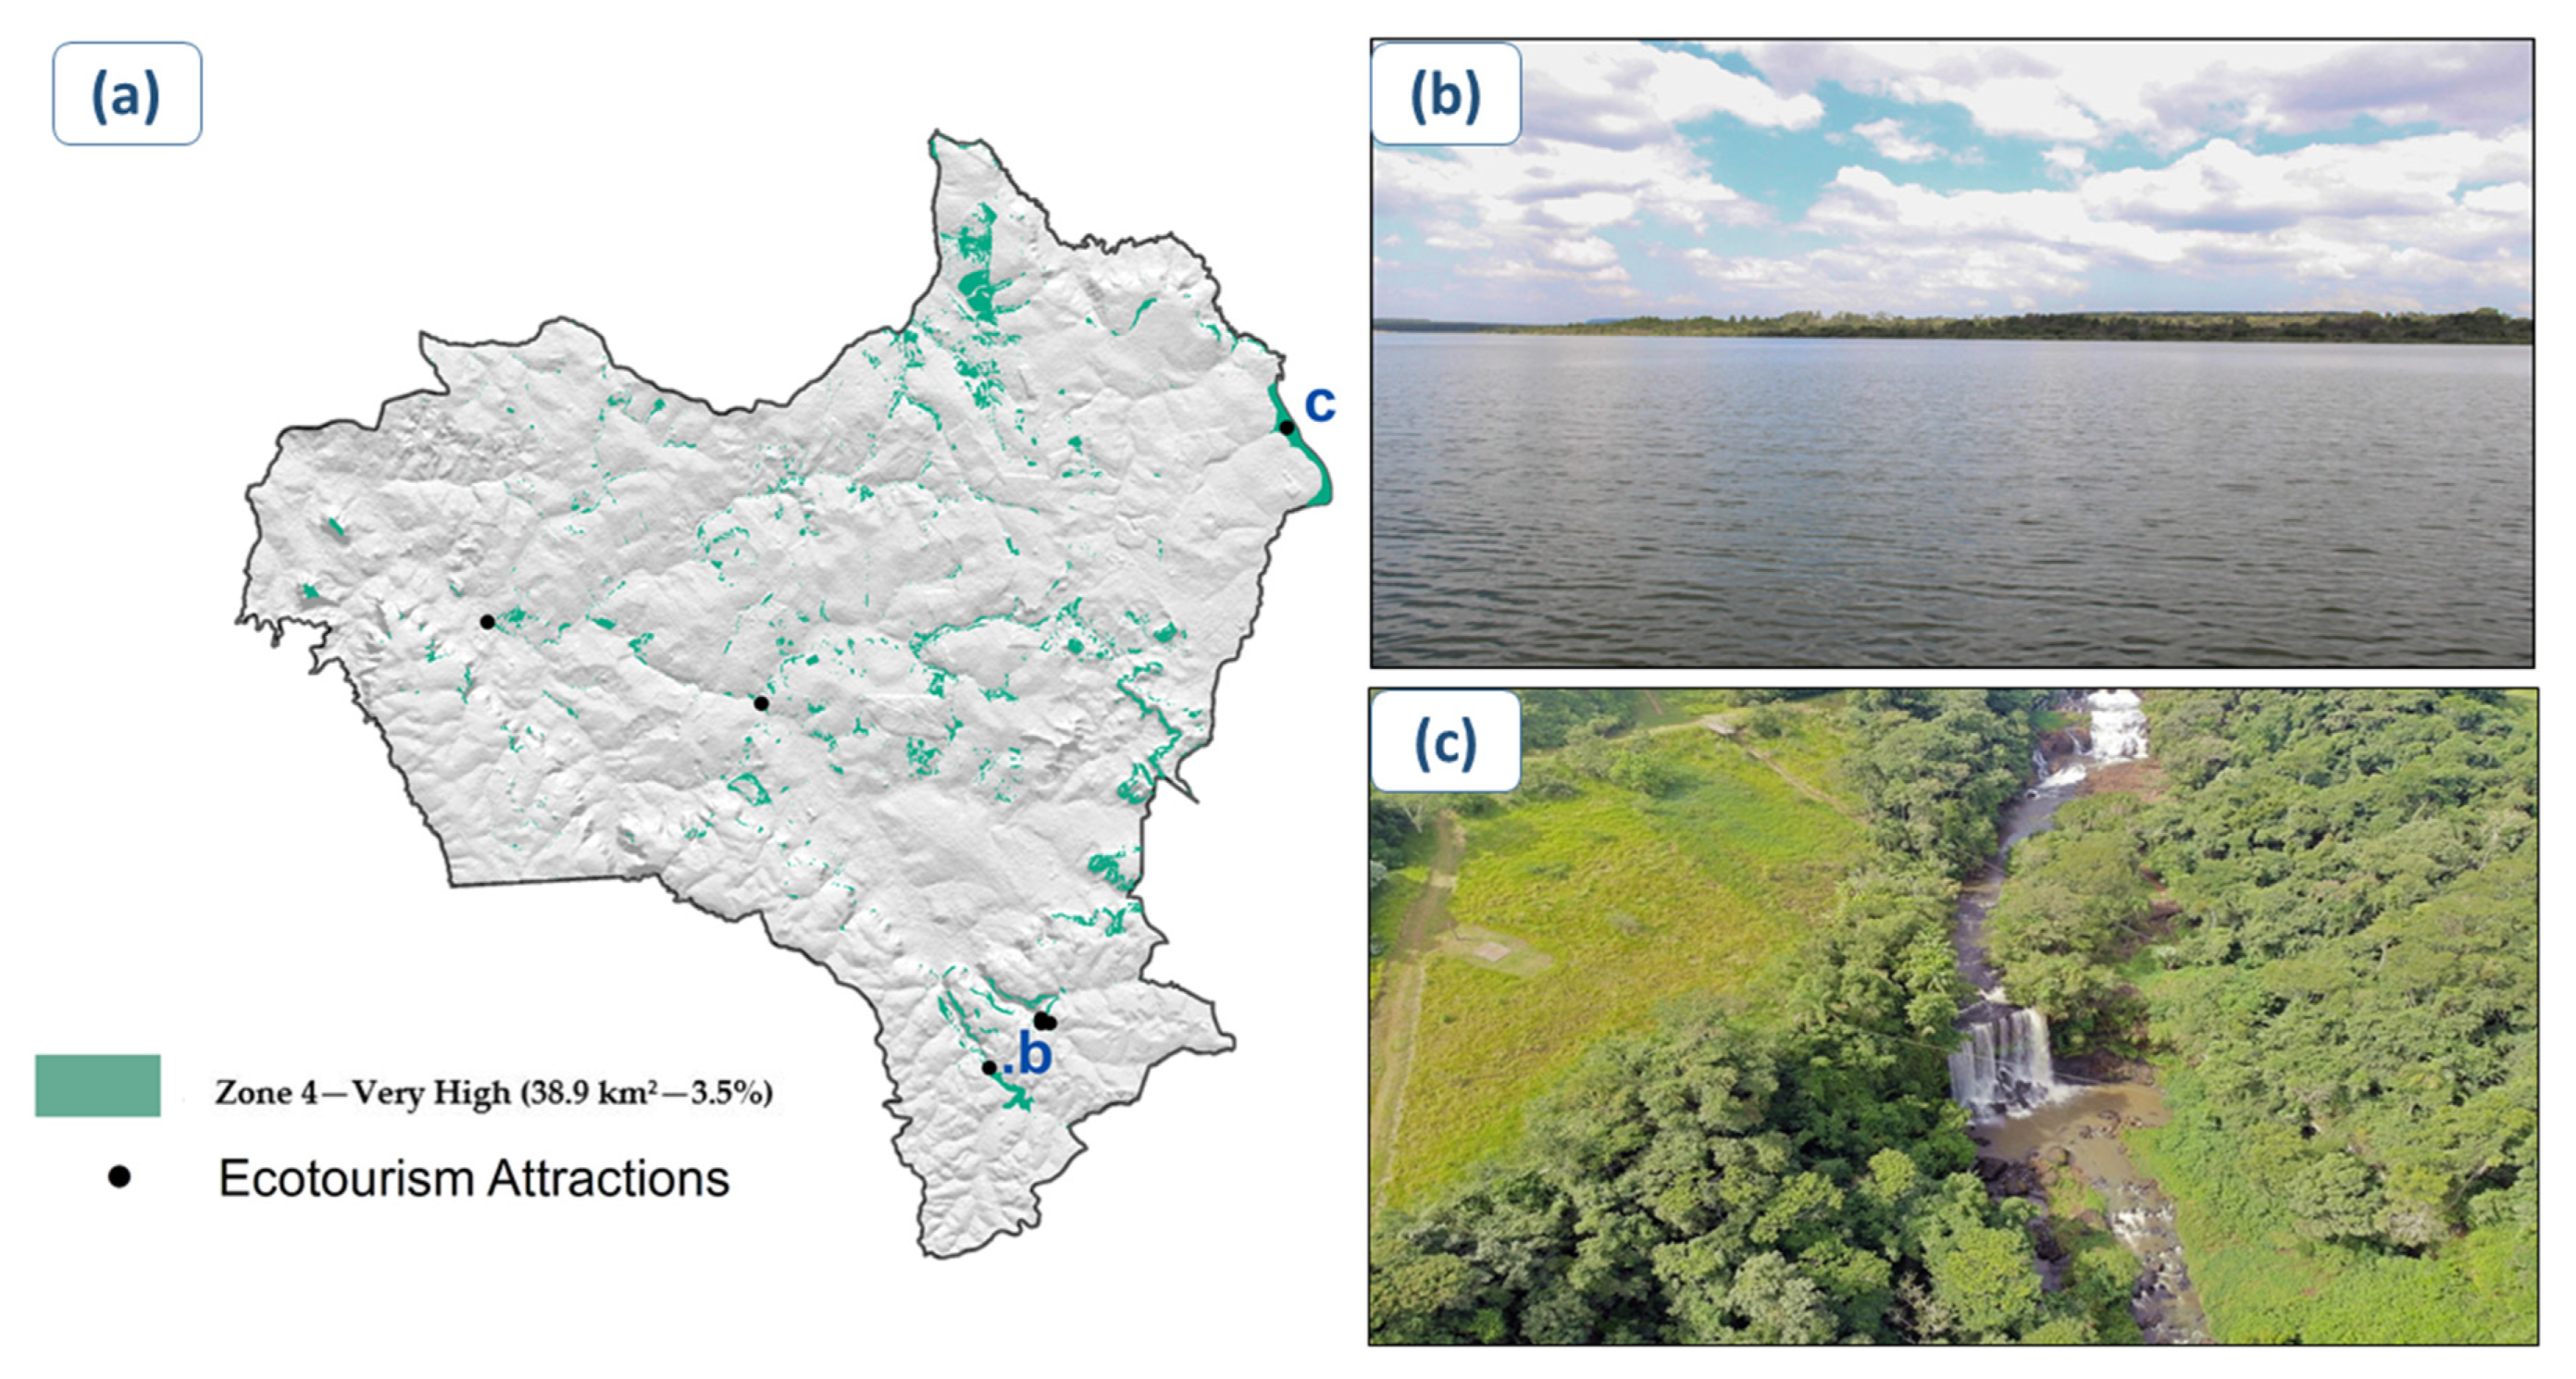
3.4. Z4—Very High potential for Ecotourism Ecosystem Services

Zone 4 shows areas with a very high potential for the provision of ecosystem services for ecotourism across the landscape and covers 3.5% of the study area (Figure 10).
Its structural composition includes relief forms that promote scenic beauty, such as high waterfalls and leisure spaces (tops, plateaus, and embedded valleys), mature and well-structured soils, natural land uses (forests, savannah, and water bodies), easy accessibility for visitors, proximity to usable water resources and surface geological formations that have ecotourism appeal.
We realized that the reduced spatial occurrence in this zone is not due to the low local ecotourism potential, but rather to the high degree of the anthropization, where the landscape is mainly composed of vast sugarcane plantations, which directly interfered in the applied geoenvironmental model.
Even so, 7 duly registered [52] tourist attractions (27%) are currently explored in those areas, and their high potential results in different types of landscape that can promote different tourist attractions such as nautical leisure (Figure 10b), wide waterfalls (Figure 10c), landscape contemplation and adventure tourism.
Similarly to Zone 3, Zone 4 also occurs over regions considered as permanent preservation areas (APP), mainly related to hilltops and riparian vegetation, where a more efficient governmental inspection is critical to the long term compliance with environmental laws and to quality preservation of the ecosystem services provided.
Potentially impactful areas prone to land use conflicts require the development/implementation of sustainable environmental management instruments, such as payments for environmental services, which enable a more harmonious relationship between rural producers and local sustainable development.
Therefore, more in-depth studies with greater cartographical detail are recommended for Zones 3 and 4 in order to allow a more efficient analysis related to what types of ecotourism can be implemented in each mapped area, contributing more efficiently to local territorial planning.

4. Discussion

The importance of ecotourism as an instrument of landscape resignification and sustainable development was discussed by several authors, such as [17,20,47], indicating the theme relevance to landscape sustainable planning. However, ecotourism expansion often conflicts with land use [76], since the recent development of these green activities has not yet been able to overcome traditional uses in Brazil.
Some authors have already reflected on the theme of ecotourism in Brotas, studying the applied public policies (Pereira et al. [48] and Ribeiro and Amaral [87]), and the history of local ecotourism (Martins and Madureira [47]). The work of Guerrero et al. [42], for example, aimed to identify suitable areas for ecotourism, finding 88% of such areas in Brotas, which is similar to our results using a different technique.
Our results showed that the municipality of Brotas directly faces conflicts of territorial interest, given that it has a high potential for the provision of ecosystem services for ecotourism, while its economy remains deeply dependent on traditional agriculture [67]. Even though these conflicts are still a challenge, authors like [88,89] demonstrate the positive transformative potential that sustainability brought by ecotourism projects has had on landscapes around the world.
As proposed by Martins and Madureira [47], the municipality of Brotas historically presents land use conflicts. However, from the 1990s onwards, the population’s ideals and the public policies turned to environmental conservation and ecotourism, seeking to mainly explore the most favorable areas such as those shown in our study.
Thus, proposing zoning that takes into account local geoenvironmental characteristics and land use with a GIS model to identify the main potentialities and restrictions to ecotourism becomes an important tool for environmental planning when seeking to reconcile the forms of land use from a natural resources conservation perspective.
The significant results obtained from the applications of multicriteria decision analysis (MCDA)/GIS analysis have made this technique quite usual for the planning of ecotourism areas with multiple uses [24,29,33], contributing to enhancing this kind of application in the Brazilian territory.
From the dynamics presented above, we can consider that the municipality of Brotas has the necessary conditions to promote a more sustainable development since the high capacity of the local landscape to provide ecosystem services for ecotourism can enable a restructuring of anthropized landscapes based on the valorization of the natural capital.
Considering that the municipality has high or very high potential in 81% of its territory, its resilience capacity is worth noting. However, such resilience is only fully activated as long as there are public policies aimed at environmental sustainability which strengthen ecotourism ecosystem services as primary assets of the local economy [16,90].
As mentioned by the Brazilian Ministry of Environment [91], the maps produced at a scale of 1: 50,000 (just like the ones used in this work) refer to the tactical/operational approach at a municipal scale, being the basis for the territory planning processes. Thus, it is clear that for the individual management of each ecotourism attraction within the diagnosed areas, further studies on the issue of cartographic scale (1:10,000 and greater) are necessary.

5. Conclusions

Our methodological application produced four geoenvironmental potential zones to provide ecosystem services for ecotourism, taking into account environmental, topographic, and socioeconomic parameters.
The results obtained indicated a high probability of occurrence of the ES, as 81.5% of the territory presents High or Very High potentials and, if we consider the Moderate zone, this index rises to the expressive value of 99%.
Such potential allied with a growing appreciation of ecotourism activities in the municipality present planners and local managers with a viable strategy for the sustainable re-signification of the land use strengthening the environmental resilience of the landscape.
Bearing in mind that it is impossible to promote abrupt transitions in the current economic matrixes (focused on agribusiness), it should be noted that the resilience promoted by ecotourism activities also acts in the social sphere, with the valorization and insertion of local communities in the territory appropriation process.
In the places of greatest potential from the defined areas, we recommend studies on the valuation of ecosystem services that are accompanied by cartographic products and inventories on a larger scale, which allow a more detailed planning process of the local territory.
The use of geoenvironmental cartography with GIS and multicriteria analysis (Fuzzy-AHP) proved to be a consistent tool to support decision-making on the theme of ecotourism ecosystem services, as it allows a faithful representation of landscape conditions, in addition to spatially demonstrating the potential and restrictions of the municipality.
From the perspective of urban/environmental planning in Brotas, we recommend that the ecotourism ES zoning chart be included as a basic document in the municipal master plan, considering that this set of rules that guide development provides the use of environmental zoning to promote sustainable development
It is crucial to emphasize that, for the areas with the greatest potential, more detailed studies and are necessary to allow more specific actions regarding the sustainable territorial planning of the municipality of Brotas.
Finally, as the modeling exercise of ES for ecotourism has proven to be an efficient environmental planning tool, this study also hopes to encourage other municipalities to assess their ecotourism capacity as well as to include this perspective in their planning processes.

Author Contributions

Conceptualization, J.V.R.G., A.A.T.G., J.A.d.L. and L.E.M.; funding acquisition, J.V.R.G.; methodology, J.V.R.G., J.A.d.L. and L.E.M.; supervision, L.E.M.; writing—original draft, J.V.R.G., A.A.T.G., J.A.d.L. and L.E.M.; Writing—review and editing, J.V.R.G., A.A.T.G. and L.E.M. All authors have read and agreed to the published version of the manuscript.

Funding

São Paulo Research Foundation (FAPESP), grant number 2016/19020-0, funded this research.

Conflicts of Interest

The authors declare no conflict of interest.

References

  1. Ab’saber, A. Os Domínios de Natureza no Brasil; Ateliê Editorial: São Paulo, Brazil, 2012. [Google Scholar]
  2. MEA, M.E.A. Ecosystems and Human Well-Being; World Health Organization: Geneva, Switzerland, 2005; Volume 1. [Google Scholar]
  3. Costanza, R.; de Groot, R.; Sutton, P.; van der Ploeg, S.; Anderson, S.J.; Kubiszewski, I.; Farber, S.; Turner, R.K. Changes in the global value of ecosystem services. Glob. Environ. Chang. 2014, 26, 152–158. [Google Scholar] [CrossRef]
  4. Costanza, R.; Arge, R.; de Groot, R.; Farberk, S.; Grasso, M.; Hannon, B.; Limburg, K.; Naeem, S.; O’Neill, R.V.; Paruelo, J.; et al. The value of the world’ s ecosystem services and natural capital. Nature 1997, 387, 253–260. [Google Scholar] [CrossRef]
  5. Englund, O.; Berndes, G.; Cederberg, C. How to analyse ecosystem services in landscapes—A systematic review. Ecol. Indic. 2017, 73, 492–504. [Google Scholar] [CrossRef]
  6. Parron, L.M.; Fidalgo, E.C.C.; Luz, A.P.; Campanha, M.M.; Turetta, A.P.D.; Pedreira, B.C.C.G.; Prado, R.B. Research on ecosystem services in Brazil: A systematic review. Rev. Ambient. Agua 2019, 14, 445–458. [Google Scholar] [CrossRef]
  7. Hasan, S.S.; Zhen, L.; Miah, M.G.; Ahamed, T.; Samie, A. Impact of Land Use Change on Ecosystem Services: A Review; Elsevier: Amsterdam, The Netherlands, 2020; ISBN 8801920156. [Google Scholar]
  8. Baveye, P.C.; Baveye, J.; Gowdy, J. Soil “ecosystem” services and natural capital: Critical appraisal of research on uncertain ground. Front. Environ. Sci. 2016, 4, 1–49. [Google Scholar] [CrossRef]
  9. Butchart, S.H.M.; Collen, B.; Van Strien, A.; Nat, C.; Bruno, J.; Chanson, J.; Galloway, J.N.; Genovesi, P. Global Biodiversity: Indicators of Recent Declines. Science 2010, 328, 1164–1168. [Google Scholar] [CrossRef]
  10. de Oliveira, T.E.; de Freitas, D.S.; Gianezini, M.; Ruviaro, C.F.; Zago, D.; Mércio, T.Z.; Dias, E.A.; do Nascimento Lampert, V.; Barcellos, J.O.J. Agricultural land use change in the Brazilian Pampa Biome: The reduction of natural grasslands. Land Use Policy 2017, 63, 394–400. [Google Scholar] [CrossRef]
  11. Garrett, R.D.; Koh, I.; Lambin, E.F.; le Polain de Waroux, Y.; Kastens, J.H.; Brown, J.C. Intensification in agriculture-forest frontiers: Land use responses to development and conservation policies in Brazil. Glob. Environ. Chang. 2018, 53, 233–243. [Google Scholar] [CrossRef]
  12. Schielein, J.; Börner, J. Recent transformations of land-use and land-cover dynamics across different deforestation frontiers in the Brazilian Amazon. Land Use Policy 2018, 76, 81–94. [Google Scholar] [CrossRef]
  13. Marchese, D.; Reynolds, E.; Bates, M.E.; Morgan, H.; Clark, S.S.; Linkov, I. Resilience and sustainability: Similarities and differences in environmental management applications. Sci. Total Environ. 2018, 613–614, 1275–1283. [Google Scholar] [CrossRef]
  14. Walker, B.; Hooling, C.S.; Carpenter, S.; Kinzig, A. Resilience, Adaptability and Transformability in Social-Ecological Systems. Ecol. Soc. 2004, 9. [Google Scholar] [CrossRef]
  15. Cumming, G.S.; Olsson, P.; Holling, C.S. Resilience, experimentation, and scale mismatches in social-ecological landscapes. Landsc. Ecol. 2013, 1139–1150. [Google Scholar] [CrossRef]
  16. Baral, N. Evaluation and resilience of ecotourism in the Annapurna Conservation Area, Nepal. Environ. Conserv. 2014, 41, 84–92. [Google Scholar] [CrossRef]
  17. Choi, Y.E.; Song, K.; Kim, M.; Lee, J. Transformation planning for resilientwildlife habitats in ecotourism systems. Sustainability 2017, 9, 487. [Google Scholar] [CrossRef] [Green Version]
  18. Sgroi, F. Forest resources and sustainable tourism, a combination for the resilience of the landscape and development of mountain areas. Sci. Total Environ. 2020, 736, 139539. [Google Scholar] [CrossRef] [PubMed]
  19. Fonseca, J.M.A.A.; de Melo, S.M.C.; de Carvalho, W.G. O Ecoturismo como alternativa sustentável para gestão da RPPN Catedral do Jalapão (TO). Rev. Bras. Ecotur. 2018, 11, 9–31. [Google Scholar] [CrossRef]
  20. Mondino, E.; Beery, T. Ecotourism as a learning tool for sustainable development. The case of Monviso Transboundary Biosphere Reserve, Italy. J. Ecotourism 2019, 18, 107–121. [Google Scholar] [CrossRef]
  21. Salemi, M.; Jozi, S.A.; Malmasi, S.; Rezaian, S. Conceptual framework for evaluation of ecotourism carrying capacity for sustainable development of Karkheh protected area, Iran. Int. J. Sustain. Dev. World Ecol. 2019, 26, 354–366. [Google Scholar] [CrossRef]
  22. Brazilian Government. Ecoturismo: Orientações Básicas; Ministério doTurismo: Brasília, Brazil, 2010; ISBN 9788575223857.
  23. de Groot, R.S.; Alkemade, R.; Braat, L.; Hein, L.; Willemen, L. Challenges in integrating the concept of ecosystem services and values in landscape planning, management and decision making. Ecol. Complex. 2010, 7, 260–272. [Google Scholar] [CrossRef]
  24. Çetinkaya, C.; Kabak, M.; Erbas, M.; Özceylan, E. Evaluation of ecotourism sites: A GIS-based multi-criteria decision analysis. Kybernetes 2018. [Google Scholar] [CrossRef]
  25. Aliani, H.; BabaieKafaky, S.; Saffari, A.; Monavari, S.M. Land evaluation for ecotourism development—An integrated approach based on FUZZY, WLC, and ANP methods. Int. J. Environ. Sci. Technol. 2017, 14. [Google Scholar] [CrossRef]
  26. Kertész, Á.; Nagy, L.A.; Balázs, B. Land Use Policy Effect of land use change on ecosystem services in Lake Balaton Catchment. Land Use Policy 2019, 80, 430–438. [Google Scholar] [CrossRef]
  27. Paramati, S.R.; Alam, S.; Chen, C. The Effects of Tourism on Economic Growth and CO2 Emissions: A Comparison between Developed and Developing Economies. J. Travel Res. 2016. [Google Scholar] [CrossRef] [Green Version]
  28. Paudyal, K.; Baral, H.; Bhandari, S.P.; Bhandari, A.; Keenan, R.J. Spatial assessment of the impact of land use and land cover change on supply of ecosystem services in Phewa watershed, Nepal. Ecosyst. Serv. 2019, 36, 100895. [Google Scholar] [CrossRef]
  29. Gigović, L.; Pamučar, D.; Lukić, D.; Marković, S. GIS-Fuzzy DEMATEL MCDA model for the evaluation of the sites for ecotourism development: A case study of “Dunavski ključ” region, Serbia. Land Use Policy 2016, 58, 348–365. [Google Scholar] [CrossRef]
  30. Jeong, J.S.; García-Moruno, L.; Hernández-Blanco, J.; Jaraíz-Cabanillas, F.J. An operational method to supporting siting decisions for sustainable rural second home planning in ecotourism sites. Land Use Policy 2014, 41, 550–560. [Google Scholar] [CrossRef]
  31. Bunruamkaew, K.; Murayama, Y. Site Suitability Evaluation for Ecotourism Using GIS & AHP: A Case Study of Surat Thani Province, Thailand. Procedia Soc. Behav. Sci. 2011, 21, 269–278. [Google Scholar] [CrossRef] [Green Version]
  32. Sturiale, L.; Scuderi, A.; Timpanaro, G.; Matarazzo, B. Sustainable use and conservation of the environmental resources of the etna park (unesco heritage): Evaluation model supporting sustainable local development strategies. Sustainability 2020, 12, 1453. [Google Scholar] [CrossRef] [Green Version]
  33. Sahani, N. Assessment of ecotourism potentiality in GHNPCA, Himachal Pradesh, India, using remote sensing, GIS. Asia-Pac. J. Reg. Sci. 2019, 3. [Google Scholar] [CrossRef]
  34. Nahuelhual, L.; Carmona, A.; Lozada, P.; Jaramillo, A.; Aguayo, M. Mapping recreation and ecotourism as a cultural ecosystem service: An application at the local level in Southern Chile. Appl. Geogr. 2013, 40, 71–82. [Google Scholar] [CrossRef]
  35. Thompson, B.S.; Friess, D.A. Stakeholder preferences for payments for ecosystem services (PES) versus other environmental management approaches for mangrove forests. J. Environ. Manag. 2019, 233, 636–648. [Google Scholar] [CrossRef]
  36. Bocco, G.; Mendoza, M.; Velazquez, A. Remote sensing and GIS-based regional geomorphological mapping—A tool for land use planning in developing countries. Geomorphology 2001, 39, 211–219. [Google Scholar] [CrossRef]
  37. Kosmus, M.; Renner, I.; Ullrich, S. Integração de Serviços Ecossistêmicos ao Planejamento do Desenvolvimento. 2012. Available online: http://www.aboutvalues.net/es/data/six_steps/integr_ecosys_serv_in_dev_planning_pt.pdf (accessed on 5 May 2020).
  38. de Cruz, R.C.A. Políticas públicas de turismo no Brasil: Território usado, território negligenciado. Geosul 2005, 20, 27–43. [Google Scholar]
  39. RepórterBrasil Por Trás do Alimento: Você Bebe Agrotóxicos? Available online: https://portrasdoalimento.info/agrotoxico-na-agua/ (accessed on 5 May 2020).
  40. de Moraes, C.C.M.; Santana, M.S.; Simões, P.M.L.; da Conceição, R.A.C.; da Silva, S.F. Carta de Suscetibilidade a Movimentos Gravitacionais de Massa e Inundação: Município de Brotas, SP; CPRM: Brasília, Brazil, 2020. [Google Scholar]
  41. Mezzalira, S. Lexico Estratigrãfico do Estado de Sao Paulo; Geological Institute: São Paulo, Brazil, 1981. [Google Scholar]
  42. Guerrero, J.V.R.; Moschini, L.E.; De Lollo, J.A.; de Melo, N.A.T. Mapeamento da Aptidão ao Ecoturismo Como Instrumento de Planejamento Territorial Sustentável: Estudo de Caso no Município de Brotas, sp. ACTA Geogr. 2018, 12, 143–155. [Google Scholar]
  43. Peixoto, C.A.B. Geodiversidade do Estado de São Paulo, 1st ed.; CPRM: São Paulo, Brazil, 2010.
  44. Brotas Informações Municipais. Available online: https://brotas.sp.gov.br/ (accessed on 22 April 2018).
  45. de Salis, S.M. Composiçxo Florística e Estrutura de um Remanescente de Mata Ciliar do Rio Jacaré-Pepira, Brotas, sp. 1990. Available online: https://ainfo.cnptia.embrapa.br/digital/bitstream/item/181075/1/Suzana-Salis.pdf (accessed on 5 May 2020).
  46. EMBRAPA Classificação Climática de Koppen. Available online: https://www.cnpf.embrapa.br/pesquisa/efb/clima.htm (accessed on 22 July 2017).
  47. Martins, R.C.; Madureira, G.A. Do “buraco” ao atrativo turístico: Uma sociologia da ressignificação do rural. Rev. Econ. Sociol. Rural 2019, 57, 326–338. [Google Scholar] [CrossRef] [Green Version]
  48. Pereira, M.F.V.; Gonçalves, A.R. O Ecoturismo em Brotas-Sp: Ação Pública e Privada na Produção da Localidade Turística. Geografia 2004, 29, 159–167. [Google Scholar]
  49. Valeriano, M.D.M. Topodata: Guia Para Utilização De Dados; IINPE: São José dos Campos, Brazil, 2008. [Google Scholar]
  50. Brazil. Decreto N° 89.817 de 20 de Junho de 1984: Normas Técnicas da Cartografia Nacional; Diario Oficial da União: Brasília, Brazil, 1984. [Google Scholar]
  51. Malczewski, J.; Rinner, C. Multicriteria Decision Analysis in Geographic Information Science; Springer: New York, NY, USA, 2015. [Google Scholar]
  52. Brotas, P.M. Inventário Turístico Municipal de Brotas; Brotas Municipal Government: Brotas, Brazil, 2018.
  53. IAC. Levantamento Pedológico Semi-Detalhado do Estado de São Paulo—Quadrícula de Brotas. SF.22-Z-B-III-4; IAC: Campinas, Brazil, 1981. [Google Scholar]
  54. Francisca, F.; Rovani, M.; Cassol, R. CARTOGRAFIA TEMÁTICA: Uma contribuição na análise geográfica do município de Barão de Cotegipe/RS THEMATIC MAPPING: A contribution to the geographical analysis of the municipality of Barão de Cotegipe/RS CARTOGRAFÍA TEMÁTICA: Una contribución al an. Ateliê Geogr. 2012, 6, 33–54. [Google Scholar]
  55. Kainz, W. Fuzzy Logic and GIS, 1st ed.; University of Vienna: Viena, Austria, 2007. [Google Scholar]
  56. Cereda Junior, A. Análise De Fragilidade Ambiental Com Métodos Multicritério—Críticas E Proposta Metodológica; Universidade Federal de São Carlos: São Carlos, Brazil, 2011. [Google Scholar]
  57. Zadeh, L.A. Fuzzy Sets. Inf. Control 1965, 8, 338–353. [Google Scholar] [CrossRef] [Green Version]
  58. Burrough, P.A.; McDonnel, R.A. Principles of Geographical Information Systems; Oxford University Press: New York, NY, USA, 1998. [Google Scholar]
  59. Ferreira, M.C. Iniciação à Análise Geoespacial: Teoria, Técnicas e Exemplos para Geoprocessamento; Editora Unesp: São Paulo, Brazil, 2014. [Google Scholar]
  60. Saaty, T.L. The Analytical Hierarchy Process; Mc Graw Hill International: New York, NY, USA, 1980. [Google Scholar]
  61. Moreira, F.R.; Barbosa, C.; Câmara, G.; Filho, R.A. Inferência Geográfica e suporte à decisão. In Introdução à Ciência da Geoinformação; Câmara, G., Ed.; INPE: São José dos Campos, Brazil, 2001. [Google Scholar]
  62. Fox, T.; Rohweder, J.; Hlavacek, E.; Dieck, J. Decision Support Systems. Available online: https://www.usgs.gov/centers/umesc/science/decision-support-systems?qt-science_center_objects=0#qt-science_center_objects (accessed on 28 May 2020).
  63. Cereda, A., Jr.; Röhm, S. Proposal and Analysis of Environmental Fragility Model Using Multicriteria Analysis and Fuzzy Logic for Integrated Landscape Mapping. J. Urban Environ. Eng. 2014, 8, 28–37. [Google Scholar] [CrossRef]
  64. Silva, K.B.; Mattos, J.B. A spatial approach for the management of groundwater quality in tourist destinations. Tour. Manag. 2020, 79, 104079. [Google Scholar] [CrossRef]
  65. Fazito, M.; Scott, M.; Russell, P. The dynamics of tourism discourses and policy in Brazil. Ann. Tour. Res. 2016, 57, 1–17. [Google Scholar] [CrossRef]
  66. MapBiomas Coleção 4 da Série Anual de Mapas de Cobertura e Uso de Solo do Brasil. Available online: https://mapbiomas.org/ (accessed on 22 January 2020).
  67. De Andrade, N.S.F.; Filho, M.V.M.; Torres, J.L.R.; Pereira, G.T.; Júnior, J.M. Impacto Técnico e Econômico das Perdas de Solo e Nutrientes por Erosão no Cultivo da Cana-de-Açúcar. Eng. Agric. 2011, 31, 539–550. [Google Scholar] [CrossRef]
  68. Corrêa, E.A.; Moraes, I.C.; Lupinacci, C.M.; de Geomorfologia, R.B. Influência do Cultivo de Cana-de-Açúcar Nas Perdas de Solo por Erosão Hídrica em Cambissolos no Estado de São Paulo. Rev. Bras. Geomorfol. 2018, 19, 150–175. [Google Scholar] [CrossRef] [Green Version]
  69. Ronquim, C.C. Queimada na Colheita da Cana-de-Açúcar: Impactos Ambientais; Sociais e Econômicos: Campinas, Brazil, 2010. [Google Scholar]
  70. Guerrero, J.V.R.; De Lollo, J.A.; Lorandi, R. Cartografia Geoambiental Como Base para Planejamento Territorial na Bacia do rio Clarinho, sp. Rev. Bras. Cartogr. 2016, 68, 313–326. [Google Scholar]
  71. De Lollo, J.A.; Guerrero, J.V.R.; Abe, A.C.P.; Lorandi, R. IAEG/AEG Annual Meeting Proceedings, San Francisco, California; Springer International Publishing: Berlin, Germany, 2019. [Google Scholar]
  72. Brasil. Law 12.651/2012—Dispõe Sobre a Proteção da Vegetação Nativa; Diário Oficial da União: Brasília, Brazil, 2012. [Google Scholar]
  73. Schäffer, W.B.; Rosa, M.R.; de Aquino, L.C.S.; de Medeiros, J.D. Áreas de Preservação Permanente e Unidades de Conservação & Áreas de Risco. O que uma Coisa tem a ver Com a Outra? Relatório de Inspeção da Área Atingida Pela Tragédia das Chuvas na Região Serrana do Rio de Janeiro; MMA: Brasília, Brazil, 2011. [Google Scholar]
  74. Nunes, S.; Gastauer, M.; Cavalcante, R.B.L.; Ramos, S.J.; Caldeira, C.F.; Silva, D.; Rodrigues, R.R.; Salomão, R.; Oliveira, M.; Souza-Filho, P.W.M.; et al. Challenges and opportunities for large-scale reforestation in the Eastern Amazon using native species. For. Ecol. Manag. 2020, 466, 118120. [Google Scholar] [CrossRef]
  75. Ota, L.; Herbohn, J.; Gregorio, N.; Harrison, S. Reforestation and smallholder livelihoods in the humid tropics. Land Use Policy 2020, 92, 104455. [Google Scholar] [CrossRef]
  76. Ruprecht, J.; Sparks, T.; Liu, N.; Dell, B.; Harper, R. Using reforestation to reverse salinisation in a large watershed. J. Hydrol. 2019, 577, 123976. [Google Scholar] [CrossRef]
  77. Machado, R.A.S.; Oliveira, A.G.; Lois-González, R.C. Urban ecological infrastructure: The importance of vegetation cover in the control of floods and landslides in Salvador/Bahia, Brazil. Land Use Policy 2019, 89, 104180. [Google Scholar] [CrossRef]
  78. Absy, M.L. Avaliação de Impacto Ambiental: Agentes Sociais, Procedimentos e Ferramentas; IBAMA: Brasíia, Brazil, 1995.
  79. TerritorioSelvagem EcoParque Jacaré. Available online: https://www.territorioselvagem.com.br/atividades/eco-parque-jacare/ (accessed on 5 May 2020).
  80. de Azevedo, R.M.M.; Lopes, R.M.R.; Gonçalves, S. Resignificação do rural e sua relação com o urbano: O turismo como expressão de novas possibilidades. Rev. Bras. Ecotur. 2013, 6, 824–835. [Google Scholar] [CrossRef]
  81. Layrargues, P.P. A função social do ecoturismo. Bol. Técnico Senac 2004, 30, 38–45. [Google Scholar] [CrossRef]
  82. Padilha, A.C.M.; Azevedo, J.B.; Wittmann, M.L.; Docena, L.T.; De Mattos Fagundes, P. Turismo rural e recursos hídricos no município de Carazinho (RS): Um estudo empírico identificando oportunidades e desafios. Rev. Bras. Ecotur. 2015, 8, 74–92. [Google Scholar] [CrossRef]
  83. Santana, E.L.; Santos, J.C.V. Lago de São Simão e o desenvolvimento do turismo rural: Uma nova atividade econômica sustentada pelo trabalho familiar. Rev. Bras. Ecotur. 2016, 9, 668–683. [Google Scholar] [CrossRef]
  84. Cunha, A.M. Turismo rural de base comunitária em Santo Antônio da Patrulha (RS). Rev. Bras. Ecotur. 2014, 7, 750–761. [Google Scholar] [CrossRef]
  85. BrotasOnline Saltos Park. Available online: http://brotasonline.com.br (accessed on 5 May 2020).
  86. MarinaBroa Broa em Fotos. Available online: http://marinabroa.com.br/conheca-a-represa-do-broa/ (accessed on 5 May 2020).
  87. Ribeiro, O.C.F.; Amaral, S.C.F. Entre o lazer esportivo participativo e ambiental e o lazer turístico—As políticas públicas de lazer em Brotas/SP. Mov. Rev. Esc. Educ. Física UFRGS 2016, 1, 63–74. [Google Scholar] [CrossRef] [Green Version]
  88. Budeanu, A.; Miller, G.; Moscardo, G.; Ooi, C.S. Sustainable tourism, progress, challenges and opportunities: An introduction. J. Clean. Prod. 2016, 111, 285–294. [Google Scholar] [CrossRef]
  89. Rainero, C.; Modarelli, G. The attractive power of rural destinations and a synergistic community cooperative approach: A “tourismability” case. Sustainability 2020, 12, 7233. [Google Scholar] [CrossRef]
  90. Cheer, J.M.; Lew, A. Understanding tourism resilience: Adapting to social, political, and economic change. In Tourism, Resilience, and Sustainability: Adapting to Social, Political and Economic Change; Cheer, J.M., Lew, A., Eds.; Routledge: Abingdon, UK, 2017. [Google Scholar]
  91. MMA Zoneamento Ambiental Municipal. Available online: https://www.mma.gov.br/cidades-sustentaveis/planejamento-ambiental-e-territorial-urbano/itemlist/category/62-planejamento-ambiental-urbano.html (accessed on 20 August 2020).
Figure 1. Study area with land use types. Source: authors (2020).
Sustainability 12 10345 g001
Figure 2. A workflow that demonstrates the methodological structure of the study. Source: authors (2020).
Sustainability 12 10345 g002
Figure 3. Relative importance percentages for each parameter of the model.
Sustainability 12 10345 g003
Figure 4. Geospatial parameters used in the model. Normalized to fuzzy inference values. Source: authors (2020).
Sustainability 12 10345 g004
Figure 5. Ecotourism Ecosystem Services Potential Zones Chart. Source: authors (2020).
Sustainability 12 10345 g005
Figure 6. Percentages occupied by each zone for potential ecotourism ecosystem services (ES). Source: authors (2020).
Sustainability 12 10345 g006
Figure 7. Potential zone for ES in the Brotas municipality. Source: authors (2020).
Sustainability 12 10345 g007
Figure 8. (a) Moderate zone for ES in the Brotas municipality. Map Source: authors (2020) and (b) São Sebastião Waterfall. Image source: [79].
Sustainability 12 10345 g008
Figure 9. (a) Zone 3—High ES potential in the Brotas municipality, map source: authors (2020); (b) Areia que Canta spring, source: Vaca Nautica Brotas (2020); and (c) Saltos Park, source: [85].
Sustainability 12 10345 g009
Figure 10. (a) Zone 4—Very High ES potential in the Brotas municipality, map source: authors (2020); (b) Broa Dam, source: [86]; and (c) Jacaré Waterfall; Source: [79].
Sustainability 12 10345 g010
Table 1. Data used in the study.
GroupDataSourceYearScale
GeoenvironmentalGeologyIG/SMA20141:75,000
SoilsIAC19811:50,000
GeodiversityCPRM2015Descriptive data
ReliefCPRM20201:100,000
TopographicALOS/PALSAR DEMJAX201112.5 m pixel
SocioeconomicUrban areasCPRM20201:50,000
Land UseMapBiomas20181:50,000
Roads/RailwaysBIT/IM20181:50,000
Tourist attractionsBROTAS20181:50,000
Table 2. Groups of parameters, parameters used, justifications for the assignment of weights to each parameter and its references.
GroupParameterJustification of Weight AssignmentReferences
Geological UnitsThe assignment of weights for the geology parameter occurred with the aid of the spatial correlation analysis between ecotourism activities and the characterization of São Paulo State Geodiversity (CPRM). We analyzed the characteristics of rocks, their potential fragility, the landscape complexity and the evolution of the model to identify their favorability to produce ecotourism potential.[43,44]
SoilsAs a superficial attribute, of direct interaction with anthropic activities, we evaluated (from the characteristics of texture, composition, derived rock, and maturity) its vulnerability to the implementation of ecotourism infrastructures.[53])
ReliefThe area relief directly reflects its geological characteristics and external interactions. Thus, weights were assigned based on the characterization of São Paulo State Geodiversity and on the analysis of how the modeled feature can offer greater propensity to recreational ecosystem services.[43]
Distance from water bodiesWe analyzed whether the water bodies in the study area are essential to ecotourism, since the municipality offers several ecotourism attractions related to rivers, such as rafting, buoy cross, canoeing, etc.[44]
Slope As for slopes, we considered that flatter areas are more favorable due to their accessibility. However, the highest slopes were also evaluated as favorable because they produce topographic conditions for the presence of waterfalls and scenic beauty.authors
AspectThe Aspect data spatially showed the places with the highest solar incidence in the landscape, directly regulating local microclimates. In the case of the study area, the areas directed to the north are the ones with greater solar insolation thus providing the best conditions for local ecotourism.[54]
ElevationWe considered that the highest elevations reflect the possibility of scenic beauty and greater visibility to contemplate the local landscape.[42]
Land UseLand use reflects the degree of local anthropization. Thus, we considered that the higher the level of landscape naturalness, the greater the propensity to provide ecosystem services related to ecotourism.authors
Distance from RoadsThe distance to the transport routes represents, for this study, the ease of access to ecotourism activities. Thus, the closer to the access roads, the greater the assigned value. We also considered the proximity to the railways, which can be integrated into the ecotourism model.authors
Distance from negative factorsThese are all factors that put ecotourism activity at risk, such as urbanization and highly degraded agricultural areas. Thus, the further away from these areas, the greater the chance that an area will provide ecotourism ES. authors
Table 3. Attributes of each parameter and assigned values for geographic information system (GIS) modeling.
ParameterPotential for Ecotourism Ecosystem Services
Z1 LowZ2 ModerateZ3 HighZ4 Very High
Value1234
Geological UnitsAlluvium,
Colluvium
ItaqueriSerra GeralBotucatu, Pirambóia
Soil typeLithic Entisols,
Quartzipsamments Entisols, Entisols
Sandy Ultisols Red-Yellow Oxisols, Medium/Sandy UltisolsRed Oxisols, Red Nitisols
ReliefFlood Plains,
Erosive Edges
Colluvium/Alluvium Ramps, Lithostructural LevelsHills, Degraded Cliffs, Low Dissected PlateausPlateaus, Valleys, Inselbergs, Water Bodies
Distance from water bodies>500 m300–500 m150–300 m0–150 m
Land UseAgriculture, Forestry, Urban, Non-vegetated areasPastureGrasslandForest, Cerrado, Water
Distance from Roads>1500 m750–1500 m350–750 m<350 m
Distance from urban>1000 m500–1000 m300–500 m< 300m
AspectEast, WestSoutheast, SouthwestNorthwest, SouthNorth, Northeast
Slope25–35%15–25%3–15%0–3%; >35%
Elevation<550 m550–650 m650–750 m>750 m
Table 4. Relative importance values and description used in the analytic hierarchy process (AHP) model.
ValuesRelative Importance Description
1Equal importance: Both factors contribute equally to the objective
3Moderate importance: One factor is slightly more important than the other
5Essential importance. One factor is clearly more important than the other
7Demonstrated importance: One factor is strongly favored, and its greatest relevance has been demonstrated in practice
9Extreme importance: The evidence that separates the two factors is of the greatest possible order
2,4,6,8Intermediate values between judgments: Possibility of additional commitments
Table 5. AHP in pair interactions. DR = Distance to roads; DW= Distance to Water; DU= Distance to Urban.
ReliefSoilGeologyLand UseSlopeDWDRElevationAspectDU
Relief1335577799
Soil0.333113355799
Geology0.3330.113355579
Land Use0.20.3330.3331135557
Slope0.20.3330.3331133557
DW0.1430.20.20.3330.33313335
DR0.1430.20.20.20.3330.3331135
Elevation0.1430.1430.20.20.20.3330.1133
Aspect0.1110.1430.1430.20.20.3330.3330.33313
DU0.1110.1110.1110.1430.1430.20.20.3330.3331
Table 6. Relationship between geoenvironmental zones, areas (km2), number of tourist attractions and attraction index/km2.
ZoneArea (km2)Touristic AttractionsIndex Attractions/km2
1—Low7.200
2—Moderate193.05810.005
3—High862.49180.02
4—Very High38.868470.18
Publisher’s Note: MDPI stays neutral with regard to jurisdictional claims in published maps and institutional affiliations.

