Article

The Motivation for Incorporation of Microgrid Technology in Rooftop Solar Photovoltaic Deployment to Enhance Energy Economics

by
Mageswaran Rengasamy
1,*,
Sivasankar Gangatharan
1,
Rajvikram Madurai Elavarasan
2 and
Lucian Mihet-Popa
3,*
1
Department of Electrical and Electronics Engineering, Thiagarajar College of Engineering, Madurai, Tamil Nadu 625015, India
2
Clean and Resilient Energy Systems Laboratory, Texas A&M University, Galveston, TX 77553, USA
3
Electrical Engineering Department, Ostfold University College, No-1757, P.O. Box 700, 1757 Halden, Norway
*
Authors to whom correspondence should be addressed.
Sustainability 2020, 12(24), 10365; https://doi.org/10.3390/su122410365
Submission received: 20 November 2020 / Revised: 4 December 2020 / Accepted: 8 December 2020 / Published: 11 December 2020

Abstract

:
Deployment of rooftop solar Photovoltaic technology in domestic premises plays a significant role in accomplishing renewable energy transformation. The majority of domestic consumers still do not have a positive perception about adopting rooftop solar PV technology, due to its high capital cost and prolonged payback period. In this aspect, the proposed work identifies the factors causing energy deprivation in the present distribution and utilization system. To explicitly express the importance of the present work, an extensive case study based on an Indian scenario has been carried out to investigate where the losses occur in the existing distribution system and how the solar power and its storage system have been ineffectively utilized. The deep investigation has thrown light on several issues that lead to the performance deterioration of PV technology. Finally, in this work, a scheme to incorporate hybrid microgrid technology in the domestic distribution network has been proposed to effectively manage the distribution system and to efficiently utilize solar power and its storage systems. The real-time electricity tariff data have been taken for cost comparison and payback period calculations to prove the effectiveness of the proposed method. Crucial comparisons have been presented based on energy saving and carbon dioxide CO2 emission reduction strategies.

1. Introduction

The world as a whole is on a trajectory towards the exhaustion of fossil fuels [1]. When that unavoidable exhaustion has been accomplished, possibly around the end of this century, whatever electrical energy is consumed by the civilization must be derived from renewable resources, which means that the sophisticated electricity-on-demand to which we have been accustomed, will be lost [2]. Numerous researches have been accomplished in the field of renewable energy. Especially, research regarding renewable energy potential in a geographical location is much needed to promote renewable energy penetration [3,4,5]. For instance, studies such as [6,7] focusing on India’s renewable mix, renewable harnessing potential, political aspects are highly needed to drive the decisions towards renewables [8]. Apart from it, due to seasonal variations and intermittency characteristics of renewable energy, accurate predictions of various renewable energy resources are pivotal [9]. Distributed generation systems have been gaining importance and renewable energies are getting a bigger ratio within energy production [10,11,12,13]. This promoted the usage of renewable energy microgrid with supporting various hybrid energy configurations and energy storage systems [14,15]. When considering all the renewables, Solar PV has been considered to be a vital renewable source [16].

1.1. Solar Photovoltaic Deployment and the Related Work

A solar photovoltaic, also represented as solar PV, is a power generation system capable of converting the sun’s solar energy into usable electric power using photovoltaic cells. Solar PV panels are constructed by the integration of several solar cells. The large-scale solar PV deployment is done over the wide landscape, whereas the small scale deployment such as domestic, commercial, and official sectors is done by mounting the panels over the rooftop, which is known to be rooftop solar PV system (RTPV) [17]. Several investigations have been carried out to evaluate the performance of the RTPV [18,19]. Advanced PV estimation and evaluation strategies have been explored to accurately determine its potential [20,21]. Consecutively, economical aspects of PV deployment analysis are the recent focus area [22]. Modern operation and control strategies such as intelligent Maximum Power Point Tracking (MPPT) are employed to establish reliability [23,24].
From the literature, it can be inferred that energy saving of about 9–20% is attained when solar PV is employed for home appliances and it is also suggested that the saving will be increased to 14–25% if the excess power is stored in the battery for utilization [25,26]. Despite its numerous advantageous features, the majority of domestic consumers still do not show interest over installing a rooftop solar PV plant. As a foresight to deal with, an extensive investigation is required to explore the challenges and detrimental issues not only to promote the solar usage, but also to alleviate the deprivation in the technological implications for future sustainability.

1.2. Factors Limiting Solar PV Technology

An important factor influencing the performance of the renewable energy system (RES) is the battery storage system (BESS) charging Scheme. Renewable energy equipped microgrid energy management in a domestic distribution relies mostly on a BESS for handling interruption, short power outages, and voltage fluctuations. The deployment of batteries for solar PV applications is vital. The consistency of the battery performance and behavior for a long usage is dealt with in a previous study [27]. Nearly 13.1% of the total energy is consumed in the BESS charging of Uninterruptable Power Supply (UPS) through AC source [28,29]. The overall battery efficiency may vary between 41–80%, which includes direct energy losses, charge transportation, battery, and inverter [30].
The battery charge cycle balancing is crucial for maintaining its life [31]. Furthermore, ambiguity prevails about the impact of battery storage over greenhouse gas emissions. When the BESS is deployed in a conventional power supply system, it draws additional power in several aspects such as power loss due to multiple conversion processes and internal loss phenomena. It also paves the way for the increase in greenhouse gases, when driven by fossil fuel-based power supply systems [32]. Similarly, the presence of harmonics affects the performance of the grid-connected PV systems. The importance of reducing total harmonic distortion (THD) for the better harness of solar power is emphasized by [33]. In the work carried out previously [34], a solar PV prediction study has been carried out and it was reported that the solar PV system efficiency is affected, due to ohmic losses caused by inverter operation, system unavailability, and transformer losses. Similarly, inverter performance plays a major role in PV energy technology. An investigation has furnished that the solar PV inverter will operate efficiently when it is designed to operate at the maximum power point range and also exhibit high performance when loaded with its rated value. It states that efficiency gets lowered down to 50% when lightly loaded [35].
The recent research has achieved efficiency above 95% by using a silicon–carbide power transistor-based inverter [36]. These devices exhibit reduced loss and temperature and hence, improve the service life of the system. The highly efficient inverters are available, but their costs are very high which increases the capital investment cost of the installation. As a result, cost-effective inverters are widely used by the public, but their performances are questionable. Consecutively, the inefficient equipment, converter performance, and ineffective utilization process inevitably increase the energy consumption and result in prolong payback period.

1.2.1. Capital Investment and Payback Period

Decades back, the preference for solar plants for residential usage was very low. Before 2010, the growth of photovoltaic technology was very sluggish [37]. The main reason is that the capital investment for installation was huge and the payback period was about 12–15 years, but the lifetime of the solar panel was around 20–25 years. In some countries, the feed-in-tariff provision is not issued for residential consumers, and in such case, solar power is used for self-consumption and grid storage. Recently, the cost of the solar panel has been reduced considerably and the payback period is about 8–10 years [38]. Further, the payback period reduces with increasing generation capacity. However, the maintenance cost, repair charges, and, if any, inverter replacement, further lengthens the payback period. The public interprets that it may bring a loss in the investment. Therefore, the private utility, residential consumers, and commercial sectors showed reluctance towards the technology. Some of the critical factors influencing the payback period are highlighted as follows:
  • Energy policies
  • Efficiency of the ESS
  • Electricity pricing
  • Feed-in tariff
  • Solar panel degradation
  • Growth of domestic electricity consumption
  • Quality and performance of the load

1.2.2. Impact of High PV Penetration into the Distribution Network

Another important challenge that needs to be addressed is the impact of higher PV penetration into the distribution network. The solar plants installed in the residential premises are connected to the local distribution network. During excess generation, the power is fed to the network and it is highly intermittent and uncontrollable. Such solar power penetration imposes various stability issues on distribution functionality. The common issues are voltage fluctuation, voltage rise, unbalance, and harmonics [39]. The major problem is high variation in the voltage profile of the distribution feeder and it forces the voltage regulating devices to act more frequently. It causes quick ageing and weakens the system [40]. Hence, a crucial focus is required to find a solution to reduce the stress in the distribution network.

1.3. Overview of International Perspectives of Solar Energy Promotional Initiatives

Solar PV deployment is a unified global perspective in energy generation and electricity markets. The attempt is towards attaining a solar generation capacity to satisfy any conceivable future energy demands. Exploiting the solar energy as a long-term source and to sustain it in the electricity market is a big challenge. Many attractive policies and promotional initiation are accelerated to achieve the objective.

1.3.1. Solar PV Deployment—Global Scenario

Globally, the notion of solar PV deployment for self-consumption has been evolving significantly [41]. The significance of solar power generation localization has been reported in the literature [42], using the results obtained by field trials carried out in the United Kingdom. Rigorous initiatives have been taken by many countries to promote renewable and replace conventional power generation for reducing the detrimental effects caused by fossil fuel. The literature [43] has presented a case study about the European Union, in which it has been suggested that switching fossil fuel subsidies to solar would result in CO2 reduction from 1.8% to 2.2% by 2030. Further, the deployment of solar minimizes energy cost from the utility grid [44]. A comparative study of different economic zones and plant types has been presented [45] to exhibit the environmental efficiency of photovoltaic power plants in China. A case study has been presented [46] to emphasize the techno-economic feasibility assessment of grid-connected PV systems for residential buildings in Saudi Arabia. Similarly, in the literature [47], an extensive performance and economic evaluation of solar rooftop PV systems have been carried out for different regions in Thailand. Further improving the solar capacity improves the nation’s energy economics [48,49,50]. The statistics of average solar capacity and its energy cost of the countries that are leading solar power producers are depicted in Figure 1.

1.3.2. Energy Policies and Solar Market

Many countries have fixed targets to expand solar power generation capacity. To achieve the targets, many initiations have been taken to promote the technology. Various solar promotional policies, which include subsidies, incentives, and tax credits, have been announced. These policies play crucial roles in deciding the payback period of the region and attract more customers [51]. These encouraging energy policies have resulted in a reduced payback period of 6 to 10 years [52,53,54]. The United States have provided 30% of federal tax credit for promoting a residential solar energy system [55]. China has issued a series of incentive policies to achieve the targets [56].
The subsidy rates range from 0.05 to 0.55 Yuan/kWh (USD 0.0077–0.0846/kWh), and tax incentives have also been announced to expand the solar PV capacity [57]. India offers 30% of the installation cost for rooftop PV systems [58]. Japan has offered attractive subsidies for promoting solar PV technology. Similarly, many countries have incorporated several energy policies to improve solar generation capacity [59]. Germany has announced the incentive of 50 million Euros to promote solar-based BESS in the country and the subsidies cover 30% of the cost of energy storage systems [60]. Similarly, Italy has provided an incentive for residential PV-based storage [61]. European countries have taken a lot of initiatives to promote solar systems by implementing convincing renewable energy policy and investment [62].
In China, after the amendment of promotional policies, the solar capacity reached a high record of 2.5 gigawatts (GW) in 2011, accounting for 9.12% of the world total in the year and bringing China’s cumulative capacity to 3.3 GW, representing 4.95% of the global cumulative installed capacity during 2011. Then, the growth was tremendous and now China is leading the world in solar power capacity [63]. The US executed promotional policies during 2010 and now has added 5000 MW of renewable generating capacity by subsidization [64]. On June 18, 2012, Japan’s government announced enacting subsidies and a feed-in tariff of 42 Yen/kWh to encourage the solar market. As a result during 2013, the solar capacity of Japan was increased from 6632 MW to 13599 MW [65].

1.3.3. Subsidy Slash and Its Impact

Over and after great promotion initiatives taken in many possible ways, the solar generation capacity has reached a significant development. However, the countries have realized that prolonged subsidies would cause several other economic activities of the country such as significant raise in tax, amplify economical inflation, affect investment in other sectors, and curtail in the new development plan. Consequently, in recent years, many countries have planned to reduce subsidies and incentives. Some countries have lowered the subsidy rates and few have stopped subsidization. As a result, the solar installation growth rate has started facing a decline. The United States has reduced the tax credit for solar and the solar growth rate faces a setback [66]. On 31 May 2018, China’s National Energy Administration (NEA) ceased the approval of new subsidized projects and hence, witnessed a drop of 45% in solar installation target in the year 2019 [64]. As a result of these curtailment actions, the solar installation rate faces decline and there exists a strong discontent and disagreement among the consumers and utilities.

1.4. Inferences Drawn from Existing Technologies

After the conduction of extensive studies on existing solar energy technology and through the knowledge gained from the existing literature with regards to international scenarios, it has been inferred that the redundant conversion process and the loss in the energy conversion equipment limit the performance of the solar PV technology. Further, the harmonics generated by the equipment affect the reliability of the power system. Besides, high PV penetration causes several stability issues. Further, with a lot of subsidization initiatives, the world solar potential has reached a total capacity of 637–653 GW by the end of 2019. Only these subsidies, incentives, and energy policies have driven this magnificent achievement. The promotional policies and subsidization-based development provide merely provisional support to solar growth, but for future sustainability and growth, the focus is required on effective technological enhancement and energy management.

1.5. Importance of the Proposed Work

In the current distribution scenario, another remarkable change is noticeable from the consumer’s point of view in terms of an increase in the use of DC operated equipment [67]. The LED lighting has been getting significant, due to its low power, high luminance, and cost-effectiveness. Many electrical components in a household are already working on DC. Within the next 20 years, we could see that as much as 50% of the total loads may be made up of DC consumption. In the present technology, all these DC appliances need rectifiers and power factor correction (PFC) circuits before they can be connected to the AC electricity grid. Over a wide range, the efficiencies of these converters vary. Therefore, it is not always clear for a user how much energy is lost in the conversion process when a certain appliance is used [68]. A DC generating solar PV panel deployed in the AC distribution network also resurfaces the issues of conversion losses. Any energy conservation initiatives go in vain due to the redundant conversion process in the present scheme of power distribution.
A case study has been carried out to investigate where the losses occur in the existing distribution system and how solar power is ineffectively utilized. AC power distribution system is widely used by many countries. Hence, the AC domestic distribution system in India has been investigated in the case study. The findings from the case study will reflect the global scenario and the inference drawn from the investigation will be crucial in the process of solar PV technological enhancement. Consequently, it has been foresighted to develop an energy management scheme to effectively utilize the available renewable power by managing its constraints.
In this aspect, the present research work has been proposed to accomplish the following:
  • Carry out a qualitative and quantitative investigation to identify the shortfall in the BESS and solar PV schemes connected to the existing distribution system using a real-time case study.
  • Support domestic rooftop solar PV technology and BESS beyond subsidies by incorporating hybrid AC/DC microgrid technology in the distribution network.
  • Imply effective energy management to increase self-sufficiency, and to reduce the pressure on the distribution network by reducing frequent power penetration.
  • Demonstrate the effectiveness of the microgrid technology, by presenting a crucial comparative analysis based on energy-saving potential and CO2 emission reduction possibilities.
To accomplish the proposed investigations, the entire discussion has been framed into five schemes of the distribution system including the proposed system as the fifth scheme and a comprehensive representation of the investigation is shown in Figure 2.
The schemes taken for investigation and analysis are as follows:
  • Scheme 1: Conventional utility distribution system
  • Scheme 2: Utility distribution system with battery backup
  • Scheme 3: Direct utility-grid tied PV system
  • Scheme 4: Utility supported stand-alone PV system
  • Scheme 5: Proposed PV based hybrid AC/DC microgrid system
The Indian government has been taking a lot of initiatives in promoting the rooftop solar PV installation on the premises of domestic consumers, for decades. However, the consumers are not ready to adopt the solar PV power scheme. The major reasons are that the initial capital cost of the solar PV system is fairly high and the related energy storage is expensive. Besides, the payback period is very long, and the periodic maintenance cost worsens the situation further. The other issues such as wear and tear and life span of the panel make this technology unattractive. However, the Indian government has come forward to offer a subsidy for solar installation to promote renewable energy in the domestic area. Even then, the solar technology could not gain importance among the public.
Scheme 1 deals with the power consumption and tariff details of the existing conventional utility distribution system. Scheme 2 is a configuration with a battery backup facility. A battery with an AC/DC converter is used for powering the emergency loads, during power outages. Schemes 3 and 4 use solar PV technology and the contribution of solar energy in the distribution system and the respective tariff reduction are analyzed. There are two configurations of solar PV installation commonly used. They are:
  • Direct utility-grid tied PV system.
  • Utility supported stand-alone PV system.
The investigation of the direct utility-grid tied PV system is discussed in Scheme 3 and the utility supported stand-alone PV system is elaborated in Scheme 4. The proposed hybrid microgrid based distribution system is narrated in Scheme 5.

2. Case Study on Conventional Distribution Schemes in India

The solar PV potential disparity, due to climatic variation, is one of the prime factors [69]; but, in a country like India where adequate sunshine is available throughout the year, the solar energy conversion system is a successful and reliable power source. In an average of about 300 clear sunny days in a year, India’s theoretically calculated solar energy incidence on its land area alone is about 5000 trillion kilowatt-hours (kWh) per year (or 5 EWh/year). Hence, an efficient solar energy conversion system will be a powerful source of electricity as that of conventional power resources. Further, the installation is a simple process, and it can be installed even at any remote location with good sunlight [70]. Excessive conversion loss, inefficient equipment, and inappropriate utilization are the major factors that have defamed solar PV technology. To explore these impedimental factors, an energy survey has been carried out in the existing distribution system with various solar PV connection configuration governed by Tamil Nadu Generation and Distribution Corporation (TANGEDCO), the electricity authority of Tamil Nadu state government, India.
The payback period of the present conventional solar PV configuration is not appraisable and it is one of the important factors which cause a setback for renewable power opportunities in India. Consequently, a qualitative and quantitative analysis over energy consumption and cost of consumption is required to address the issue and to enhance the system. To accomplish this, trends in average electricity prices, solar PV degradation factors, and the growth of domestic electricity consumption are included in the analysis. The analysis has been elucidated with graphical representations and tabulated illustrations as follows:
Trends in average electricity price
Several factors influence the price of energy, and it includes supply, demand, weather conditions, global market, import and export, government regulation and policy, and financial speculation. These factors influence the increase in electricity price every year. For India, the average rate of increase in the cost of supply is 8.3% per annum [71]. The subsidy policies have induced tremendous growth in solar installation. In India, a 30% subsidy amount is provided for the installation cost [72], and it is depicted in Table 1. The highly appreciable payback period is obtained by subsidization.
Solar PV Degradation
The solar panel degrades over the period and the causes are environmental conditions, weather, dust, material quality, and power disturbances. According to the characteristics, solar panel performance declines by an average of 0.8% to 0.9% each year [73]. The first-year degradation would be 2% and it degrades at 0.8% every year thereafter. The degradation chart is shown in Figure 3.
Growth of domestic electricity consumption
The growth of domestic electricity consumption has to be taken into account while calculating the payback period. The increasing demand of the domestic consumer is observed to be 8.01% during 2013–2019, which is included in the payback calculation [74] and the growth rate details are shown in Figure 4.

2.1. Scheme 1: Conventional Utility Distribution System

This scheme describes a conventional utility distribution system commonly under practice. The consumers are connected to 230 V, single-phase, 50 Hz AC supply terminals. Almost all the appliances in India have been designed to operate with these specifications. DC appliances such as electronic gadgets, TV, computers, etc., are also made compatible with this condition by inbuilt AC–DC converters. However, these loads inject enormous harmonics into the power distribution network and pollute them vigorously. The presence of current Total Harmonic Distortion (THD) in the distribution power line has been recorded using a power quality analyzer and the images are shown in Figure 5.
The Tamil Nadu Generation and Distribution Corporation (TANGEDCO) will formulate the tariff concerning government policy [75], and the tariff charge description by the Tamil Nadu electricity board is presented in Table 2.
A residential bimonthly tariff has been taken for analysis from TANGEDCO online database through individual login credentials. It is shown in Table 3, and the tariff is represented on a bi-monthly basis in Table 4. The tariff hike will be furnished by the state government according to energy policy and economy. In this proposed work, a tariff hike of 8.3% per year has been considered based on past tariff rates for payback period calculation [69].

2.2. Scheme 2: Utility Distribution System with Battery Backup

Scheme 2, shown in Figure 6, is a configuration with a battery backup facility. An inverter is included for utilizing the battery power. This configuration with a battery backup facility has been widely preferred and found to be common among domestic consumers. Battery backup is very much essential to manage the deficit in power, because the suburban and rural areas undergo frequent power cuts during peak hours. Besides, in some parts of the country, the state electricity board will announce a complete power shut down for 9 h (9.00 AM to 6.00 PM) monthly once or twice with prior notice for new installation and scheduled maintenance work.
This scheme describes the configuration with the battery and inverter setup. The inverter losses and battery efficiency play vital roles in deciding the performance of this scheme.
The efficiency of the battery is expressed using Equation (1)
η b a t = W b a t . d i s W b a t . c h g × 100 ( % )
Battery charging and discharging processes are shown in Figure 7. The converter losses during charging and discharging processes greatly influence BESS performance. The individual battery efficiency is affected by the self-discharge, which is due to losses across the internal resistance, and it can be calculated from Equation (2). When the charging and discharging current increases, the battery internal loss also increases and thereby the overall efficiency of the energy storage system deteriorates.
W i n t l o s s = I 2
In the battery charging scenario, the energy flows from the AC source to the battery through the converter (rectifier) and DC–DC charging circuit. Hence, the rectifier loss and charger losses cause a drop in power. The charging efficiency is described using the Equations (3) and (4).
W g . c h g = W b a t . c h g + W c h g .   l o s s + W r e c t . l o s s + W t r s . l o s s
where W r e c t . L o s s = W r e c t . c o n d + W r e c t . r e c
η P C C . c h g = W b a t . c h g W g . c h g × 100 ( % )
where, during the discharging scenario the battery energy is fed to the loads through DC–DC converter and inverter. Hence, losses rendered by both the converters are accounted and the discharge efficiency is obtained using the Equations (5) and (6).
W g . d i s = W b a t . d i s W l o s s . d i s W i n v . L o s s W t r s . l o s s
η P C C . d i s = W g . d i s W b a t . d i s × 100 ( % )
In household usage, a 12-V lead–acid battery is used for power backup. To find the charging efficiency, experimentation has been carried out with a 12 V, 96 Ah, battery and the setup is shown in Figure 8. The conventional BESS charging and discharging efficiency curve is obtained. It is shown in Figure 9. It has been inferred that the battery charging efficiency varies between 81–85%. Similarly, the experimentation has been carried out for finding discharge efficiency and the efficiency has been inferred to be 79–83%. However, the battery discharge takes place occasionally and hence, charging and discharging power consumption values are not included in tariff calculation. However, the setup is an online inverter system and so, the batteries are always connected to its charging terminals. Further, the battery receives a floating current even after complete charging. The float charging parameters of the battery are shown in Table 5.
The battery consumes 10.152 W, but the AC input terminal reads 46.5 VA power by accounting DC converter loss and inverter loss. This power is required to be supplied all day, and hence, a float charge power of 46.5 VA has been considered during tariff calculation. The detailed tariff estimation for Scheme 2 is provided in Table 6.
In this scheme, the converter used for power conversion injects harmonics at the point of connection. Hence, the source suffers from a THD of 10–15%. The THD has been observed using Energy Analyser (KRYKARD ALM 35) across the terminals where computers and other DC loads are connected. These are DC operated but AC compatible loads and these loads have a converter that converts AC to DC. The efficiency of these converters is substantially poor and it pollutes the distribution system widely.

2.3. Scheme 3: Direct Utility-Grid Tied Solar PV System

The direct utility-grid tied PV system is discussed in this scheme and a schematic configuration is shown in Figure 10. In this scheme, solar power is inverted and injected into the utility grid directly. The home loads are fed by taking a separate service line from the distributor main. Moreover, separate converters are used for the battery backup system.
The solar panels are rooftop mounted and the generated power is completely fed to the utility by a direct grid–tie inverter. To find the efficiency of the converter, real-time experimentation has been performed in a commonly used solar PV inverter. From the experimental observation, it is inferred that the efficiency is inferred to be 83–87%. Hence, the generated solar power will have to face the power drop across the converter every time whenever it is inverted for utilization.
The solar potential at the test point (Madurai, Tamil Nadu, India Latitude −9.95 and Longitude −78.15) has been obtained from the U.S Department of Energy, National Renewable Energy Laboratory (NREL) PV Watts calculator [76] The hourly data has been taken and averaged month-wise and used for analysis, it is depicted in Table 7. The month-wise averaged power value is summed up for bi-monthly for tariff calculation. In this scheme, the average value of the inverter efficiency of 85.45% is included in the tariff calculation and the results are tabulated in Table 8.

2.4. Scheme 4: Utility Supported Stand-Alone PV System

This scheme includes a battery for power backup purposes, as shown in Figure 11. The solar power is inverted by an inverter and supplied to the loads. Hence, the inverter loss and battery float charging power are included in the tariff calculation. The float charge parameters are measured from the experimental setup and tabulated in Table 9. Since the battery is charged directly by the DC source, the power consumed for float charging is 27.6 W.
The inverter loss calculated for Scheme 3 is applicable for this scheme and it is accounted for in the tariff calculation. The details are provided in Table 10.

2.5. Inferences Drawn from the Case Study

Based on the case study conducted on the existing conventional distribution schemes, the following issues have been identified.
  • Low voltage DC appliances need a transformer to step down as well as a converter to convert from AC to DC.
  • The scheme with battery backup also requires a transformer and converter.
  • During a power outage, the battery power is inverted to AC for utilization, and it undergoes inversion loss.
  • The converters of appliances inject enormous harmonics which increase the losses in all aspects of the system and it imposes a THD of 10–15%.
  • Inverter efficiency varies between 83–87% and gets lowered further when it is lightly loaded.
  • BESS charging efficiency is about 81–85% and discharge efficiency is about 79–83%.
  • Conventional battery float charging at the AC power terminal is 46.5 VA.
  • In Scheme 4, all-day solar-based charge-controlled float charging is about 27.6W.

3. Scheme 5—Proposed PV-Based Hybrid AC/DC Microgrid System

This scheme aims at incorporating a technique to reduce frequent conversion processes. Over the recent years, half of the household equipment has been DC powered. On the other hand, renewable energy sources like solar panels and fuel cells generate DC power. To respond to this growing use of DC systems, the evolution of DC infrastructure is needed. Previous work [77] has investigated the opportunities and challenges in adopting a DC distribution system. The benefits and feasibility of the DC distribution system, when DC generation schemes are available, are explained previously [78]. Hence, the concept of DC microgrid has to be developed to utilize the generated DC power from solar to the DC loads and with which, the redundant conversion losses can be reduced. Since the other loads require AC supply, an interactive AC/DC microgrid is required to effectively utilize the energy [79,80,81,82]. In regards to all the aforementioned information, the proposed work will pay the way for exploring the feasibility and potential of implementing solar PV based interactive hybrid AC/DC microgrid with an effective storage system, as shown in Figure 12. In real-time, this proposed topology has to be incorporated by re-structuring the distribution infrastructure by constructing a separate AC/DC bus system with which loads can be categorized and supplied separately. Hence, the redundant power conversion has been avoided and thereby power conservation is guaranteed. A prototype model of the configuration is realized for investigation, as shown in Figure 13.
The bi-directional grid–tie converter is designed with the IEC 62040–3 standard which adheres to grid code requirement and microgrid compliances. The DC bus system is operated with IEEE P2030.10, it is a Standard for DC Microgrids Electricity Access Applications. The overall microgrid is designed according to IEEE 1366–2012 standards which are intended for compliance of Power Distribution Reliability. The proposed scheme has been equipped with an efficient battery management system for providing a strong power backup as well as energy saving. The battery efficiency has been tested in the microgrid environment and the observation is shown as a graphical representation in Figure 14.
Since the multiple charging and discharging processes as shown in Figure 5 have been evaded, as a result, the efficiency of the BESS has been enhanced to 95%. Generally, the backup battery power is supplied to uninterruptible loads such as fan and lighting loads, during power outages. In this scheme, the conventional AC fan and light loads are replaced with energy-efficient DC loads. The details are given in Table 11 and Table 12. The DC load consumes an average of 80.4 W bimonthly. Since these loads operate in DC, they can be fed by DC supply without any major conversion. The tariff calculation of Scheme 5 is provided in Table 13.
Experimentation is conducted for varying solar irradiation, temperature, and the corresponding impact over the current, voltage, and power output of the solar PV system is observed for realization; it is shown in Figure 15.
The generated solar DC power is directly fed to DC loads and hence, the multiple conversion processes have been reduced. A power-saving of about 10% is achieved by minimizing the conversion process and savings of 20% have been achieved by using energy-efficient DC loads in this Scheme. Further, the amount of power fed for inversion is reduced by 20% and hence conversion loss has been minimized. The battery efficiency is relatively improved by 15% when it is operated exclusively in a DC environment. By reducing the conversion loss and usage of energy-efficient DC loads have successively reduced the dependence on utility power in this proposed scheme when compared to the other schemes. Consecutively, fossil fuel usage is reduced and it results in CO2 emission reduction.
The CO2 emission reduction is the crucial point of focus and the existing works have emphasized the use of renewable resources for CO2 reduction [83,84,85]. The effective usage of solar PV power using the proposed scheme will pave way for reducing carbon dioxide emission and reducing the conversion loss will decrease global warming consecutively. The carbon dioxide emission in the Indian scenario has been obtained from the CO2 baseline database for the Indian power sector [86]. The carbon dioxide emission rate of generating stations based on the fuel category can be calculated from the following Equation (7).
A b s C o 2 ( G e n   S t ) y = i = 1 2 F u e l C o n i , y × G C V i , y × E F i × O x i d i
The Specific CO2 emission of stations is computed using Equation (8).
S p e c C O 2 ( G e n   S t ) y = A b s C O 2 ( G e n   S t ) y N e t G e n ( G e n   S t ) y
If the fuel and other power generation details are available in units, the absolute CO2 emission can be obtained by Equation (9).
A b s C O 2 ( u n i t ) y = S p e c C O 2 ( u n i t ) y × N e t G e n ( u n i t ) y
where 1 Unit = 1 kWh
The emission factor is indicated in a previous study [68] as 0.82 for the Indian scenario. To find the carbon footprint in India, the expression is shown in Equation (10).
A b s C O 2 ( i n k g ) = N e t G e n ( u n i t ) y × E F i
A quantitative analysis of the amount of CO2 emission reduction details is presented in Section 4.

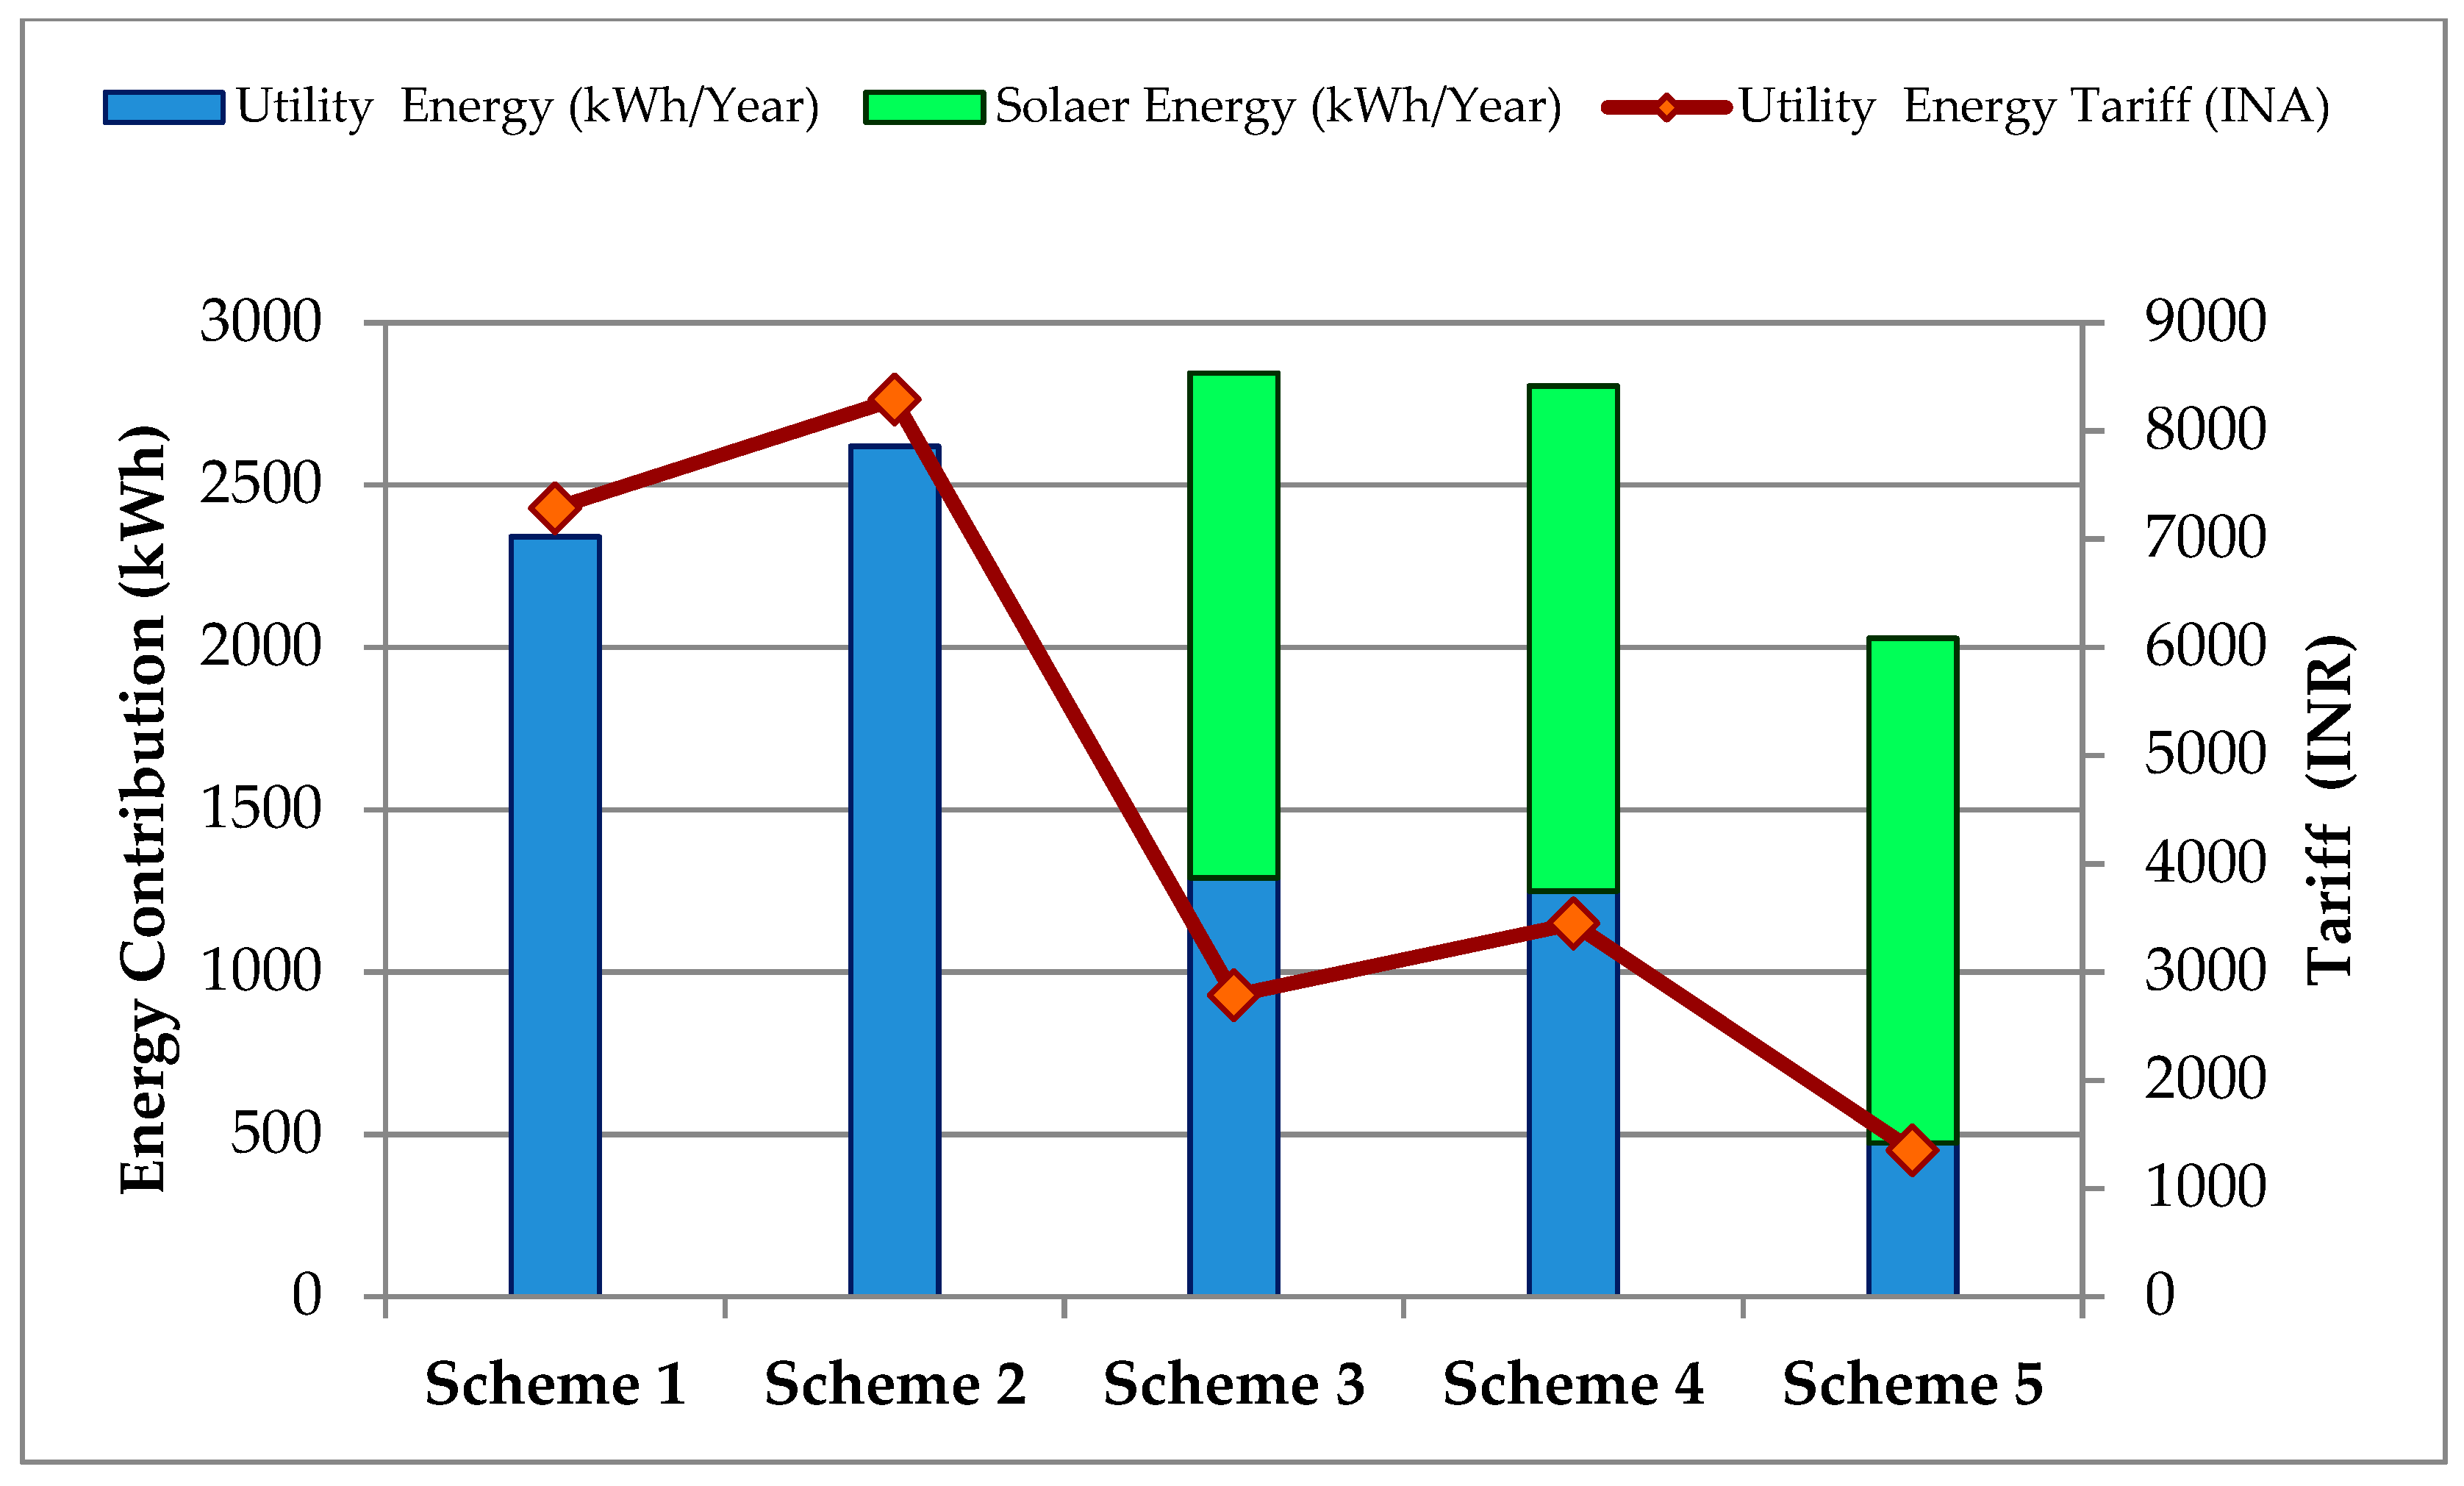
4. Comparative Analysis of the Schemes

The units consumed from a utility distribution system and the respective tariff details of the schemes in a year are given in Table 14. The chart shown in Figure 16 is the energy consumed by the distribution schemes from the utility. In Scheme 2, the battery backup setup increases energy consumption. Further, the converters inject harmonics into the distribution mains. Schemes 3, 4, and 5 are facilitated with a solar PV system, in which Scheme 3 and Scheme 4 suffer frequent conversion loss. Hence, solar energy contribution is not appreciable.
In the proposed distribution scheme, the conversion losses are reduced and the demand for electricity from the utility is much reduced, which can be inferred from Figure 17. In Figure 18, the particulars of energy savings obtained by installing solar plants and the respective payback period are indicated along with the installation cost and government subsidy Consequently, the amount paid as a tariff for the utility is much less. Further, it results in improved energy saving. The energy-saving details are projected for ten years, as depicted in Figure 18, and a reduced payback period is highlighted in Figure 19.
The conventional solar PV scheme (similar to Scheme 3 of the case study) with direct grid–tie topology cause high stress in the distribution network because of the frequent power penetration. Further, uncontrollable and intermittent power inflow causes high voltage variation and other stability issues. The proposed scheme increases the rate of self-consumption and relieves the stress on the distribution system by reducing the rate of grid penetration, as shown in Figure 20. The incorporation of solar-based microgrid with a distribution network results in the usage of solar power to meet the local demand. As a result, fossil fuel usage has been reduced and it has fruitfully resulted in reduced carbon emission, as shown in Figure 21. Hence, the proposed Scheme 5 also paves the way for ecological improvement. From this comparative analysis, it has been inferred that the incorporation of the proposed hybrid energy management system has shown proven energy conservation possibilities.

5. Conclusions and Future work

The proposed work is an implication study to identify the cause for distrust about solar PV technology among domestic consumers around the world. An extensive case study has been carried out using real utility tariff rates and consumer energy consumption data. The performance characteristics of converters and equipment are inferred using the experimental validation of the Indian distribution system. It has been identified that the redundant conversion process between the source and load, inefficient converter topology, and unproductive battery storage topology management are the detrimental factors influencing the performance of solar PV technology. After the extensive investigations, a proposed hybrid microgrid-based distribution scheme has been proposed and the following important conclusions are drawn:
  • The hybrid AC/DC microgrid based distribution scheme proves to be an effective solution to effectively utilize solar energy and BESS.
  • The BESS performance shows a 10–16% improvement.
  • Energy savings of 1866.96 kWh/year is achieved from 1 kW solar PV.
  • The battery, when deployed in the conventional scheme, increases the carbon emission by 228.78 kgs/year. However, when the BESS is managed in the proposed DC microgrid environment, it is reduced by 1530.91 kgs/year.
  • The payback period of solar PV installation can be reduced from 8 years to 4 years. It also improves the rooftop solar PV installation opportunities, and the sustainability of the solar technology market is guaranteed.
  • High PV penetration can be reduced by maximizing internal consumption and energy storage. It has been suggested that the direct grid-tied solar scheme can be avoided to reduce the stress on the distribution system.
The authors have also inferred that in certain adverse weather conditions such as a cloudy situation when the solar system is not generating ample power, it is hard to meet the scheduled demand. In such situations, the power demand is met using the utility grid and the solar PV power distribution strategy suggested by the proposed scheme may not adhere to the expected energy cost minimization scenario. The future scope of the work shall be enhanced by including solar forecasting information to predetermine the solar potential and schedule the distribution management effectively. Further, the feed-in tariff and time-of-use rate shall be included to determine the energy cost.

Author Contributions

Conceptualization, Data Curation, Formal Analysis, Methodology and Research Framework, Writing–Original Draft, Visualization: M.R., S.G. and R.M.E.; Supervision: S.G.; Review and Editing: L.M.-P.; Funding Acquisition towards APC: L.M.-P. All authors have read and agreed to the published version of the manuscript.

Funding

This research activity received no external funding.

Acknowledgments

The authors would like to acknowledge the TEQIP support provided by the Department of Electrical and Electronics Engineering, Thiagarajar College of Engineering, Madurai, India to complete the research work. The authors would also like to thank Irfan Ahmad Khan, Clean and Resilient Energy Systems Laboratory, Texas A&M University, Galveston, the USA for the technical expertise provided.

Conflicts of Interest

The authors declare no conflict of interest.

Nomenclature

AbsCO2(in kg)Absolute CO2 emission in kilogram
AbsCO2(Gen St)yAbsolute CO2 emission of the generating station in the given financial year ‘y’
AbsCO2(unit)yAbsolute CO2 emission for the units of energy generated in the given financial year ‘y’
EFiCO2 emission factor of the fuel i based on GCV-
FuelConi,yAmount of fuel of type i consumed in the financial year ‘y’
GCVi,yGross calorific value of the fuel i in the financial year ‘y’
NetGen(GenSt)yNet power generated from the generating station in the given financial year ‘y’
NetGen(unit)yNet units of energy generated in the given financial year ‘y’
OxidiOxidation factor of the fuel i
SpecCO2(GenSt)ySpecific CO2 emission from the generating station in the given financial year ‘y’
SpecCO2(unit)ySpecific CO2 emission for the units of energy generated in the given financial year ‘y’
Winv,CondConduction Power loss in the inverter
Winv,SWSwitching power loss in the inverter
WPrectrecPower loss during reverse recovery in the rectifier
Wbat,chgBattery charge power
Wbat,disPower at battery terminal during discharge
Wg,chgPower at the point of the battery charging terminal
Wg,disPower at the terminal point during discharge of a battery
Wint,lossBattery internal loss
Winv,lossPower loss in the inverter
Wloss,chgPower loss during battery charging
Wloss,disPower loss during battery discharging
Wrect,lossPower loss in the rectifier
Wtrs,lossPower loss in the transformer
ηPCC.chgBattery charging efficiency
ηbatBattery efficiency
ACAlternating Current
BESSBattery Energy Storage System
DCDirect Current
INRIndian Rupee
MPPTMaximum Power Point Tracking
RESRenewable Energy System
TANGEDCOTamil Nadu Generation and Distribution Corporation
UPSUninterrupted Power Supply
rPolarization resistance
unitone unit is 1000 Wh

References

  1. Mohr, S.; Wang, J.; Ellem, G.; Ward, J.; Giurco, D. Projection of world fossil fuels by country. Fuel 2015, 141, 120–135. [Google Scholar] [CrossRef]
  2. Chapman, A.J.; McLellan, B.C.; Tezuka, T. Prioritizing mitigation efforts considering co-benefits, equationuity and energy justice: Fossil fuel to renewable energy transition pathways. Appl. Energy 2018, 219, 187–198. [Google Scholar] [CrossRef]
  3. Madurai Elavarasan, R.; Selvamanohar, L.; Raju, K.; Rajan Vijayaraghavan, R.; Subburaj, R.; Nurunnabi, M.; Khan, I.A.; Afridhis, S.; Hariharan, A.; Pugazhendhi, R.; et al. A Holistic Review of the Present and Future Drivers of the Renewable Energy Mix in Maharashtra, State of India. Sustainability 2020, 12, 6596. [Google Scholar] [CrossRef]
  4. Elavarasan, R.M. The Motivation for Renewable Energy and its Comparison with Other Energy Sources: A Review. Eur. J. Sustain. Dev. Res. 2019, 3. [Google Scholar] [CrossRef]
  5. Elavarasan, R.; Shafiullah, G.; Manoj Kumar, N.; Padmanaban, S. A State-of-the-Art Review on the Drive of Renewables in Gujarat, State of India: Present Situation, Barriers and Future Initiatives. Energies 2019, 13, 40. [Google Scholar] [CrossRef] [Green Version]
  6. Elavarasan, R.M. Comprehensive Review on India’s Growth in Renewable Energy Technologies in Comparison with Other Prominent Renewable Energy Based Countries. J. Sol. Energy Eng. 2020, 142. [Google Scholar] [CrossRef]
  7. Elavarasan, R.M.; Shafiullah, G.M.; Padmanaban, S.; Kumar, N.M.; Annam, A.; Vetrichelvan, A.M.; Mihet-Popa, L.; Holm-Nielsen, J.B. A Comprehensive Review on Renewable Energy Development, Challenges, and Policies of Leading Indian States with an International Perspective. IEEE Access 2020, 8, 74432–74457. [Google Scholar] [CrossRef]
  8. Madurai Elavarasan, R.; Afridhis, S.; Vijayaraghavan, R.R.; Subramaniam, U.; Nurunnabi, M. SWOT analysis: A framework for comprehensive evaluation of drivers and barriers for renewable energy development in significant countries. Energy Reports 2020, 6, 1838–1864. [Google Scholar] [CrossRef]
  9. R, K.; K, U.; Raju, K.; Madurai Elavarasan, R.; Mihet-Popa, L. An Assessment of Onshore and Offshore Wind Energy Potential in India Using Moth Flame Optimization. Energies 2020, 13, 3063. [Google Scholar] [CrossRef]
  10. Yan, J. Handbook of Clean Energy Systems; Wiley: New York, NY, USA, 2015; Volume 6. [Google Scholar]
  11. Jacobson, M.Z.; Howarth, R.W.; Delucchi, M.A.; Scobie, S.R.; Barth, J.M.; Dvorak, M.J.; Klevze, M.; Katkhuda, H.; Miranda, B.; Chowdhury, N.A.; et al. Examining the feasibility of converting New York State’s all-purpose energy infrastructure to one using wind, water, and sunlight. Energy Policy 2013, 57, 585–601. [Google Scholar] [CrossRef]
  12. Laslett, D.; Carter, C.; Creagh, C.; Jennings, P. A large-scale renewable electricity supply system by 2030: Solar, wind, energy efficiency, storage and inertia for the South West Interconnected System (SWIS) in Western Australia. Renew. Energy 2017, 113, 713–731. [Google Scholar] [CrossRef] [Green Version]
  13. Da Luz, T.; Moura, P. 100% Renewable energy planning with complementarity and flexibility based on a multi-objective assessment. Appl. Energy 2019, 255, 113819. [Google Scholar] [CrossRef]
  14. Kumar, N.M.; Chopra, S.S.; Chand, A.A.; Elavarasan, R.M.; Shafiullah, G.M. Hybrid Renewable Energy Microgrid for a Residential Community: A Techno-Economic and Environmental Perspective in the Context of the SDG7. Sustainability 2020, 12, 3944. [Google Scholar] [CrossRef]
  15. Gangatharan, S.; Rengasamy, M.; Elavarasan, R.M.; Das, N.; Hossain, E.; Sundaram, V.M. A Novel Battery supported Energy Management System for the effective handling of feeble power in Hybrid Microgrid Environment. IEEE Access 2020. [Google Scholar] [CrossRef]
  16. Pfenninger, S.; Gauché, P.; Lilliestam, J.; Damerau, K.; Wagner, F.; Patt, A. Potential for concentrating solar power to provide baseload and dispatchable power. Nat. Clim. Chang. 2014, 4, 689–692. [Google Scholar] [CrossRef]
  17. Wiginton, L.K.; Nguyen, H.T.; Pearce, J.M. Quantifying rooftop solar photovoltaic potential for regional renewable energy policy Author links open overlay panel Computers. Comput. Environ. Urban Syst. 2010, 34, 345–357. [Google Scholar] [CrossRef] [Green Version]
  18. Yadav, S.K.; Bajpai, U. Performance evaluation of a rooftop solar photovoltaic power plant in Northern India. Energy Sustain. Dev. 2018, 43, 130–138. [Google Scholar] [CrossRef]
  19. Akpolat, A.N.; Dursun, E.; Kuzucuoğlu, A.E.; Yang, Y.; Blaabjerg, F.; Baba, A.F. Performance Analysis of a Grid-Connected Rooftop Solar Photovoltaic System. Electronics 2019, 8, 905. [Google Scholar] [CrossRef] [Green Version]
  20. Singh, R.; Banerjee, R. Estimation of rooftop solar photovoltaic potential of a city. Sol. Energy 2015, 115, 589–602. [Google Scholar] [CrossRef]
  21. Nguyen, H.T.; Pearce, J.M.; Harrap, R.; Barber, G. The Application of LiDAR to Assessment of Rooftop Solar Photovoltaic Deployment Potential in a Municipal District Unit. Sensors 2012, 12, 4534–4558. [Google Scholar] [CrossRef]
  22. Cucchiella, F.; D’Adamo, I.; Gastaldi, M.; Stornelli, V. Solar Photovoltaic Panels Combined with Energy Storage in a Residential Building: An Economic Analysis. Sustainability 2018, 10, 3117. [Google Scholar] [CrossRef] [Green Version]
  23. Kim, J.-C.; Huh, J.-H.; Ko, J.-S. Improvement of MPPT Control Performance Using Fuzzy Control and VGPI in the PV System for Micro Grid. Sustainability 2019, 11, 5891. [Google Scholar] [CrossRef] [Green Version]
  24. Ko, J.-S.; Huh, J.-H.; Kim, J.-C. Overview of Maximum Power Point Tracking Methods for PV System in Micro Grid. Electronics 2020, 9, 816. [Google Scholar] [CrossRef]
  25. Zhang, Y.; Lundblad, A.; Campana, P.E.; Benavente, F.; Yan, J. Battery sizing and rule-based operation of grid-connected photovoltaic-battery system: A case study in Sweden. Energy Convers. Manag. 2017, 133, 249–263. [Google Scholar] [CrossRef]
  26. Glasgo, B.; Azevedo, I.M.L.; Hendrickson, C. How much electricity can we save by using direct current circuits in homes? Understanding the potential for electricity savings and assessing feasibility of a transition towards DC powered buildings. Appl. Energy 2016, 180, 66–75. [Google Scholar] [CrossRef] [Green Version]
  27. Dubarry, M.; Devie, A.; Stein, K.; Tun, M.; Matsuura, M.; Rocheleau, R. Battery Energy Storage System battery durability and reliability under electric utility grid operations: Analysis of 3 years of real usage. J. Power Sources 2017, 338, 65–73. [Google Scholar] [CrossRef]
  28. Qureshi, J.; Lie, T.; Gunawardane, K.; Kularatna, N. AC source vs DC source: Charging efficiency in battery storage systems for residential houses. In Proceedings of the 2017 IEEE Innovative Smart Grid Technologies—Asia (ISGT-Asia), Auckland, New Zealand, 4–7 December 2017; Institute of Electrical and Electronics Engineers (IEEE): Piscataway, NJ, USA, 2017; pp. 1–6. [Google Scholar]
  29. O’Shaughnessy, E.; Cutler, D.; Ardani, K.; Margolis, R. Solar plus: Optimization of distributed solar PV through battery storage and dispatchable load in residential buildings. Appl. Energy 2018, 213, 11–21. [Google Scholar] [CrossRef]
  30. Rydh, C.J.; Sandén, B.A. Energy analysis of batteries in photovoltaic systems. Part II: Energy return factors and overall battery efficiencies. Energy Convers. Manag. 2005, 46, 1980–2000. [Google Scholar] [CrossRef]
  31. Khasawneh, H.J.; Illindala, M.S. Battery cycle life balancing in a microgrid through flexible distribution of energy and storage resources. J. Power Sources 2014, 261, 378–388. [Google Scholar] [CrossRef]
  32. Bellini, E. The Ambiguous Impact of Battery Storage on Emissions. Available online: https://www.pv-magazine.com/2020/03/05/the-ambiguous-impact-of-battery-storage-on-emissions/ (accessed on 6 May 2020).
  33. Urbanetz, J.; Braun, P.; Rüther, R. Power quality analysis of grid-connected solar photovoltaic generators in Brazil. Energy Convers. Manag. 2012, 64, 8–14. [Google Scholar] [CrossRef]
  34. Kumar, N.M.; Gupta, R.P.; Mathew, M.; Jayakumar, A.; Singh, N.K. Performance, energy loss, and degradation prediction of roof-integrated crystalline solar PV system installed in Northern India. Case Stud. Therm. Eng. 2019, 13, 100409. [Google Scholar] [CrossRef]
  35. Woyte, A.; Goy, S. Large grid-connected photovoltaic power plants: Best practices for the design and operation of large photovoltaic power plants. In The Performance of Photovoltaic (PV) Systems; Pearsall, N.M., Ed.; Woodhead Publishing: Cambridge, MA, USA, 2017; pp. 321–337. [Google Scholar]
  36. Baumgartner, F. Photovoltaic (PV) balance of system components: Basics, performance. In The Performance of Photovoltaic (PV) Systems; Pearsall, N.M., Ed.; Woodhead Publishing: Cambridge, MA, USA, 2017; pp. 135–181. [Google Scholar]
  37. International Energy Agency, Snapshot of Global PV Markets. 2014. Available online: http://www.iea-pvps.org/fileadmin/dam/public/report/technical/PVPS_report_-A_Snapshot_of_Global_PV_-_1992–2014.pdf (accessed on 6 May 2020).
  38. Alam Imteaz, M.; Ahsan, A. Solar panels: Real efficiencies, potential productions and payback periods for major Australian cities. Sustain. Energy Technol. Assess. 2018, 25, 119–125. [Google Scholar] [CrossRef]
  39. Karimi, M.A.; Mokhlis, H.; Naidu, K.V.S.; Uddin, S.N.; Bakar, A. Photovoltaic penetration issues and impacts in distribution network—A review. Renew. Sustain. Energy Rev. 2016, 53, 594–605. [Google Scholar] [CrossRef]
  40. Dong, J.; Xue, Y.; Kuruganti, T.; Sharma, I.; Nutaro, J.; Olama, M.; Hill, J.M.; Bowen, J.W. Operational impacts of high penetration solar power on a real-world distribution feeder. In Proceedings of the 2018 IEEE Power & Energy Society Innovative Smart Grid Technologies Conference (ISGT), Washington, DC, USA, 19–22 February 2018; Institute of Electrical and Electronics Engineers (IEEE): Piscataway, NJ, USA, 2018; pp. 1–5. [Google Scholar]
  41. Villar, C.H.; Neves, D.; Silva, C.A. Solar PV self-consumption: An analysis of influencing indicators in the Portuguese context. Energy Strategy Rev. 2017, 18, 224–234. [Google Scholar] [CrossRef]
  42. Boait, P.; Snape, J.R.; Morris, R.; Hamilton, J.; Darby, S.J. The Practice and Potential of Renewable Energy Localisation: Results from a UK Field Trial. Sustainability 2019, 11, 215. [Google Scholar] [CrossRef] [Green Version]
  43. Sampedro, J.; Arto, I.; González-Eguino, M. Implications of Switching Fossil Fuel Subsidies to Solar: A Case Study for the European Union. Sustainability 2017, 10, 50. [Google Scholar] [CrossRef] [Green Version]
  44. Hossain, C.A.; Chowdhury, N.; Longo, M.; Yaïci, W. System and Cost Analysis of Stand-Alone Solar Home System Applied to a Developing Country. Sustainability 2019, 11, 1403. [Google Scholar] [CrossRef] [Green Version]
  45. You, H.; Fang, H.; Wang, X.; Fang, S. Environmental Efficiency of Photovoltaic Power Plants in China—A Comparative Study of Different Economic Zones and Plant Types. Sustainability 2018, 10, 2551. [Google Scholar] [CrossRef] [Green Version]
  46. Imam, A.A.; Al-Turki, Y.A.; Sreerama, K.R. Techno-Economic Feasibility Assessment of Grid-Connected PV Systems for Residential Buildings in Saudi Arabia—A Case Study. Sustainability 2019, 12, 262. [Google Scholar] [CrossRef] [Green Version]
  47. Yoomak, S.; Patcharoen, T.; Ngaopitakkul, A. Performance and Economic Evaluation of Solar Rooftop Systems in Different Regions of Thailand. Sustainability 2019, 11, 6647. [Google Scholar] [CrossRef] [Green Version]
  48. Lan, T.T.; Jirakiattikul, S.; Chowdhury, M.S.; Ali, D.; Niem, L.D.; Techato, K. The Effect of Retail Electricity Price Levels on the FI Values of Smart-Grid Rooftop Solar Power Systems: A Case Study in the Central Highlands of Vietnam. Sustainability 2020, 12, 9209. [Google Scholar] [CrossRef]
  49. Wang, D.D. Benchmarking the Performance of Solar Installers and Rooftop Photovoltaic Installations in California. Sustainability 2017, 9, 1403. [Google Scholar] [CrossRef] [Green Version]
  50. Elshurafa, A.M.; Muhsen, A.R. The Upper Limit of Distributed Solar PV Capacity in Riyadh: A GIS-Assisted Study. Sustainability 2019, 11, 4301. [Google Scholar] [CrossRef] [Green Version]
  51. Solar Payback Trends. 2019. Available online: http://www.solardaily.com/reports/Solar_Payback_Trends_2019_999.html (accessed on 6 June 2020).
  52. What Is the Payback Period of Rooftop Solar PV Systems? Available online: http://www.solarmango.com/ask/2015/09/18/what-is-the-payback-period-of-rooftop-pv-systems/ (accessed on 6 June 2020).
  53. Are Solar Panels Worth It? Available online: https://pv-magazine-usa.com/2017/10/20/are-solar-panels-worth-it/ (accessed on 6 June 2020).
  54. PV European Payback Times for Solar Power Fell in 2018 Finds New Report. Available online: https://www.renewableenergymagazine.com/pv_solar/european-payback-times-for-solar-power-fell-20190221 (accessed on 6 June 2020).
  55. Database of State Incentives for Renewables & Efficiency. Available online: https://www.dsireusa.org/ (accessed on 10 July 2020).
  56. Ye, L.C.; Rodrigues, J.F.D.; Lin, H.X. Analysis of feed-in tariff policies for solar photovoltaic in China 2011–2016. Appl. Energy 2017, 203, 496–505. [Google Scholar] [CrossRef]
  57. Distributed Solar PV in China: Growth and Challenges. Available online: https://www.wri.org/blog/2018/08/distributed-solar-pv-china-growth-and-challenges (accessed on 10 July 2020).
  58. Solar Subsidies: Government Subsidies and Other Incentives for Installing Rooftop Solar System in India. Available online: https://economictimes.indiatimes.com/small-biz/productline/power-generation/solar-subsidies-government-subsidies-and-other-incentives-for-installing-rooftop-solar-system-in-india/articleshow/69338706.cms?from=mdr (accessed on 10 July 2020).
  59. The Spread of Solar Power Generation in Japan. Available online: https://www.japanfs.org/en/news/archives/news_id027851.html (accessed on 24 July 2020).
  60. Germany Announces €50 M Solar Storage Incentive. Available online: https://energystorageforum.com/news/germany-announces-e50m-solar-storage-incentive (accessed on 24 July 2020).
  61. Italy Extends Fiscal Incentive for Residential PV to Storage. Available online: https://www.pv-magazine.com/2018/09/21/italy-extends-storage-fiscal-incentive-for-residential-pv-linked-to-sustainable-buildings/ (accessed on 24 July 2020).
  62. European Renewable Energy Policy and Investment. Available online: https://climatepolicyinitiative.org/wp-content/uploads/2016/12/Final-ERE-Policy-Investment-2016.pdf (accessed on 24 July 2020).
  63. Zhang, S.; He, Y. Analysis on the development and policy of solar PV power in China. Renew. Sustain. Energy Rev. 2013, 21, 393–401. [Google Scholar] [CrossRef]
  64. Chen, M.K.; Sheldon, M. Dynamic Pricing in a Labor Market: Surge Pricing and Flexible Work on the Uber Platform. UCLA Anderson. 2015. Available online: https://www.anderson.ucla.edu (accessed on 10 June 2020).
  65. Japan Renews Focus on Solar Power. Available online: https://www.upi.com/Energy-News/2008/12/26/Japan-renews-focus-on-solar-power/37681230300775/?ur3=1 (accessed on 24 July 2020).
  66. Expiring, U.S. Solar Subsidy Spurs Rush for Panels. Available online: https://www.reuters.com/article/us-usa-solar-subsidy-focus/expiring-u-s-solar-subsidy-spurs-rush-for-panels-idUSKCN1UE0CO (accessed on 24 July 2020).
  67. Paajanen, P.; Kaipia, T.; Partanen, J. DC supply of low-voltage electricity appliances in residential buildings. In Proceedings of the IET 20th International Conference and Exhibition on Electricity Distribution (CIRED 2009)–Part 1, Prague, Czech Republic, 8–11 June 2009; p. 692. [Google Scholar] [CrossRef] [Green Version]
  68. Malik, S.M.; Sun, Y.; Huang, W.; Ai, X.; Shuai, Z. A Generalized Droop Strategy for Interlinking Converter in a Standalone Hybrid Microgrid. Appl. Energy 2018, 226, 1056–1063. [Google Scholar] [CrossRef]
  69. Ren, Z.; Paevere, P.; Chen, D. Feasibility of off-grid housing under current and future climates. Appl. Energy 2019, 241, 196–211. [Google Scholar] [CrossRef]
  70. Maleki, A.; Pourfayaz, F.; Hafeznia, H.; Rosen, M.A. A novel framework for optimal photovoltaic size and location in remote areas using a hybrid method: A case study of eastern Iran. Energy Convers. Manag. 2017, 153, 129–143. [Google Scholar] [CrossRef]
  71. Analyzing Tariffs Key Trends in Retail Electricity Prices. Available online: https://powerline.net.in/2017/12/07/analysing-tariffs/ (accessed on 24 July 2020).
  72. Solar Panel Cost: Price Range of Different Types of Solar Panels and How Much Govt. Subsidy Can You Avail for Installing One. Available online: https://economictimes.indiatimes.com/small-biz/productline/power-generation/solar-panel-cost-price-range-of-different-types-of-solar-panels-and-how-much-govt-subsidy-can-you-avail-for-installingone/articleshow/69327365.cms (accessed on 24 July 2020).
  73. Commercial Solar Panel Degradation: What you Should Know and Keep in Mind. Available online: https://businessfeed.sunpower.com/articles/what-to-know-about-commercial-solar-panel-degradation (accessed on 24 July 2020).
  74. Growth of Electricity Sector in India from 1947–2019. Available online: http://www.cea.nic.in/reports/others/planning/pdm/growth_2019.pdf (accessed on 24 July 2020).
  75. Tamil Nadu Generation and Distribution Corporation, One-Page Statement on Tariff Rates as in the TNERC. Available online: https://www.tangedco.gov.in/linkpdf/ONE_PAGE_STATEMENT.pdf (accessed on 24 July 2020).
  76. National Renewable Energy Laboratory SOLAR RESOURCE DATA. Available online: https://pvwatts.nrel.gov/pvwatts.php (accessed on 24 July 2020).
  77. Baran, M.; Mahajan, N. DC distribution for industrial systems: Opportunities and challenges. IEEE Trans. Ind. Appl. 2003, 39, 1596–1601. [Google Scholar] [CrossRef]
  78. Hammerstrom, D.J. AC Versus DC Distribution SystemsDid We Get it Right? In Proceedings of the 2007 IEEE Power Engineering Society General Meeting, Tampa, FL, USA, 24–28 June 2007; pp. 1–5. [Google Scholar] [CrossRef]
  79. Karabiber, A.; Keles, C.; Kaygusuz, A.; Alagoz, B.B. An approach for the integration of renewable distributed generation in hybrid DC/AC microgrids. Renew. Energy 2013, 52, 251–259. [Google Scholar] [CrossRef]
  80. Lawder, M.T.; Viswanathan, V.V.; Subramanian, V.R. Balancing autonomy and utilization of solar power and battery storage for demand based microgrids. J. Power Sources 2015, 279, 645–655. [Google Scholar] [CrossRef] [Green Version]
  81. Elavarasan, R.M.; Ghosh, A.; Mallick, T.K.; Krishnamurthy, A.; Saravanan, M. Investigations on Performance Enhancement Measures of the Bidirectional Converter in PV–Wind Interconnected Microgrid System. Energies 2019, 12, 2672. [Google Scholar] [CrossRef] [Green Version]
  82. Rajvikram, M.; Gopinath, C.; Ramkumar, S.; Leoponraj, S. A Novel Methodology of IoT Implementation in Energy Management. Power Res. A J. CPRI 2019, 14, 85–91. [Google Scholar] [CrossRef]
  83. Tan, S.T.; Yang, J.; Yan, J.; Lee, C.T.; Hashim, H.; Chen, B. A holistic low carbon city indicator framework for sustainable development. Appl. Energy 2017, 185, 1919–1930. [Google Scholar] [CrossRef]
  84. Wahlund, B.; Yan, J.; Westermark, M. Increasing biomass utilization in energy systems: A comparative study of CO2 reduction and cost for different bioenergy processing options. Biomass Bioenergy 2004, 26, 531–544. [Google Scholar] [CrossRef]
  85. Xiao, H.; Duan, Z.; Zhou, Y.; Zhang, N.; Shan, Y.; Lin, X.; Liu, G. CO2 emission patterns in shrinking and growing cities: A case study of Northeast China and the Yangtze River Delta. Appl. Energy 2019, 251, 113384. [Google Scholar] [CrossRef]
  86. CO2 Baseline Database for the Indian Power Sector, User Guide [Online]. Available online: http://cea.nic.in/reports/others/thermal/tpece/cdm_co2/user_guide_ver10.pdf (accessed on 24 July 2020).
Figure 1. Leading solar power producing country’s energy scenario.
Sustainability 12 10365 g001
Figure 2. Comprehensive representation of the investigation.
Sustainability 12 10365 g002
Figure 3. Solar panel degradation over the years of usage.
Sustainability 12 10365 g003
Figure 4. Domestic energy consumption and growth rate of energy consumption graph.
Sustainability 12 10365 g004
Figure 5. (a) Distorted current recorded in the residential premises. (b) THD of the distorted current.
Sustainability 12 10365 g005
Figure 6. Distribution scheme with battery backup.
Sustainability 12 10365 g006
Figure 7. Battery charging and discharging processes.
Sustainability 12 10365 g007
Figure 8. Experiment setup for finding battery charging efficiency.
Sustainability 12 10365 g008
Figure 9. Conventional BESS charging and discharging efficiency curve.
Sustainability 12 10365 g009
Figure 10. Direct utility-grid tied PV system.
Sustainability 12 10365 g010
Figure 11. Utility supported stand-alone PV system.
Sustainability 12 10365 g011
Figure 12. Hybrid AC/DC microgrid-based distribution system.
Sustainability 12 10365 g012
Figure 13. Prototype setup of the proposed scheme.
Sustainability 12 10365 g013
Figure 14. Battery charging and discharging efficiency curve in microgrid environment.
Sustainability 12 10365 g014
Figure 15. Experimental inference of solar potential for varying solar irradiations and temperatures.
Sustainability 12 10365 g015
Figure 16. Power consumption by the schemes from the utility.
Sustainability 12 10365 g016
Figure 17. Energy contribution and tariff chart for a year.
Sustainability 12 10365 g017
Figure 18. Energy-saving due to solar PV installation.
Sustainability 12 10365 g018
Figure 19. Energy-saving and the resulting payback period chart.
Sustainability 12 10365 g019
Figure 20. Energy penetrated to grid for storage.
Sustainability 12 10365 g020
Figure 21. CO2 emission details of the distribution schemes.
Sustainability 12 10365 g021
Table 1. Subsidy Cost in India.
DescriptionCost (INR)
Cost of 1 kW rooftop solar system 100,000
Subsidy @ 30%30,000
Cost after subsidy70,000
Accelerated Depreciation @ 80% & Tax Credit @ 35%19,600
Net Cost after Subsidy and Accelerated Depreciation savings 50,400
Table 2. TANGEDCO Tariff Description.
Domestic Consumers Slab RatesUnitsUnit Charges (INR/kWh)Fixed Charges Bimonthly (INR)
Consumption up to 100 units bi-monthly1002.5030/service
Consumption above 100 units and up to 200 units bi-monthly0–1002.5030/service
101 to 2002.50
Consumption above 200 units and up to 500 units bi-monthly0–1002.5040/service
101 to 2002.50
200 to 5003.00
Consumption above 500 units bi-monthly0–1002.5050/service
101 to 2003.50
200 to 5004.60
above 5006.60
Table 3. TANGEDCO Bimonthly Tariff Details.
Bill DateUnits Consumed (kWh)Bill Amount (INR)
09/12/2018340650
09/10/2018420890
09/08/2018370740
13/06/20185101846
12/04/2018440950
14/02/2018260410
Table 4. Tariff Rate Bimonthly Basis.
ParticularsJan-FebMar-AprilMay-JuneJuly-AugSep-OctNov-Dec
Units consumed kWh260440510370420340
Bill (INR)4109501846740890650
Table 5. Battery Float Charging from AC Terminals.
AC InputDC Output across Battery Terminals
Voltage (V)Current (A)Power (VA)Voltage (V)Current (A)Power (W)
2300.20246.514.10.7210.152
Table 6. Tariff Estimated for Scheme 2.
ParticularsJan-FebMar-AprilMay-JuneJuly-AugSep-OctNov-Dec
Units consumed
by loads(kWh)
260.00440.00510.00370.00420.00340.00
Net Units including battery float charge (kWh)306.50486.50556.50416.50466.50386.50
Bill (INR)859.501399.502402.901189.501339.501099.50
Table 7. Hourly Solar DC Array Output Power.
HourMonth Wise Hourly Solar DC Array Output Power/Day (W)
JanFebMarAprilMayJuneJuly Aug SepOctNovDec
60.00.00.09.031.836.130.021.630.135.439.43.4
7106.4156.7173.7188.3202.7195.0156.9100.7221.9237.3281.3231.5
8319.5269.4356.3395.3385.8363.0305.4207.2411.1440.1412.5438.9
9431.6353.7557.1522.8494.9493.2455.6345.2553.8580.1557.6588.3
10590.4322.5647.8607.3601.0578.1531.4491.0643.6671.7666.7676.5
11469.7607.1713.5645.2630.3608.0584.6410.0684.7702.8694.0712.3
12674.9683.1716.6641.1532.8602.8587.2392.7663.9669.9677.1700.1
13649.7628.9668.5597.4551.3553.7546.2263.4617.5612.9638.2641.0
14473.6565.0569.2512.1474.3460.6453.7181.8522.3512.6492.8533.4
15428.7333.6449.5383.7343.2323.8332.0255.4380.7367.1372.7380.7
16248.5243.4278.8227.3187.2163.796.6210.7204.4192.4149.6198.4
1762.089.7101.677.259.051.028.579.462.224.721.216.1
180.00.00.00.00.00.01.60.80.00.00.00.0
Data Averaged
/Month
151.7141.6153.9135.9128.4120.4124.8135.0137.3135.9133.0134.2
Table 8. Tariff Calculation of Scheme 3.
ParticularsJan-FebMar-AprilMay-JuneJuly-AugSep-OctNov-Dec
Solar power generated (kWh)282276237249262249
Grid stored Solar power after inversion (kWh)240.96235.85202.52212.77223.88212.78
Power required for the loads& battery float charge (kWh)306.50486.5556.5416.5466.5386.5
Net units consumed from the utility(kWh)65.53250.66353.98203.73242.62173.73
Bill (INR)193.83691.971001.95539.32636.55464.32
Table 9. Battery Float Charging from DC terminals.
DC InputDC across Battery Terminals
Voltage (V)Current (A)Power (W)Voltage (V)Current (A)Power (W)
560.4927.653.50.421.4
Table 10. Tariff Calculation of Scheme 4.
ParticularsJan-FebMar-AprilMay-JuneJuly-AugSep-OctNov-Dec
Solar power generated (kWh)282276237249262249
Solar power available after inversion & battery charging (kWh)201.23196.11162.78173.03184.14173.04
Load requirement (kWh)260440510370420340
Net units consumed from the utility (kWh) 58.77243.90347.22196.97235.86166.97
Bill (INR)176.93671.69981.67522.42647.58447.42
Table 11. Non-Interruptible Load Consumption.
Uninterruptible LoadsQuantityHours of UsagePower Rating of Loads (W)
Conventional AC LoadEnergy Efficient AC Compatible DC Loads
Lights6274024
Fan3197535
Table 12. Comparison Between Conventional and Energy Efficient Loads.
Uninterruptible LoadsUnits/Day
(kWh)
Percentage of Net Power Consumed /Day
Conventional AC loads2.6440.6%
Energy Efficient loads1.3420.62
Table 13. Tariff Calculation of Scheme.
MonthJan-FebMar-AprilMay-JuneJuly-AugSep-OctNov-Dec
Solar power generated (kWh)282276237249262249
Solar Power available after feeding DC load (kWh)201.60195.60156.60168.60181.60168.60
Solar Power available after Inversion (kWh)172.27167.15133.82144.07155.18144.07
Power required to feed AC load requirement (kWh)101.60281.60351.60211.60261.60181.60
Units consumed from utility (kWh)−70.67114.45217.7867.53106.4237.53
Grid storage (kWh)70.67-----
Net unit consumed from utility (kWh)043.78217.7867.53106.4237.53
Bill (INR)0139.45593.34198.82296.05123.83
Table 14. Units Consumed by the Schemes in a Year.
MonthsUnits Consumed per Bi-Monthly (kWh)
Scheme 1Scheme 2Scheme 3Scheme 4Scheme 5 (Proposed)
Jan-Feb260.00306.5019.0358.770.00
Mar-April440.00486.50204.16243.9043.78
May-June510.00556.50307.48347.22217.78
July-Aug370.00416.50157.23196.9767.53
Sep-Oct420.00466.50196.12235.86106.42
Nov-Dec340.00386.50127.23166.9737.53
Total Units2340.002619.001290.251249.69473.04
Bill (INR)7286.008290.42783.953447.721351.49
Publisher’s Note: MDPI stays neutral with regard to jurisdictional claims in published maps and institutional affiliations.

