Article

The Climate, Land, Energy, Water and Food Nexus Challenge in a Land Scarce Country: Innovations in the Netherlands

by
Davine N. G. Janssen
1,2,*,
Eunice Pereira Ramos
2,
Vincent Linderhof
3,
Nico Polman
3,
Chrysi Laspidou
4,
Dennis Fokkinga
5 and
Duarte de Mesquita e Sousa
1
1
Instituto Superior Técnico, Universidade de Lisboa, 1049-001 Lisbon, Portugal
2
Department of Energy Technology, KTH—Royal Institute of Technology Stockholm, SE-100 44 Stockholm, Sweden
3
Wageningen Economic Research, Wageningen University Research, Prinses Beatrixlaan 582, 2595 BM Den Haag, The Netherlands
4
Department of Civil Engineering, University of Thessaly, 38334 Volos, Greece
5
DbV—Driven by Values, Kastanjelaan 400, 5616 LZ Eindhoven, The Netherlands
*
Author to whom correspondence should be addressed.
Sustainability 2020, 12(24), 10491; https://doi.org/10.3390/su122410491
Submission received: 14 September 2020 / Revised: 20 November 2020 / Accepted: 6 December 2020 / Published: 15 December 2020

Abstract

:
The Netherlands has the ambitious target of transitioning to a low-carbon economy by 2050. One factor that may constrain this progress, however, is the large spatial requirements of renewable energy technologies, and resulting competition for land through interlinkages between the Climate (C), Land (L), Energy (E), Water (W) and Food (F) domains—the CLEWF nexus. This study aims at identifying innovations that can improve the performance of the nexus by addressing the land scarcity constraint while supporting the low-carbon economy transition. A framework for the identification of potential innovations applicable in the nexus context was developed and applied. It is derived from a Driver-Pressure-State-Impact-Response (DPSIR) analysis of land scarcity in the Dutch nexus and a stock-taking benchmarking analysis of European countries. An inventory of innovations was prepared based on several classifications of innovations, collecting examples from the Netherlands, Belgium, Denmark, Germany, Latvia and Sweden. Three innovations were identified as particularly promising: district heating, Energy Service Companies and peak shaving through water pumping. Furthermore, the DPSIR framework was also used to identify overarching societal elements common to countries that successfully implemented sustainable innovations. These were found to relate to long-term political commitments, geopolitical and economic drivers, and pioneering approaches building from and towards national strengths.

1. Introduction

The Paris’ United Nations Framework Convention on Climate Change (UNFCCC) agreement, signed in 2015, has set the scene for climate policy globally. Its central aim of keeping the global temperature rise “well below 2 °C” in this century [1] puts pressure on all signatory countries to reduce greenhouse gas (GHG) emissions from, among other sectors, energy production and use [2]. At the European level, the Emission Trading Scheme and the Clean Energy package, which includes the Renewable Energy Directive and the Energy Efficiency Directive of 2018, set targets that require European Union member states to take more ambitious measures in terms of climate action [3]. More recently, the European Commission presented the European Green Deal, an unprecedentedly ambitious policy strategy setting out the path to climate neutrality by 2050. In the Netherlands, the Climate Agreement (Klimaatakkoord) [4] is the leading policy for reducing GHG emissions, although more domains of policy are relevant [5]. At the end of 2019, for instance, the attention of policy makers has been drawn to the nitrogen emissions policy due to the immediate impacts of exceeded emission limits prohibiting the construction of new buildings and infrastructure [6].
The achievement of climate goals and ambitions will require a significant increase in renewable energy generation. At the European level, it has been agreed that by 2030 the share of renewable energy generation shall be at least 32%, with a possible upward revision in 2023 [7,8]. For 2020, the European target was set at 20%, with national binding targets specified for each member state, ranging from 10% in Malta to 49% in Sweden. The national targets take into account differences in starting points due to different circumstances, renewable energy potential and economic conditions [9]. The Dutch target for 2020 was 14%. In 2017, the share of renewable energy in the Netherlands was still 6.6%—lower than all other EU member states except Luxembourg [10]. In 2018, it reached 7.4%, and it was the lowest among EU countries [11].
One factor constraining progress towards a low-carbon economy in the Netherlands is related to the relatively high level of competition between land use purposes compared to other European countries, hereafter referred to as “land scarcity” (used here in a relative manner: Dutch land is not scarce in an absolute sense; however, compared to most of the other EU member states, competition between different land use purposes is fierce in the Netherlands). The Netherlands has a population density of 501 people per km2, the highest level in Europe after Malta [12]. The agricultural sector is characterised by high land productivity [13]. The transition to a low-carbon economy will only increase the competition for land. Indeed, renewable energy technologies, such as solar photovoltaic (PV), wind power and biomass/biofuels production, produce less electricity per unit of land area than conventional fossil fuel-based technologies [14]. An increase in renewable energy generation using such renewable energy technologies would require more space—or, alternatively, a smarter use of space, energy, and storage capacity [14]. The renowned “Not In My Backyard” (NIMBY) argument plays a role in the expansion of these technologies, further reducing the potentially available space for such infrastructure. The land-scarcity constraint, however, goes beyond the direct spatial requirements of renewable energy generation. Agricultural activities and food production and consumption can affect the extent to which the availability of land is a constraining factor to energy sector development. It is a cross-sectoral issue and can be observed from different systems’ perspectives. In this study, we assess the competition for land in the context of the transition to a low-carbon economy from a nexus approach. This means the use of land is analysed from the viewpoint of several systems, considering the interactions between such systems. The nexus in this paper refers to the interlinked dependence of the domains of Climate (C), Land (L), Energy (E), Water (W) and Food (F) (the CLEWF nexus). An overview of interactions been nexus domains is provided in Figure 1. The relations between the CLEWF domains with regards to land scarcity in the Netherlands will be further elaborated on in Section 3.2.
The main aim of this article is to identify approaches that can contribute to alleviating land scarcity as a constraint to the low-carbon economy transition in the Netherlands, considering a CLEWF nexus perspective. Current alternatives like on-shore wind and solar power parks require land which is scarce in the Netherlands. Moreover, these alternatives have proven insufficient for the Netherlands to realise its climate goals. Contrastingly, innovation is a cornerstone of Dutch economic policy. In the context of the Sustainable Development Goals agenda, the transition to a low-carbon economy is necessary but challenging [15], and all the interlinked connections between goals and their targets support the need for an integrated approach to sustainable development. Innovations can accelerate change. As such, the concept of “innovation”, and how it should be created and developed, has taken centre stage in many research, strategy and policy documents [16]. However, the transferability of innovations to other nexus contexts has not been studied extensively. In this study, we analysed strategies and alternatives used elsewhere but are that have been used elsewhere but are innovative to the Dutch context of land scarcity, hereafter called “innovations”. We consider four categories (or types) of innovations: technical, social, policy and business model innovations.
The constraints that the energy transition encounters as well as the opportunities to overcome them are, largely, country-specific. However, innovations that could help alleviate constraints or nourish opportunities do not necessarily originate from the specific country under investigation. It would arguably be more effective to learn from experiences made in other places, countries or contexts. In this study, therefore, innovations are searched for both within and outside the Netherlands. By selectively searching for innovations based on an analysis of a specific nexus constraint (e.g., land scarcity in the Netherlands), promising innovations can be identified, even when their original application was not directly intended to alleviate the constraint under consideration. Although elaborated here for the Netherlands only, the framework developed can be used to identify innovations for other nexus contexts and in other countries.
The assessment of the nexus is complex and is very much dependent on the context. We aim to advance science on how to identify relevant innovations for a country or case that can be implemented and to understand the implications of such innovations across the different domains of the nexus.
The analysis starts with the development of a framework for the identification of potential nexus innovations in the context of the CLEWF nexus. One of the outputs of the application of the framework is an innovation inventory specific to the constraint under investigation; in this case, land scarcity in the context of transitioning to a low-carbon economy in the Netherlands. Three particularly promising innovations from the inventory are identified and investigated further, and recommendations for their implementation are made (Section 4). Another output is an overview of political and economic drivers that countries with a successful emergence or adoption of sustainable innovations converge upon. As such, the application of the framework to the land-scarcity constraint of the Dutch nexus is of practical use for actors aiming to accelerate the transition of the Netherlands to a low-carbon economy, with benefits to sectors operating in other nexus domains. It could also inform other countries with similar contexts. The framework guides the identification of innovative solutions in a complex and broad network of systems that facilitates their integrated operation and accounts for compromises (or trade-offs) between them. Simultaneously, the application to the Dutch case illustrates the applicability and transferability of the framework in itself. Additionally, and from the perspective of innovators, the production of a pool of cross-systems innovations can support the dissemination of the new practices, support their scale-up process, promote the development of Small and Medium Enterprises (SMEs) and function as a communication mechanism between different actors involved in a CLEWF nexus assessment. In Section 5, we present our findings, and the conclusions are summarised in Section 6.

2. Literature Review: Definitions, Categorisations and Relevance for Sustainability

Innovation carries risk by definition. New approaches to address challenges come without guarantees regarding their success or effects, and might as such cost money and resources that could have been invested in existing options with proven, albeit limited, effects. This limitation of innovation as a means to change amplifies the need for studying it so that promising innovations for specific contexts can be better identified, sounder recommendations on their implementation can be made, and their implications on other sectors can better be understood. To that end, literature is reviewed on definitions and types of “innovation”, as well as on its relation with sustainability.

2.1. The Use of the Innovation Concept

The first commonly accepted definition of innovation dates back to the works of Joseph Schumpeter, one of the first scholars to devote explicit attention to the topic in modern science literature [17]. According to Schumpeter, innovation can be defined as “new combinations” of existing knowledge and resources. The author clearly distinguishes the concept from “invention”, which refers merely to the emergence of new ideas without the explicit need for those to be implemented [17,18]. Several general definitions of innovation find ground in the scientific literature [19]. The most recent definition used in the Oslo Manual, which is published by the Organisation for Economic Co-operation and Development (OECD) and provides guidelines for collecting and interpreting data on innovation to facilitate internationally comparable data, is: “An innovation is a new or improved product or process (or combination thereof) that differs significantly from the unit’s previous products or processes and that has been made available to potential users (product) or brought into use by the unit (process).” [16]. Across the definition provided by Schumpeter, the one in the Oslo Manual and a myriad of other paraphrases, there seems to be a general form in which innovation is defined, consisting of some combination of a formulation of at least two particular clauses. Firstly, innovation is thought to require some “new” element, in the form of new knowledge or an idea. Secondly, this new element is required to be “applied” in some way. In this study, any application of a technology, business model, policy or social configuration that provides a new way of addressing the land scarcity constraint in the Netherlands, or that is currently not used to its full potential to address this constraint in the Netherlands, is considered an innovation.

2.2. Types of Innovation

As is the case with many multi-faceted and widely applicable concepts, innovation has been classified in many ways. The third edition of the Oslo Manual [20] proposed four types of innovation in the business sector: product, business process, organisational and market innovations. The fourth edition of this manual, published in 2018, reorganised the most important sub-types in such a way that only the first two, product and process innovations, remained. However, these types still contained similar sub-types [16]. The limitation of innovations to these types seems to imply a rather technocratic approach to sustainability, in which technological advancements will solve the issues we are facing today while we continue to aim for development as it is traditionally understood in economics: the growth of the gross domestic product (GDP) [21,22,23,24]. Within the sustainable development discourse, however, technocratic viewpoints are highly criticised [25]. Rethinking production (processes) may not be enough to transition to a low-carbon economy; instead, what is produced and why needs to be reassessed. Ward et al. (2016) described how some scholars believe decoupling growth in GDP from environmental impacts to be possible [19]. Classifications based on the outcomes of improved products or processes might turn out to be incomplete, for example, because new forms of ownership, participation and understanding of well-being might arise. In this study, innovations are therefore organised in a broader way, using four types: technical, social, policy/governance and business model innovations, with “sustainable innovations” as the umbrella concept. Note that a “social innovation” is considered to be “the reconfiguring of social practices, in response to societal challenges, which seeks to enhance outcomes on societal well-being and necessarily includes the engagement of civil society actors” [26]. Indeed, the other types of innovations also respond to societal challenges, but through technology, policy or business model innovations, respectively.

2.3. The Relation between Innovation and the Energy Transition

Irandoust [27] described a direct causal relationship between technological innovation and renewables in Denmark and Norway and the same, but reverse, relationship in Sweden and Finland. The author suggested that the divergent results could be due to differences in the energy mix, the economic structure in terms of primary, secondary or residential sectors, the role of nuclear energy and the role of policies. At the policy level, the study concluded that investments should be made in technological innovations, since these effectively contribute to renewable energy deployment, in turn spurring innovation. Similar conclusions were drawn by Lin and Zhu [28], who investigated the role of renewable energy technological innovation on climate change based on empirical evidence from China. The results of their linear regression model confirmed a significant inverse relationship between renewable energy technology innovations and CO2 emissions. Hoppe and de Vries [29] confirmed the relation between social innovations and the energy transition in their editorial comment of 20 article contributions of the special issue “Social innovation and the Energy Transition”. They concluded that social innovation is required for a transition to a low-carbon energy system. Aldieri, Bruno and Vinci [30] investigated the relationship between innovation and happiness. They argued that the transition to a low-carbon society arguably requires a reconsideration of GDP growth as the main aim of development. In their study, the relationship between innovation and happiness was mediated by the environment, measured as eco-efficiency. They concluded that there is a positive relationship between eco-efficiency and happiness at the macro-level (nationally or larger), but unidirectional causality was not confirmed. At the micro-level (the level of communities), a negative relationship existed as a result of the “Not In My Backyard” (NIMBY) argument. The latter constitutes an important limitation to innovation at the regional level but further emphasises the urgent need for innovations that appreciate and address land scarcity to minimize the potential aversion to low-carbon solutions. In summary, the literature showed that innovation plays an important, if not crucial, role in the transition to a low-carbon economy.

3. Materials and Methods
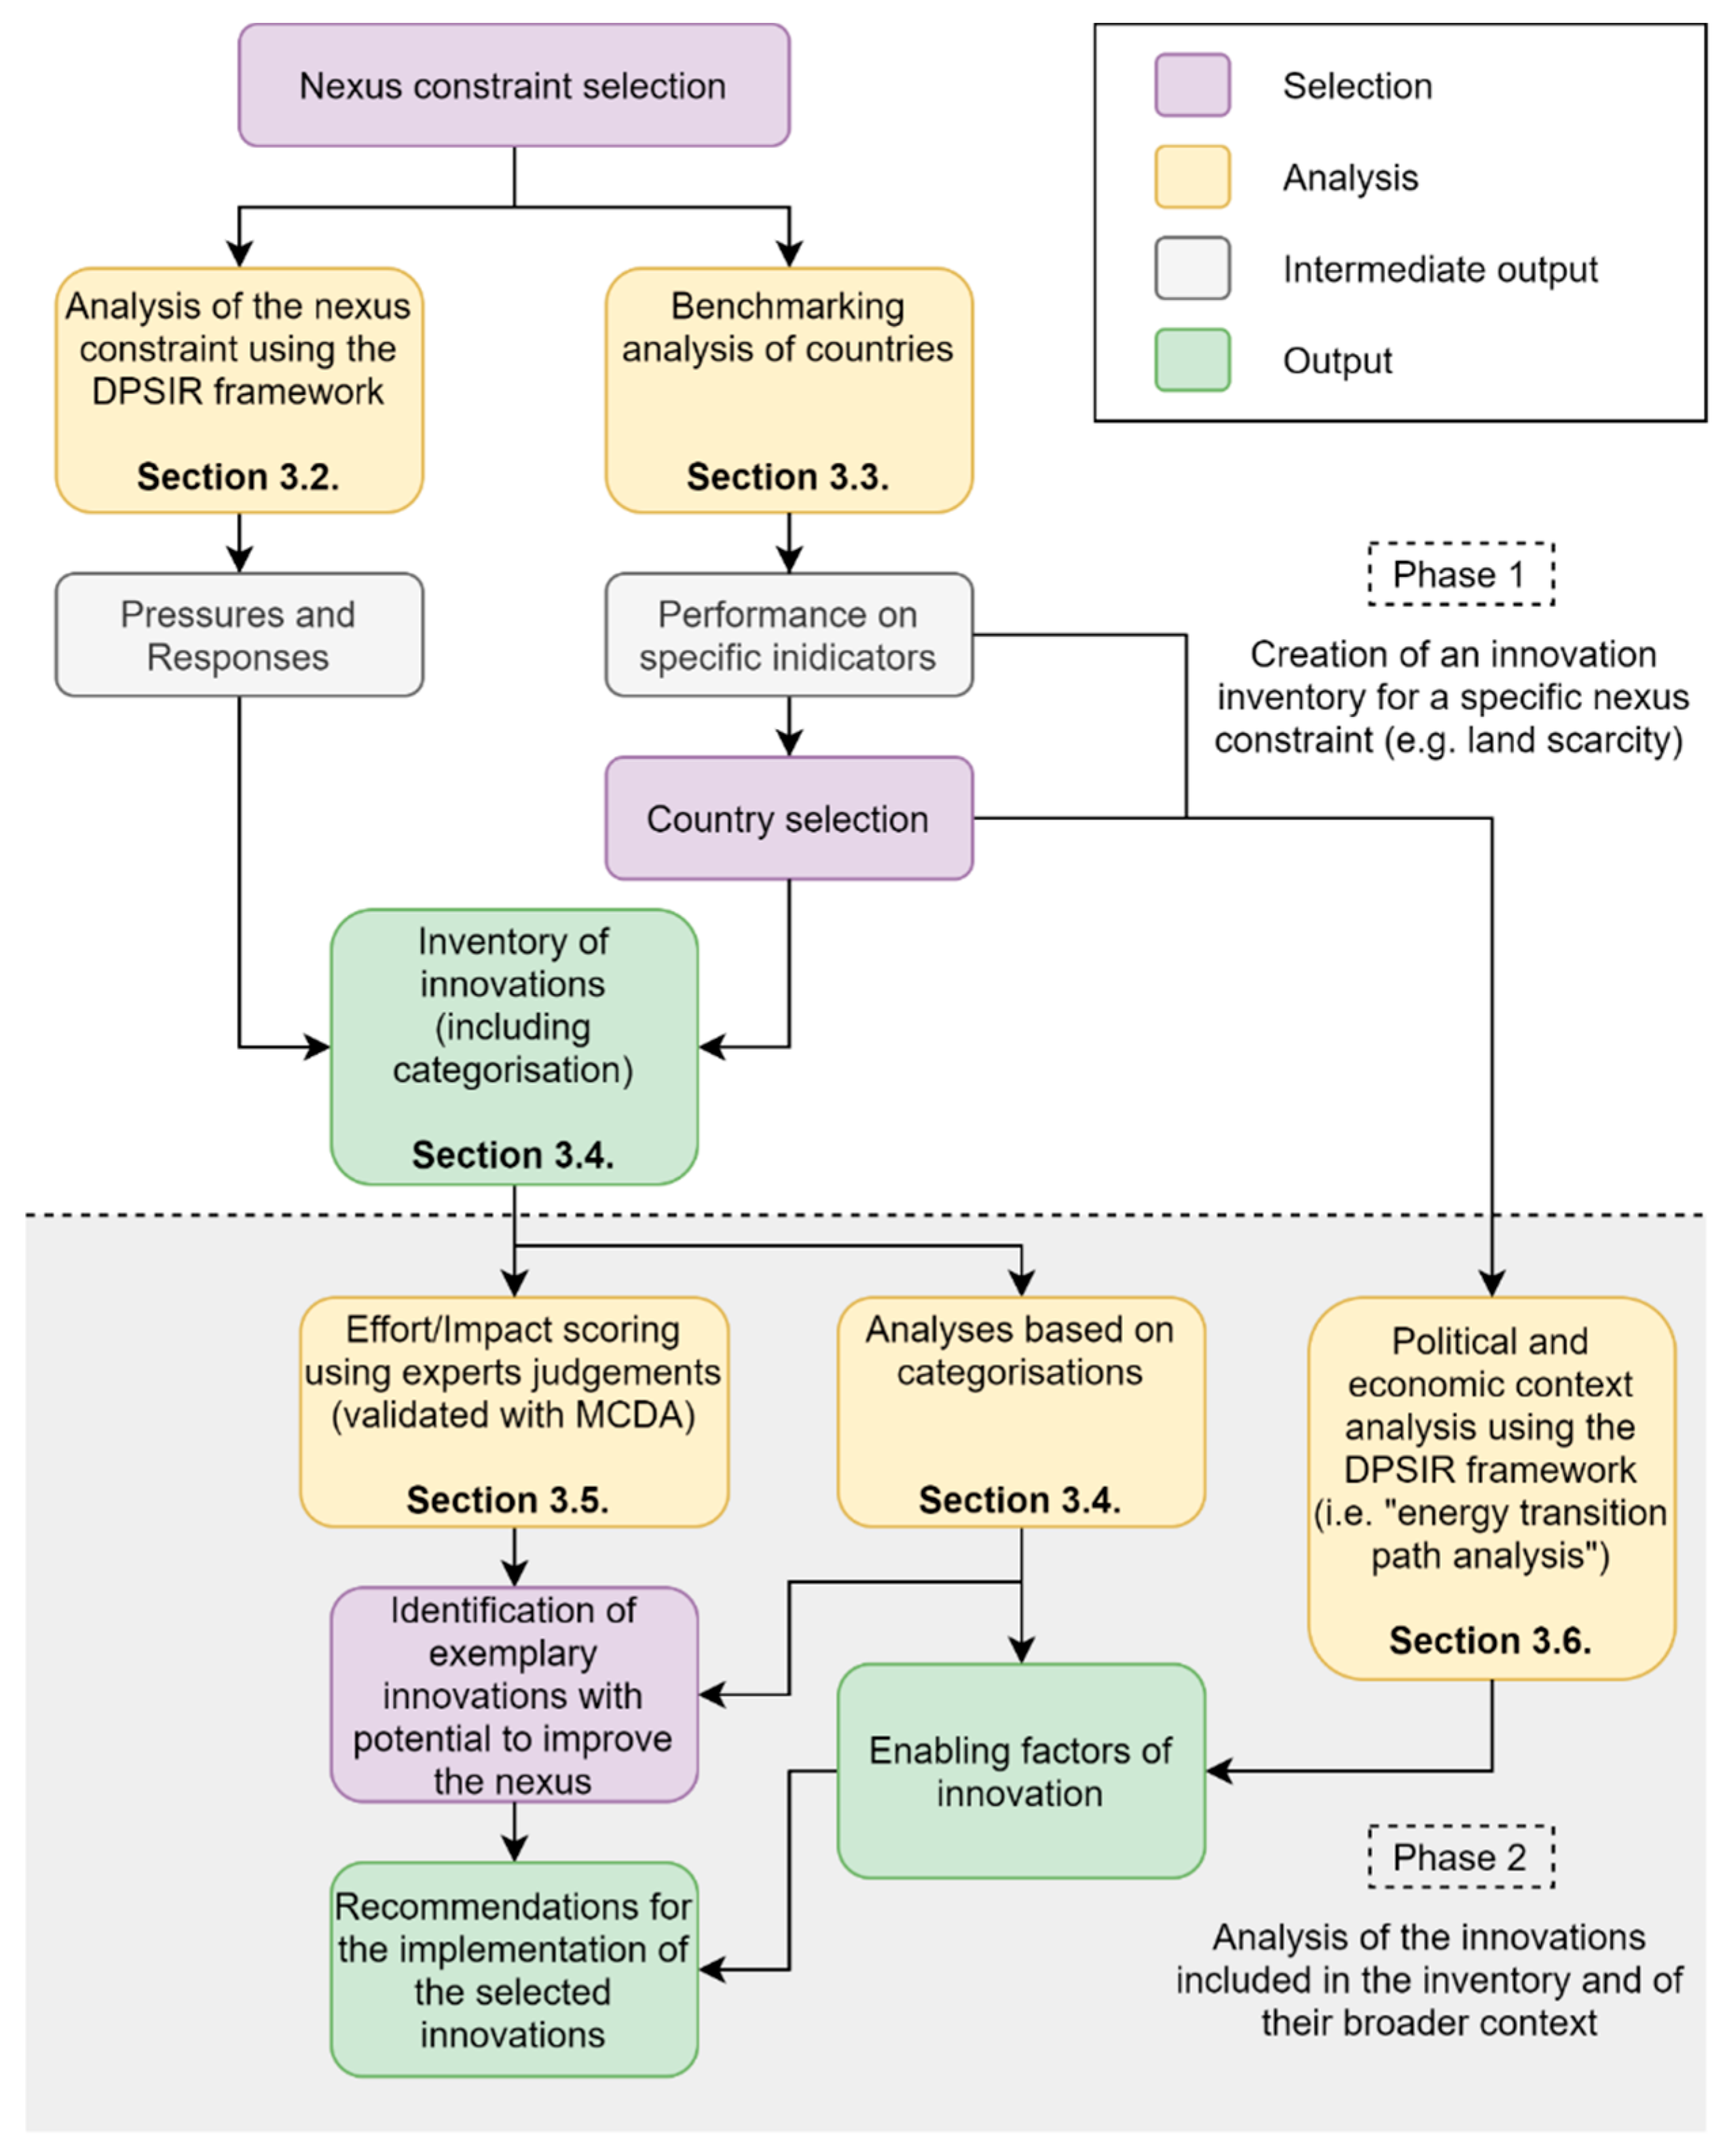
3.1. Methodology

A framework was developed to identify innovations for a specific context. A diagram of the methodology is presented in Figure 2, which shows an illustration of the framework developed and applied in this study. The research developed over two main phases: a first phase that resulted in the elaboration of an innovation inventory; and a second one, dedicated to the identification of relevant and promising innovations to address the constraint and challenge under study, and an analysis of the broader contexts to identify enabling factors of innovation at the national level.
More specifically, in the first phase, we developed an innovation inventory (upper part of Figure 2). The elaboration of the inventory started with the selection of a relevant constraint for a specific challenge. In this study, land scarcity in the Netherlands was considered the constraint for the challenge of the transition to a low-carbon economy. The Driver-Pressure-State-Impact-Response (DPSIR) framework [31], which is explained in more detail below, was used to deconstruct this constraint across the CLEWF nexus domains and to relate it to sectoral challenges, such as energy efficiency, mobility, etc. (see Section 3.2). We then identified a selection of countries that, despite facing different conditions, have transition challenges resembling those of the Netherlands. Such challenges include the need for more renewable energy, GHG emission reductions and improved energy efficiency (see Section 3.3). A benchmarking analysis was performed on the EU member states on several climate indicators. This analysis supported the selection of five countries to be considered as sources of innovation for the Netherlands. Next, a wide range of innovations from the selected countries and from within the Netherlands was compiled in an innovation inventory and described using several categorisations and indicators (see Section 3.4).
Innovations were found using scientific and grey literature [32,33,34,35,36,37,38,39,40,41,42,43,44,45,46,47,48,49,50,51,52,53,54,55,56,57], as well as several databases [58,59,60,61]. The consulted sources were found through a literature review on sustainable innovation, an internet search on national government websites and interviews with experts. The challenges identified through the DPSIR analysis of land scarcity in the Netherlands described below (in Section 3.2) were used as search terms (i.e. “renewable energy deployment”, “energy intensity of the economy”, “resource use and disposal”, “mobility” and “agricultural emissions”), along with other variants (e.g., “renewable energy generation”) and generic search terms on the selected countries (e.g., “German energy transition”). All technologies, business models, policies or social changes that were new to the Dutch context and related to land scarcity as a constraint to the challenge of decarbonisation (i.e., to one of the challenges identified through the DPSIR analysis described below) were considered “innovative”, and hence included in the inventory.
In the second phase, we analysed the innovations in the inventory in more detail (lower half of Figure 2), exemplifying how the inventory can be used to arrive at specific recommendations. First, we estimated the impact of each innovation on the challenge under investigation (i.e., the transition to a low carbon economy in the context of the land scarcity constraint) and the effort its implementation would require, using literature and the expert judgement of nexus scientists from across Europe and senior sustainability consultants from the Netherlands (see Section 3.5). A sample of scores was validated using Multi-Criteria Decision Analysis (MCDA). Three particularly promising innovations were identified based on their estimated impact and effort scores. These innovations were investigated further and, combining the insights of the “energy transition path analysis”, to understand what conditions favour (or lead to) innovation, recommendations for their implementation were made. The innovation inventory was also analysed, making use of its other categorisations and indicators, when available.
The sources that were consulted to find innovations fed into the work from another angle as well. All non-innovative developments that played a role in the “energy transition path” of each of the countries—the progress towards climate neutrality—were used to describe differences and similarities in the political and economic contexts of each of the countries (see Section 3.6). In addition, here, the DPSIR framework was used, as is described further in Section 3.6. The descriptions were summarised in an overview table and assisted with the understanding of which (aspects of) innovations are relevant across contexts. The table was also used to identify elements that relate countries that have been relatively successful in terms of the emergence or adoption of sustainable innovations, which resulted in overarching recommendations for stakeholders in the Netherlands.

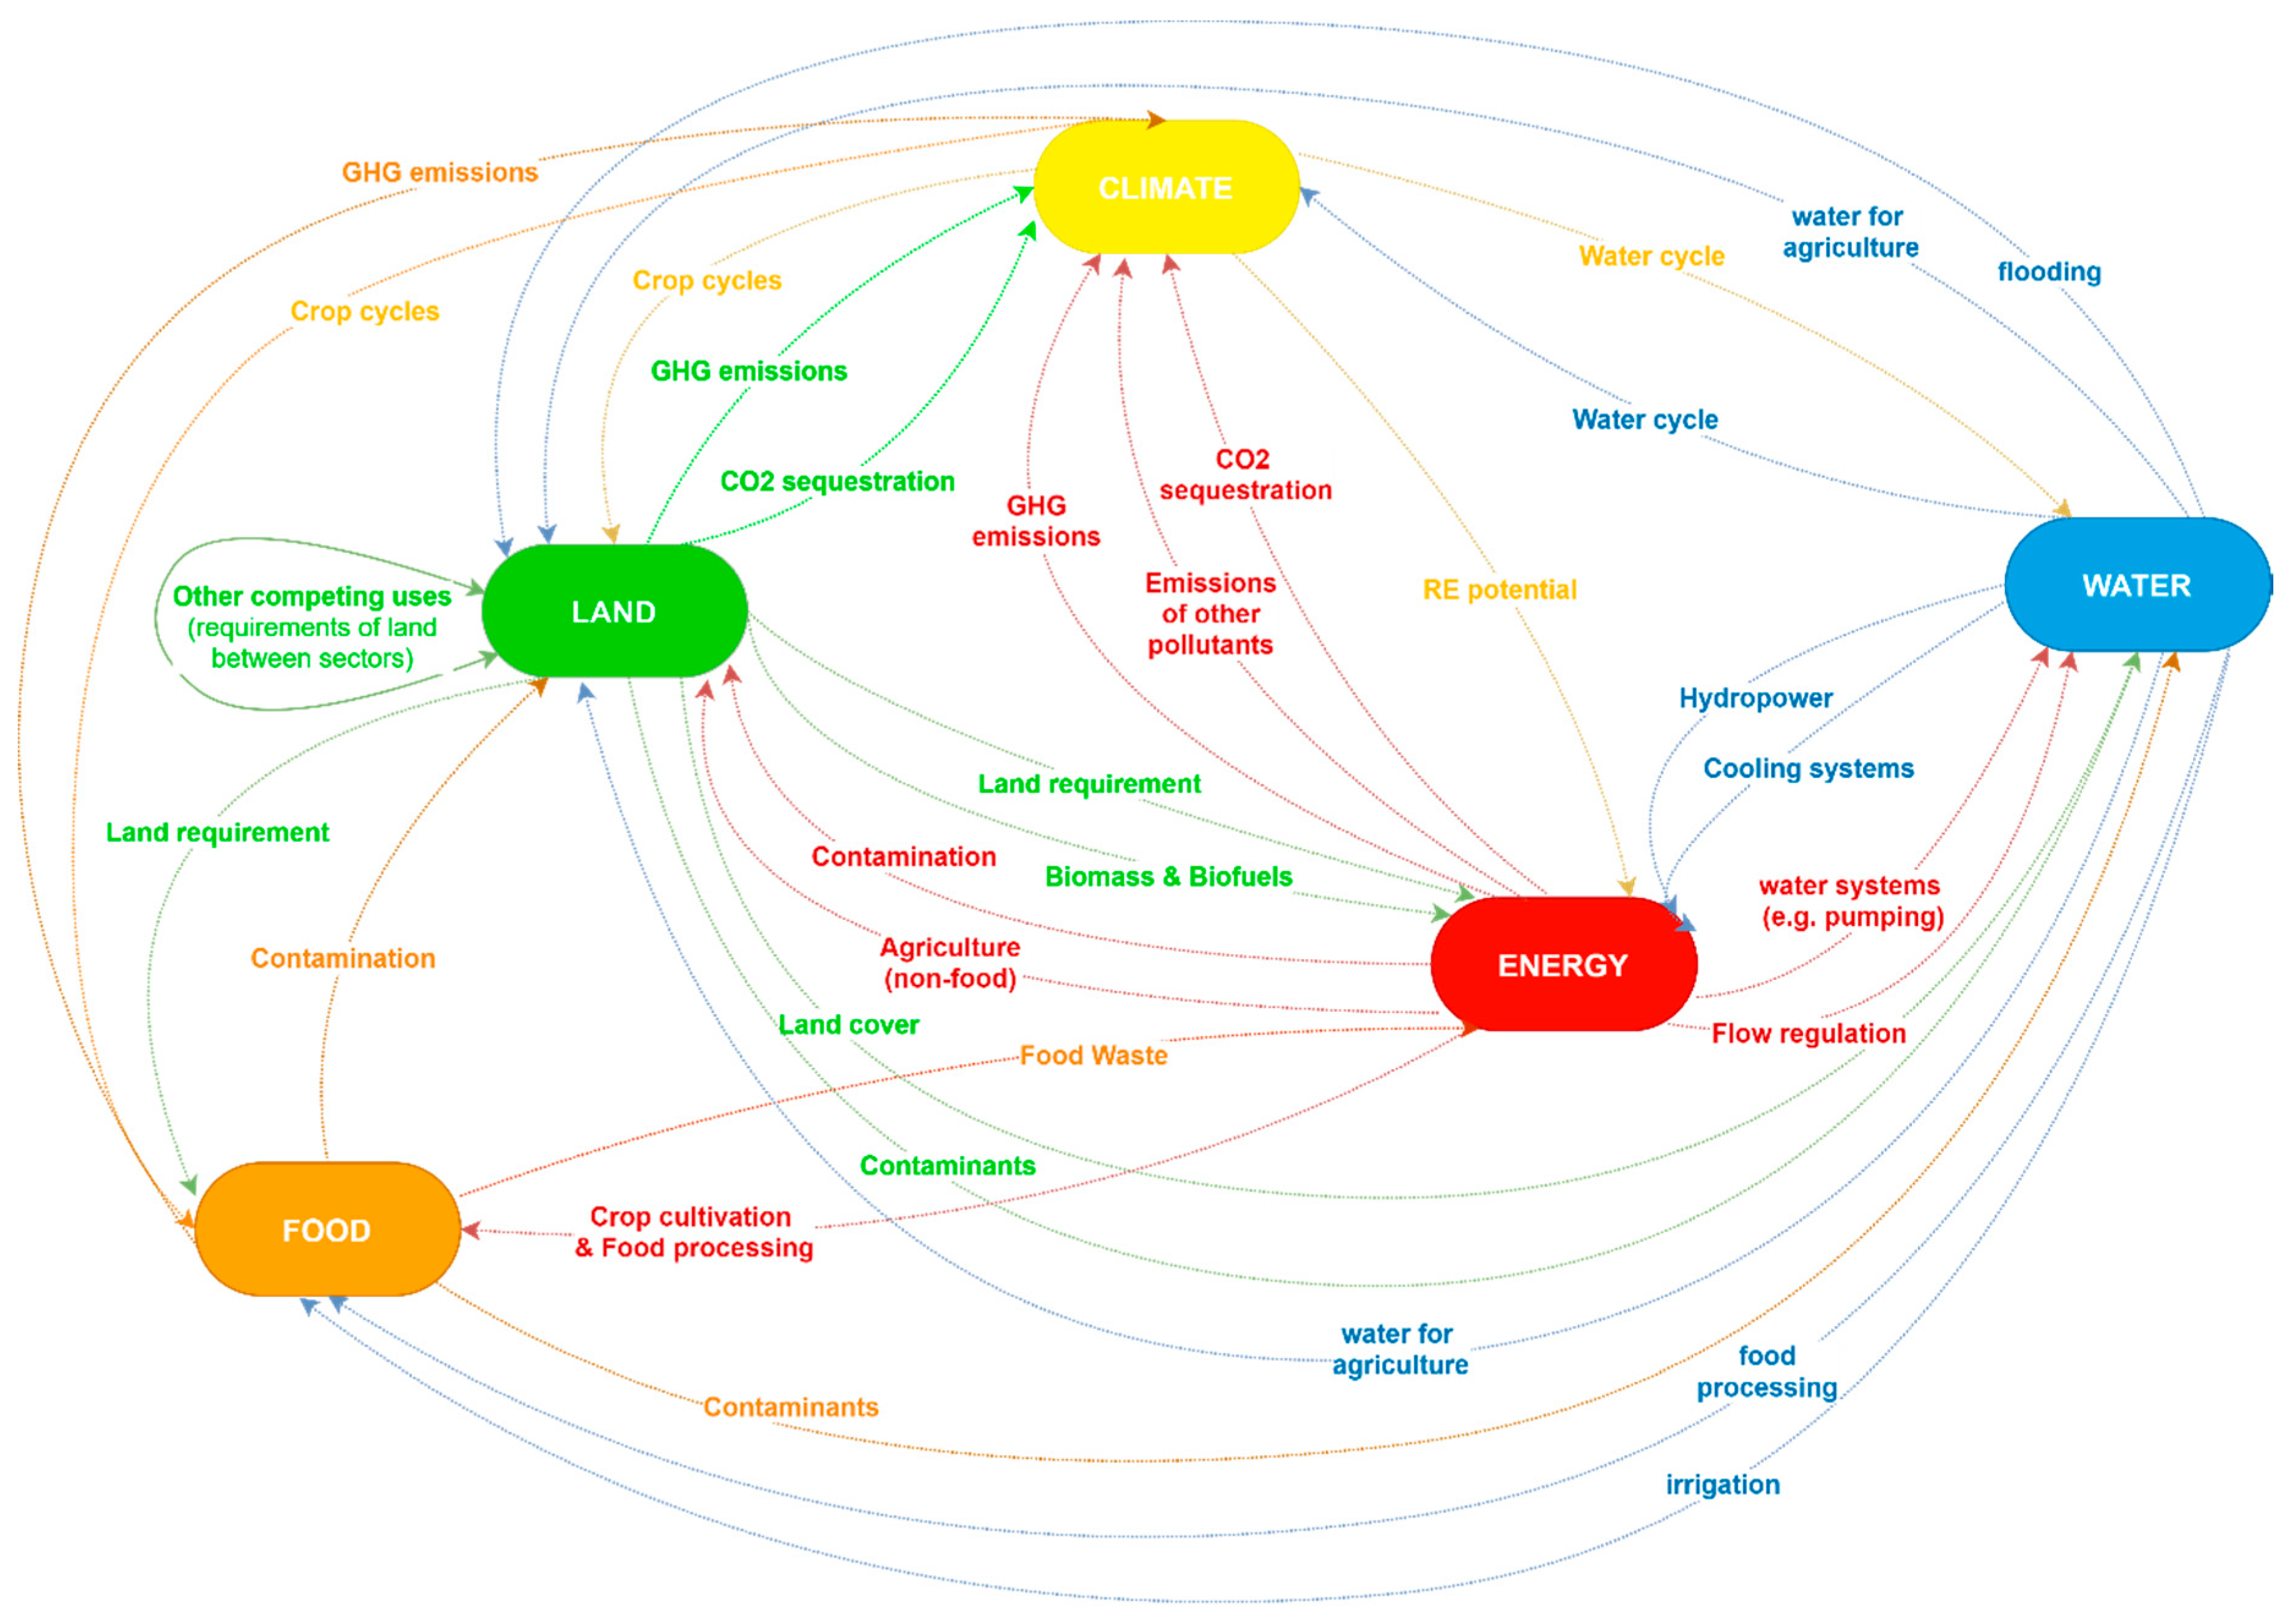
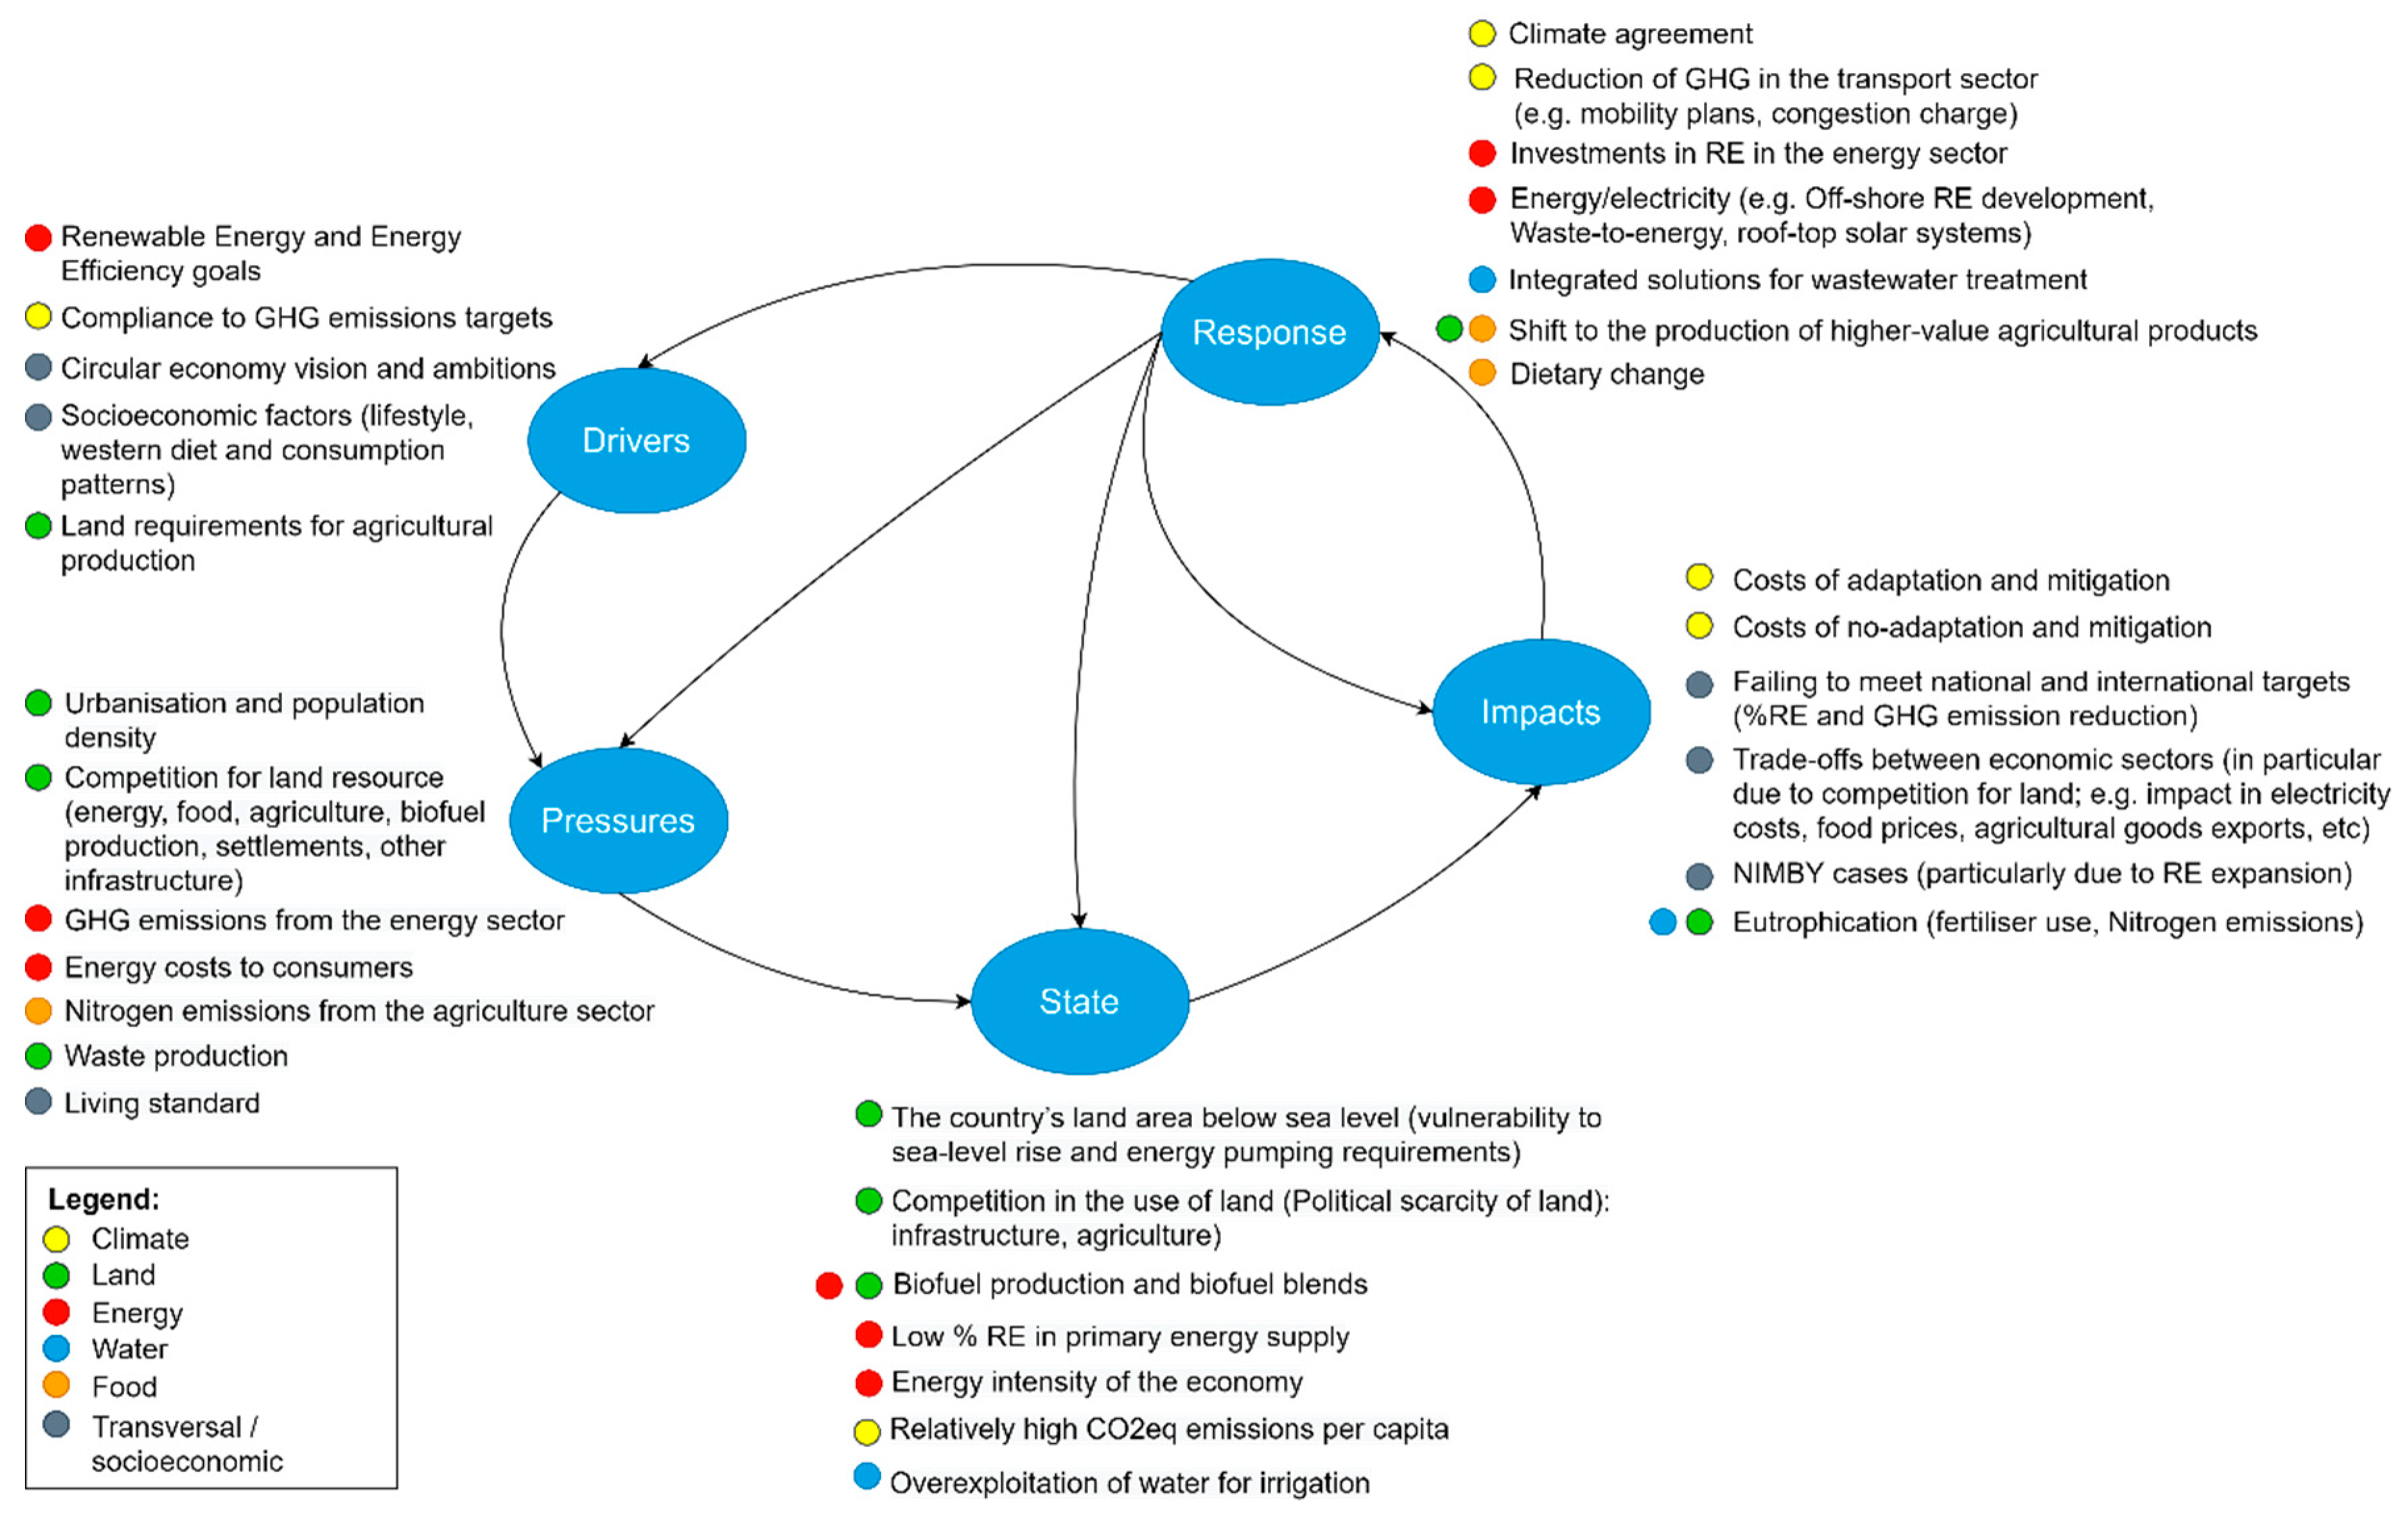
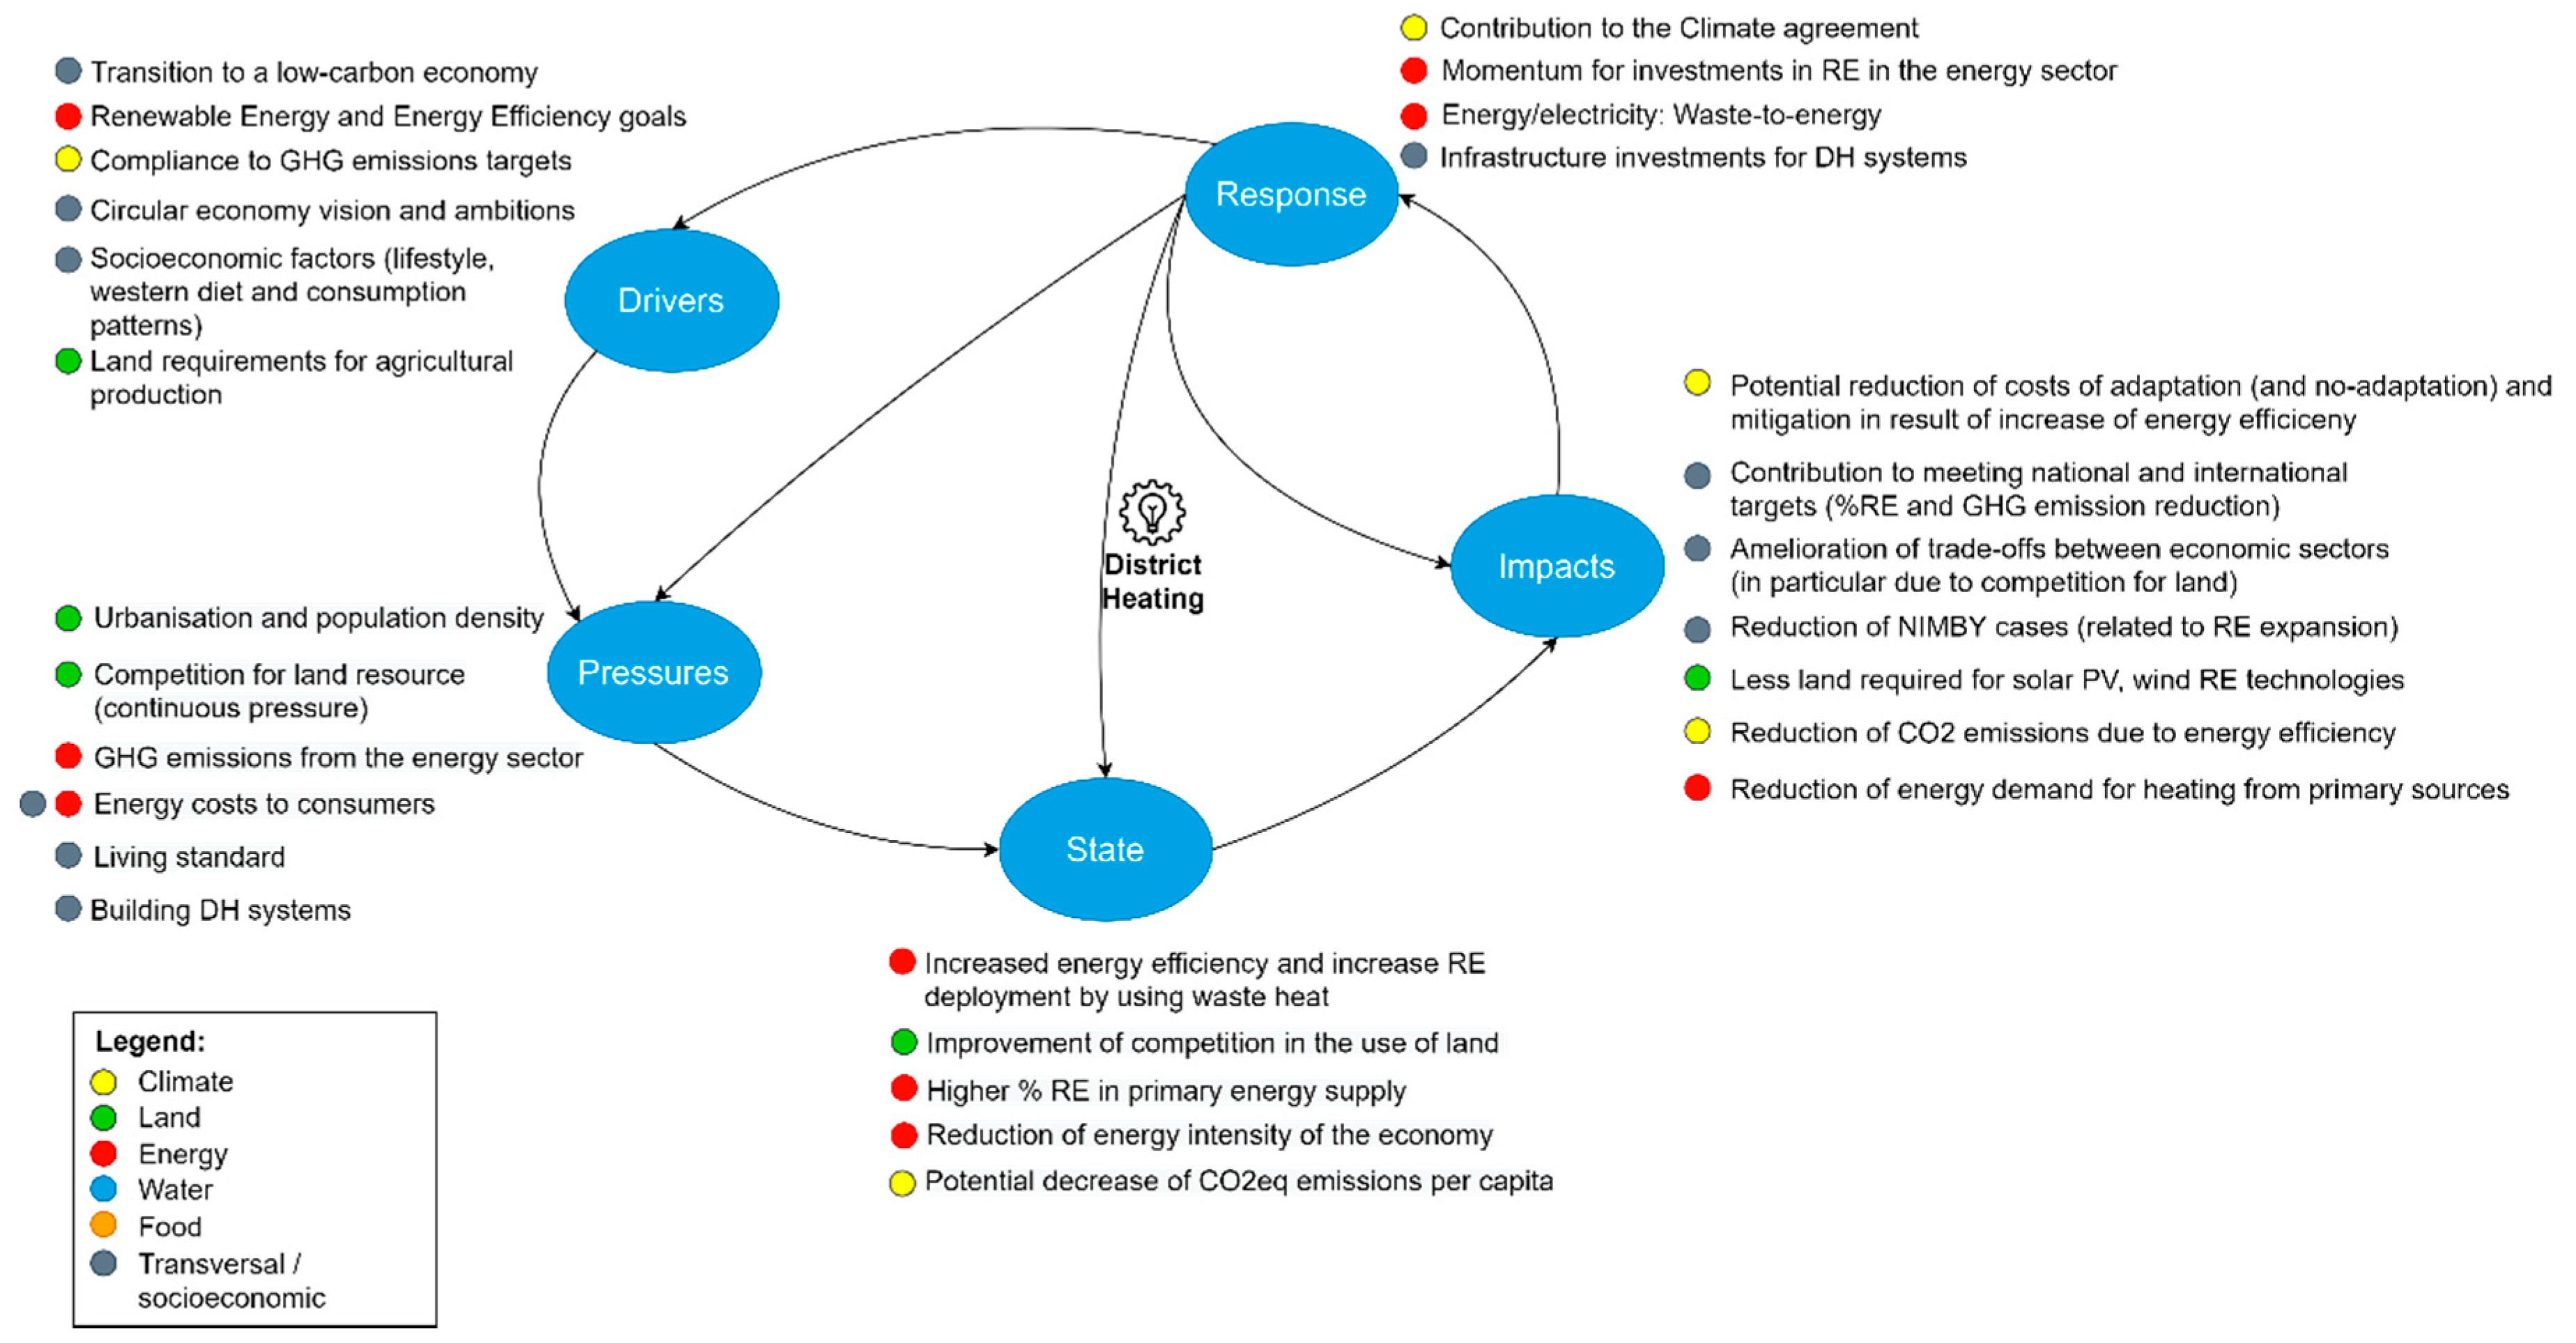
3.2. Application of the DPSIR to the CLEWF Nexus

The CLEWF nexus constraint of “scarcity of land” in the Netherlands was analysed using the DPSIR framework, a theoretical tool to break down complex and interrelated environmental processes into more tangible and quantifiable units [31]. Within the DPSIR framework, the environmental processes are understood to consist of a chain of causal links running from Driving forces, Pressures, States and Impacts to Responses [31,62]. All the “elements” that shape a certain phenomenon can be classified as either one of these. In the case of land scarcity, for example, renewable energy policy goals and consumption patterns drive the demand for land. The Drivers individually and collectively cause Pressures such as competition for land or greenhouse gas emissions. Pressures affect the State(s) of the system(s), which has an Impact on society that can in turn trigger Responses.
The DPSIR framework was combined with the nexus approach that we schematically present in Figure 3. In the figure, a colour code is used to identify the nexus domain to which different elements belong. An additional category to depict socioeconomic and transversal elements was added to the analysis, to classify elements which did not fall dominantly in any of the CLEWF domains.
The DPSIR analysis helped understand the dynamics of the CLEWF nexus within which land scarcity exists. As such, the exercise widened the range of innovations that could be searched for, because it clarified that innovations which address, for instance, energy efficiency or mobility challenges, could potentially be used to alleviate land scarcity as well.
A review of statistical information, academic and grey literature, and expert knowledge served to perform the DPSIR analysis under the context described. Information was compiled in a table format, and DPSIR elements were distributed over the different nexus domains. A simplified version of this table resulted in the elaboration of Figure 3. In the original table, the most important elements were supported, where possible, by an indicator [62]. Indicators were compared to European targets—or, if targets were unavailable, the EU-28 average was used. Those elements that recurred frequently, and for which the performance of the Netherlands was low compared to the European targets or average performance, were grouped into several challenges that are thus related to land scarcity: renewable energy deployment, energy intensity of the economy, resource use and disposal, mobility, agricultural emissions and multiple/other. (For example, the State (DPSIR) element of the Climate (nexus) domain, “resource footprint” (8100 kg/inhabitant, Position in the EU: 18th [63]), the Pressure (DPSIR) element of the Climate (nexus) domain “municipal waste per person” (560 kg/inhabitant Position in the EU: 20th [63]), and the Pressure (DPSIR) element of the Food (nexus) domain “food waste”—Approximated by organic waste: 873 kg/inhabitant Position in the EU: 28th [63]—were all grouped under “resource use and disposal”) These challenges were included as a categorisation of the innovations in the inventory and used as search guidance. The relation between these challenges and land scarcity can be a little unclear at first, but when considering the cross-system nexus implications of these issues, several relations become more obvious. A non-exhaustive list of examples for these relations to land scarcity is presented below:
  • Renewable energy deployment (e.g., renewable energy sources have larger spatial requirements than non-renewables);
  • Energy intensity of the economy/energy efficiency (e.g., demand for energy drives and demand for land to generate this energy on);
  • Resource use and disposal (e.g., waste recycling and circularity could not only reduce spatial requirements for landfills but, perhaps more importantly, reduce the demand for virgin resources and therefore mining);
  • Mobility (e.g., population density could form an opportunity for sustainable modes of transport rather than a challenge, yet the Netherlands is not necessarily a frontrunner on green mobility in Europe);
  • Agricultural emissions (e.g., food choices greatly affect land requirements for agriculture).

3.3. Benchmarking

The climate performances of the EU member states (EU-28) were assessed based on benchmarking using quantitative indicators. In business, “benchmarking” generally refers to the measurement of the quality of an organisation’s product or business practices and the comparison with standards or similar measurements of peers. The purpose of benchmarking is to identify where improvements can be made and to learn from how other organisations reach their performance levels [64,65,66,67]. Here, the climate performance of the Netherlands is compared to its targets and the performance of other EU member states and their targets. As in benchmarking in business, the purpose is to identify the aspects in which specific countries could serve as best practice examples.
The benchmarking exercise adhered to a three-fold categorisation: reducing GHG emissions, increasing the share of renewables in the energy mix and increasing energy efficiency. Within the national EU targets for GHG emission reductions and renewable energy generation in 2020, the countries’ starting points, potential and economic conditions were taken into account [9]. For energy efficiency, instead, an EU-wide target of 20% improvement was considered, and individual member states set their own indicative national energy efficiency targets. The progress on GHG emission reductions was compared using the relative change to the base year (2005) in 2017, and by comparing this to the 2020 targets (under the Effort Sharing Decision) [68,69].
Furthermore, the absolute levels of GHG emissions in tonnes of CO2 equivalent per capita in 2016 [70] were compared across member states regardless of the targets set. The shares of renewable energy generation were benchmarked using 2017 values, by comparing them across countries and with the national renewable energy targets for 2020 set at the EU level under an earlier version of the Renewable Energy Directive [9,71]. Energy intensities of the economies were compared using the energy intensity of GDP as an indicator (in kg of oil equivalent per 1000 Euros of GDP) [72]. Five European countries were selected based on their performance as well as their expected relevance as best-practice examples for the Netherlands: Belgium, Denmark, Germany, Latvia and Sweden. These countries, and the Netherlands itself, served as sources of innovations for the rest of the study. Concerning the “expected relevance”, neighbouring countries were selected regardless of the existence of countries that scored higher in the benchmarking analysis. That was done not only because of climatic and cultural similarities but also because the Netherlands, small as it is, has a relatively large share of border-regions, in which there is a natural tendency for social, technical and intellectual interaction.

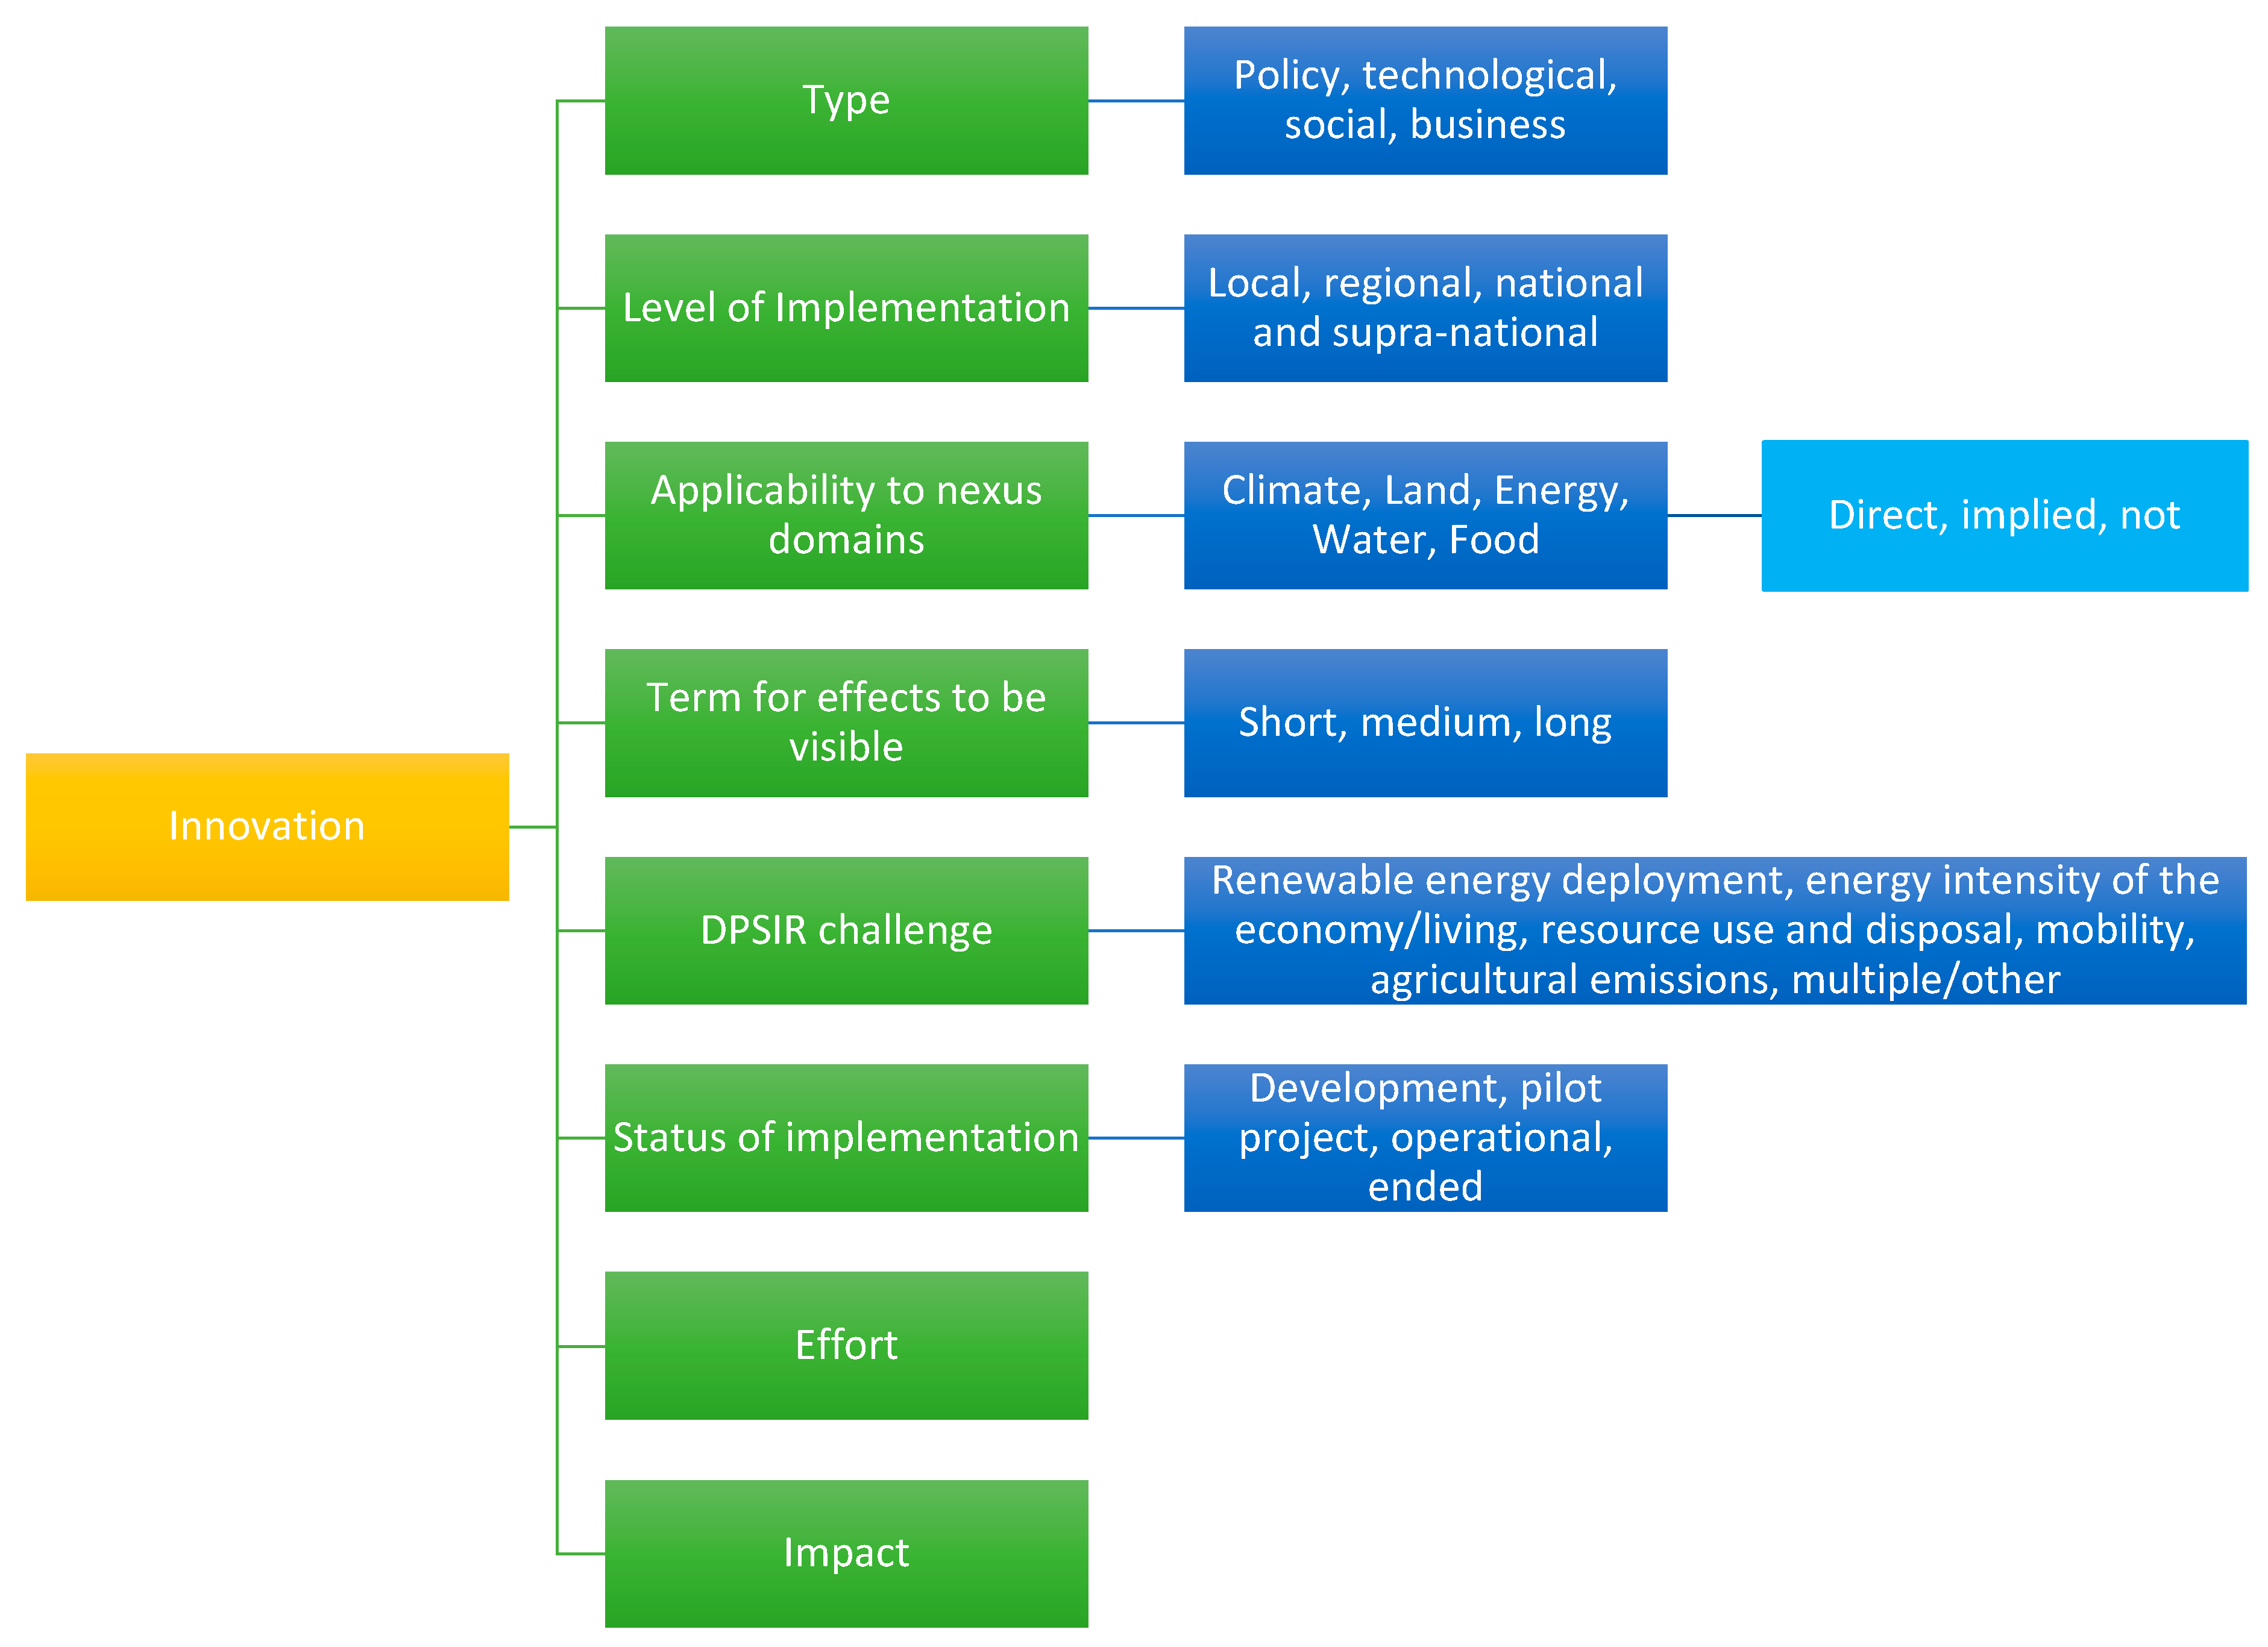
3.4. An Inventory of Innovations for the Dutch Nexus

The inventory was designed in such a way that innovations could be searched for and categorised in different ways. For individual innovations we registered aspects such as innovation type, direct and indirect relations to nexus domains, maturity level, the estimated effort required, the impact on climate indicators (see Section 3.5) and the geographical level at which implementation is possible (see Figure 4).
Policy innovations were identified in two ways. First, a literature review of policy documents, policy reports (e.g., national energy outlooks) and academic papers from and about the selected countries was performed. Secondly, three databases kept by the International Energy Agency (IEA) and the International Renewable Energy Agency (IRENA) were used to systematically include relevant policies introduced from 2009 onwards: the Climate Change Policies and Measures database, the Renewable Energy IEA/IRENA Joint Policies and Measures database and the Energy Efficiency Policies and Measures database [58,59,60]. We considered mostly database entries from 2009 onwards, as these are expected to be the most relevant for the performance regarding the 2020 goals. Moreover, determining policies up to 2009 are expected to have been covered by the literature (and thus to be already included in the list). All the elements encountered in the literature or databases were either included as an innovation in the inventory or, if non-innovative (e.g., public concerns about nuclear power or the division into regions in Belgium), considered for the “energy transition path analysis” as a driver or response (see Section 3.6). For technical innovations, in particular, information about the number of green patent families in different areas of research was included in the inventory. These were taken from the Green Tech Database website (https://www.greentechdatabase.com/), developed by Perruchas [61]. The website interface is mainly supported by data from PATSTAT [73]. Some examples of specific technological innovations were also included in the inventory. Business innovations were found primarily in news articles and through web searches.
The inventory can then be used to select particularly promising innovations for a specific stakeholder in the nexus under investigation.
In this study, an inventory was created for the land scarcity constraint of the Netherlands, stating the innovation’s name, origin, type and most relevant DPSIR-CLEWF challenge. In addition, the relevance to each nexus domain was indicated on a three-step scale: “Yes” for innovations that are directly applicable to the domain, “Implied” for directly applicable innovations and “No” for innovations that are not applicable. Several other categorisations were considered to capture the characteristics of each innovation with sufficient detail for the analysis (see Figure 4). For example, the timespan for the expected effect to occur was divided into short (before 2023), medium (before 2030) or long- term (after 2030) effects. The level of implementation of innovations was indicated as “development”, “pilot project”, “operational” or “no longer operational”. Furthermore, scores from 0 to 10 were estimated to reflect the impact of an innovation on climate targets as well as the effort required for its implementation (see Section 3.5). In the case of “effort”, a low score is positive, while for “impact”, a high score is positive.
The contents of the innovation inventory were analysed by producing graphical visualisations using the categorisations and scores in the inventory. The impact/effort scores analysis, in particular, supported the identification of three particularly promising innovations to address the land scarcity issue in the Netherlands. These innovations were investigated further, and recommendations were made for their implementation. It is important to note here that these scores were assigned considering the point of view of regional actors in the Netherlands. For other stakeholders or priorities (e.g., the national government), other innovations could be identified from the inventory by using different criteria in an MCDA to assign the effort and impact scores.

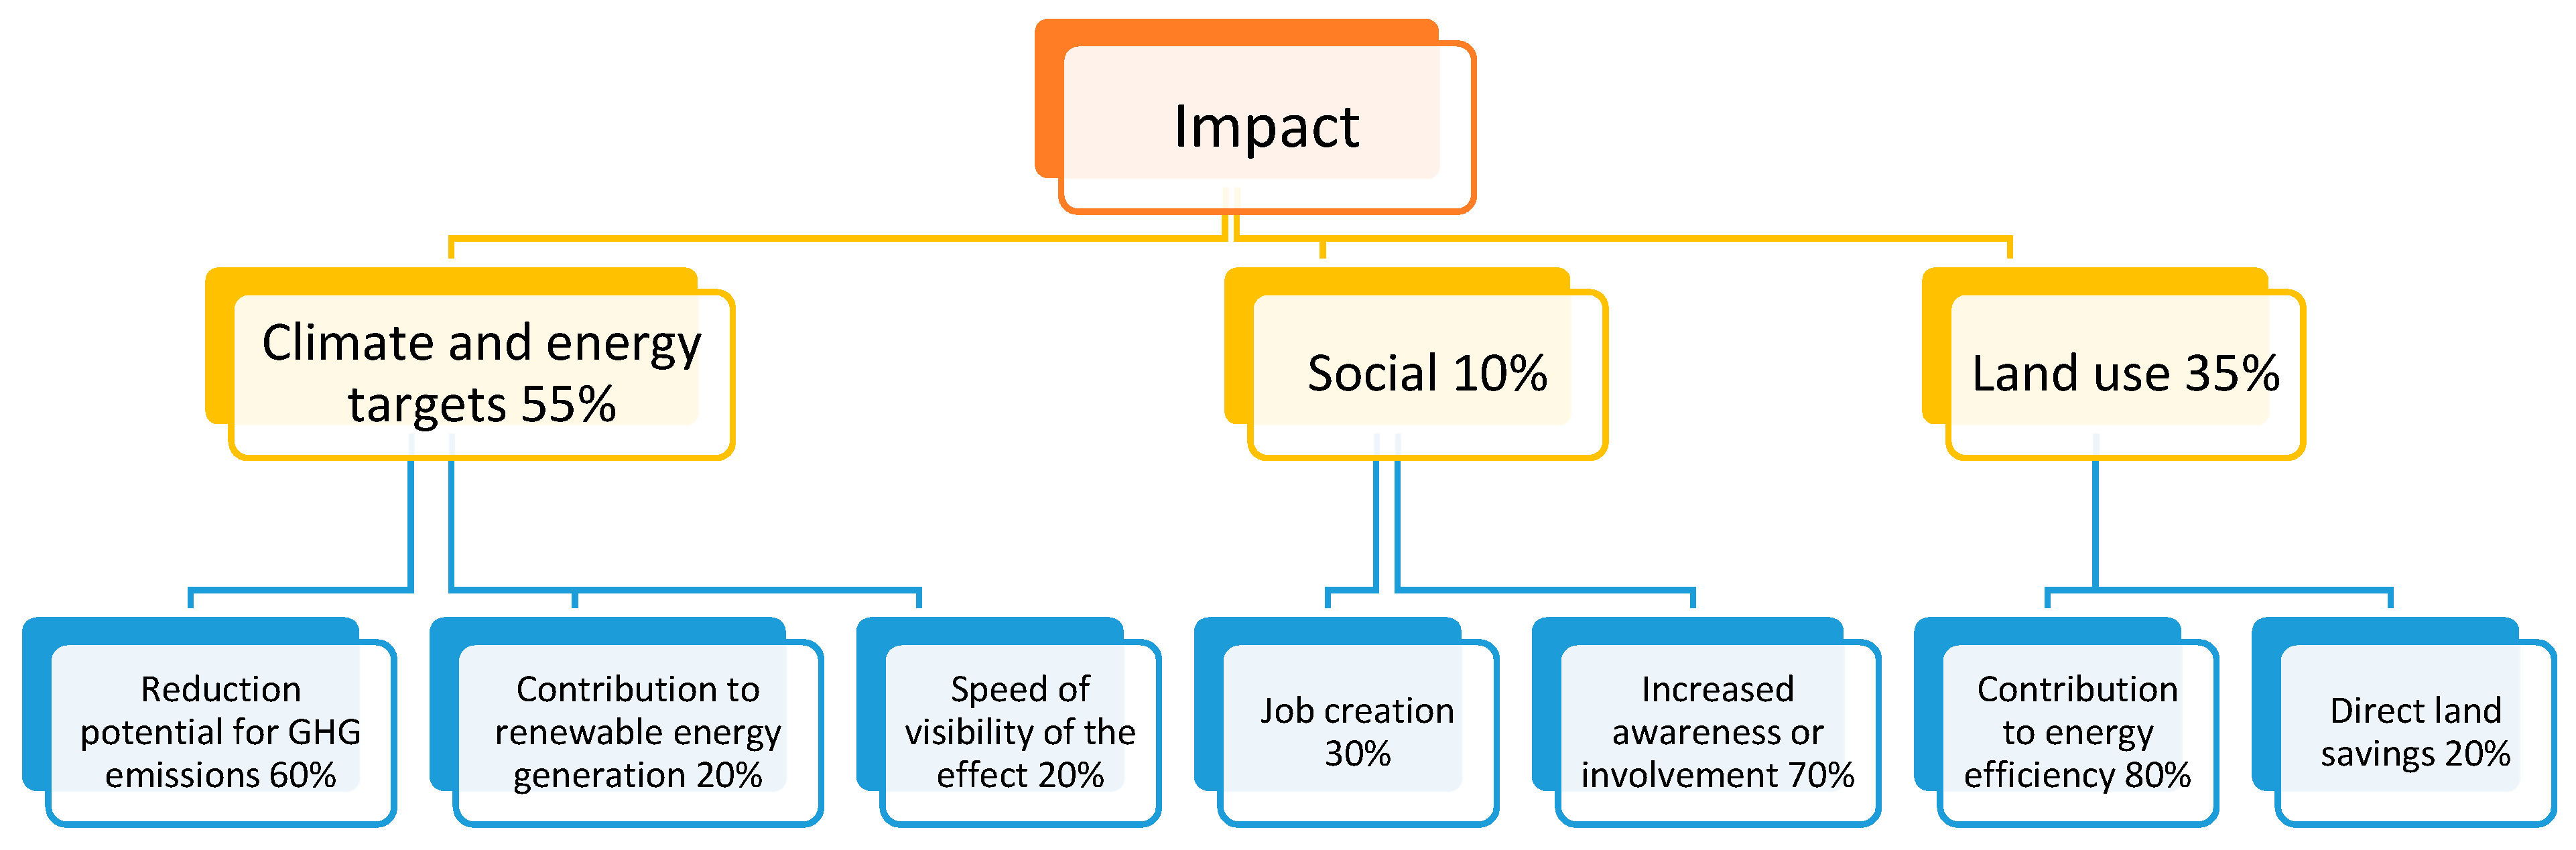
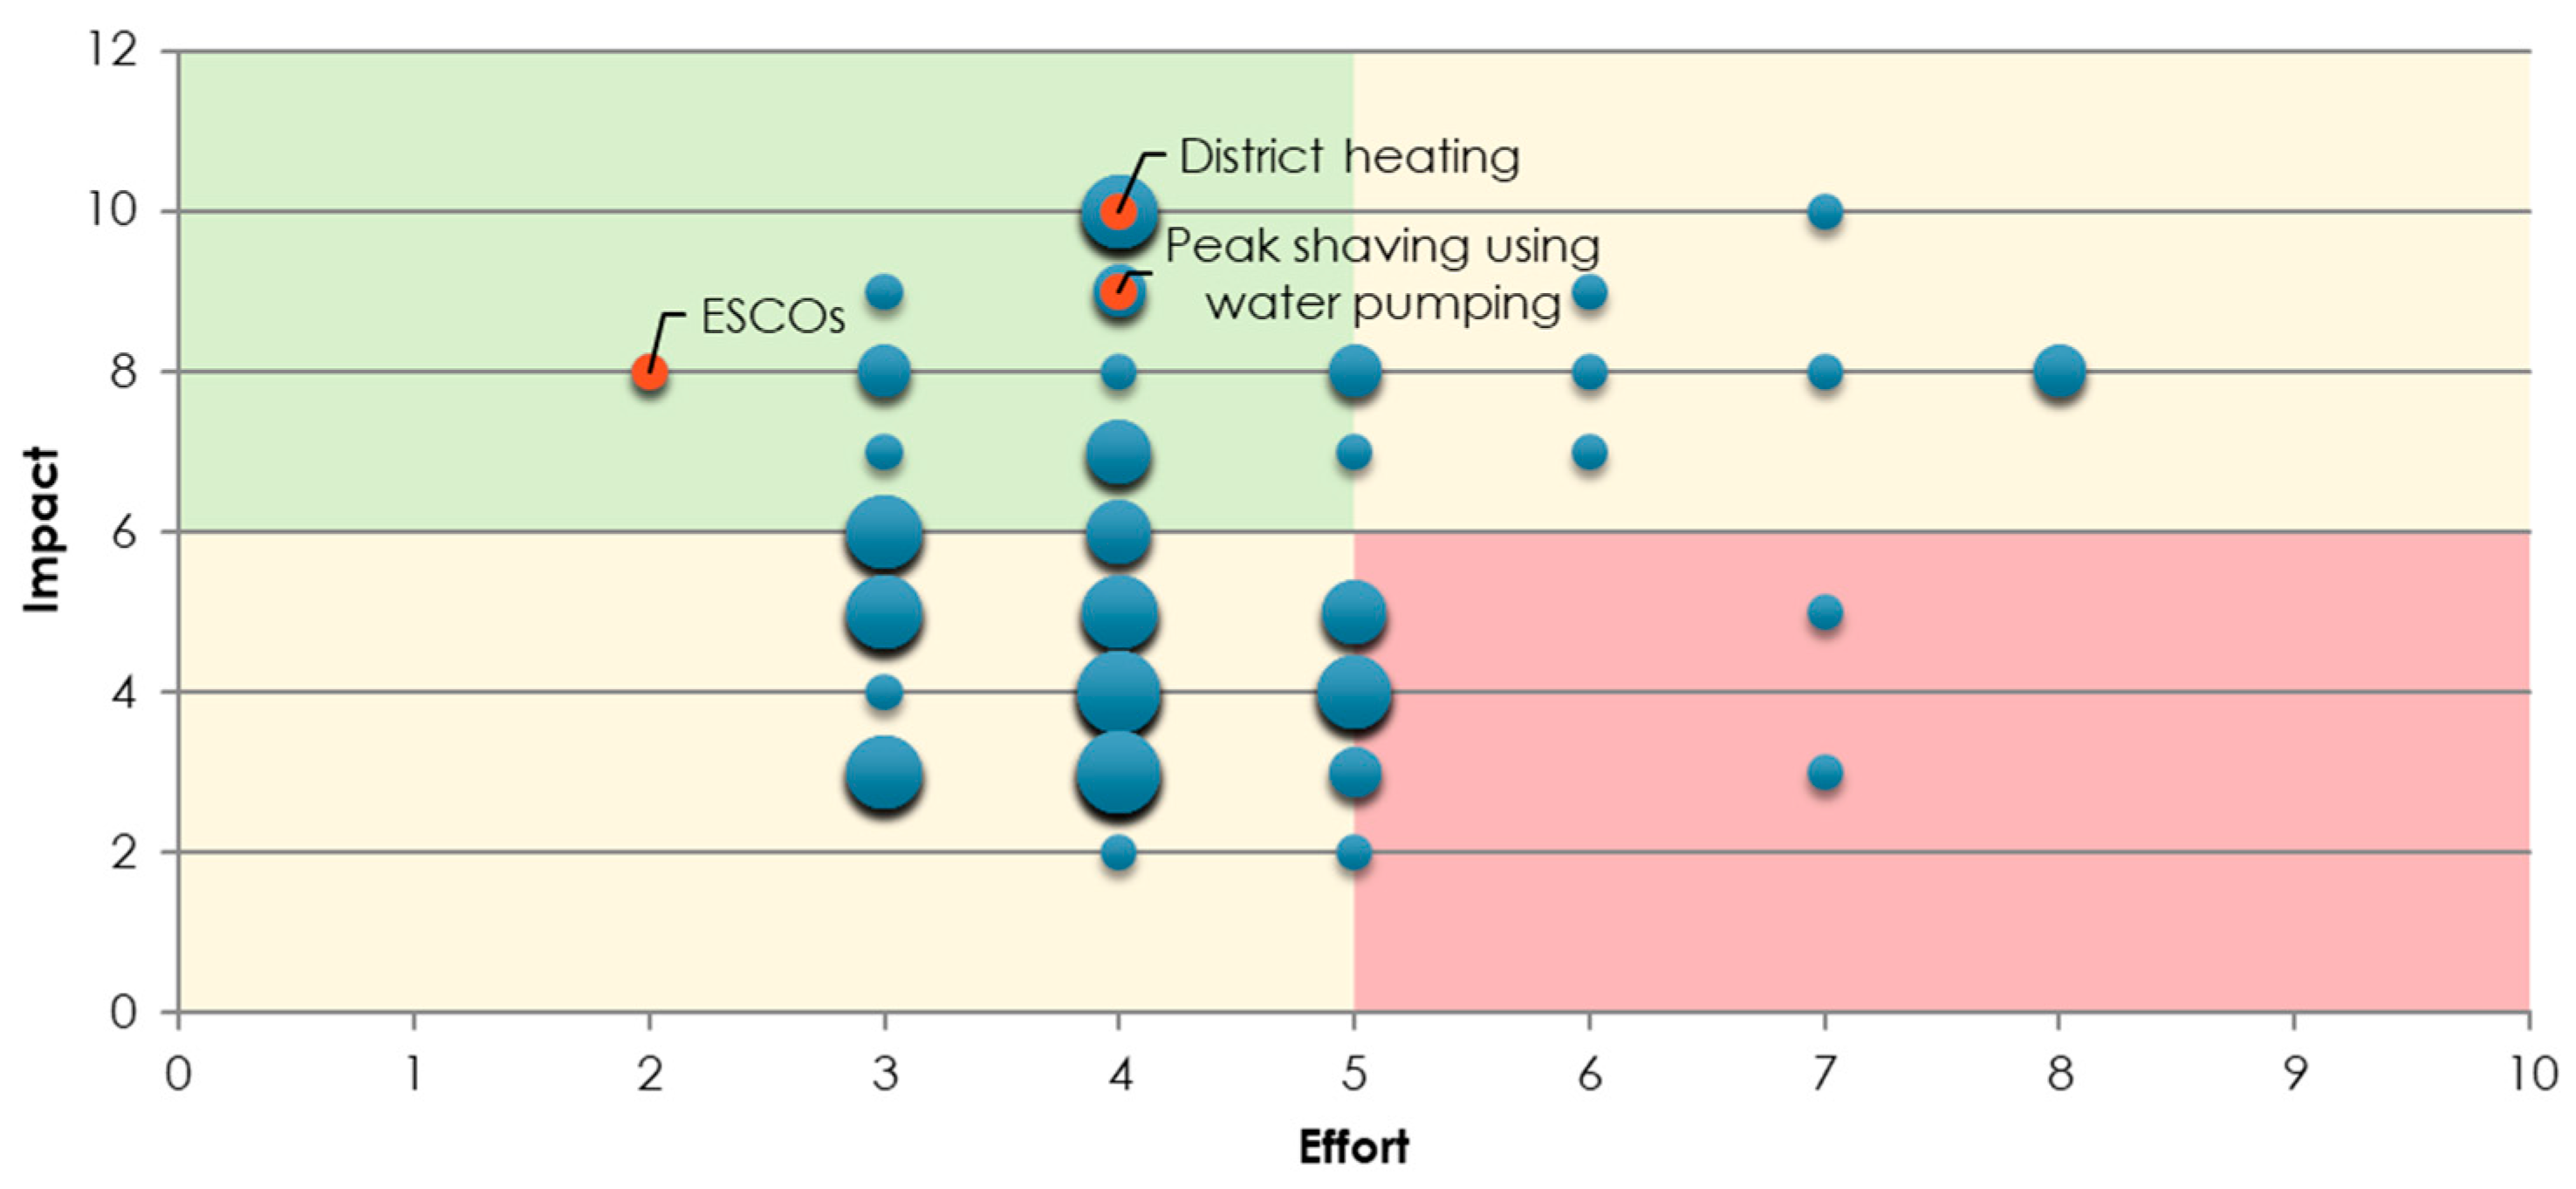
3.5. Impact/Effort Analysis

As was explained in Section 3.2, innovations were searched for based on the elements of land scarcity that were identified in the DPSIR analysis of the CLEWF nexus. As such, all innovations included in the inventory address element(s) of land scarcity. However, the extent to which they have an impact on climate targets, hereafter “impact”, might vary from innovation to innovation, and so might the effort it would require to implement them, hereafter “effort”. Both of these are important parameters for any stakeholder that plans to invest time, money and/or other resources into developing an innovation. Scores from 0 to 10 were assigned to each innovation for both “impact” and “effort” and were added to the inventory, to support the identification of particularly promising innovations.
Assessing the impact of an innovation on climate targets requires time and is not a simple process, because causality is hard to distil or because the effect takes place at a later point in time or in a different location. Moreover, the effort required to implement a certain innovation is difficult to measure [74]. It is related to various factors, such as costs and time, but also the inertia of the existing socio-technical system, which is, among other things, constituted by existing policies, infrastructure and stakeholder configurations [75].
Nevertheless, instead of measuring the latter factors, both impact and effort could be estimated in a consistent way by making use of Multi-Criteria Decision Analysis (MCDA). This approach to assigning one value to a phenomenon that consists of many different aspects makes the process and considerations transparent. On top of that, it allows for the inclusion of weighting factors that can be adjusted based on the stakeholder involved [76]. Ideally, all impact and effort values in the inventory should be estimated through MCDA, implemented with stakeholder involvement. In this study, however, impact and effort scores were estimated heuristically using the literature and the expert judgement of nexus scientists from across Europe and senior sustainability consultants from the Netherlands. A sample of scores was validated using MCDA, to confirm the accurateness of the estimated scores and to show what kind of criteria and weighting factors could be used to estimate the effort and impact scores. For the sample considered, the MCDA analysis and the direct attribution of values coincided in their results. Therefore, both approaches could be valid. However, as this could also have been a coincidence, more cases of the application of the MCDA and the direct attribution would have to be compared to verify that the approaches converge in terms of results.
This analysis is shown in Table 1 and Table 2 and is based on the decision trees of Figure 5 and Figure 6. The criteria and objectives were decided upon based on discussions with a regional consultant. All criteria scoring was done on a scale from 0 to 10, with 10 being the most preferable. For criteria such as “number of stakeholders involved”, the scoring does not represent the absolute number of stakeholders involved but rather whether they are few (closer to 0) or many (closer to 10). A high score thus always represents a preferable option over a low score. However, for effort, the final values were reversed in the innovation inventory, so that a low value does indeed indicate a low effort required.
It should be noted that perceived impact and effort are stakeholder-specific, for example because of different priorities or capabilities, reflected in different impact and effort scores, respectively. In this study, the scores were determined for the sake of identifying innovations that could be implemented by a regional Dutch consultancy. If the framework were applied with other stakeholders (e.g., private, public, civil society), the outcome of the scoring could differ. The inventory can as such be adapted to identify innovations particularly worth considering for different stakeholders.

3.6. Energy transition Path Analysis

The five countries that served as sources of innovations were also analysed regarding their political and economic contexts, drawing from the same literature and databases that were consulted to find innovations. A broad selection of “non-innovative” elements that played a role in the countries’ progress towards their current climate performance—their “energy transition paths”—were identified. These elements were then analysed using the DPSIR framework that was first introduced under the nexus challenge analysis. A summary table of the “energy transition path analysis” is presented in Table 3.
The analysis was conducted for two main reasons. Firstly, as innovations do not exist in a vacuum, societal contexts were deemed important to understand the relevance of innovations across contexts, and thereby supported the formulation of recommendations on the implementation of the three selected innovations. Secondly, the “energy transition path analysis” itself led to overarching recommendations for Dutch policymakers and other stakeholders, as it helped to identify elements that relate the countries that have been relatively successful in terms of the emergence or adoption of sustainable innovations.

4. Results

The contents of the innovation inventory that was created for the Dutch constraint of land scarcity are summarised in the first paragraphs of Section 4.1. Subsequently, three particularly promising innovations are identified based on their estimated effort and impact scores. Section 4.2 describes the analysis of the countries’ energy transition paths.

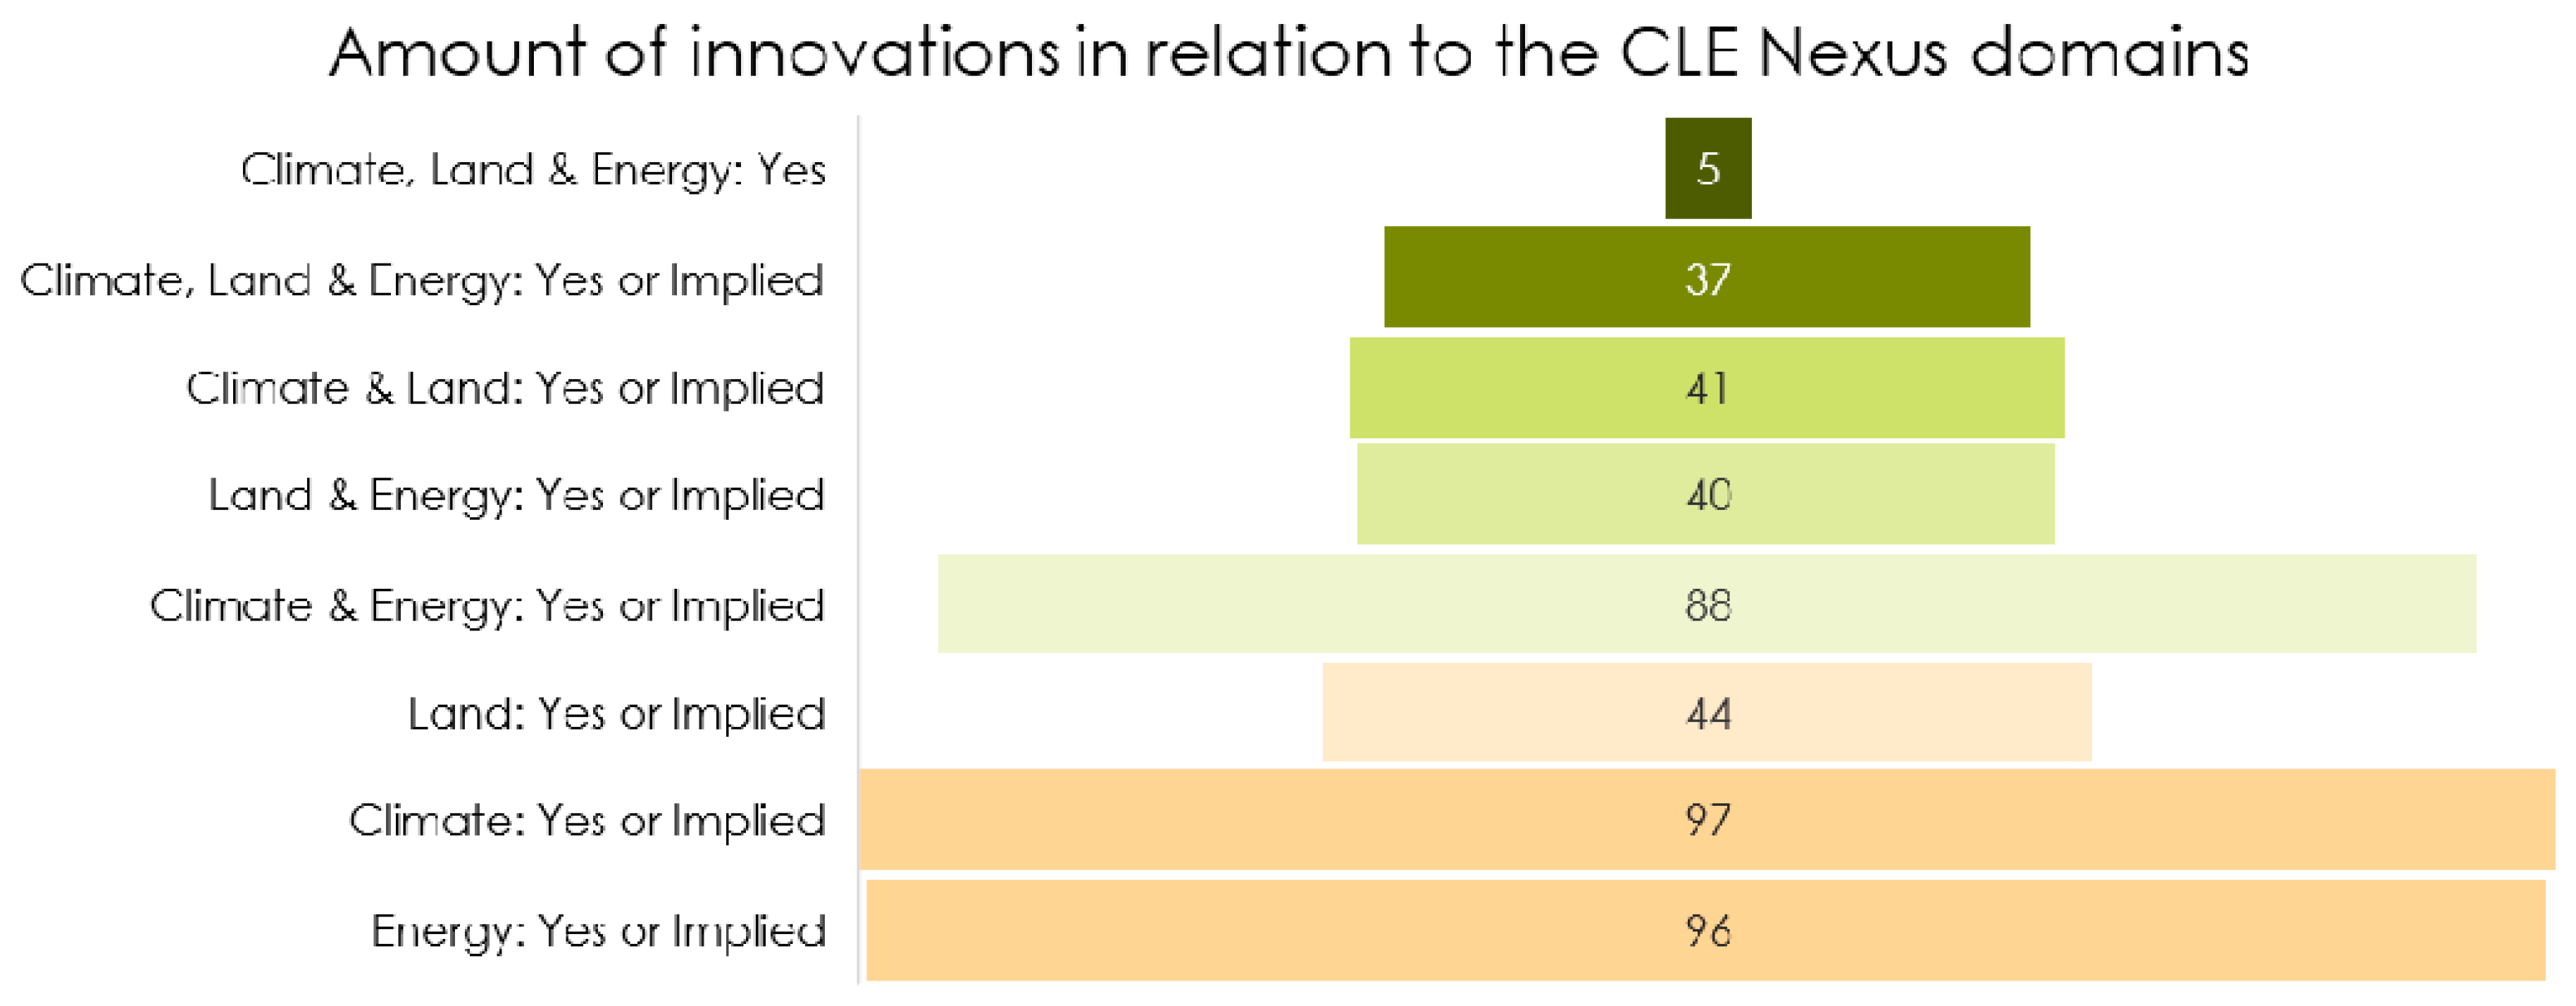
4.1. Contents of the Innovation Inventory

A total of 75 innovations from the six countries (including the Netherlands) were identified, listed and categorised. Of these, 7, 8, 24 and 36 were classified as social, business model, technical and policy/institutional innovations, respectively.
The complete list of innovations was also analysed based on the applicability to the different nexus domains. Although all five CLEWF domains were taken as a starting point in the study, the largest part of the innovations did not directly or indirectly relate to the Water or Food domains. Therefore, solely the prevalence of innovations related to the first three domains (CLE) are presented here, and an overview of the distribution is shown in Figure 7. Only five innovations are directly applicable to all three domains simultaneously. If, however, “Implied” relations are also counted, this number increases to 37. The third and fourth bars from the top in Figure 7 show the number of innovations that have some (direct or implied) applicability to the land domain and one of the other two domains. To facilitate comparability, the fifth bar from the top shows the number of innovations that have a direct or implied applicability to both Climate and Energy. The bottom rows show the total number of innovations that have direct or implied applicability to one of the domains.
All innovations included in the inventory were plotted based on their effort and impact values, as shown in Figure 8. A large number of entries fall into the upper-left green quadrant of the plot, indicating that the effort required for their implementation is estimated to be low and their impact on progress towards a low-carbon economy high. For each innovation, the ratio of impact over effort was calculated. Each type of innovation was then ranked from high to low based on this ratio. Considering that all innovations in the inventory were found based on the analysis of land scarcity as a constraint within the Dutch nexus and that the effort and impact scores were assigned considering the Dutch context, these ratios helped to identify some of the most promising innovations within the inventory.
Three innovations were selected to investigate further: District heating (the innovative business models of) Energy Service Companies (ESCOs) and peak shaving using water pumping. All three were classified as innovations whose results are expected to become visible in the short term (i.e., before 2023). These are briefly introduced in the subsequent paragraphs, while Section 5 gives a more detailed discussion of how they alleviate land scarcity and what lessons can be learned from other countries regarding their implementation. It is important to note that the inventory contains other promising innovations and that this selection was solely made as an example of how the inventory can be used to identify innovations and consider the source countries as best-practice examples. For instance, in the graph of Figure 8, an innovation exists which scores better (effort score 3 and impact score 9) than the innovation “peak shaving using water pumping”. That innovation (3, 9) is a Danish policy act, which did not require extremely large investments, but nevertheless significantly increased public support for renewable energy sources. For example, it entailed a benefit scheme to enhance local scenic and recreational values for communities near windmills and a co-ownership scheme for citizens to financially benefit from them [42]. Although the previous policy innovation could be a very relevant example for policy makers, we chose to select the “peak shaving” innovation due to its relevance for the private sector, as advised by experts involved in the consultation process for the ranking of innovations.
District heating (DH) using renewable energy sources or waste heat streams was among the innovations identified as particularly promising for regional actors to consider. DH is commonly used in Sweden, Denmark, Germany and Latvia [77]. In the Netherlands, too, the sector is developing [78]. Given the maturity of the foreign DH markets, the concept can hardly be called innovative. Nevertheless, there are many aspects of the foreign systems that are innovative to the Dutch system and which could ease the further development of DH in the Netherlands. However, in Latvia, 63% of the heating in DH systems is still produced in fossil fuel heat plants that do not co-generate electricity and could benefit from more modern and efficient installations [77,79]. Latvia is therefore not further considered as an example for the Netherlands for the implementation of DH.
Secondly, Energy Service Companies (ESCOs) were identified as a promising innovation for regional actors, in particular their innovative business models: Energy Performance Contracting (EPCs) and Energy Service contracts (ESCs) [80]. Although nuances exist in the exact form of contracts, the basic premise of a performance contract is that the investment costs of an (efficiency) improvement are paid for by energy bill savings, over time [80]. In service contracts, customers pay for a certain service (e.g., the heating of their house), and the ESCO generally takes care of the installation, maintenance and operation of the entire system (e.g., heat pumps). The customer is not confronted with large upfront investment costs and does not bear the risk of not saving money if the performance turns out lower than expected. The ESCO makes a profit because of the margins applied to the pay-back of the investments and through the benefits acquired by the aggregation of many comparable projects, which include better insight in investment risks and economies of scale [81].
The third innovation selected is peak shaving using water pumping. Pumping water is an inevitable part of maintaining dry land in large parts of the Netherlands that are below sea level. Pumping, but also processes like feeding and aerating of sewage water in the wastewater treatment facilities, are rather energy-intensive. At present, 75% of the Dutch utilities do not monitor the energy efficiency of the pumping stations [82], not to mention their possible contribution to the efficiency of the energy system as a whole. Even without reducing energy use, water utilities could contribute to decarbonisation through “peak shaving”, by shifting energy use (e.g., pumping) to different timeframes [83,84]. Peak shaving refers to lowering extremes in electricity demand in order to reduce costs for energy utilities and facilitate the penetration of renewables in the electricity mix. It is based on the fact that demand for electricity is unevenly distributed over the day. Human behaviour, industrial operation times and many other aspects of daily life aggregately result in peaks in the demand curve, times at which much more electricity is demanded than average. The existence of such peaks results in efficiency and cost concerns for energy producers [85], which are often required to start operating flexible, but more expensive and polluting energy generation units, such as gas-fired power plants. Demand peaks also largely determine grid and capacity sizing. On top of that, they hinder the uptake of renewables in the energy mix, because the availability of intermittent renewables often does not overlap with peaks in demand.

4.2. Energy Transition Paths of Belgium, Denmark, Germany, Latvia and Sweden

Below, in Table 3, an overview is given of the DPSIR analysis of the energy transition paths of the countries that served as sources of innovations for the inventory. The quantitative values listed are taken from the benchmarking analysis and extended with statistics about the living standards, energy mixes and population densities [70,72,86]. “Energy transition paths” describe the non-innovative DPSIR elements that played a particularly determining role in the progress these countries have made towards a low-carbon economy with more renewable energy. Note that “+” (green cells) are used to indicate the elements that were found to be most important in shaping the energy transitions of the countries. If a cell indicates “-” (red cells) for a certain Driver, Impact or Response, this does not mean that this element has not played any role, but merely that it was not described as the most important or determining in the analysed literature and policy documents.

5. Discussion and Recommendations

The large number of innovations with a beneficial impact/effort ratio (green quadrant of Figure 8) indicate that the inventory contains a considerable amount of innovations with a high potential to positively impact the low-carbon transition while alleviating the land scarcity constraint within the Dutch CLEWF nexus and being relatively easy to implement (for regional actors). As it was one of the main aims of this study to identify such innovations, the developed framework was proven effective. Three innovations were identified as examples of how specific stakeholders can use the inventory to further illustrate the applicability and transferability of the framework. A clarification of how these innovations can alleviate the land scarcity constraint within the Dutch nexus and recommendations for their implementation based on best practices from the other countries are elaborated on below, in Section 5.1.1, Section 5.1.2 and Section 5.1.3.
The DPSIR analysis of the land use aspect in the Dutch CLEWF nexus was found to be valuable in the expansion of the inventory. It broadened the range of innovations that could be included in the inventory and thereby resulted in a richer compilation with not-so-obvious entries. The characterisation of a selected constraint using the DPSIR could further benefit from stakeholder engagement and participation by providing opportunities for validation and verification of the analysis performed; and, secondly, by establishing a communication bridge between the analysts and the relevant actors in the case.
The applicability of innovations to the different CLEWF nexus domains, as was shown in Figure 7, indicate that only five of the more than 70 innovations in the inventory directly apply to three domains at once (in all cases to CLE), and none to more than three domains simultaneously. This is an important observation in itself, as it suggests that innovation at present does not regularly take on a cross-domain approach to (land scarcity as a constraint within the challenge of) the transition to a low-carbon economy. However, if implied relations are also considered, the number of innovations that address all three domains increases to a few dozens. A nexus-approach such as the one used in this study can thus be concluded to be valuable in the identification of how specific innovations relate to several nexus domains.

5.1. Innovations to Address the Land Scarcity Constraint

5.1.1. District Heating: Relation with Land Scarcity and Recommendations for Implementation

DH has the potential to drastically increase the efficiency and deployment of renewable energy in the Dutch heating system by aggregating demand and supplying for it using waste heat streams, Combined Heat and Power (CHP) and/or renewables [87,88,89,90,91]. Given that heating is one of the largest energy sectors of the Netherlands, and that demand for renewable energy drives demand for land to generate energy on, DH can make considerable contributions to reduce land use requirements for the decarbonisation challenge. Furthermore, Paardekooper et al. [92] concluded that the decarbonisation of the Dutch heating and cooling sector with significant investments in DH systems will have higher efficiency and reduced costs compared to the “conventionally decarbonised scenario”, in which the energy system is developed by encouraging renewables but not radically changing the heating and cooling sector [92]. The implications of introducing this innovation in the Dutch context, in the context of the nexus and using the DPSIR framework are illustrated in Figure 9.
One of the most important reasons for the low permeation of district heating in the Dutch energy system is related to the historically cheap availability of natural gas. In Sweden, Denmark and Latvia, district heating was an economically attractive alternative to oil when import dependencies and rising prices became issues [77,79]. In contrast to the lack of economic or geopolitical drivers in the past, now there are drivers to move to DH systems in the Netherlands: the ambition to move to a low-carbon economy, and phasing-out of domestic gas exploitation. Densely populated areas could even form a specific opportunity rather than a challenge for the case of DH due to the lower distribution costs of realising a DH system [90].
Learning could be taken from Denmark with regard to policy frameworks: The Danish Heat Supply Act clearly defines the roles for key actors and the procedures for municipalities regarding heat supply. Moreover, the broader advantages of DH to the energy system are recognised and exploited in Denmark. There, the flexibility to operate with various heat sources and thermal storage is used to manage intermittent wind energy in the grid [77]. Furthermore, taxes on electricity and fossil fuels have facilitated the development of district heating and cooling in Denmark, but also in Sweden. In Germany, feed-in tariffs for renewable energies and CHP plants have played a positive role in the deployment. Furthermore, the German state-owned development bank has fostered DH investments through affordable loans and investment subsidies. At the local level, successful projects from Copenhagen, Stockholm and Hamburg exemplify the importance of flagship projects, mandatory connections to DH networks, coherent urban planning, alignment of interests between municipalities, DH companies and final users (for example, by the not-for-profit principle in Copenhagen) and customer empowerment (for example, the participative and transparent approach to price setting in Stockholm called “Prisdialogen”—literally “the price dialogue”). Such elements can be transferred to the Netherlands, albeit in an adapted form [77,91].

5.1.2. ESCOs: Relation with Land Scarcity and Recommendations for Implementation

If an ESCO project increases the total efficiency to reduce the customer’s energy bill, it can contribute to the alleviation of the land scarcity constraint. After all, reduced demand for energy implies a potentially reduced area required for energy production. Furthermore, ESCO projects can ease the development of renewables on urban land, for example, by installing solar panels on rooftops, thereby realising a double purpose land use. In Figure 10 we present the potential implications of the implementation of such an innovation using the DPSIR framework.
The market for ESCOs in the Netherlands is small compared to other countries. The Danish and Belgian markets are both larger than the Dutch [93], but the one in Germany is by far the most mature in Europe [80]. One important Driver for the successful establishment of ESCO markets in different European countries that was found in the DPSIR country analysis is a long-term, manifested and credible commitment to sustainable energy, energy efficiency, or the ESCO concept by governmental institutions. In Denmark, the National Energy Efficiency Action Plan and the Sustainable Energy Action Plan are examples of long-term energy strategies that are not dependent on election cycles and provide security to the sector [94]. In Germany, the strong commitment to energy efficiency, for instance through energy taxes, has certainly aided in creating a favourable ecosystem for ESCOs [38,94].
With regard to barriers, especially a lack of trust in the ESCO services, a high cost of project development and procurement and complexity of the concept (or lack of information) are inhibiting factors [94,95]. One best-practice example concerning building trust and providing information comes from the local Berlin Energy Agency (BEA), that organises seminars, training programmes and workshops to promote energy services [96]. Furthermore, standardised contracts have been in effect for years in Germany [80]. A promising development in this direction, from within the Netherlands, is the publication of guidelines for the procurement of EPCs [94]. In addition, the Energy Saving Partnership (ESP) in the municipality of Berlin has been identified as an important visible starting signal in which the public sector leads by example and created trust in the ESCO industry [97].
In the Netherlands, successful ESCO projects could be used similarly. The high costs of project development and procurement are expected to be less of a barrier when the ESCO market and companies grow [98]. For a short-term alleviation of this barrier, it is worth noting that sometimes ESCO projects could make use of Energy Savings Funds, although this has relatively rarely been done in the Netherlands [80]. In some cases, however, such funds have made EPC projects possible in the Netherlands [98,99].

5.1.3. Using Water Pumping for Peak Shaving: Relation with Land Scarcity and Recommendations for Implementation

The Dutch foundation of applied research for water management (STOWA) investigated the possibilities for flexible energy management at wastewater treatment facilities, or “smart pumping”, for instance through buffering for a day, reversing day and night, flexibly changing the oxidation set points or intermittently feeding and aerating [100]. They concluded that these adjustments do not result in considerable energy savings in absolute terms, but, depending on the future climate policy of the Netherlands, can certainly lead to the increased sustainability of the system (by facilitating the use of cleaner energy) [83]. The amount of emissions that can be avoided through peak shaving is highly dependent on the future development of the Dutch energy system. Slingerland et al. [101] conclude that until 2023, increased flexibility is most probably not required, but that it will likely be so in the future. They expect this moment to arrive around 2030. A timely anticipation of future flexibility needs is expected to reduce costs because of the long lead times of certain cheaper flexibility options [101].
If existing infrastructure can be used to increase the efficiency with which (renewable) energy sources are used, it reduces the need for new storage installations, which inevitably require land, money, material and energy. Peak shaving in innovative ways, such as by shifting pumping times in water management systems, can furthermore put the Netherlands at the forefront of innovation in the future. Not only are there benefits of peak shaving for energy generation efficiency and renewable energy deployment in the future, but these benefits are also expected to hold an increasing economic value. Also the latter should motivate regional actors to develop this opportunity in areas like water management. Peak-shaving technologies could be exported to other countries. Innovations in the water pumping sector would be interesting to explore as an adaptation measure to sea-level rise, to mention an example. An illustration of the implications of the implementation of such innovation across the systems of the nexus, using the DPSIR framework, is shown in Figure 11.

5.2. Energy Transition Paths

The DPSIR analysis in Belgium, Denmark, Germany, Latvia and Sweden—in comparison to the Netherlands, of which an overview was provided in Table 2—helped to better understand the context in which innovations emerged and were adopted. It was found that especially Denmark, Germany and Sweden benefitted from the early commitment to climate and energy goals. Decisions such as phasing out nuclear power entirely or setting up tax schemes that span several government terms provide direction and security to the industry sector and the citizens. These convey the message that there is no need to wait and see if a change is going to be worthwhile or necessary—it will be so. This point is also underlined by the fact that the opposite phenomenon, i.e., hesitant and slow decision-making, was indeed found to be an important barrier in general and specifically in Belgium, where this was mainly the result of the division into regions. Furthermore, pioneering was shown to come with advantages rather than risks (as is commonly feared in the Netherlands). This is illustrated by the energy transition path of Sweden, in particular, which explicitly profiled itself as a pioneer and, as such, put itself in the position to create the dominant design for various aspects of the energy transition, export knowledge and create jobs in the process. Also in Germany and Denmark, green developments were voiced as great opportunities for economic growth and employment. Important in this respect is that countries generally pioneer in activities that they are naturally good at. In Germany, this can be seen in the large emphasis on energy efficiency. In Sweden, there is a strong focus on efficient heating, and Denmark excels in wind energy and citizen participation. For the Netherlands, it would thus be worthwhile to try and draw from existing strengths such as, for example, water management. Lastly, Drivers for change were found to be economical and geopolitical, at least as much, if not more, as the concerns about climate change and sustainability that drove them. Concerns about energy security and rising import prices were by far the most important Drivers towards increased efficiency and large-scale biomass deployment in Latvia, while they also played an important role in Denmark, Germany and Sweden. The historically cheap availability of natural gas as an alternative to imported oil meant that these Drivers were largely missing in the Netherlands, which surely hampered the speed of progress towards a low-carbon economy. On a positive note, the fact that non-idealistic drivers can move a country in a specific direction (e.g., carbon neutrality) also means that constraints (e.g., land scarcity) could work in the same way, especially if the chosen responses (e.g., innovations) build on the natural strengths of the (Dutch) CLEWF nexus.

5.3. Limitations and Suggestions for Future Work

Despite the deliberate inclusion of social and business innovations as innovation types, these are most probably under-represented in the inventory developed in this article. This is due to policy and technical innovations being more commonly documented or easy to find in the literature and relevant databases. Furthermore, the methodology for the estimation of effort and impact values could benefit from MCDA with extensive stakeholder involvement, as was suggested in the Materials and Methods section. In addition, energy system modelling could be used to support the MCDA for impact values as well as to test some of the innovations suggested. Possibly, model output structures and/or scenario analyses could also be developed to account for the suggested innovations of this work.

6. Conclusions

Despite high ambitions and plentiful political commitments, the Netherlands is far behind most of its European peers with regard to Climate targets. One factor slowing down progress towards a low-carbon economy in the densely populated Netherlands is the relatively high level of competition between land uses. Indeed, land use requirements for renewable energy sources considerably impede their rapid uptake. Innovations could accelerate the required change. A careful selection of innovations that address context-specific constraints can augment the chances of their successful implementation and bring the accelerated change that is needed for the Netherlands to catch up. In this study, a framework has been developed that helps to identify particularly promising innovations by targeting them after analysing a specific constraint. The framework was applied to the land scarcity constraint in the Netherlands and helped to identify several promising innovations from within and outside the Netherlands. Three were investigated further, and recommendations for their implementation were made.
Innovations were found to both follow from, and lie at the heart of, differences in the energy transition paths of Belgium, Denmark, Germany, Latvia and Sweden. The Netherlands can take stock of these innovations by adapting them to the Dutch CLEWF context. Through the application of the DPSIR framework to the Dutch CLEWF nexus, it was found that in the context of land scarcity as a constraint to the decarbonisation challenge, innovations related to renewable energy deployment, the energy intensity of the economy, resource use and disposal, mobility and agricultural emissions need to be considered. Given that this study aimed to identify innovations with a high impact on the low-carbon transition while simultaneously having a high potential to be easily implemented (low effort required) by regional actors, three innovations in the innovation inventory were identified as particularly promising for The Netherlands. These are district heating, the business models of Energy Service Companies, and peak shaving using water pumping. Regional actors in the Netherlands are encouraged to develop these innovations and take note of the lessons that can be learned from other countries where possible. Furthermore, elements that unify successful energy transition paths across countries were identified through the DPSIR framework. These were found to relate to long-term political commitments, context-specific geopolitical and economic drivers, and pioneering approaches building on and towards national strengths. The analysis conducted and the framework developed can be useful to policymakers in the Netherlands and around the world. These outputs can inspire different types of decision-making actors when selecting innovations for building long-term commitments in their climate plans. At the same time, such exercise can assist in the identification of non-idealistic drivers that can be exploited towards a low-carbon economy or difficult to attain goals in a CLEWF nexus perspective (including constraints such as land scarcity). In this respect, stakeholders are encouraged to commit to developing new and innovative approaches to challenges, consider them in an integrated nexus perspective and use natural strengths as guidance for selecting them (e.g., water management).
A systematic approach to identifying cross-sectoral innovations was developed. The method for creating an innovation inventory is transferable to other countries and applicable to other nexus challenges. As such, it can support a wide range of decision and policy-making processes. The specific inventory created for this work contains a rich base of knowledge that can be used by regional actors and practitioners in the Netherlands, to identify other or more innovations and analyse these further. Furthermore, the combination of the DPSIR framework with the CLEWF nexus approach as a starting point for the identification of nexus-relevant innovations went beyond the state-of-the-art and was proven to be useful in understanding and breaking down the challenges faced by the nexus.

Author Contributions

Conceptualization, D.N.G.J., E.P.R. and D.F.; methodology, E.P.R., D.N.G.J. and D.d.M.eS.; validation, V.L., N.P., C.L. and D.F.; formal analysis, D.N.G.J. and E.P.R.; investigation, D.N.G.J.; resources, D.F., V.L. and N.P.; data curation, D.N.G.J. and E.P.R.; writing—original draft preparation, D.N.G.J.; writing—review and editing, E.P.R., D.F., V.L., N.P., C.L. and D.d.M.eS.; visualization, D.N.G.J., E.P.R. and V.L.; supervision, E.P.R., D.F. and D.d.M.eS.; project administration, E.P.R. and D.d.M.eS. All authors have read and agreed to the published version of the manuscript.

Funding

This research received no external funding.

Conflicts of Interest

The authors declare no conflict of interest.

References

  1. UNFCCC. Paris Agreement. 2015. Available online: https://unfccc.int/files/meetings/paris_nov_2015/application/pdf/paris_agreement_english_.pdf (accessed on 8 April 2019).
  2. UNFCCC. What Is the Paris Agreement?|UNFCCC. United Nations Climate Change. 2015. Available online: https://unfccc.int/files/essential_background/convention/application/pdf/english_paris_agreement.pdf (accessed on 23 January 2019).
  3. European Commission. 2020 Climate & Energy Package. 2009. Available online: https://ec.europa.eu/clima/policies/strategies/2020_en (accessed on 23 January 2019).
  4. De Rijksoverheid. Klimaatakkoord. 2019. Available online: https://www.klimaatakkoord.nl/documenten/publicaties/2019/06/28/klimaatakkoord (accessed on 23 January 2019).
  5. Selnes, T.; Linderhof, V.; Marinissen, R. The Netherlands Case Study: Policy analysis. In SIM4NEXUS D2.2 Nexus-Relevant Policies in the Transboundary, National and Regional Case Studies Background Report; Munaretto, S., Ed.; Wageningen Economic Research, 2018; Available online: https://www.sim4nexus.eu/userfiles/Deliverables/Deliverable%202.2_Policy%20analysis%20case%20studies_background-report_2019.02.21.pdf (accessed on 5 November 2020).
  6. Remkes, J.W.; van Dijk, J.J.; Dijkgraaf, E.; Freriks, A.; Gerbrandy, G.J.; Maij, W.H.; Nijhof, A.G.; Post, E.; Rabbinge, R.; Scholten, M.T.; et al. Niet Alles Kan Overal: Eindadvies over Structurele Aanpak op Lange Termijn. No. Adviescollege Stikstofproblematiek, Amersfoort. 2020. Available online: https://www.rijksoverheid.nl/documenten/rapporten/2020/06/08/niet-alles-kan-overal (accessed on 5 November 2020).
  7. European Commission. Clean Energy for All Europeans COM/2016/0860. 2016. Available online: http://eur-lex.europa.eu/legal-content/EN/TXT/?qid=1512481277484&uri=CELEX:52016DC0860 (accessed on 24 January 2019).
  8. European Commission. 2030 Climate & Energy Framework. 2019. Available online: https://ec.europa.eu/clima/policies/strategies/2030_en (accessed on 23 January 2019).
  9. European Commission. Renewable Energy Directive. 2019. Available online: https://ec.europa.eu/energy/en/topics/renewable-energy/renewable-energy-directive (accessed on 11 April 2019).
  10. Schoots, K.; Hekkenberg, M.; Hammingh, P. Nationale Energieverkenning 2017; ECN-O--17-018; Petten Energieonderzoek Cent. Ned.: Amsterdam/Petten, The Netherlands, 2017; pp. 1–276. [Google Scholar]
  11. Eurostat. Share of Energy from Renewable Sources. 2020. Available online: https://ec.europa.eu/eurostat/databrowser/view/NRG_IND_REN/default/table?lang=en (accessed on 5 November 2020).
  12. CBS. Nederland Telt 17 Miljoen Inwoners. 2016. Available online: https://www.cbs.nl/nl-nl/nieuws/2016/12/nederland-telt-17-miljoen-inwoners (accessed on 18 April 2019).
  13. Bos, J.F.F.P.; Smit, A.L.; Schröder, J.J. Is agricultural intensification in the Netherlands running up to its limits? NJAS Wagening J. Life Sci. 2013, 66, 65–73. [Google Scholar] [CrossRef] [Green Version]
  14. Van Zalk, J.; Behrens, P. The spatial extent of renewable and non-renewable power generation: A review and meta-analysis of power densities and their application in the U.S. Energy Policy 2018, 123, 83–91. [Google Scholar] [CrossRef]
  15. Horlings, E.; Hoeksma, L.; van der Ven, K.; Pieters, A. CBS, SDGs in the Netherlands—Status Report 2020. 2020. Available online: https://www.cbs.nl/nl-nl/publicatie/2020/27/sdg-s-in-nederland-statusrapport-2020 (accessed on 18 April 2019).
  16. OECD and Eurostat. Oslo Manual 2018: Guidelines for Collecting, Reporting and Using Data on Innovation, 4th Edition; The Measurement of Scientific, Technological and Innovation Activities; OECD Publishing: Luxembourg, 2018. [Google Scholar] [CrossRef]
  17. Fosaas, M.; Sapprasert, K. Innovation: Exploring the knowledge base. Res. Policy 2012, 41, 1132–1153. [Google Scholar] [CrossRef]
  18. Schumpeter, J. Capitalism, Socialism and Democracy; Harper Brother: New York, NY, USA, 1942. [Google Scholar]
  19. Gault, F. Defining and measuring innovation in all sectors of the economy. Res. Policy 2018, 47, 617–622. [Google Scholar] [CrossRef]
  20. OECD and Eurostat. Oslo Manual: Guidelines for Collecting and Interpreting Innovation Data, 3rd ed.; The Measurement of Scientific and Technological Activities; OECD Publishing: Paris, France, 2005. [Google Scholar] [CrossRef]
  21. Fleurbaey, M. Beyond GDP: The Quest for a Measure of Social Welfare. J. Econ. Lit. 2009, 47, 1029–1075. [Google Scholar] [CrossRef]
  22. Joint UNECE/Eurostat/OECD Task Force on Measuring Sustainable Development. Framework and Suggested Indicators to Measure Sustainable Development; OECD Publishing: Paris, France, 2013; pp. 41–44. [Google Scholar]
  23. Raworth, K. Doughnut Economics; Random House: London, UK, 2019. [Google Scholar]
  24. Ward, J.D.; Sutton, P.C.; Werner, A.D.; Costanza, R.; Mohr, S.H.; Simmons, C.T. Is decoupling GDP growth from environmental impact possible? PLoS ONE 2016, 11, e164733. [Google Scholar] [CrossRef] [PubMed] [Green Version]
  25. Baker, S. Sustainable Development; Routledge: Oxon, UK, 2006. [Google Scholar]
  26. Polman, N.B.P.; Slee, B.; Kluvánková, T.; Dijkshoorn-Dekker, M.W.C.; Nijnik, M.; Gežik, V.; Soma, K. Classification of Social Innovations for Marginalized Rural Areas. 2017. Available online: http://www.simra-h2020.eu/wp-content/uploads/2017/09/D2.1-Classification-of-SI-for-MRAs-in-the-target-region.pdf (accessed on 13 May 2019).
  27. Irandoust, M. Innovations and renewables in the Nordic countries: A panel causality approach. Technol. Soc. 2018, 54, 87–92. [Google Scholar] [CrossRef]
  28. Lin, B.; Zhu, J. The role of renewable energy technological innovation on climate change: Empirical evidence from China. Sci. Total Environ. 2019, 659, 1505–1512. [Google Scholar] [CrossRef] [PubMed]
  29. Hoppe, T.; de Vries, G. Social innovation and the energy transition. Sustainability 2018, 11, 141. [Google Scholar] [CrossRef] [Green Version]
  30. Aldieri, L.; Bruno, B.; Vinci, C.P. Does environmental innovation make us happy? An empirical investigation. Socioecon. Plann. Sci. 2018. [Google Scholar] [CrossRef]
  31. Kristensen, P. The DPSIR Framework Background 1. 2004. Available online: https://wwz.ifremer.fr/dce/content/download/69291/913220/.../DPSIR.pdf (accessed on 24 April 2019).
  32. Kuzemko, C.; Mitchell, C.; Lockwood, M.; Hoggett, R. Policies, politics and demand side innovations: The untold story of Germany’s energy transition. Energy Res. Soc. Sci. 2017, 28, 58–67. [Google Scholar] [CrossRef]
  33. Federal Ministry for Economic Affairs (BMWi). Energy Efficiency—Made in Germany. Energy Efficiency in Industry, Building Service Technology and Transport. 2010. Available online: www.bmwi.de (accessed on 24 May 2019).
  34. Rutten, D. The Energiewende and Germany’s Industrial Policy. Clingendael International Energy Programme (CIEP). 2014. Available online: www.clingendaelenergy.com (accessed on 24 May 2019).
  35. Rosenow, J. Politics of Change: Energy Efficiency Policy in Britain and Germany. Ph.D. Thesis, Oxford University, Oxford, UK, 2013. [Google Scholar]
  36. Kuittinen, H.; Velte, D. Case Study Report Energiewende. Energeia 2018. [Google Scholar] [CrossRef]
  37. Clean Energy Wire. Germany’s Energiewende—The Easy Guide. 2018. Available online: https://www.cleanenergywire.org/easyguide (accessed on 24 May 2019).
  38. Agora Energiewende. Understanding the Energiewende. 2015. Available online: www.agora-energiewende.de (accessed on 24 May 2019).
  39. Sturm, C. Inside the Energiewende: Policy and Complexity in the German Utility Industry. Issues Sci. Technol. 2017. Available online: https://issues.org/inside-the-energiewende-policy-and-complexity-in-the-german-utility-industry/ (accessed on 24 May 2019).
  40. Millsap, R.E. The German Gamble: An Analysis of the Energiewende Policy and Its Implications for Energy Security in Europe. 2018. Available online: https://bearworks.missouristate.edu/theses (accessed on 24 May 2019).
  41. Borup, M.; Andersen, P.D.; Jacobsson, S.; Midttun, A. Nordic Energy Innovation Systems-Patterns of Need Integration and Cooperation. 2008. Available online: www.bi.no (accessed on 27 May 2019).
  42. Jørgensen, M.S.; Jørgensen, U.; Jensen, J.S. Navigations and governance in the Danish energy transition reflecting changing Arenas of Development, controversies and policy mixes. Energy Res. Soc. Sci. 2017, 33, 173–185. [Google Scholar] [CrossRef]
  43. Danish Energy Agency. The Danish Energy Model Innovative, Efficient and Sustainable. 2016. Available online: www.ens.dk/en (accessed on 27 May 2019).
  44. IEA. Energy Policies of IEA Countries 2016 Review Belgium. 2016. Available online: www.iea.org/t&c/ (accessed on 28 May 2019).
  45. Edquist, C. Towards a holistic innovation policy: Can the Swedish National Innovation Council (NIC) be a role model? Res. Policy 2019. [Google Scholar] [CrossRef]
  46. Uba, K. Who formulates renewable-energy policy? A Swedish example. Energy Policy 2010, 38, 6674–6683. [Google Scholar] [CrossRef]
  47. Wang, Y. Renewable electricity in Sweden: An analysis of policy and regulations. Energy Policy 2006, 34, 1209–1220. [Google Scholar] [CrossRef]
  48. Sarasini, S. Constituting leadership via policy: Sweden as a pioneer of climate change mitigation. Mitig. Adapt. Strateg. Glob. Chang. 2009, 14, 635–653. [Google Scholar] [CrossRef]
  49. Nilsson, L.J.; Johansson, B.; Åstrand, K.; Ericsson, K.; Svenningsson, P.; Börjesson, P.; Neij, L. Seeing the wood for the trees: 25 years of renewable energy policy in Sweden. Energy Sustain. Dev. 2004, 8, 67–81. [Google Scholar] [CrossRef]
  50. Swedish Energy Authority. Energie Läget 2008 (The Energy Situation 2008); Modintryckoffset: Stockholm, Sweden, 2008; ISSN 1403-1892. [Google Scholar]
  51. Locmelis, K.; Bariss, U.; Blumberga, D. Latvian Energy Policy on Energy Intensive Industries. Energy Procedia 2017, 113, 362–368. [Google Scholar] [CrossRef]
  52. Timma, L.; Zoss, T.; Blumberga, D. Life after the financial crisis. Energy intensity and energy use decomposition on sectorial level in Latvia. Appl. Energy 2016, 162, 1586–1592. [Google Scholar] [CrossRef]
  53. Shipkovs, P.; Kashkarova, G.; Shipkovs, M. Renewable energy utilization in Latvia. Renew. Energy 1999, 16, 1241–1244. [Google Scholar] [CrossRef]
  54. Prodanuks, T.; Cimdina, G.; Veidenbergs, I.; Blumberga, D. Sustainable Development of Biomass CHP in Latvia. Energy Procedia 2016, 95, 372–376. [Google Scholar] [CrossRef] [Green Version]
  55. Nuclear Energy Agency [NEA] and OECD. Denmark: Nuclear Legislation in OECD and NEA Countries. 2015. Available online: https://www.oecd-nea.org/law/legislation/denmark.pdf (accessed on 31 May 2019).
  56. IRENA. 30 Years of Policies for Wind Energy; 2012; pp. 54–64. Available online: https://www.irena.org/-/media/Files/IRENA/Agency/Publication/2013/GWEC_WindReport_All_web-display.pdf (accessed on 31 May 2019).
  57. Technopolis. Country Study-Belgium. 2016. Available online: https://www.topsectorenergie.nl/sites/default/files/uploads/Systeemintegratie/ICET%20Country%20Study%20Belgium.pdf (accessed on 1 June 2019).
  58. IEA. Climate Change Policies and Measures Databases. 2019. Available online: https://www.iea.org/policiesandmeasures/climatechange/ (accessed on 24 June 2019).
  59. IEA and IRENA. Renewable Energy IEA/IRENA Joint Policies and Measures Database. 2019. Available online: https://www.iea.org/policiesandmeasures/renewableenergy/ (accessed on 24 June 2019).
  60. IEA. Energy Efficiency Policies and Measures Databases. 2019. Available online: https://www.iea.org/policiesandmeasures/energyefficiency/ (accessed on 24 June 2019).
  61. Perruchas, F.; Consoli, D.; Barbieri, N. Green Innovation: An Empirical Analysis of Technology, Skills and Policy. LIBRARY (LOND). 2019. Available online: https://riunet.upv.es/bitstream/handle/10251/119965/Perruchas%E2%80%94Green%20Innovation%3A%20an%20empirical%20analysis%20of%20technology%2C%20skills%20and%20policy.pdf?sequence=4&isAllowed=y (accessed on 15 July 2019).
  62. Stanners, D.; Bosch, P.; Dom, A.; Gabrielsen, P.; Gee, D.; Martin, J.; Rickard, L.; Weber, J.L. Frameworks for Environmental Assessment and Indicators at the EEA. 2007. Available online: http://wedocs.unep.org/bitstream/handle/20.500.11822/18902/Frameworks_for_environmental_assessment_and_in.pdf?sequence=1&isAllowed=y (accessed on 24 April 2019).
  63. Centraal Bureau voor de Statistiek. Monitor Brede Welvaart; Centraal Bureau voor de Statistiek: The Hague, The Netherlands, 2018. [Google Scholar]
  64. Cambridge English Dictionary. Benckmark—Meaning. 2019. Available online: https://dictionary.cambridge.org/dictionary/english/benchmark (accessed on 15 July 2019).
  65. Merriam-Webster Dictionary. Definition of Benchmark. 1952. Available online: https://www.merriam-webster.com/dictionary/benchmark (accessed on 15 July 2019).
  66. Collins English Dictionary. Benchmarking Definition and Meaning. 2019. Available online: https://www.collinsdictionary.com/dictionary/english/benchmarking (accessed on 15 July 2019).
  67. Business Dictionary, What Is Benchmarking? Definition and Meaning. 2019. Available online: http://www.businessdictionary.com/definition/benchmarking.html (accessed on 15 July 2019).
  68. Eurostat. Greenhouse Gas Emissions in ESD Sectors. 2019. Available online: https://ec.europa.eu/eurostat/tgm/graph.do?tab=graph&plugin=1&pcode=t2020_35&language=en&toolbox=data (accessed on 11 April 2019).
  69. European Parliament and Council of the European Union. Regulation (EU) 2018/842 of the European Parliament and of the Council o. 2018. Available online: https://eur-lex.europa.eu/legal-content/EN/TXT/PDF/?uri=CELEX:32018R0842&from=EN (accessed on 21 April 2019).
  70. EEA. Per Capita Greenhouse Gas Emissions. 2018. Available online: https://ec.europa.eu/eurostat/tgm/table.do?tab=table&init=1&plugin=1&language=en&pcode=t2020_rd300 (accessed on 8 April 2019).
  71. Eurostat. Renewable Energy Statistics—Statistics Explained. 2017. Available online: https://ec.europa.eu/eurostat/statistics-explained/index.php?title=Renewable_energy_statistics (accessed on 8 April 2019).
  72. Eurostat. Energy Intensity of the Economy. 2017. Available online: https://ec.europa.eu/eurostat/statistics-explained/index.php?title=File:Energy_intensity_of_the_economy,_2005_and_2015_(kg_of_oil_equivalent_per_1_000_EUR_of_GDP)_YB17.png (accessed on 8 April 2019).
  73. European Patent Office, PATSTAT. Worldwide Patent Statistical Database. Available online: https://www.epo.org/searching-for-patents/business/patstat.html#tab-1 (accessed on 15 July 2019).
  74. Dziallas, M.; Blind, K. Innovation indicators throughout the innovation process: An extensive literature analysis. Technovation 2019, 80–81, 3–29. [Google Scholar] [CrossRef]
  75. Geels, F.W. Disruption and low-carbon system transformation: Progress and new challenges in socio-technical transitions research and the Multi-Level Perspective. Energy Res. Soc. Sci. 2018, 37, 224–231. [Google Scholar] [CrossRef]
  76. Dodgson, J.S.; Spackman, M.; Pearman, A.; Phillips, L.D. Multi-Criteria Analysis: A Manual; Department for Communities and Local Government: London, UK, 2009; Volume 11. [Google Scholar]
  77. Woods, P.; Overgaard, J. Historical development of district heating and characteristics of a modern district heating system. Adv. Dist. Heat. Cool. Syst. 2016, 3–15. [Google Scholar] [CrossRef]
  78. Planbureau Voor de Leefomgeving. Balans van de Leefomgeving 2018—Nederland Duurzaam Vernieuwen. 2018. Available online: https://themasites.pbl.nl/balansvandeleefomgeving/wp-content/uploads/pbl-2018-balans-van-de-leefomgeving-2018-3160.pdf (accessed on 3 May 2019).
  79. Rasmussen, L.H. A sustainable energy-system in Latvia. Appl. Energy 2003, 76, 1–8. [Google Scholar] [CrossRef] [Green Version]
  80. Boza-Kiss, B.; Bertoldi, P.; Economidou, M. Energy Service Companies in the EU—Status review and recommendations for further market development with a focus on Energy Performance Contracting. ISPRA Jt. Res. Cent. 2017. [Google Scholar] [CrossRef]
  81. United States Department of Energy. Energy Service Companies. 2019. Available online: https://www.energy.gov/eere/femp/energy-service-companies-0 (accessed on 3 July 2019).
  82. Pothof, I. Energiebesparing Malen. 2019. Available online: https://publicwiki.deltares.nl/display/DEL029 (accessed on 3 July 2019).
  83. Chang, M.; Verbree, J.-M.; van den Berg, H.; Reitsma, B. De (on)Mogelijkheden van Flexibel Energiemanagement op Rioolwaterzuiverings-Inrichtingen; Stichting Toegepast Onderzoek Waterbeheer: Amersfoort, The Netherlands, 2018. [Google Scholar]
  84. Kuipers, H.; van Esch, B.; Meijnburg, M.; Grispen, J.; Pothof, I. Energie- en Kostenreductie in Boezem- en Polderbemaling. 2016. Available online: https://publicwiki.deltares.nl/download/attachments/123538847/Projectvoorstel%20JIP_Gemalen_final.pdf?version=1&modificationDate=1557905418588&api=v2 (accessed on 3 July 2019).
  85. Kutkut, N. Energy Management through Peak Shaving and Demand Response: New Opportunities for Energy Savings at Manufacturing and Distribution Facilities. 2006. Available online: https://act-chargers.com/wp-content/uploads/2017/03/ACT-White-Paper-Energy-Management-through-Peak-Shaving-and-Demand-Response.pdf (accessed on 6 July 2019).
  86. Eurostat. Share of Energy from Renewable Sources. 2019. Available online: http://appsso.eurostat.ec.europa.eu/nui/show.do?dataset=nrg_ind_ren&lang=en (accessed on 8 April 2019).
  87. Euroheat & Power. District Energy Explained. 2019. Available online: https://www.euroheat.org/knowledge-hub/district-energy-explained/ (accessed on 1 July 2019).
  88. Lund, H.; Möller, B.; Mathiesen, B.V.; Dyrelund, A. The role of district heating in future renewable energy systems. Energy 2010, 35, 1381–1390. [Google Scholar] [CrossRef]
  89. Rezaie, B.; Rosen, M.A. District heating and cooling: Review of technology and potential enhancements. Appl. Energy 2012, 93, 2–10. [Google Scholar] [CrossRef]
  90. Werner, S. International review of district heating and cooling. Energy 2017, 137, 617–631. [Google Scholar] [CrossRef]
  91. Fernández, M.G.; Roger-Lacan, C.; Gährs, U.; Aumaitre, V. Efficient District Heating and Cooling Systems in the EU—Case Studies Analysis Replicable Key Success Factors and Potential Policy Implications; Publications Office of the European Union: Luxembourg, 2016. [Google Scholar] [CrossRef]
  92. Paardekooper, S.; Lund, R.S.; Mathiesen, B.V.; Chang, M.; Petersen, U.R.; Grundahl, L.; David, A.; Dahlbæk, J.; Kapetanakis, I.A.; Lund, H.; et al. Aalborg Universitet Heat Roadmap Netherlands Quantifying the Impact of Low-Carbon Heating and Cooling Roadmaps. 2018. Available online: www.heatroadmap.eu (accessed on 12 July 2019).
  93. Bertoldi, B.; Boza-Kiss, B.; Rezessy, S. Latest Development of Energy Service Companies across Europe; Publications Office of the European Union: Luxembourg, 2007. [Google Scholar] [CrossRef]
  94. Boza-Kiss, B.; Panev, S.; Bertoldi, P. The European ESCO market: Recent trends, market sizes, barriers and drivers and the remaining market potential. Eceee 2015, 2015, 445–454. [Google Scholar]
  95. IEA. The Netherlands. 2019. Available online: https://www.iea.org/topics/energyefficiency/escos/TheNetherlands/ (accessed on 14 July 2019).
  96. IEA. Germany. 2019. Available online: https://www.iea.org/topics/energyefficiency/escos/Germany/ (accessed on 14 July 2019).
  97. Vreeken, R. The Developed Energy Service Company Markets in the European Union—What Lessons Can Be Drawn for the Development of the Dutch ESCO Market? 2012. Available online: https://dspace.library.uu.nl/bitstream/handle/1874/266887/Afstudeerscriptie%20definitieve%20versie%20%28PUBLIEK%29%20-%20Roel%20Vreeken.pdf?sequence=1 (accessed on 14 July 2019).
  98. Roskam, S.; Piessens, T.; Thijssen, I. Market Report on the Dutch EPC Market. 2016. Available online: https://guarantee-project.eu/nl/wp-content/uploads/sites/15/2017/01/Market-Report-NL.pdf (accessed on 14 July 2019).
  99. Energiefonds Overijssel. 2019. Available online: https://www.energiefondsoverijssel.nl/ (accessed on 14 July 2019).
  100. STOWA. Persbericht Waterschappen Gaan Enerrgie Besparen met ‘Slim Malen’. 2018. Available online: https://www.google.com/url?sa=t&rct=j&q=&esrc=s&source=web&cd=&ved=2ahUKEwim95aOrMvtAhWmsKQKHYXOC_sQFjABegQIAhAC&url=https%3A%2F%2Fpublicwiki.deltares.nl%2Fdownload%2Fattachments%2F123539756%2F2016%2520mrt%2520Persbericht%2520%2527Slim%2520Malen%2527.pdf%3Fversion%3D1%26modificationDate%3D1476098523127%26api%3Dv2&usg=AOvVaw1iuotPSNTz82IjBWTcMXvl (accessed on 3 July 2019).
  101. Slingerland, S.; Rothengatter, N.; van der Veen, R.; Bolscher, H.; Rademaekers, K. The Balance of Power-Flexibility Options for the Dutch Electricity Market. 2015. Available online: http://trinomics.eu/wp-content/uploads/2015/06/The-Balance-of-Power-–-Flexibility-Options-for-the-Dutch-Electricity-Market-final-report.pdf (accessed on 6 July 2019).
Figure 1. Interactions between the Climate, Land, Energy, Water and Food nexus domains in the Netherlands.
Sustainability 12 10491 g001
Figure 2. Illustration of the framework developed and applied in this study.
Sustainability 12 10491 g002
Figure 3. Driver-Pressure-State-Impact-Response (DPSIR) analysis of the land scarcity constraint to the low-carbon economy transition challenge in the perspective of the Dutch CLEWF nexus.
Sustainability 12 10491 g003
Figure 4. Categorisations used in the innovation inventory.
Sustainability 12 10491 g004
Figure 5. Decision tree for effort values with the overall score at the top, the criteria at the bottom and the (intermediate) objectives in between. Weighting factors are indicated in percentages.
Sustainability 12 10491 g005
Figure 6. Decision tree for impact values with the overall score at the top, the criteria at the bottom and the objectives in between. Weighting factors are indicated in percentages.
Sustainability 12 10491 g006
Figure 7. The number of innovations concerning the Climate, Land and Energy (CLE) nexus domains. The categories on the left describe whether only direct (“Yes”) or also indirect (“Implied”) applicability was counted.
Sustainability 12 10491 g007
Figure 8. All effort-impact entries of the innovation inventory were plotted in this effort-impact matrix. Larger dots indicate that more innovations have that specific combination of impact and effort values.
Sustainability 12 10491 g008
Figure 9. Changes to the DPSIR from the implementation of district heating as a “response” affecting the “state” in the context of the land scarcity constraint in the low-carbon transition challenge.
Sustainability 12 10491 g009
Figure 10. Changes to the DPSIR from the implementation of ESCO’s as a “response” affecting the “state” in the context of the land scarcity constraint in the low-carbon transition challenge.
Sustainability 12 10491 g010
Figure 11. Changes to the DPSIR from the implementation of peak shaving using water pumping as a “response” affecting “drivers”, in the context of the land scarcity constraint in the low-carbon transition challenge.
Sustainability 12 10491 g011
Table 1. Example calculations of effort scores using Multi-Criteria Decision Analysis (MCDA).
EffortStrong ESCO MarketDistrict Heating and CoolingGreen Tax ReformWeight
Equipment and installation10450.23
Costs throughout implementation101050.23
Number of stakeholders involved5420.11
Level of decision involved8810.11
Need for active monitoring and management8430.05
Controversy of the topic4400.05
Technological complexity5330.07
Maturity of the innovation91030.05
Natural availability7800.08
Productivity of crops0000.02
Total7.966.273.11
Reversed score 2.043.736.89
Table 2. Example calculations of impact scores using MCDA.
ImpactStrong ESCO MarketDistrict Heating and CoolingGreen Tax ReformWeight
Reduction potential for GHG emissions 910100.33
Contribution to renewable energy generation81090.11
Speed of visibility of the effect91090.11
Job creation 97100.03
Increased awareness or involvement 81090.07
Contribution to energy efficiency810100.28
Direct land savings5570.07
Total8.269.569.50
Table 3. Overview of the DPSIR analysis of the energy transition paths of the selected countries (the 3-letter country codes are abbreviations of country names; these stand for: BEL = Belgium, DNK = Denmark, DEU = Germany, LVA = Latvia, NLD = The Netherlands and SWE = Sweden).
BELDNKDEULVANLDSVE
Drivers
EU targets++++++
Concerns about climate change+++-++
Controversy of nuclear power+++---
Concerns about energy security-+++-+
Need for economic competitiveness and growth--+--+
Economic crisis 2008---+--
Division into regions+-----
Pressures
Global climate change++++++
Global biodiversity loss++++++
Global resource depletion++++++
Living standard (GDP/capita in 2018 in constant 2011 €1000)25.527.625.818.835.734.3
Population density (people per sq. km of land area)37713823730151125
States
Energy intensity level of primary energy in kg of oil equivalent per 1000 EUR of GDP (2015)141.365.1112.6206.7118.3111.3
GHG emission in tonnes of CO2 equivalent per capita (2015)10.89.311.46.012.25.6
Share of renewable energy (electricity and heat) (2017)9%36%15%39%7%56%
Impact
2020 EU target already reached in 2017---+-+
Responses
Reducing fossil fuel imports-+++-+
Increased utilisation of renewable energy sources-+++-+
Reducing energy consumption or CO2 emissions-+++--
Clear decision to phase out nuclear power-++---
Policies to develop green technologies, industry and employment--+--+
Decentralised production-+----
Regional strategies+-----
Over-subsidising of renewable energy generation+-----
Note that “+” (green cells) or “-” (red cells) are used to indicate which elements were found to be most and less important in shaping the energy transitions of the countries respectively.
Publisher’s Note: MDPI stays neutral with regard to jurisdictional claims in published maps and institutional affiliations.

