Article

Harnessing Corporate Sustainability Decision-Making Complexity: A Field Study of Complementary Approaches

1
Kedge Business School, 33405 Talence, France
2
Foisie School of Business, Worcester Polytechnic Institute, Worcester, MA 01609, USA
*
Authors to whom correspondence should be addressed.
Sustainability 2020, 12(24), 10584; https://doi.org/10.3390/su122410584
Submission received: 19 November 2020 / Revised: 11 December 2020 / Accepted: 13 December 2020 / Published: 17 December 2020
(This article belongs to the Section Sustainable Engineering and Science)

Abstract

:
Supply chain management environmental and social criteria are practical and research concerns due to regulatory, stakeholder, and economic pressures. Effective holistic sustainable supply management schemes require the evaluation and selection of suppliers. Supplier evaluation requires the balancing of multiple criteria. Multiple criteria tools, each with advantages and limitations, are necessary for the supplier evaluation and selection problem. This paper introduces a new methodological approach including complementary, analytic hierarchy process (AHP), decision-making trial and evaluation laboratory (DEMATEL) techniques and Bayesian networks (BN). The combination of DEMATEL, AHP and Bayesian approaches, although they are supportive and complementary methods, has seen limited investigation. The Bayesian network approach can complement DEMATEL and AHP to help improve the accuracy of AHP input data. Alternatively, DEMATEL and AHP can provide expert and more objective inputs for intangible factors, used in the Bayesian network approach. The validity and efficacy of this approach is demonstrated through a real industrial case using decision-makers’ inputs and outputs. The study shows the advantages and disadvantages of each method. Finally, we present results with managerial and research implications and future research directions.

1. Introduction

In today’s business environment, most organizations have realized the critical nature of the relationship with suppliers and the importance of the strategic decision to evaluate and choose the best suppliers. Thus, many organizations refer to their suppliers as partners. On the other hand, organizations need to coordinate all their business activities, considering sustainability issues to gain competitive advantages [1]. Therefore, this relationship is no longer based on economic aspects.
Selecting a supplier is a strategic decision from multiple perspectives including customer satisfaction, technological ability and general business performance. Expanding this issue through sustainable supply chain management makes the choice and evaluation of suppliers even more critical and complex. Not surprisingly, the literature on sustainability and supplier selection (SS) is increasing. If selecting a supplier is a complex issue, selecting a sustainable supplier is even more complex. The dimensions to consider increase geometrically. New techniques that provide insightful knowledge and practical tools are required.
The implementation of sustainable practices is affected by different external factors. Ref. [1] stressed the necessity to be more involved not only in the internal process but also including the inter-organizational business systems and relationship with partners along the supply chain. Moreover, the implementation of sustainable initiatives is a complicated task without the cooperation with all partners in supply chain network. Therefore, the selection of suppliers based on integrated sustainability criteria using relevant methods can help companies to improve their sustainability performance. However, many present decision-making models regarding supplier selection focus on economic and environmental issues and less on social factors [2].
Many studies have reviewed the literature on supplier selection (SS) [3,4,5]. Indeed, the literature on supplier selection is extensive. Multiple criteria decision-making model (MCDM), mathematical programming (MP) and artificial intelligence (AI) techniques are some of the more popular approaches [6]. MCDM provides a methodological framework for decision support systems; MP is used to optimize or evaluate SS; AI identifies approximate solutions for complex optimization problems. MCDM approaches are the most popular, and within MCDM, the analytic hierarchy process (AHP) is most often applied [7]. AHP is very effective in ranking and selecting decision problems. It could be used alone or combined with other methods. Interaction and interdependent relationships among the evaluation criteria are critical and should be considered in order to evaluate a sustainable supplier [8]. The decision-making trial and evaluation laboratory (DEMATEL) can be valuable for this purpose.
In practical decision-making situations, the supplier selection problem is uncertain and imprecise. In risk assessment, researchers consider Bayesian network (BN) analysis as a helpful methodology for decision support under uncertainty. Although Bayesian analysis has been used for this issue [9], BN has not been used.
More precisely, more efforts are needed to take advantage of efficient techniques for selecting sustainable supplier in real cases [9]. In this sense, this research aims to answer the following research question: how to improve sustainable supplier selection and evaluation by using complementary approaches?
Given this situation, this study has the following objectives to answer the identified research question:
  • To provide a global picture of research into the sustainable supplier selection problem;
  • To propose a new decision-making tool using combined AHP-DEMATEL-BN methods in an uncertain environment for evaluating and selecting sustainable suppliers;
  • To validate the proposed approach in a real case and provide some managerial and research insights.
The remainder of this paper is structured as follows. Section 2 presents a review of the literature about supplier selection (SS) and sustainability in order to provide a global picture of research into the sustainable supplier selection problem. AHP, DEMATEL and BN for supplier selection problems will be the focus. The new approach, AHP-DEMATEL-BN, is explained and tested with a real case study in Section 3. The results are discussed in Section 4. Finally, Section 5 concludes and suggests some research avenues.

2. Literature Review

Many studies have demonstrated the importance of the supplier selection decision and its impact on overall supply chain network efficiency. Although SS is largely studied, the literature on sustainable supplier selection (SSS) problem is more limited [10]. SSS has been receiving more attention in recent years. Prior to 2005, there were only few papers, more or less one per year on SSS topics, reaching around 38 papers in 2014 [5]. Sustainable supplier selection faces similar methodological trends as those observed in supplier selection research. We shall only introduce some papers that have used the tools, separately, that we integrate in this study, to provide a foundation of the state-of-the-art modeling studies.
The literature considers multiple aspects of supplier selection. Sometimes, the focus is on a particular sustainability dimension. For example, the economic aspect for ranking suppliers is studied using AHP according to some criteria such as price, quality, delivery, and service using the case of the automotive industry in the developing country of Pakistan [11]. The authors highlighted the importance of developing a simple methodology for managers of the automotive industry so that they can select the best suppliers.
AHP as a standalone method has been used for evaluating criteria and ranking suppliers based on corporate social responsibility (CSR) dimensions [12]. These dimensions include human rights, underage labor, female labor, low working hours, pollution, safeguarding mechanisms and organizational legal responsibilities.
AHP has been also combined with a variety of methods; showing the flexibility of this tool, which we take advantage of in this study as well. As an example, some have used AHP to prioritize criteria and then VIKOR to rank suppliers [13]. Other studies identify the best sustainable supplier in similar ways but utilize TOPSIS instead of VIKOR as in [14]. Some studies have expanded supplier evaluation to multiple supply chain levels using these techniques [15]. Integration of statistical uncertainties into these joint MCDM models has not been explicitly completed.
Studies have also sought to link DEMATEL as a technique with MCDM approaches in order to consider interactions among criteria with selection purposes, e.g., [16]. Suggestions to add some sustainable criteria into these joint models have also appeared in studies [17,18]. These and other works further highlight the necessity to integrate social criteria to advance their models [19].
Some studies have applied BN to supplier selection. BN can model the uncertainty and vagueness of human information [20]. It translates the decision-maker’s knowledge into probabilistic relationships. BN is capable of capturing tangible and intangible variables [21]. It is capable of integrating a learning process [22]. This integrative characteristic makes it even more valuable for the supplier selection process, since there are numerous uncertainties, from objective performance to intangible characteristics such as relational building. The relationship graphs within BN provide insights into the decision-maker’s understanding and thought processes. BN has traditionally been used as a standalone approach, and it can integrate broader frameworks [22]. For example, linking BN and total cost of ownership gives a dual perspective to buyer–supplier decision-makers [20,23]. The malleability of BN and its advantages can help to address the disadvantages of other techniques that may not show a good path and uncertainty effectively.
DEMATEL may be used to elicit the BN structure. This rare integrative model is not a decision tool but is used for the structured analysis of relationships [19]. Adding MCDM methods to support decision-making has been recommended for this integrative approach. A recommended research avenue is to reinforce the descriptive model in using MCDM methods with DEMATEL and BN [24]. It is this additional step which we take—one that complements each of the various tools, allowing for more robust decision-making and analysis for sustainable supplier selection modeling.
In sustainable supplier selection (SSS), only two studies have used BN or Bayesian approaches [9,25]. A Bayesian framework is provided and tested with an illustrative example to select a supplier for sustainable operations [9]. The resilience of suppliers in using forward and backward propagation analysis is studied [25], but not specifically for sustainable suppliers. The authors integrate resilience, green and primary indicators in their model. Then, they test it with a numerical sample. These studies have utilized operational criteria such as lead time, cost and quality alongside green criteria such as carbon emissions and environmental practices. They stipulate that other criteria need to be incorporated into their models. They indicate that further investigation needs to be extended to other supply chains and real data.
In our study, an additional research avenue is to apply the extended model of [24] to a real case of sustainable supplier evaluation and selection as suggested by [9]. A summary of studies in supplier selection problems is presented in Table 1, focusing on methods and types of decision criteria according to the triple bottom line (TBL) approach for supplier selection and evaluation.
The following is a summary of observations of the sustainable supplier selection problem and current methods are based on the literature review presented in this section:
  • The three techniques are frequently used in the literature and combined with other techniques that help to build on each other’s capabilities, overcoming some of their weaknesses.
  • Despite the large number of studies proposing the use of AHP, DEMATEL and BN (Table 1), there is no study that considers sustainability criteria and examines the interrelationships among them in order to evaluate and select the right supplier using AHP-DEMATEL-BN simultaneously.
  • There is still limited literature that illustrates the use of these methods through a case example for the sustainable supplier selection problem in a practical and actual manufacturing setting.
Thus, the main purpose of this research work is to propose a new approach for sustainable partner selection by combining various decision-making techniques, taking advantage of their complementarities and addressing their weaknesses. An attempt is made to identify relevant evaluation criteria including sustainability aspects. This research work proposes a combined AHP-DEMATEL-BN framework for selecting the best sustainable supplier. To the best of our knowledge, this paper is an original effort in evaluating the suppliers in a real sustainable supply chain network based on the combination of these powerful techniques.

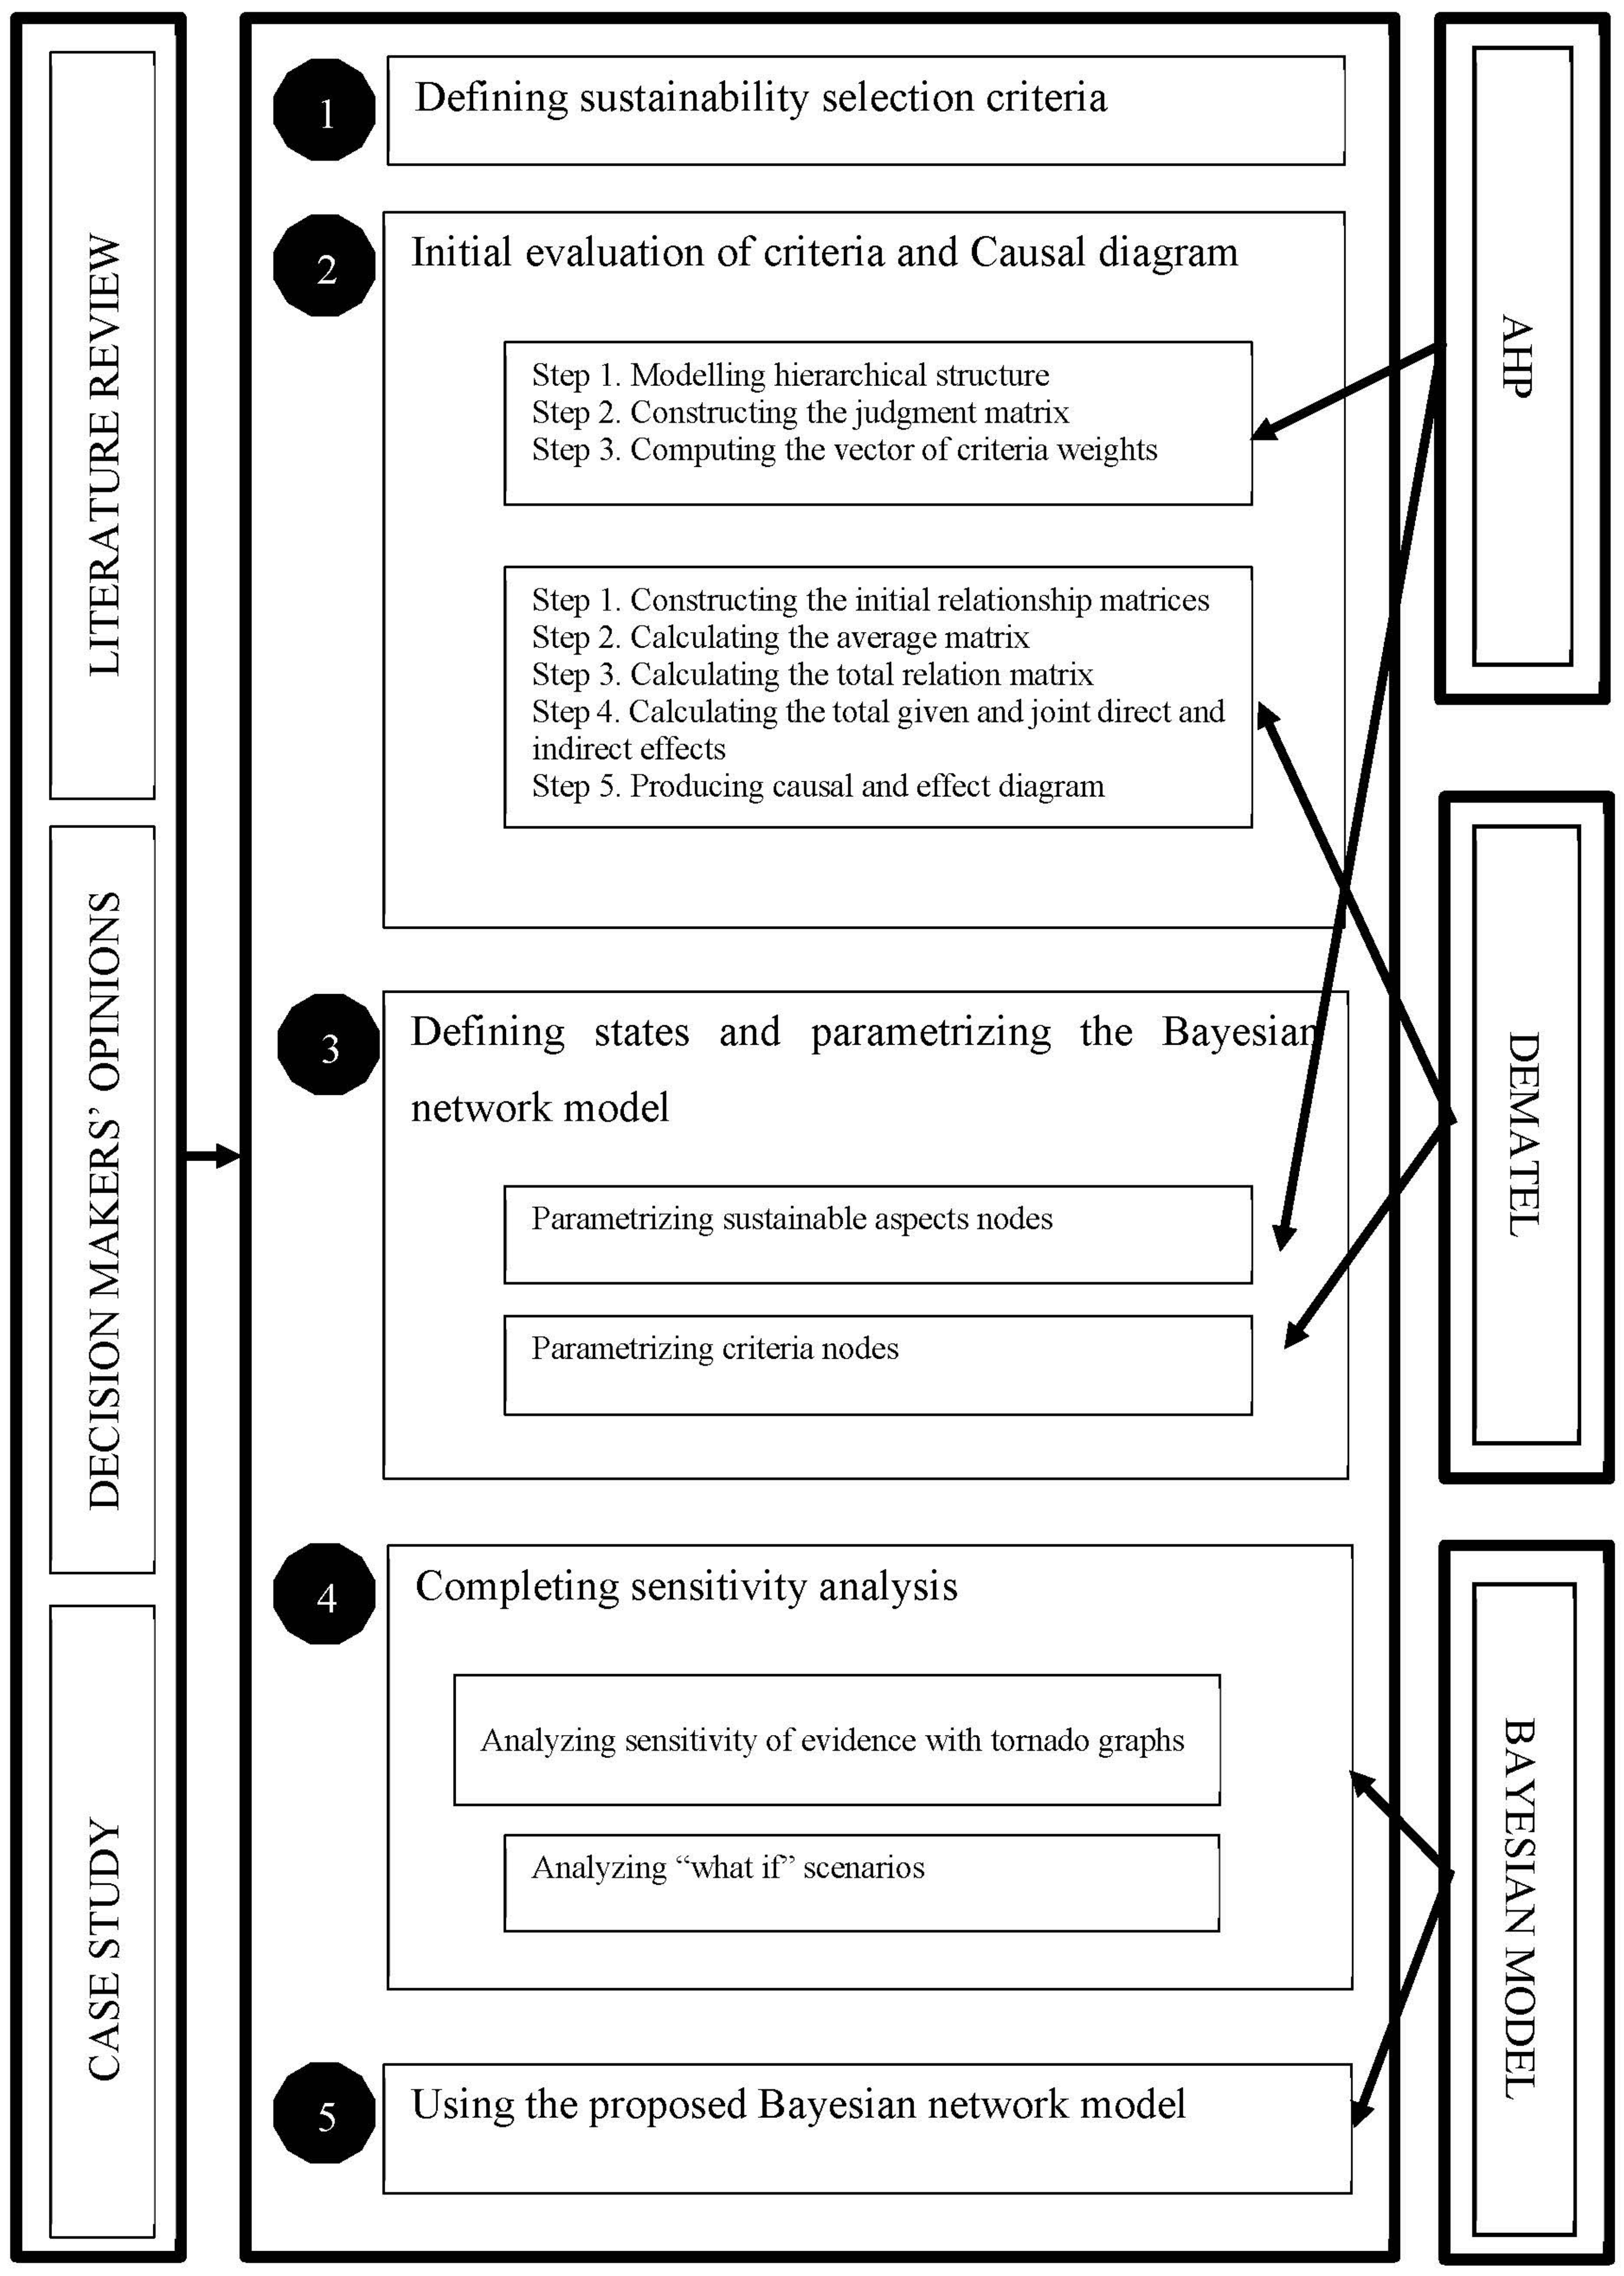
3. The AHP-DEMATEL-BN Approach

The contextual setting of this study is determining whether a supplier is a good partner for an organization, taking into consideration economic, environmental and social dimensions with uncertainties and limited information. Therefore, we propose a hydride approach based on AHP-DEMATEL-BN methods. Furthermore, the reasons and complementarities for combining AHP-DEMATEL-BN in this study include:
  • AHP evaluates the decision problems hierarchically by decomposing the complex problem into simpler subproblems, while the DEMATEL approach effectively evaluates decision-makers’ priorities at an initial level of decision-making. The supplier selection problem is decomposed to three goal levels, sustainable aspects and criteria. The importance weights of each sustainability dimension for decision makers are calculated using AHP. Then, these weights are integrated into a BN model.
  • AHP does not consider relations among the evaluation criteria and assumes that they are independent. DEMATEL’s complementarity deals with this issue. Using DEMATEL, the causal relations among the evaluation criteria are analyzed and the initial causal graph is proposed to build the BN model.
  • AHP and DEMATEL cannot be used alone as a decision-making tool to explicitly evaluate uncertainties and limited information. However, BNs have dominant properties for making probabilistic calculations despite the unknown information for some evaluation criteria.
  • By combining AHP, DEMATEL and BN, we model the sustainable supplier performance from both short-term and long-term viewpoints.
The proposed hybrid AHP-DEMATEL-BN approach is organized into five main steps as summarized in Figure 1.
Thus, we demonstrate an example depicted from a practical, real-life case problem in order to illustrate and evaluate the feasibility of the proposed approach. The situation discussed here is faced by an actual international manufacturing company.
The company has one site in France. It manufactures innovative industrial products for business clients by working on reducing water and energy consumption. It is a pioneering innovator in environmental approaches; it was recognized as a leader in environmental protection by the United States Agency for Environmental Protection and has been ISO14001 certified since 1997, with one of the earliest certifications in the world.
The manufacturing company wishes to evaluate its current and potential suppliers before choosing them for partnering. The company considers key factors affecting the sourcing functional efficiencies. The supplier is also evaluated and chosen using various sustainability criteria as part of the strategic organizational goal to achieve a sustainable competitive advantage. Currently, the company has two suppliers, identified as S₁ and S₂. It has also another potential supplier, S₃.
The study was conducted between September 2019 and February 2020. We started by a face-to-face meeting with different managers including a purchasing manager (DM1), a logistics manager (DM2) and a supply chain director (DM3) in the company under study. The objective of this meeting was first to better understand the problem and to validate the criteria found in the literature for the supplier selection problem with experts. Later, the same three decision-makers participated in each stage.
Thus, in the AHP stage, the three DMs in the company concerned was asked to answer a questionnaire including all possible pairwise comparisons for criteria. The questionnaire was presented in an Excel worksheet and sent by email for managers DM1, DM2, DM3. They jointly completed the questionnaire of the possible pairwise comparisons as they wanted to prioritize the criteria in the same way, so that they agreed on the preferences of the criteria. Thus, no aggregation was required for data at this stage. Then, we obtained matrix results and priority weights for evaluation criteria.
Next, in the DEMATEL stage, we sent by email also a questionnaire as an Excel worksheet for the three managers. Each decision-maker was asked to evaluate the direct influence of criterion “ci” on criterion “cj” using a linguistic scale. In order to aggregate the data from the three managers, the DEMATEL method was proposed to calculate the average matrix. Then, the sums of total effects and the net affect among all criteria are calculated.
Then, in the BN stage, we conducted first a meeting by video conference with the three managers in order to introduce the causal graph and the ordinal states (very low, low, medium, high and very high) that could be allocated for each criterion. These ranges were determined using feedback from three case company managers which were specific to their organization.
Then, decision-makers participated together a meeting and sent us by email data for case suppliers S1, S2 and S3, as a summary of their judgments regarding potential suppliers according to each criterion that was used as principal input in the BN model.
During the whole period, we also made intermediate online calls in order to present and discuss the results of each work package stage with the three decision-makers.
Then, the different steps of the proposed approach are explained through this case study.

3.1. Defining Sustainability Selection Criteria

This step is significant because a correctly identified set of criteria plays a vital role in supporting the decision-making process [6]. We define the criteria under economic (Eco), environmental (Env) and social dimensions (Soc) based on the literature review and the opinion of the decision-makers of the company. Thus, key decision criteria are investigated from a comprehensive literature review [5,9,15,25]. Then, these criteria are validated with decision-makers as an initial step in the sustainable supplier selection process. Criteria are defined as follows:
  • Overall costs (Eco1): This is a key criterion for evaluating a supplier because it dictates the total supply chain cost. This criterion includes transportation and purchasing costs.
  • Quality of product (Eco2): This is the capability of products and material to meet the quality standards for production processes. Scrap rate is used to determine the quality of delivered parts in this study.
  • Quality of service (Eco3): This criterion represents the ability of a partner to satisfy demand and perform various functions in terms of delivery.
  • Reducing pollution (Env1): The total emitted CO2 by each supplier is used to determine their performance regarding reducing pollution.
  • Resource consumption (Env2): Suppliers are evaluated regarding the amount of energy consumption. Building energy performance indicator in kwh/m2/year is used.
  • Environmental management system (Env3): The level of effort to reduce environmental impact is measured by an environmental management system certification (ISO 14001) (https://nbs.net/p/3-ways-smes-can-tackle-iso-14001-70c12e6b-8c15-428b-9c15-c248f08cf098). ISO 14001 has a progressive approach that breaks down the certification process into three successive levels.
  • Employment practices (Soc1): This critical criterion defines the total commitment of a potential partner regarding employment. It refers to the level of temporary workers in this study.
  • Health and safety (Soc2): Partners in the sustainable supply chain should aim to improve activities by minimizing health and safety incidents and implementing security practices to enhance the quality of life for employees. Number of incidents per year per 1000 employees is considered to evaluate the supplier.
  • Responsibility to stakeholders and community (Soc3): Funds given by a supplier for educational, charitable purposes and to support community projects and social programs could be considered when evaluating suppliers in terms of social responsibility.

3.2. Initial Criteria Evaluation and Causal Diagram Construction

3.2.1. AHP for Sustainability Dimension Weights and Hierarchical Structure

AHP is one of the most popular MCDM methods. One study found that the technique is used as a standalone approach in around 19% of supplier selection studies [33]. The basic concept of AHP is to cluster the data into smaller groups and, using pairwise comparison, weight elements at each level. It measures the decision-maker’s preference for one criterion over another by assigning a numerical value to the preference levels [34]. AHP is used to initially construct the BN model as a hierarchical structure. AHP assumes that criteria, at the same level of a hierarchy, are independent. In this study, the AHP for estimating the weights of selected criteria are summarized as follows:
Step 1: Modeling the sustainable supplier selection problem as a hierarchical structure.
We model the supplier selection problem as a hierarchical structure including a goal to evaluate the supplier at the first level, sustainable dimensions at the second level and criteria at the third level. Nine criteria, summarized in Section 3.1, are assumed to be the most relevant sustainability criteria; this set is suggested by firm decision-makers and has been incorporated into this study.
Step 2: Constructing the judgment matrices.
We construct the judgment matrices (CMs) for each level via pairwise comparisons with respect to the goal of selecting a sustainable supplier. The decision-maker (DM) preferences are based on comparing pairs of factors and are represented using a linguistic scale (equal importance = 1, somewhat important = 3, strongly more important = 5, very strongly more important = 7, extremely more important = 9, intermediate values = 2,4,6,8). A reciprocal value depending on the direction of preferences between pairs of factors populates the remaining portions of the matrix.
Step 3: Computing the vector of criteria weights.
A pairwise comparison is a n × n real matrix where n is the number of criteria. Each entry α j k represents the preference weight of the jth criterion relative to the kth criterion. If α j k > 1, the jth criterion is more important than the kth criterion and vice versa. α j k and α k j follow the constraint:
α j k × α k j = 1
A normalized pairwise comparison matrix norm is derived from CM. Each entry α j k ¯ is computed as:
α j k ¯ = α j k l = 1 n α l k
An “n” dimensional column vector, the criteria weight vector ω, is built by averaging each α j k ¯ :
ω j = l = 1 n α j l n
The calculation is completed using MATLAB software. The consistency is evaluated using the consistency ratio (CR) suggested by [34].
By applying AHP to the case study, the relative importance of each pair of elements is prioritized using input from three case company decision-makers as experts. These managers include a purchasing manager (DM1), a logistics manager (DM2) and a supply chain director (DM3). They jointly completed a questionnaire of the possible pairwise comparisons. The comparison matrices (CMs) are constructed along the sustainability dimensions and sustainability criteria levels. Table 2 presents the sustainability criteria matrix as an example.
Some revisions of judgment with the decision-makers (DMs) were necessary as some matrix consistency ratios exceeded 0.1. By applying AHP steps and using MATLAB software, the importance weights of dimensions (Weco, Wenv, Wsoc) are (0.618, 0.297, 0.086), respectively, with a consistency ratio (CR) of 0.07 (see Table 3). The economic factor is the most significant dimension in selecting a supplier for the DMs, with the highest value of priority weights W = 0.618.
Under the economic dimension, “Eco1: cost” is the most important criterion, with a total relative weight of 0.350. “Env1: reducing pollution” is the most important criterion under the environmental dimension, with a total weight of 0.193. Consequently, suppliers should focus on pollution reduction to help maintain an advantage over competing suppliers. “Soc3: responsibility to stakeholders and community” is the most significant criterion for supplier social consideration. The summary weights of the various dimensions and criteria presented in Table 3 are used as inputs in the BN model.

3.2.2. DEMATEL for Direct Relations and Causal Graph

The decision-making trial and evaluation laboratory (DEMATEL) method is a tool determining importance and causal relationships amongst various evaluation criteria [35]. This method may confirm interdependence among variables. DEMATEL results in grouping factors into “cause” and “effect” categories between factors. DEMATEL is used to build the initial BN causal graph using the final direct relationship matrix [24]. The various steps of DEMATEL are outlined as follows:
Step 1: Constructing the initial relationship matrices.
Assume there are n identified evaluation criteria for supplier selection made by m decision-makers. Each decision-maker is asked to evaluate the direct influence of criterion ci on criterion cj. This influence is assigned an integer linguistic scale value including 0 (no influence), 1 (low influence), 2 (medium influence), 3 (high influence) and 4 (very high influence). X1, X2, X3,…, Xm form an initial relation matrix, Xk = [ x i j k ], where k is the decision-maker participating in the evaluation process (1 ≤ km).
Step 2: Calculating the average matrix.
To aggregate all judgments from m decision-makers, the average matrix A = [aij] is calculated using expression (4):
A   = a i j   = 1 / m i = 1 m x i j k
Obtaining the normalized initial direct relation matrix.
The normalized initial direct relation matrix R = [rij], where rij (0, 1) can be obtained using expression (5).
R = λ * A λ = Min 1 max 1 i n j = 1 n a i j , 1 max 1 j n i = 1 n a i j
The value max 1 i n j = 1 n a i j indicates the value of the factor with the maximum direct effect on other factors. The value   max 1 j n i = 1 n a i j is the factor which is most affected by other factors. A positive scalar matrix λ is the upper bound and allocates the lowest value of these two to itself. The matrix R is obtained by dividing each element of matrix A by a scalar value λ. Each rij element from matrix R is a value between zero and one.
Step 3: Calculating the total relation matrix.
A continuous decrease in the indirect effects of problems along the powers of matrix R, e.g., R2, R3…., R, guarantees convergent solutions to the matrix inversion, similar to an absorbing Markov chain matrix. The full influence matrix F = [fij], where fij represents the full direct and indirect influence exerted by criterion ci on criterion cj, can be determined using expression (6):
F = R 1 R 1
where I is the identity matrix.
Step 4: Calculating the total cause and effect including joint direct and indirect effects.
Each row sum and column sum of matrix T is calculated using expressions (7) and (8), respectively:
q = q i n × 1 = j = 1 n F i j n × 1
P =   p j ` n × 1 = i = 1 n F i j ` n × 1
The value qi indicates the total direct and indirect effects which criterion i has on other criteria.
The value of pj indicates the direct and indirect effects of all other criteria on criterion j.
Thus, when j = i, the sum (qi + pi) yields an index representing the total effects on and by criterion i. In other words, (qi + pi) represents the prominence (degree of importance) that criterion i has in the system of criteria. The difference (qipi) indicates the net effect that criterion ci has on the system. When (qipi) is positive, criterion ci is a net causer, and when (qipi) is negative, criterion i is a net receiver.
Step 5: Producing causal and effect diagram.
The threshold value μ is computed by averaging the elements in matrix F in order to eliminate some minor effect relationships amongst factors in matrix F (see expression (9)):
μ = i n j n F i j L
where L is the total number of elements in the matrix F. The values of elements in matrix F are set to zero if their values are less than μ. That is, no influence is assumed with other criteria when values are less than μ. Finally, the network relationship map is determined by mapping the dataset of (q + p, qp), where the horizontal axis (q + p) is made by adding q to p, and the vertical axis (qp) is made by subtracting q from p.
We apply these steps to the case study. Xk represents the data gathered from the three decision-makers. The average matrix Aeco for economic criteria was established by using Equation (4).
A eco = 0 0.667 1 3.33 0 0 3.33 0 0
The normalized initial direct relation matrix Reco was calculated using Equation (5):
R eco = 0 0.111 0.15 0.50 0 0 0.50 0 0
The total relation matrix Feco is used for constructing a causal graph for a BN. The threshold value μ = 0.219 is defined. The values that were greater than μ = 0.219 represent the direct relation links between criteria. For example, the value of REco21 (0.571) > μ (0.219), the arrow in the causal map, is drawn from Eco2 to Eco1. Eco3 directly influences Eco1 as Reco31 (0.571) > μ (0.219). The total relation matrix Feco was calculated using Equation (3).
F eco = 0.143 0.114 0.171 0.571 0.057 0.085 0.571 0.057 0.085
The sums of rows and columns of matrix Feco were calculated by using Equations (7) and (8) as summarized in Table 4.
The importance of economic criteria is determined using the prominence index representing the total effects both directed to and from each criterion. Cost (Eco1) is the most prominent (important) evaluation criterion with the largest (q + p) value = 1.714, whereas quality of product (Eco2) is the least important criterion with the smallest (q + p) value = 0.943. From the (q + p) values, the criteria prioritization is Eco1 > Eco3 > Eco2, confirming the AHP results.
Using the net effect (qp) values, the criteria are divided into cause groups with positive (q − p) values and effect groups with negative (qp) values. In this study, the Eco3 and Eco2 are considered as net cause, having the (qp) values of 0.486 and 0.371, respectively. In the effect group, cost (Eco1) is classified as a net receiver, with a (q − p) value of −0.857.
The same process is repeated in order to obtain the cause and effect relationships among the environmental and social criteria as shown in Table 5 and Table 6.
Based on the AHP-DEMATEL method, the final causal model in Figure 2 sets the foundation for the BN analysis.

3.3. Defining the States and Parametrizing the Bayesian Network Model

BNs are network probabilistic models based on Bayes’ theorem and can be utilized for decision support. Bayes’ theorem considers prior probabilities about events and develops predictions based on new information. The fundamental property of BN can be simply explained as follows [36]:
A set of disjunctive events is considered S = {S1, S2,..., Sn}, where one of them is realized, j = 1 n P S j   = 1 . The occurrence of one event excludes the occurrence of others S j S i = ,   i , j = 1 , 2.. n , i j . The event I is observed, which can occur only under the condition that some of the events Sj, j = 1, 2,.., n have already occurred. Then, the conditional probability of event Sr, given that the event I has already been realized, is calculated using expression (10):
P S r / I   = P S r P I / S r P I = P S r P I / S r j = 1 n ( S j ) P I / S j
where P(Sj) is the probability of event Sj, i.e., the starting or an a priori probability. P(I) is the probability of event I. P(I/Sj) is the probability of event I, given that event Sj has occurred (conditional probability). P(Sj/I) is the probability of an event Sj given that event I has occurred (revised or a posteriori probability).
A BN begins with a graphical structure which is composed of nodes and arcs. Nodes represent events and arcs represent direct causal relationships between events. If there is an arc from event A to B, this means that event A is a parent of event B, and event B is a child of event A. The causal relationship between events can be described in terms of conditional probabilities. A BN structure can be constructed using expert knowledge. This construction is not trivial, especially when multiple decision-makers are used. However, a generally accepted method to build BN structures with decision-makers does not exist.
BNs are able of handling qualitative (poor/fair/good), Boolean (yes/no) or quantitative variables. Data representing these events are called states and may be derived from historical data, expertise or a combination of the two. The parameters of a BN are encoded in node probability tables (NPT). Each node has an associated NPT that defines the conditional probability distribution of that node conditioned on its parents.
After defining the states for each criterion, the BN parameters are determined using a ranked nodes method.
There are two types of variables used in the proposed BN model:
  • Qualitative variables have ranked responses with five ordinal states including very low, low, medium, high and very high for dimensions and criteria levels. These variables are represented by a ranked nodes method that reduces the number of parameters needed for each variable and simplifies the definition of NPTs for decision-makers. Ranked nodes assume a truncated normal (TNormal) distribution with a central tendency towards the probability of parent nodes due to a weighted function [24]. In this study, a weighted average (wmean) function for the ranked nodes is used. This function requires a coefficient and a variance parameter for every parent variable. These parameters are defined using AHP results for sustainable dimension nodes. The DEMATEL results are used for the criteria nodes.
  • Boolean variables have binary responses with true or false states. These variables are represented in the supplier selection node. For example, if (parents > 0.6, “True”, “False”), meaning “if the sum of the parent values is greater than 0.6 then the value is ‘True’; otherwise, it is ‘False’”.
Five ordinal states (very low, low, medium, high and very high) are introduced for each criterion. These ranges are determined using feedback from three case company managers which are specific to their organization. The specific ranges for variable states for each criterion are summarized in Table 7, Table 8 and Table 9.
Ranked nodes are used to parametrize the sustainable aspects and criteria nodes with weighted average (wmean) function in the case study. For the “wmean” function, we need to define a coefficient for each variable and a variance parameter.
For example, in the broader sustainability dimensions level of BN, the parents of the node “economic dimension” (Eco) are (Eco1, Eco2 and Eco3). The weights of these parents were defined from the values obtained by AHP as shown in Table 3.
The variance values for the ranked nodes were defined by the variance of the DEMATEL responses for the economic dimension (ECO). For example, when we asked the decision-makers (DM1), (DM2), (DM3) to answer the question “How much does cost (Eco1) influence the economic dimension (Eco)?”, they answered in different ways using the linguistic scale values (1 low, 2 medium, 3 high), respectively. Then, we calculate the variance of these answers by taking the difference between the largest and smallest valued responses, as shown in Table 10.
At the criteria level, the weights of each parent were defined based on their coefficients in the average direct relation matrix obtained from DEMATEL. For example, the parents of cost (Eco1) are (Eco2 and Eco3). The weights of these parents were defined from the values in matrix Aeco. The variance values for the ranked nodes were defined by the sum of variances of the DEMATEL questionnaire responses for Eco1 in Table 11.
The overall final target node is the supplier selection variable. This node provides a probability statement about whether the supplier should be selected, conditioned on environmental, social and economic nodes and considering their weights.
The supplier selection node is defined by a Boolean variable for which a probability measures whether a criterion is met (True) or not (False). The Boolean expression is (0.618 * Eco + 0.297 * Env + 0.086 * Soc > 0.6, “True”, “False”) based on the importance given to these criteria by the decision-makers according to the AHP results (Table 3). This means that the global performance of the supplier should be at least 60% but can be determined by the company. The value of 60% was determined according to the decision-makers and it can be unique according to specific company requirements.
After the parameters of all nodes are determined, the initial BN model is evaluated using “AgenaRisk” software as shown in Figure 3. In this initial BN, the decision regarding the selection of the supplier is approximately 71% false and 29% true. This means that if this supplier is selected, there is only a 29% probability that they will actually be the best overall performer.

3.4. Completing a Sensitivity Analysis

Sensitivity analysis provides evidence for the robustness of the solution. The objective is to verify how much each criterion is affected by the variation in the other criteria or parameters. This may also help to determine the most influential criteria. Sensitivity analysis was proposed using a tornado graph.
The length of the bars in the tornado graphs can be considered as the measure of the impact of sensitivity variables on the target variable and the sensitivity of this variable on other variables.
For example, a sensitivity analysis was performed for the supplier evaluation node with respect to economic, environmental and social aspects. The probability of supplier selection being true and false is 29% and 71%, respectively, as illustrated in the tornado graphs in Figure 4 and Figure 5. From these figures, we see that the probability of selecting a supplier is more sensitive to the changes in the value of the economic dimension and least sensitive to changes in social dimension values. We also carried out the sensitivity analysis regarding the criteria. For example, if the overall Eco dimension is “Very High”, given that the criteria parents remain equal, then the probability of selection of this supplier is 93.3%, meeting the performance expectations. In Figure 5, we see that if Eco = very low, then it is 100% likely not to be selected (this is also true in Figure 4, which shows a 0.000 probability of supplier selection = True when Eco = very low).
What-if scenario analyses (predictive analyses) are also conducted to evaluate the inferences of the model based on decision-maker knowledge. Such analyses can be performed by entering a number of observations into the BN to update the marginal probabilities of any unobserved variables. The objective is to examine how the posterior probabilities of the supplier selection criteria change when different evidence is entered into the model. For instance, we tested the impact of unknown information of some criteria on the decision for selecting a supplier. In scenario 1, we assumed information that there was a very high level for “health and safety (Soc2)” in the social dimension, very high level for “quality of product (Eco2)” in the economic dimension and with no information in the environmental dimension.
We can see that by increasing the health and safety (Soc2) result, considerable improvement is seen in social criteria employment practices (Soc1) from 20% to 82% (very high) and responsibility to stakeholders and community (Soc3) from 20% to 90% (very high). Considerable improvement is seen also in cost (Eco1) from 8.2% to 30% (very high) as a result of increasing product quality (Eco2) from 20% to 100% as shown in Figure 6. The overall decision for selecting this supplier is now 55.69% true; previously, this result in the base case was 29.3% true.
In scenario 2, as shown in Figure 7, we include the new environmental performance of the supplier. Assume that a high level of performance for (Env1) occurred, meaning that the supplier produced a very small quantity of total emitted CO2, possibly through improved supply and transport activities. Based on this information, our model predicts a high level in the environmental dimension. The decision about selecting this supplier now increases to approximately 71% true.
In scenario 3, presented in Figure 8, we have information only about the quality of service (Eco3) as a low level in the economic aspect and a high level of resource consumption (Env2) in the environmental aspect, and no social criteria information is provided. Based on this information, the probability of the economic performance being low is 41.049%. Thus, the decision about selecting this supplier is 82.245% false due to the very high importance of the economic dimension.
In summary, the proposed model enables the decision-makers to conduct a wide variety of scenario analyses with incomplete information. The information about supplier criteria can be conflicting, and the analyses could be revised when more information becomes available. Thus, the proposed BN are validated by decision-makers according to this sensitivity analysis.

3.5. Applying the Proposed Bayesian Network Model

In this case study, three alternative suppliers (S1, S2, S3) for a component to be purchased by the company are evaluated by the decision-makers. The manufacturer worked with supplier S1 and S2 before and they have some information from past experience. S3 is a new potential supplier with limited information from previous experience.
The offered component price by supplier S3 is USD 120. Thus, supplier S3 was assigned a medium level for criterion Eco1. The company asked S3 to send sample parts, the supplier delivered the parts on time, Eco2, and had a rejection rate < 1%. Eco3 is considered “high” in this case. For S3 environmental performance, the managers do not know the total emitted CO2 (Env1) or the energy performance indicator (Env2) of supplier S3. This supplier has implemented an environmental management system in order to obtain an environmental certification (Env3). For the social dimension, this supplier did not provide any information about employment practices (Soc1) or about the number of incidents (Soc2). They indicated a social responsibility budget (Soc3) as 7% of sales.
The managers have no information about the total carbon emissions (Env2) caused by supplier S2 activities. There is also no information about energy consumption (Env2). A summary of this and other case information from suppliers S1, S2, S3 is presented in Table 12.
We entered the values from Table 12 into the BN model results for suppliers S1, S2, S3. The results are illustrated in Figure 9.

4. Results Analysis and Managerial Implications

Based on sustainable criteria evaluation using AHP, the economic factor is the most significant dimension in selecting a supplier with the highest value of priority weights W = 0.618 for DMs. This helps DMs to understand the current state of practice in sustainable supplier selection in the company and to review and update their priorities regarding sustainability criteria.
On the other hand, after sharing the priorities with partners, they will pay more attention regarding the criteria which are more important for the DMs. For instance, for supplier S1, the social responsibility budget (Soc3) is only 2% of sales and this criterion is the most important criterion under the social aspect for DMs in the evaluation of the supplier. Thus, supplier S1 should increase this percentage of Soc3 to be better evaluated.
For DMs, the lack of certain information concerning the performance of the supplies should not prevent the possibility of an adequate evaluation. The proposed BN model allowed decision-makers to evaluate the global performance of each supplier despite the missing information regarding one criterion for supplier S1, two criteria for S2 and four criteria for supplier S3.
Thus, based on the evidence from past experience of supplier S1, the BN model predicts medium performance (approximately 52.76%) or high performance (approximately 47.24%) of reducing pollution quantity (Env1) due to the existence of a highly ranked environmental management system (Env3). Thus, selecting S1 as a partner is approximately 75% true. This result confirms the opinions of the decision-makers.
For supplier S2, the model predicts high-level performance for energy consumption (Env2), with a probability of 78.07% and also high-level performance for environmental management system criterion (Env3) with a probability of 76.68% as it demonstrates high performance in reducing pollution criterion (Env1). Its global economic performance (Eco) is predicted to be 50.31%, a medium level, which should be improved as this criterion is the most important for DMs in this case. The final decision about selecting supplier S2 is 58.2% true and 41.7% false. Therefore, supplier S2 should improve some areas of performance in order to satisfy the requirement level as a sustainable supplier. The result reinforces the decision-maker’s opinion about supplier S2. The company knew that S2 was not performing exceptionally well but did not know at which level and where S2 could improve. This model was useful in identifying some means of improving S2’s performance, allowing the company to strengthen collaboration by aiding in supplier development.
Using the incomplete information that decision-makers have about supplier S3, its environmental and social performance is likely to be high with probability (68.69%, 75.22%), respectively. Moreover, despite the high uncertainty due to the lack of information regarding the environmental criteria (Env1) and (Env2), social criteria (Soc1) and (Soc2), selecting S3 is approximately 76.4% true. This result is due to the high-level probability forecast of 58.91% in its global economic performance. The decision-makers believe that they can establish a partnership with this company.
Mathematically complex approaches are often not easily understood and useable by decision-makers [9]. Here, the methodology feedback from the managerial decision-makers was very positive. They find the model easy to use and helpful in evaluating suppliers. Causal expert-driven BNs are usually complex [25]. By combining AHP, DEMATEL and BNs, we simplify the building of the model while developing some methodological consistency. Using different types of events including Boolean and qualitative make the model flexible. Further, different sources of data ranging from historical to actual evidence were valuable as well and could be effectively integrated overall into the BN model. Furthering transparency and replicability in a clear rigorous process builds the legitimacy of the model. The graphical nature of the BN results makes the technique more accessible to management, furthering managerial acceptance [37]. The clarity and legitimacy are important when seeking the adoption of decision tools and models in organizations.
The proposed model is based on theoretical aspects and dimensions supported by organizational needs and requirements. Additionally, the results could have been varied in as required by the organizational decision-makers to further validate their specific “what-if” scenarios. The approach used in this study was to determine how the values changed and how sensitive the results were using the sensitivity analysis. This analysis can provide insights to decision-makers as to how the probability of the selection of a supplier changes according to different scenarios. BN models capture different types of uncertainties [24]. Our model takes into consideration information uncertainty and missing data. Once the initial decision environment is set, decision-makers only have to integrate states of criteria as new information emerges. The model is capable of achieving this very reliably and quickly. Even if they do not know each supplier and their details, the model provides initial intuitive, easy-to-interpret, tangible and useable results for decision-making.

5. Conclusions

5.1. Summary of Findings and Contributions

Evaluating and selecting suppliers according to the triple bottom line (TBL) approach can reinforce sustainable performance in supply networks. In practical situations, this task is a complicated multi-criteria decision-making problem and time-consuming assignment. This decision is generally imprecise and uncertain, with limited and unknown information. This study provides a global picture for sustainable supplier selection problems and proposes a decision-making tool using a combined, harmonized, AHP-DEMATEL-BN method. The decision environment provided some uncertainty for evaluating and selecting sustainable suppliers. The proposed approach could easily convert decision-maker knowledge and preferences into meaningful results. An actual case example for the sustainable supplier selection problem in a manufacturing company provided some managerial and research insights.
This research contributes to the field of sustainable supplier selection by incorporating judgment with actual data. Historical and unknown information were also integrated into the evaluation. These are real situations, which no one model can capture.
Based on AHP, DMs were able to evaluate sustainable criteria and to understand their current priorities in the supplier evaluation process. Using DEMATEL, the interactions among evaluation criteria with selection purposes were also clearly identified. The BN model allowed decision-makers to incorporate incomplete information and missing data. Thus, despite the high uncertainty due to the lack of information concerning the evaluation of certain suppliers, DMs were able to evaluate them in a clear, rigorous process.
Thus, the obtained results offer guidelines for analysts and decision-makers in order to understand the current issues related to the sustainable supplier selection process. These results can also help decision-makers to control evaluation criteria and to improve the relationships with their selected suppliers. This research demonstrated some of the advantages and disadvantages of each method. It was shown that AHP, DEMATEL and BN were good, complementary approaches.

5.2. Limitations

However, the approach has some limitations. We only focused on a small set of potential criteria for supplier evaluation and selection. In some cases, dozens of factors can be considered. In this situation, the decision environment becomes more complex. For instance, using AHP with more than nine evaluation criteria at the same level of hierarchy requires grouping some of them into an overall criterion and creating sub-criteria. Some filtering to key performance indicators (KPI) may be required for the methodology to remain tractable. As we have mentioned, one of the important characteristics of any model, its usefulness and acceptance, is dependent on how well managers understand the whole process. In this case, although some of the AHP analysis may be intuitive, the BN required greater explanation. Moreover, the use of the hydride approach based on AHP-DEMATEL-BN methods seems quite complicated for decision-makers in companies while selecting the supplier. Alternatively, the rigor provides an avenue for analysts to convince managers of the scientific propensity of the technique, further justifying decisions.
The model is based on decision-maker expertise, which implies the use of subjectivity as in other models [28]. The managers felt that they could trust the information because it validated how they felt. The issue is whether the approach is merely a validation or whether it truly guides decisions. If the results were found to be counterintuitive to their beliefs, the relative acceptance may be called into question [38]. There is also a cumbersome process given that different software and tools were used. With larger data requirements and information, the process of utilizing and entering data will require greater effort. Thus, preparation of the data may be needed beforehand.
Overall, the multistage approach, its transparency and managerial involvement in the model are part of what has been termed an evolutionary strategy for decision support [39]. The evolutionary approach for decision support system application utilizes judgment modeling, creates a felt need, provides insight into the decision process and the weighting of the decision variables and establishes a learning-based, participatory implementation strategy. Each of these characteristics is evidenced in the building of this methodology and in the case application.

5.3. Future Research Directions

Although we believe that our study can provide a new framework and a decision-making tool for selecting and evaluating suppliers in the sustainable supply chain, our research work could be expanded and improved in future research. Some future directions are identified as follows:
  • This study was more methodologically oriented as the research showed how the methodology can integrate various complex issues in managerial decision-making. As the problem size increases, the applicability and accuracy of the model will require further investigation. For example, what if the number of factors increases regarding the number of alternatives or criteria?
  • A complete validation of the study will be undertaken by considering more scenarios. Experimenting with the methodology would be worthwhile to determine if all scenarios are supportive. For example, what if all the data were known, or only known data were utilized? What if none of the data were known and it was a completely new product with new suppliers? How well can the model learn? These are all questions that may be asked in various experimental scenarios or in long-term longitudinal studies.
  • It will be also useful to expand the BN model with indicators for some criteria and to consider the decision-maker characteristics; for example, would supply chain managers differ from engineering or marketing managers?
  • Furthermore, the proposed model can be solved by using other approaches and the obtained results can be compared with each other using the Spearman rank correlation method, such as multiple criteria tools including ANP, TOPSIS and PROMETHEE, to name a few. Otherwise, different methods can be compared regarding the time, the complexity and the restriction on the number of alternatives or criteria used in the selection process in order to identify which method is more robust.
  • Additionally, this study can be extended to other domains for evaluation and selection decision-making problems. The update of the evaluation criteria according to each specific case will be necessary.
Finally, we sought to integrate a series of tools and found the technique useful and feasible. Thus, we continue to build on the important supplier selection field and knowledge.

Author Contributions

Conceptualization, N.K., A.J. and J.S.; Methodology, N.K., A.J. and J.S.; Visualization N.K. and A.J.; Formal Analysis & investigation, N.K. and A.J.; Validation, A.J. and J.S.; Resources and Data curation N.K. and A.J.; Supervision, J.S.; Writing—Original draft, N.K. and A.J.; Writing—Review & editing, N.K., A.J. and J.S. All authors have read and agreed to the published version of the manuscript.

Funding

This research received no external funding.

Conflicts of Interest

The authors declare no conflict of interest.

References

  1. Rostamzadeh, R.; Ghorabaee, M.K.; Govindan, K.; Esmaeili, A.; Nobar, H.B.K. Evaluation of sustainable supply chain risk management using an integrated fuzzy TOPSIS- CRITIC approach. J. Clean. Prod. 2018, 175, 651–669. [Google Scholar] [CrossRef]
  2. Bai, C.; Kusi-Sarpong, S.; Ahmadi, H.B.; Sarkis, J. Social sustainable supplier evaluation and selection: A group decision-support approach. Int. J. Prod. Res. 2019, 57, 7046–7067. [Google Scholar] [CrossRef]
  3. Chai, J.; Liu, J.N.K.; Ngai, E.W.T. Application of decision-making techniques in supplier selection: A systematic review of literature. Expert Syst. Appl. 2013, 40, 3872–3885. [Google Scholar] [CrossRef]
  4. Jain, V.; Kumar, S.; Kumar, A.; Chandra, C. An integrated buyer initiated decision-making process for green supplier selection. J. Manuf. Syst. 2016, 41, 256–265. [Google Scholar] [CrossRef]
  5. Zimmer, K.; Fröhling, M.; Schultmann, F. Sustainable supplier management—A review of models supporting sustainable supplier selection, monitoring and development. Int. J. Prod. Res. 2016, 54, 1412–1442. [Google Scholar] [CrossRef]
  6. Konys, A. Green Supplier Selection Criteria: From a Literature Review to a Comprehensive Knowledge Base. Sustainability 2019, 11, 4208. [Google Scholar] [CrossRef] [Green Version]
  7. Chowdhury, P.; Paul, S.K. Applications of MCDM methods in research on corporate sustainability: A systematic literature review. Manag. Environ. Qual. Int. J. 2020, 31, 385–405. [Google Scholar] [CrossRef]
  8. Wang, X.; Cai, J.; Xiao, J. A Novel Decision-Making Framework for Sustainable Supplier Selection Considering Interaction among Criteria with Heterogeneous Information. Sustainability 2019, 11, 2820. [Google Scholar] [CrossRef] [Green Version]
  9. Sarkis, J.; Dhavale, D.G. Supplier selection for sustainable operations: A triple-bottom-line approach using a Bayesian framework. Int. J. Prod. Econ. 2015, 166, 177–191. [Google Scholar] [CrossRef]
  10. Govindan, K.; Rajendran, S.; Sarkis, J.; Murugesan, P. Multi criteria decision making approaches for green supplier evaluation and selection: A literature review. J. Clean. Prod. 2015, 98, 66–83. [Google Scholar] [CrossRef]
  11. Dweiri, F.; Kumar, S.; Khan, S.A.; Jain, V. Designing an integrated AHP based decision support system for supplier selection in automotive industry. Expert Syst. Appl. 2016, 62, 273–283. [Google Scholar] [CrossRef]
  12. Xu, L.; Kumar, D.T.; Shankar, K.M.; Kannan, D.; Chen, G. Analyzing criteria and sub-criteria for the corporate social responsibility-based supplier selection process using AHP. Int. J. Adv. Manuf. Technol. 2013, 68, 907–916. [Google Scholar] [CrossRef]
  13. Awasthi, A.; Govindan, K.; Gold, S. Multi-tier sustainable global supplier selection using a fuzzy AHP-VIKOR based approach. Int. J. Prod. Econ. 2018, 195, 106–117. [Google Scholar] [CrossRef] [Green Version]
  14. Muhammad, N.; Fang, Z.; Shah, S.A.A.; Akbar, M.A.; Alsanad, A.; Gumaei, A.; Solangi, Y.A. A Hybrid Multi-Criteria Approach for Evaluation and Selection of Sustainable Suppliers in the Avionics Industry of Pakistan. Sustainability 2020, 12, 4744. [Google Scholar] [CrossRef]
  15. Kafa, N.; Hani, Y.; El Mhamedi, A. Evaluating and selecting partners in sustainable supply chain network: A comparative analysis of combined fuzzy multi-criteria approaches. Opsearch 2018, 55, 14–49. [Google Scholar] [CrossRef]
  16. Dalalah, D.; Hayajneh, M.; Batieha, F. A fuzzy multi-criteria decision making model for supplier selection. Expert Syst. Appl. 2011, 38, 8384–8391. [Google Scholar] [CrossRef]
  17. Chang, B.; Chang, C.-W.; Wu, C.-H. Fuzzy DEMATEL method for developing supplier selection criteria. Expert Syst. Appl. 2011, 38, 1850–1858. [Google Scholar] [CrossRef]
  18. Kuo, T.; Hsu, C.-W.; Li, J.-Y. Developing a green supplier selection model by using the DANP with VIKOR. Sustainability 2015, 7, 1661–1689. [Google Scholar] [CrossRef] [Green Version]
  19. Luthra, S.; Kumar, A.; Zavadskas, E.K.; Mangla, S.K.; Garza-Reyes, J.A. Industry 4.0 as an enabler of sustainability diffusion in supply chain: An analysis of influential strength of drivers in an emerging economy. Int. J. Prod. Res. 2020, 58, 1505–1521. [Google Scholar] [CrossRef]
  20. Ferreira, L.; Borenstein, D. A fuzzy-Bayesian model for supplier selection. Expert Syst. Appl. 2012, 39, 7834–7844. [Google Scholar] [CrossRef]
  21. Fenton, N.; Neil, M. Risk Assessment and Decision Analysis with Bayesian Networks; CRC Press: Boca Raton, FL, USA, 2012. [Google Scholar]
  22. Dogan, I.; Aydin, N. Combining Bayesian Networks and Total Cost of Ownership method for supplier selection analysis. Comput. Ind. Eng. 2011, 61, 1072–1085. [Google Scholar] [CrossRef]
  23. Abidin, Z.U.; Ali, H.M.K.; Hussain, S.; Wasim, A.; Jahanzaib, M. Supplier selection in an industry of short lifecycle products using bayesian network analysis. Pak. J. Sci. 2016, 68, 157. [Google Scholar]
  24. Kaya, R.; Yet, B. Building Bayesian Networks based on DEMA℡ for Multiple Criteria Decision Problems: A Supplier Selection Case Study. Expert Syst. Appl. 2019, 134, 234–248. [Google Scholar] [CrossRef]
  25. Hosseini, S.; Barker, K. A Bayesian network model for resilience-based supplier selection. Int. J. Prod. Econ. 2016, 180, 68–87. [Google Scholar] [CrossRef]
  26. Shaw, K.; Shankar, R.; Yadav, S.S.; Thakur, L.S. Supplier selection using fuzzy AHP and fuzzy multi-objective linear programming for developing low carbon supply chain. Expert Syst. Appl. 2012, 39, 8182–8192. [Google Scholar] [CrossRef]
  27. Wan, S.; Xu, G.; Dong, J. Supplier selection using ANP and ELECTRE II in interval 2-tuple linguistic environment. Inf. Sci. 2017, 385–386, 19–38. [Google Scholar] [CrossRef]
  28. Luthra, S.; Govindan, K.; Kannan, D.; Mangla, S.K.; Garg, C.P. An integrated framework for sustainable supplier selection and evaluation in supply chains. J. Clean. Prod. 2017, 140, 1686–1698. [Google Scholar] [CrossRef]
  29. Chatterjee, K.; Pamucar, D.; Zavadskas, E.K. Evaluating the performance of suppliers based on using the R’AMATEL-MAIRCA method for green supply chain implementation in electronics industry. J. Clean. Prod. 2018, 184, 101–129. [Google Scholar] [CrossRef]
  30. Lu, H.; Jiang, S.; Song, W.; Ming, X. A Rough Multi-Criteria Decision-Making Approach for Sustainable Supplier Selection under Vague Environment. Sustainability 2018, 10, 2622. [Google Scholar] [CrossRef] [Green Version]
  31. Yazdani, M.; Zarate, P.; Kazimieras Zavadskas, E.; Turskis, Z. A combined compromise solution (CoCoSo) method for multi-criteria decision-making problems. Manag. Decis. 2019, 57, 2501–2519. [Google Scholar] [CrossRef]
  32. Hasan, M.M.; Jiang, D.; Ullah, A.M.M.S.; Noor-E-Alam, M. Resilient supplier selection in logistics 4.0 with heterogeneous information. Expert Syst. Appl. 2020, 139, 112799. [Google Scholar] [CrossRef]
  33. Tahriri, F.; Osman, M.R.; Ali, A.; Yusuff, R.M.; Esfandiary, A. AHP approach for supplier evaluation and selection in a steel manufacturing company. J. Ind. Eng. Manag. 2008, 1, 54–76. [Google Scholar] [CrossRef]
  34. Saaty, T.L. Decision making with the analytic hierarchy process. Int. J. Serv. Sci. 2008, 1, 83–98. [Google Scholar] [CrossRef] [Green Version]
  35. Gabus, A.; Fontela, E. World Problems, an Invitation to Further Thought within the Framework of DEMATEL; Battelle Geneva Research Center: Geneva, Switzerland, 1972; pp. 1–8. [Google Scholar]
  36. Verma, T.; Pearl, J. Causal networks: Semantics and expressiveness. In Machine Intelligence and Pattern Recognition; Elsevier: Amsterdam, The Netherlands, 1990; Volume 9, pp. 69–76. [Google Scholar]
  37. Liu, Y.; Eckert, C.; Yannou-Le Bris, G.; Petit, G. A fuzzy decision tool to evaluate the sustainable performance of suppliers in an agrifood value chain. Comput. Ind. Eng. 2019, 127, 196–212. [Google Scholar] [CrossRef]
  38. Little, J.D. Models and managers: The concept of a decision calculus. Manag. Sci. 1970, 16, B-466–B-577. [Google Scholar] [CrossRef] [Green Version]
  39. Alavi, M.; Henderson, J.C. An Evolutionary Strategy for Implementing a Decision Support System. Manag. Sci. 1981, 27, 1309–1323. [Google Scholar] [CrossRef]
Figure 1. Graphical representation of multi-stage hybrid decision support methodology using AHP-DEMATEL-BN.
Sustainability 12 10584 g001
Figure 2. Initial hierarchical causal graph.
Sustainability 12 10584 g002
Figure 3. The proposed BN model.
Sustainability 12 10584 g003
Figure 4. Sensitivity analysis of supplier evaluation across Eco, Env and Soc aspects (supplier evaluation = True = 29.3%).
Sustainability 12 10584 g004
Figure 5. Sensitivity analysis of supplier evaluation across Eco, Env and Soc aspects (supplier evaluation = False = 70.7%).
Sustainability 12 10584 g005
Figure 6. Scenario 1: with very high health and safety (Soc2) and quality of product (Eco2).
Sustainability 12 10584 g006
Figure 7. Scenario 2: very high health and safety (Soc2) and quality of product (Eco2) and high reduction in pollution (Env1).
Sustainability 12 10584 g007
Figure 8. Scenario 3: low quality of service (Eco3) and high resource consumption (Env2).
Sustainability 12 10584 g008
Figure 9. BN model for suppliers S1, S2 and S3.
Sustainability 12 10584 g009
Table 1. AHP, DEMATEL and BN techniques in supplier selection problem.
ReferencesYearDecision CriteriaMethods
Eco.Env.Soc.
[22]2011x BN, Total cost of ownership
[16]2011x DEMATEL, TOPSIS
[17]2011x Fuzzy DEMATEL
[20]2012x BN fuzzy logic
[26]2012xx Fuzzy AHP, fuzzy LP
[12]2013xxxAHP
[18]2015xx DEMATEL, VIKOR
[9]2015xxxBN, Markov chain
[23]2016x BN
[11]2016x AHP
[25]2016xx BN
[27]2017x Interval 2-tuple, ANP, ELECTRE
[28]2017xxxAHP, VIKOR
[29]2018xx DEMATEL, ANP, MAIRCA
[13]2018xxxFuzzy AHP, VIKOR
[15]2018xxxAHP, PROMETHEE, TOPSIS
[30]2018xxxELECTRE
[2]2019 xBWM, TODIM
[31]2019x CoCoSo
[24]2019x BN, DEMATEL
[32]2020x TOPSIS
[14]2020x Fuzzy AHP, fuzzy TOPSIS
This study xxxAHP, DEMATEL, BN
Table 2. Matrix results for criteria level.
Economic Criteria (ECO)Environmental Criteria (ENV)Social Criteria (SOC)
Eco1Eco2Eco3Env1Env2Env3Soc1Soc2Soc3
11/3515311/51/3
3131/513515
1/51/311/31/3131/51
Table 3. Priority weights of evaluation criteria using the AHP method.
Dimensions WeightsCriteriaTotal WeightsConsistency
ECO (0.618)Eco₁0.350CR = 0.090
Eco₂0.067
Eco₃0.199
ENV (0.297)Env₁0.193CR = 0.086
Env₂0.038
Env₃0.066
SOC (0.086)Soc₁0.008CR = 0.078
Soc₂0.017
Soc₃0.060
Table 4. The sums of total effects and the net affect among economic criteria.
Eco1Eco2Eco3qpq + pq − p
Eco10.1430.1140.1710.4841.2861.714−0.857
Eco20.5710.0570.0850.7140.2280.9430.486
Eco30.5710.0570.0860.7140.3431.0570.371
Table 5. The sums of total effects and the net affect among environmental criteria.
Env1Env2Env3qpq + pq − p
Env10.3030.3760.2540.9321.971 2.904−1.038
Env20.6960.2260.1821.1041.441 2.545−0.337
Env30.9720.8390.2152.0260.6512.6771.375
Table 6. The sums of total effects and the net affect among social criteria.
Soc1Soc2Soc3qpq + pq − p
Soc10.053 0.114 0.1110.2780.6590.937−0.381
Soc 20.098 0.0680.1110.2780.841 1.119−0.563
Soc 30.508 0.659 0.1111.2780.3331.6110.944
Table 7. Economic criteria states and ranges.
StateEco1 (Cost)Eco2 (Scrap Rate)Eco3 (Delivery on Time)
Very low>200$>10%97%
Low(150$, 200$)(5%, 10%)(97%, 98%)
Medium(100$, 150$)(2%, 5%)0,98%
High(50$, 100$)(1%, 2%)(98%, 99%)
Very highPrice < 50$<1%>99%
Table 8. Environmental criteria states and ranges.
StateEnv1 (Total Emitted kgCO2e/kg Product)Env2 (Energy Performance Indicator in kwh/m2/year)Env3 (Environmental Certification ISO 14001)
Very low>750>160Supplier has no environmental certification
Low(500, 750)(130, 160)Supplier has green practices
Medium(250, 500)(100, 130)Supplier is in level 1 of ISO 14001
High(25, 250)(70, 100)Supplier is in level 2 of ISO 14001
Very high<25<70Supplier is in level 3 of ISO 14001
Table 9. Social criteria states and ranges.
StateSoc1 (Temporary Workers)Soc2 (Number of Incidents Per Year Per 1000 Employees)Soc3 (Responsibility Budget as Percent of Sales)
Very low>60>100<0%
Low(50, 60)(80, 100)(1%, 2%)
Medium(35, 50)(60, 80)(2%, 5%)
High(20, 35)(40, 60)(5%, 10%)
Very high<20<40>10%
Table 10. Means and variances of effects of Eco1, Eco2 and Eco3 on Eco.
ParametersHow Much Does Cost (Eco1) Influence the Economic Dimension (Eco)?How Much Does Quality of Product (Eco2) Influence the Economic Dimension (Eco)?How Much Does Quality of Service (Eco3) Influence the Economic Dimension (Eco)?
Mean0.3500.0670.199
Variance0.010.010.01
Table 11. Means and variances of effects of Eco2, Eco3 on Eco1.
ParametersHow Much Does (Eco2) Influence (Eco1)?How Much Does (Eco3) Influence Cost (Eco1)?
Mean3.333.33
Variance0.3330.333
Table 12. Data for case Suppliers S1, S2 and S3.
CriteriaS1S2S3
Eco1HighMediumMedium
Eco2HighHighHigh
Eco3HighHighVery high
Env1No informationHighNo information
Env2MediumNo informationNo information
Env3HighNo informationHigh
Soc1HighHighNo information
Soc2LowMediumNo information
Soc3MediumMediumHigh
Publisher’s Note: MDPI stays neutral with regard to jurisdictional claims in published maps and institutional affiliations.

