Article

Life Cycle Environmental and Economic Performance Analysis of Bagasse-Based Electricity in Pakistan

1
The Joint Graduate School of Energy and Environment, King Mongkut’s University of Technology Thonburi, Bangkok 10140, Thailand
2
Center of Excellence on Energy Technology and Environment (CEE), PERDO, Ministry of Higher Education, Science, Research and Innovation, Bangkok 10400, Thailand
3
US Pakistan Center for Advanced Studies in Water, Mehran University of Engineering and Technology, Jamshoro 76020, Pakistan
*
Author to whom correspondence should be addressed.
Sustainability 2020, 12(24), 10594; https://doi.org/10.3390/su122410594
Submission received: 3 December 2020 / Revised: 13 December 2020 / Accepted: 15 December 2020 / Published: 18 December 2020

Abstract

:
Bagasse-based electricity is gaining attention as an affordable, reliable, sustainable, and promising renewable energy source in Pakistan. Therefore, the focus of this analysis was to identify the environmental burdens associated with bagasse-based electricity production via high-pressure cogeneration. The scope of this study was defined as cradle to gate; involving cane production, cane transportation to the mill, the production of bagasse, and then the burning of bagasse in the cogeneration power plant to produce electricity. The overall results revealed that most of the impacts were contributed by the agricultural phase. For some impact categories—such as global warming, fine particulate matter formation, terrestrial acidification, and fossil resource scarcity—the bagasse-based electricity performed better than the grid mix electricity. However, the grid mix electricity performed better than the bagasse-based electricity in terms of eutrophication, land use, and water consumption. When considering the final damage, the bagasse-based electricity proved to be the favorable option in terms of human health and resource availability; however, ecosystem quality was poor in bagasse-based electricity. In terms of environmental prices, the bagasse-based electricity was found to be a promising option compared to the grid mix electricity.

1. Introduction

To achieve the ambitious and time-bound targets of the United Nation’s Sustainable Development Goals, the government of Pakistan is endeavoring to explore affordable, reliable, and sustainable energy sources [1,2]. The country aims to increase the share of renewables in the grid mix of Pakistan (i.e., national electricity produced from multiple energy sources) up to thirty percent by 2030 [1]. During the last decade, the country was challenged with severe energy crises. Therefore, the government considered exploring numerous alternative options to fulfill the current and future energy demand. In this regard, the substantial potential of renewable sources within the country was also acknowledged. A significant proportion of the energy demand can be met by these indigenous renewable sources, such as agricultural residues, on a commercial basis by deploying the appropriate technologies [3].

1.1. Rationale

Agriculture has always been the largest sector in Pakistan, employing nearly 42% of the labor force and contributing around 19% to the total GDP of the country [4]. The major crops produced in the country are wheat, maize, rice, sugarcane, and cotton. According to the Food and Agriculture Organization Corporate Statistical Database (FAOSTAT) [5], Pakistan is ranked as the fifth largest sugarcane producer globally after Brazil, India, China, and Thailand. As shown in Figure 1, the production of sugarcane reached a historically high level of 83 million Mg during the fiscal years (FY) 2017–2018; moreover, the area under sugarcane cultivation (i.e., 1.3 million ha) also increased by 10.2% as compared to the previous year [6,7].
Pakistan is one of the most vulnerable countries and ranked 7th among the most affected regions in the world by climate change [8]. The total greenhouse gas (GHG) emissions of Pakistan for the FY 2014–2015 were estimated at 329.5 million Mg CO2 equivalent; the main sectors that contributed to GHG emissions were Energy (51.1%), Agriculture (38.2%), Industrial Processes (5.6%), Land Use Change and Forestry (2.8%), and Waste (2.2%) [9]. Interestingly, the energy and agriculture sectors together are emitting almost 90% of the total GHG emissions, with 51% being contributed by the energy sector alone. The fossil fuel combustion emissions constitute more than 90% of the total emissions from the energy sector [9]. (see Figure 2).
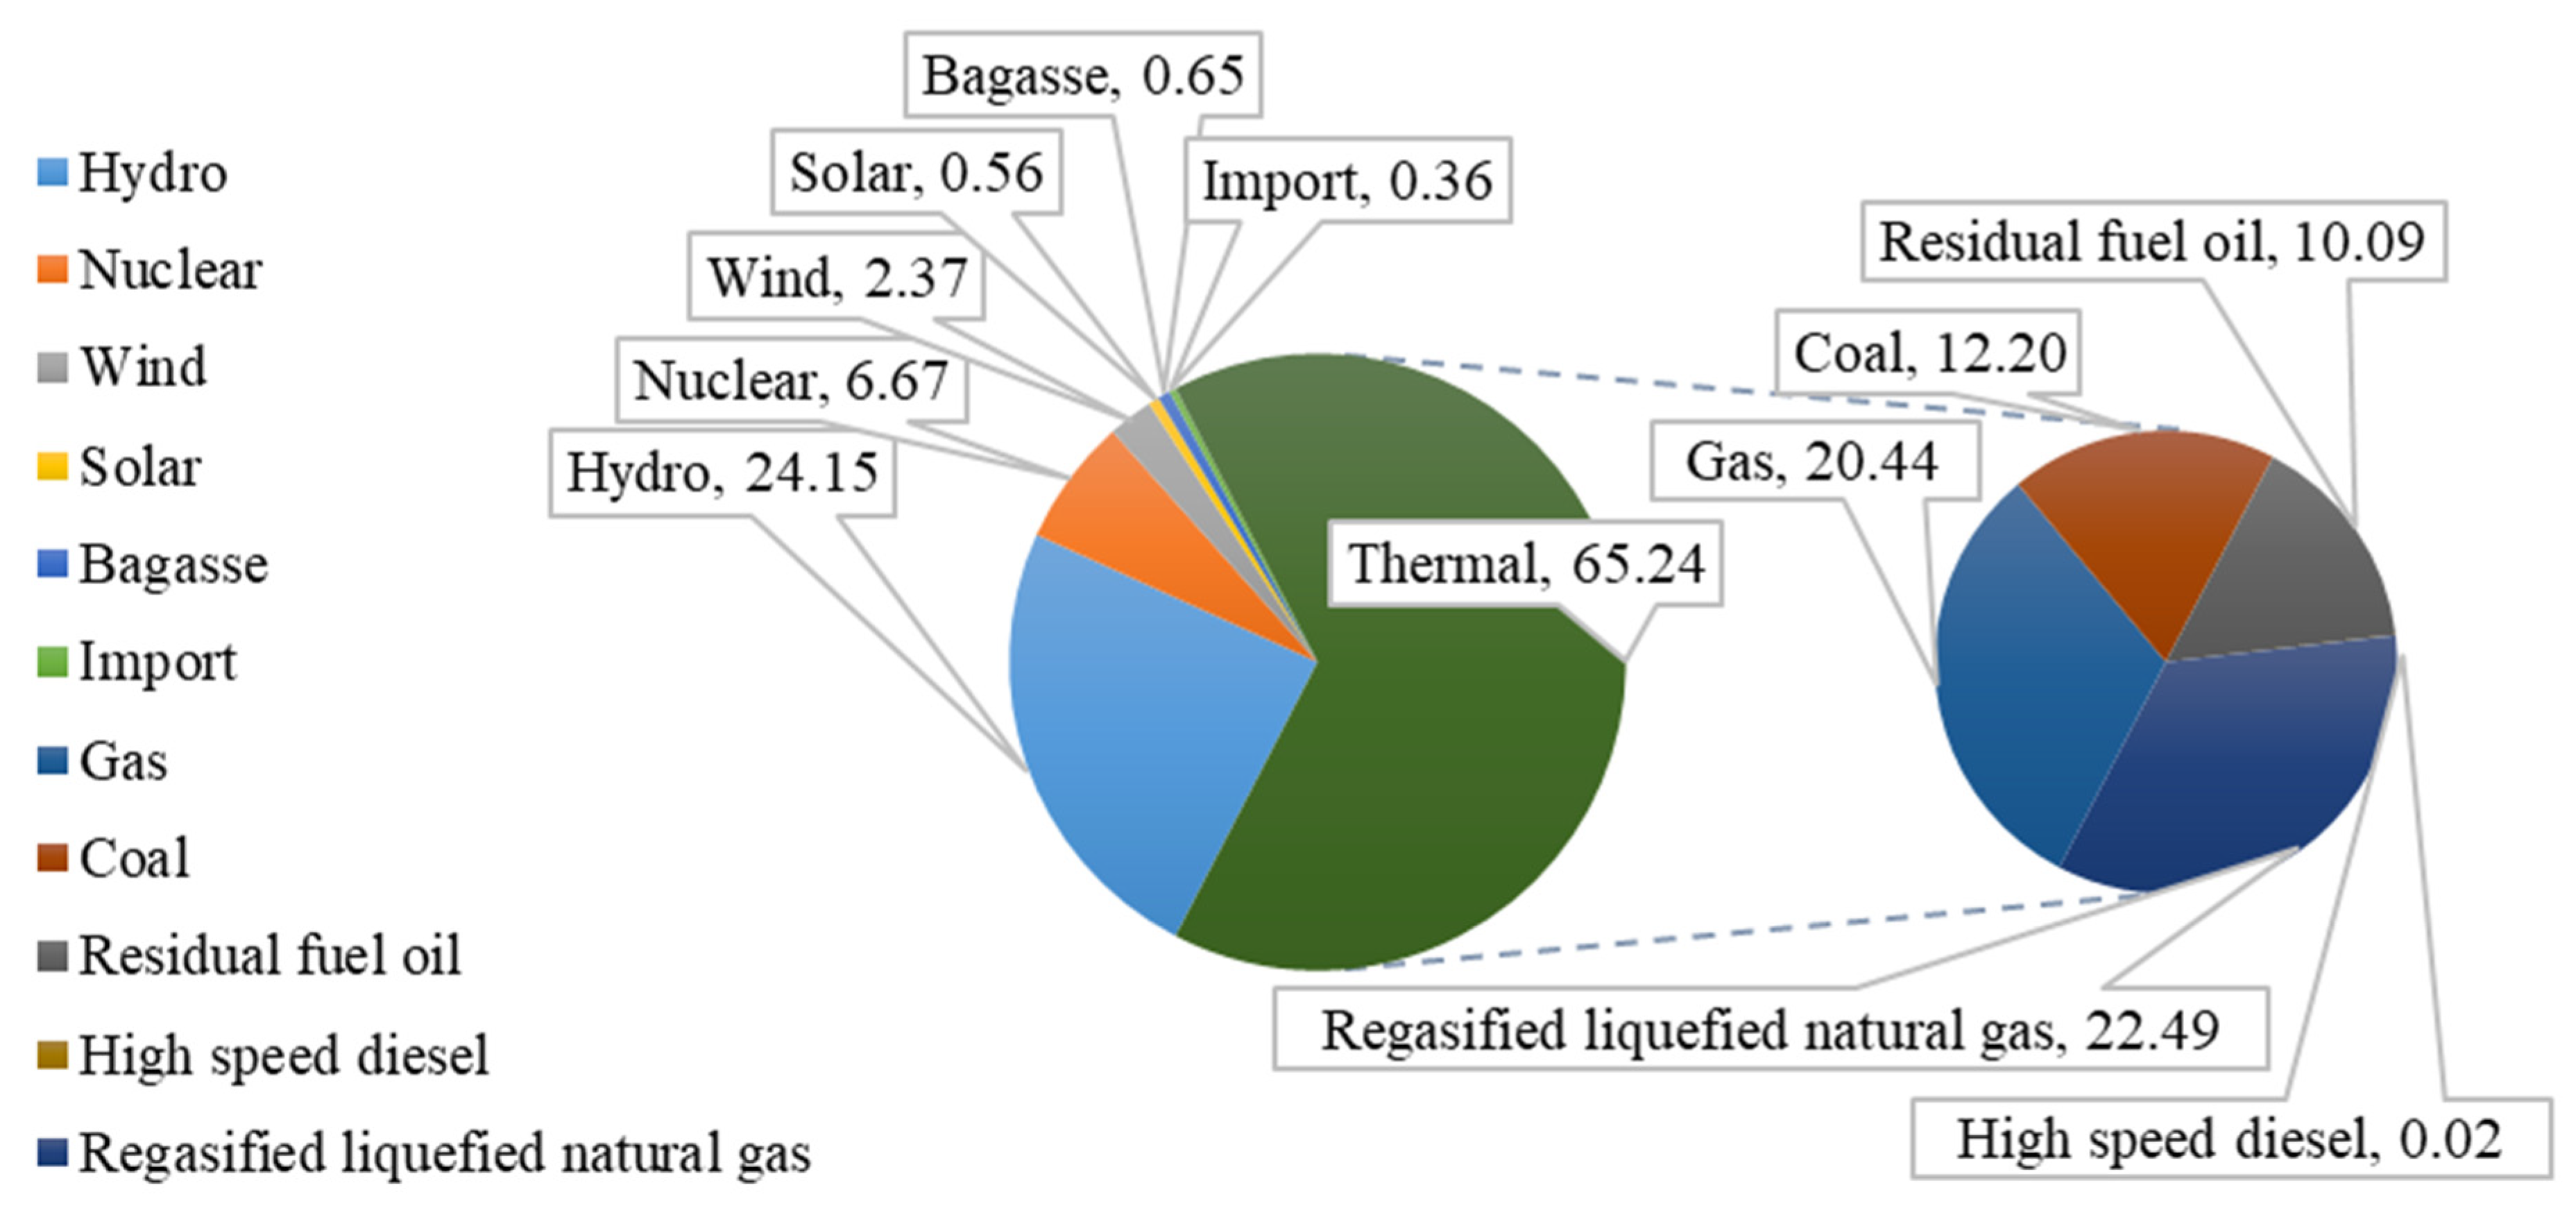
Furthermore, a worryingly huge amount of fossil fuels is being imported to fulfill the energy demand, thus raising serious concerns about energy security. The energy sector in the country has been the largest sector consuming a significant portion of these imported fossil fuels (i.e., liquefied natural gas (LNG), crude oil, and coal) [4]. The installed capacity for electricity generation until June 2019 was 39,145 MW; the share of electricity generation by the type of fuel includes 65.24% as thermal, 24.15% as hydroelectric, 6.67% as nuclear, 0.36% imported (Iran), and the remaining 3.58% share from others (i.e., wind, solar, and bagasse), as shown in Figure 3 [10]. Pakistan is mainly dependent on thermal-based electricity from fossil fuel combustion, which is not a viable option for the country in the long run as most of these fossil fuels are imported. In addition, thermal power generation is not favored because of its associated environmental impacts. Therefore, among renewable sources, biomass-based electricity generation has the potential requiring exploration.

1.2. Potential of Bagasse for Electricity Production from Bagasse in Pakistan

Bagasse is one of the most used biomasses for generating energy around the world [11]. This notable fibrous material is obtained after juice extraction from sugarcane at the milling stage. In the crushing season of 2017–2018 in Pakistan, around 66 million Mg of sugarcane was crushed in the sugar mills. Hence, the total availability of bagasse at 29% of the weight of cane (i.e., 290 kg of bagasse per Mg of cane crushed) was around 19 million Mg. From the crushing season 2008–2009 to 2017–2018, sugarcane production was increased by about 66%, i.e., from 50 million Mg to 83 million Mg. This has resulted in the increased production of byproducts as well, i.e., bagasse, filter cake, molasses, and bioethanol, etc.
Sugar mills in the country are now diversifying their products by supplying the surplus electricity produced via cogeneration to the national grid. Cogeneration is the process of producing both electricity and usable thermal energy [11]. Currently, bagasse is being consumed in Pakistan by sugar mills using low-pressure cogeneration (steam parameters: 623.15 K and 2.4 MPa) to meet their internal energy requirement. However, low-pressure cogeneration consumes 46% more bagasse in comparison to high-pressure cogeneration (steam parameters: 813.15 K and 11 MPa) [12].
The Government of Pakistan has announced various policies for promoting bagasse-based electricity, with the most recent one being the upfront tariff policy for bagasse-based cogeneration plants which was enacted in 2017 [13]. During the FY 2017–2018, bagasse-based electricity provided 894 GWh to the national grid, sharing around 0.65% of the total [10].
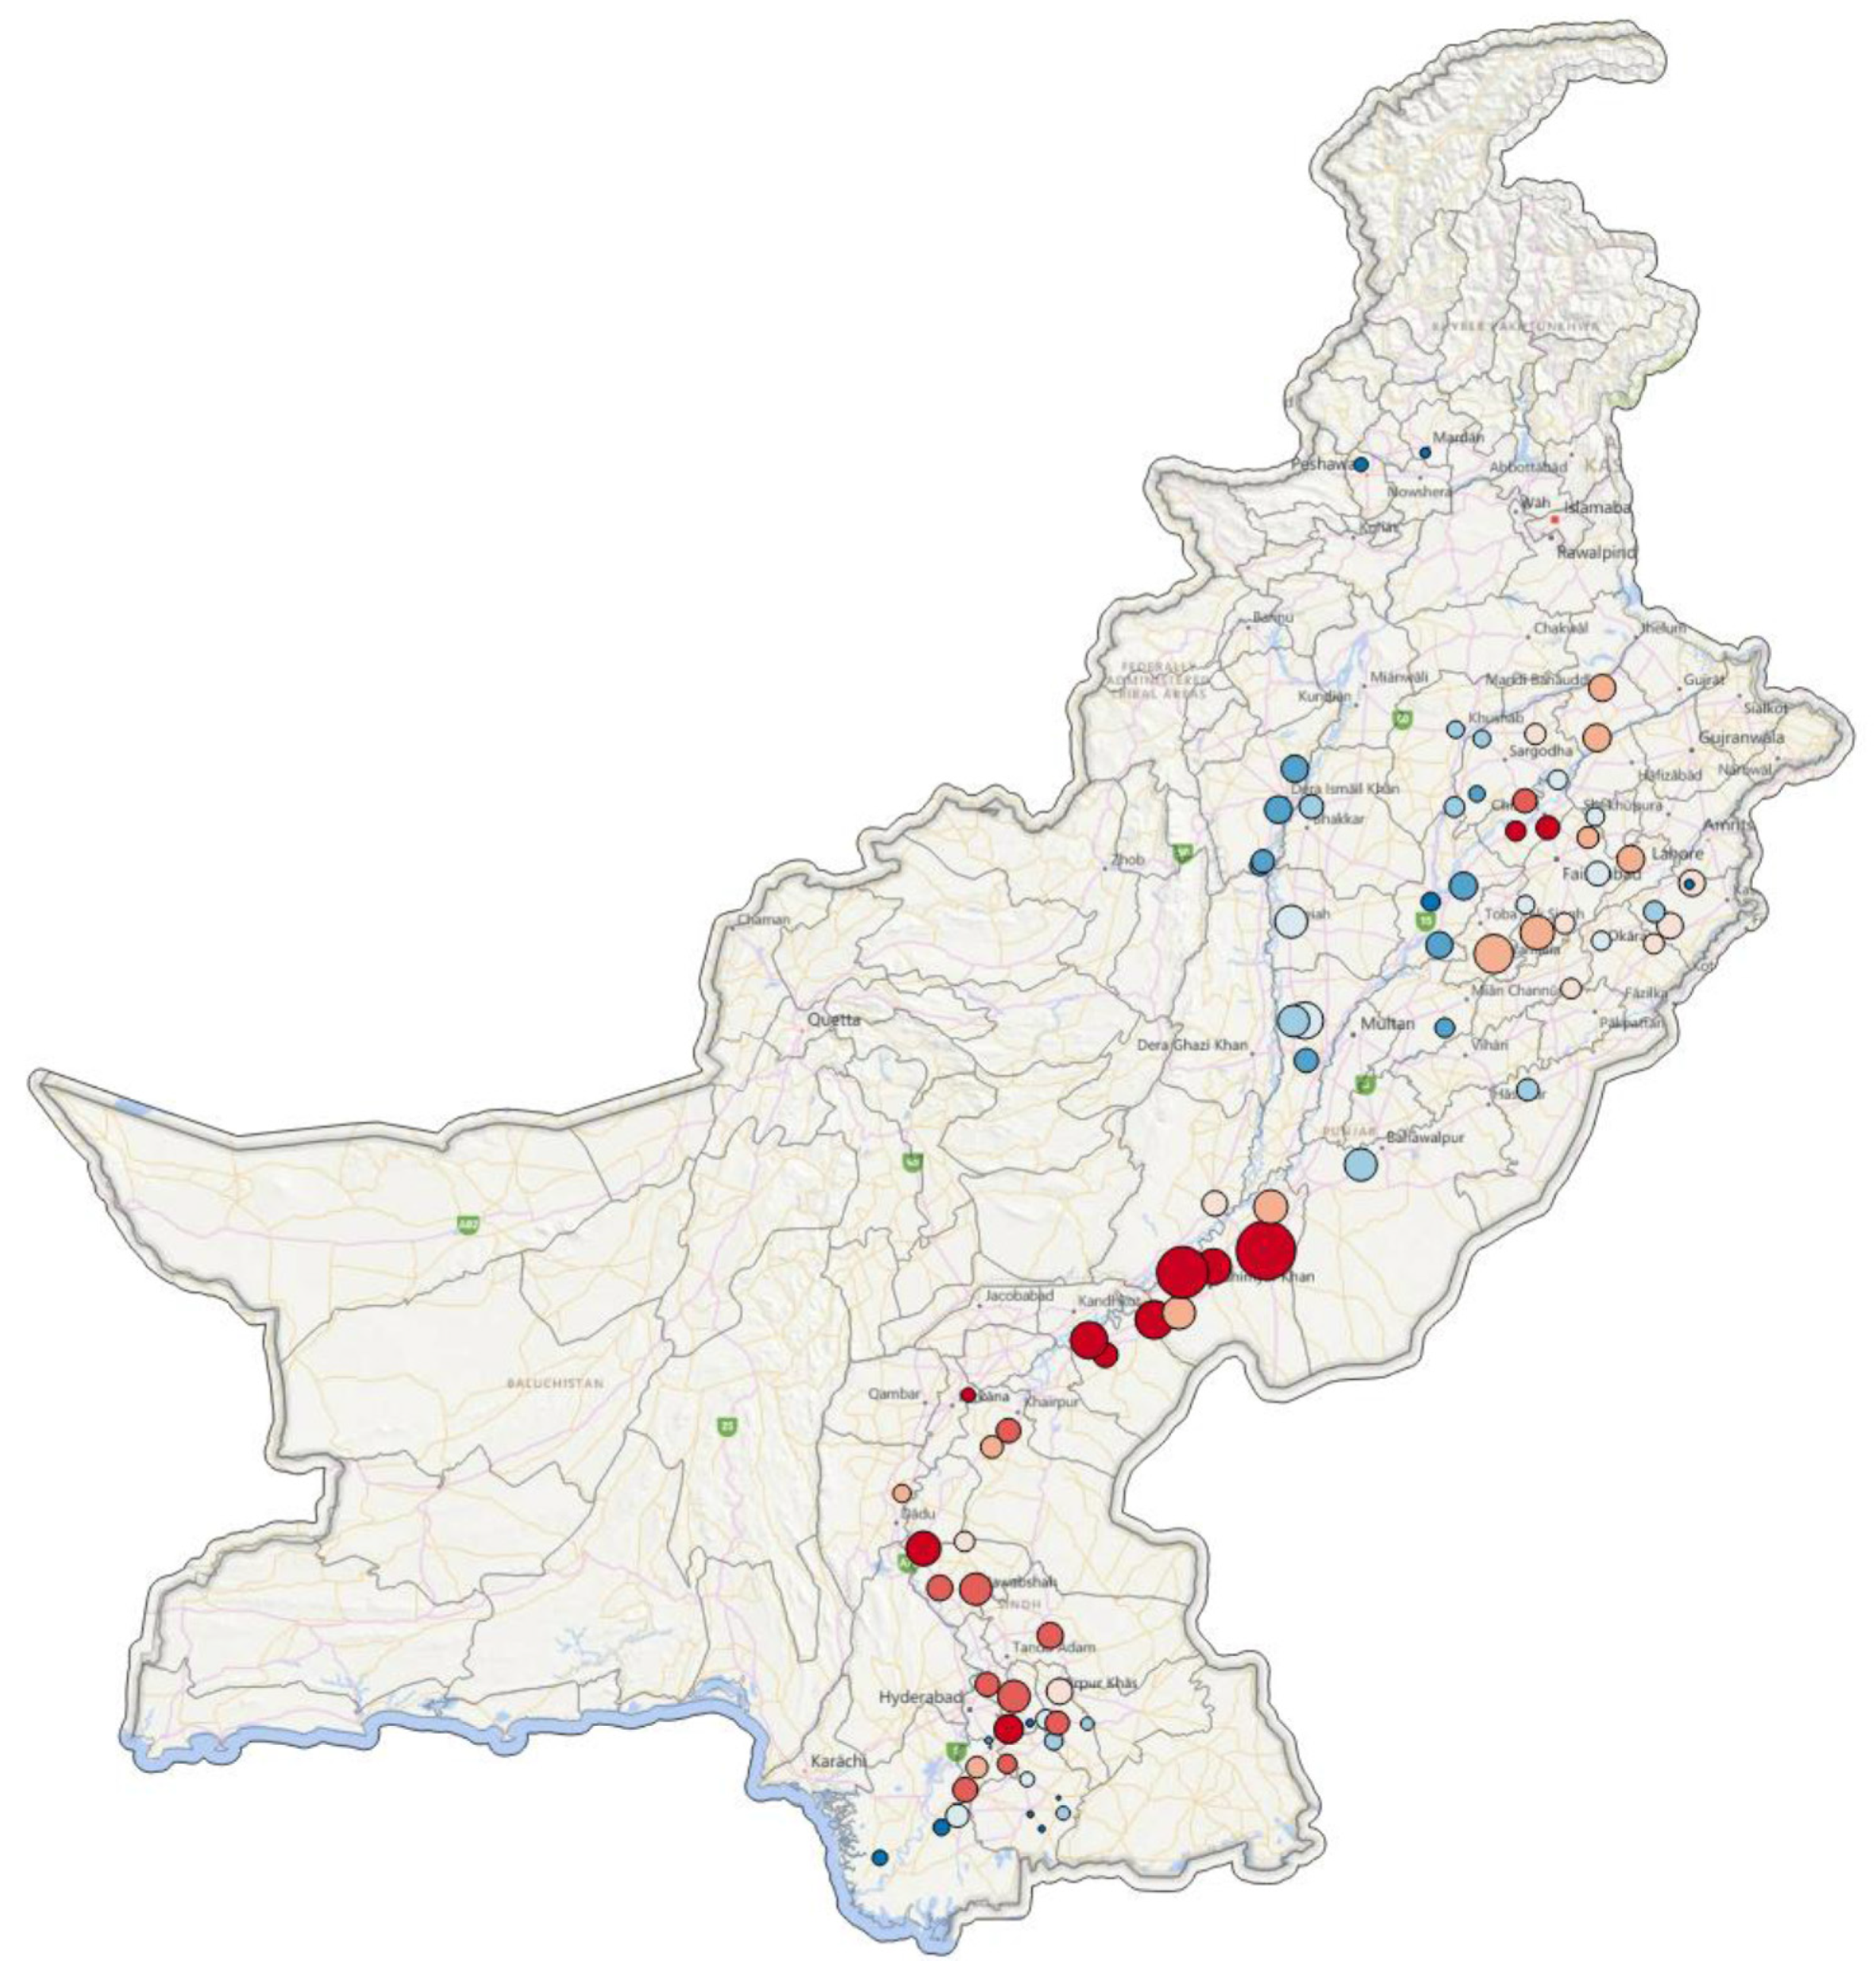
Figure 4 shows the potential of bagasse-based electricity generation along with different sugar mills located in different regions of Pakistan. In this figure, the area of a circle is representing the potential capacity of the power plant, i.e., a large circle for large capacity potential; while different colors are referring to the sourcing area required (i.e., land area required for collecting bagasse) for the bagasse, i.e., the color blue for a large area of sourcing per MWh and the color red for a small area of sourcing per MWh.
As mentioned earlier, Pakistan has the potential to generate electricity from bagasse [14]. Nevertheless, the amount of bagasse produced annually in the country does not necessarily guarantee a sustainable option. Therefore, it is crucial to evaluate the environmental performance of bagasse-based electricity generation using the life cycle assessment approach.

1.3. Why Life Cycle Assessment?

Life cycle assessment (LCA) is a technique to combine and analyze the inputs and outputs for evaluating the environmental impacts associated with a product system over the life cycle [15,16]. The life cycle perspective helps to attain the sustainable production and consumption of products by avoiding problem transfer. Many LCA studies have been conducted on bagasse-based electricity. Turconi et al. [17] presented a review of different LCA studies on electricity generation. They found that among different life cycle stages, emissions from plant operation represent the highest share towards environmental impacts for fossil-based electricity, while emissions from fuel provision contribute the highest share towards environmental impacts for biomass-based electricity. Most LCA studies have analyzed the low-pressure (2.1–4.2 MPa) or medium-pressure (6.5–8.7 MPa) cogeneration power plants. For instance, Gil et al. [18] studied low-pressure cogeneration in Cuba, Ramjeawon [19] studied medium-pressure cogeneration in Mauritius, and Silva et al. [20] studied medium-pressure cogeneration in Brazil. Janghathaikul and Gheewala [21] showed that electricity from bagasse-based cogeneration power plants (low-pressure) has lower NOx and SOx emissions but has more CO and Total Suspended Particulates (TSP) emissions than the grid mix of the country, Thailand.
Considering high-pressure cogeneration (10.3–11.0 MPa), Jenjariyakosoln et al. [22] performed a study on the life cycle GHG emissions of electricity generation from sugarcane residues (tops, leaves, and bagasse) in Thailand. Their research showed that the bagasse-based electricity contributes to reduce the GHG emissions. The highest benefits were obtained by using high-pressure cogeneration. In Pakistan, Ghani and Gheewala [23] studied the comparative environmental performance of using byproducts from the sugarcane industry. The results indicated substantial environmental benefits by employing heat and power generation via high-pressure cogeneration. A recent study by Hiloidhari et al. [24] evaluated the environmental impacts considering different scenarios based on different sugarcane seasons and cogeneration boiler options (low, medium, and high-pressure) in India. The results showed that among different cogeneration boilers, high-pressure cogeneration results in minimal environmental impacts.
This study aims to analyze the environmental sustainability of bagasse-based electricity by quantifying its environmental impacts (midpoint and endpoint) and economic performance by quantifying the environmental price of bagasse-based electricity production via high-pressure cogeneration in a life cycle perspective. Hotspots are highlighted, and recommendations are made to ensure environmental sustainability. The results of this study are expected to help the stakeholders (e.g., farmers, design engineers, sugar mills, bagasse-based power plants, academicians, and policymakers) to obtain a comprehensive idea of the environmental and economic implications associated with the use of bagasse-based electricity in Pakistan.

2. Methodology

In general, this study was carried out using the methodology of life cycle assessment following the principles outlined in ISO 14040:2006 [15] and ISO 14044:2006 [16].

2.1. Goal and Scope

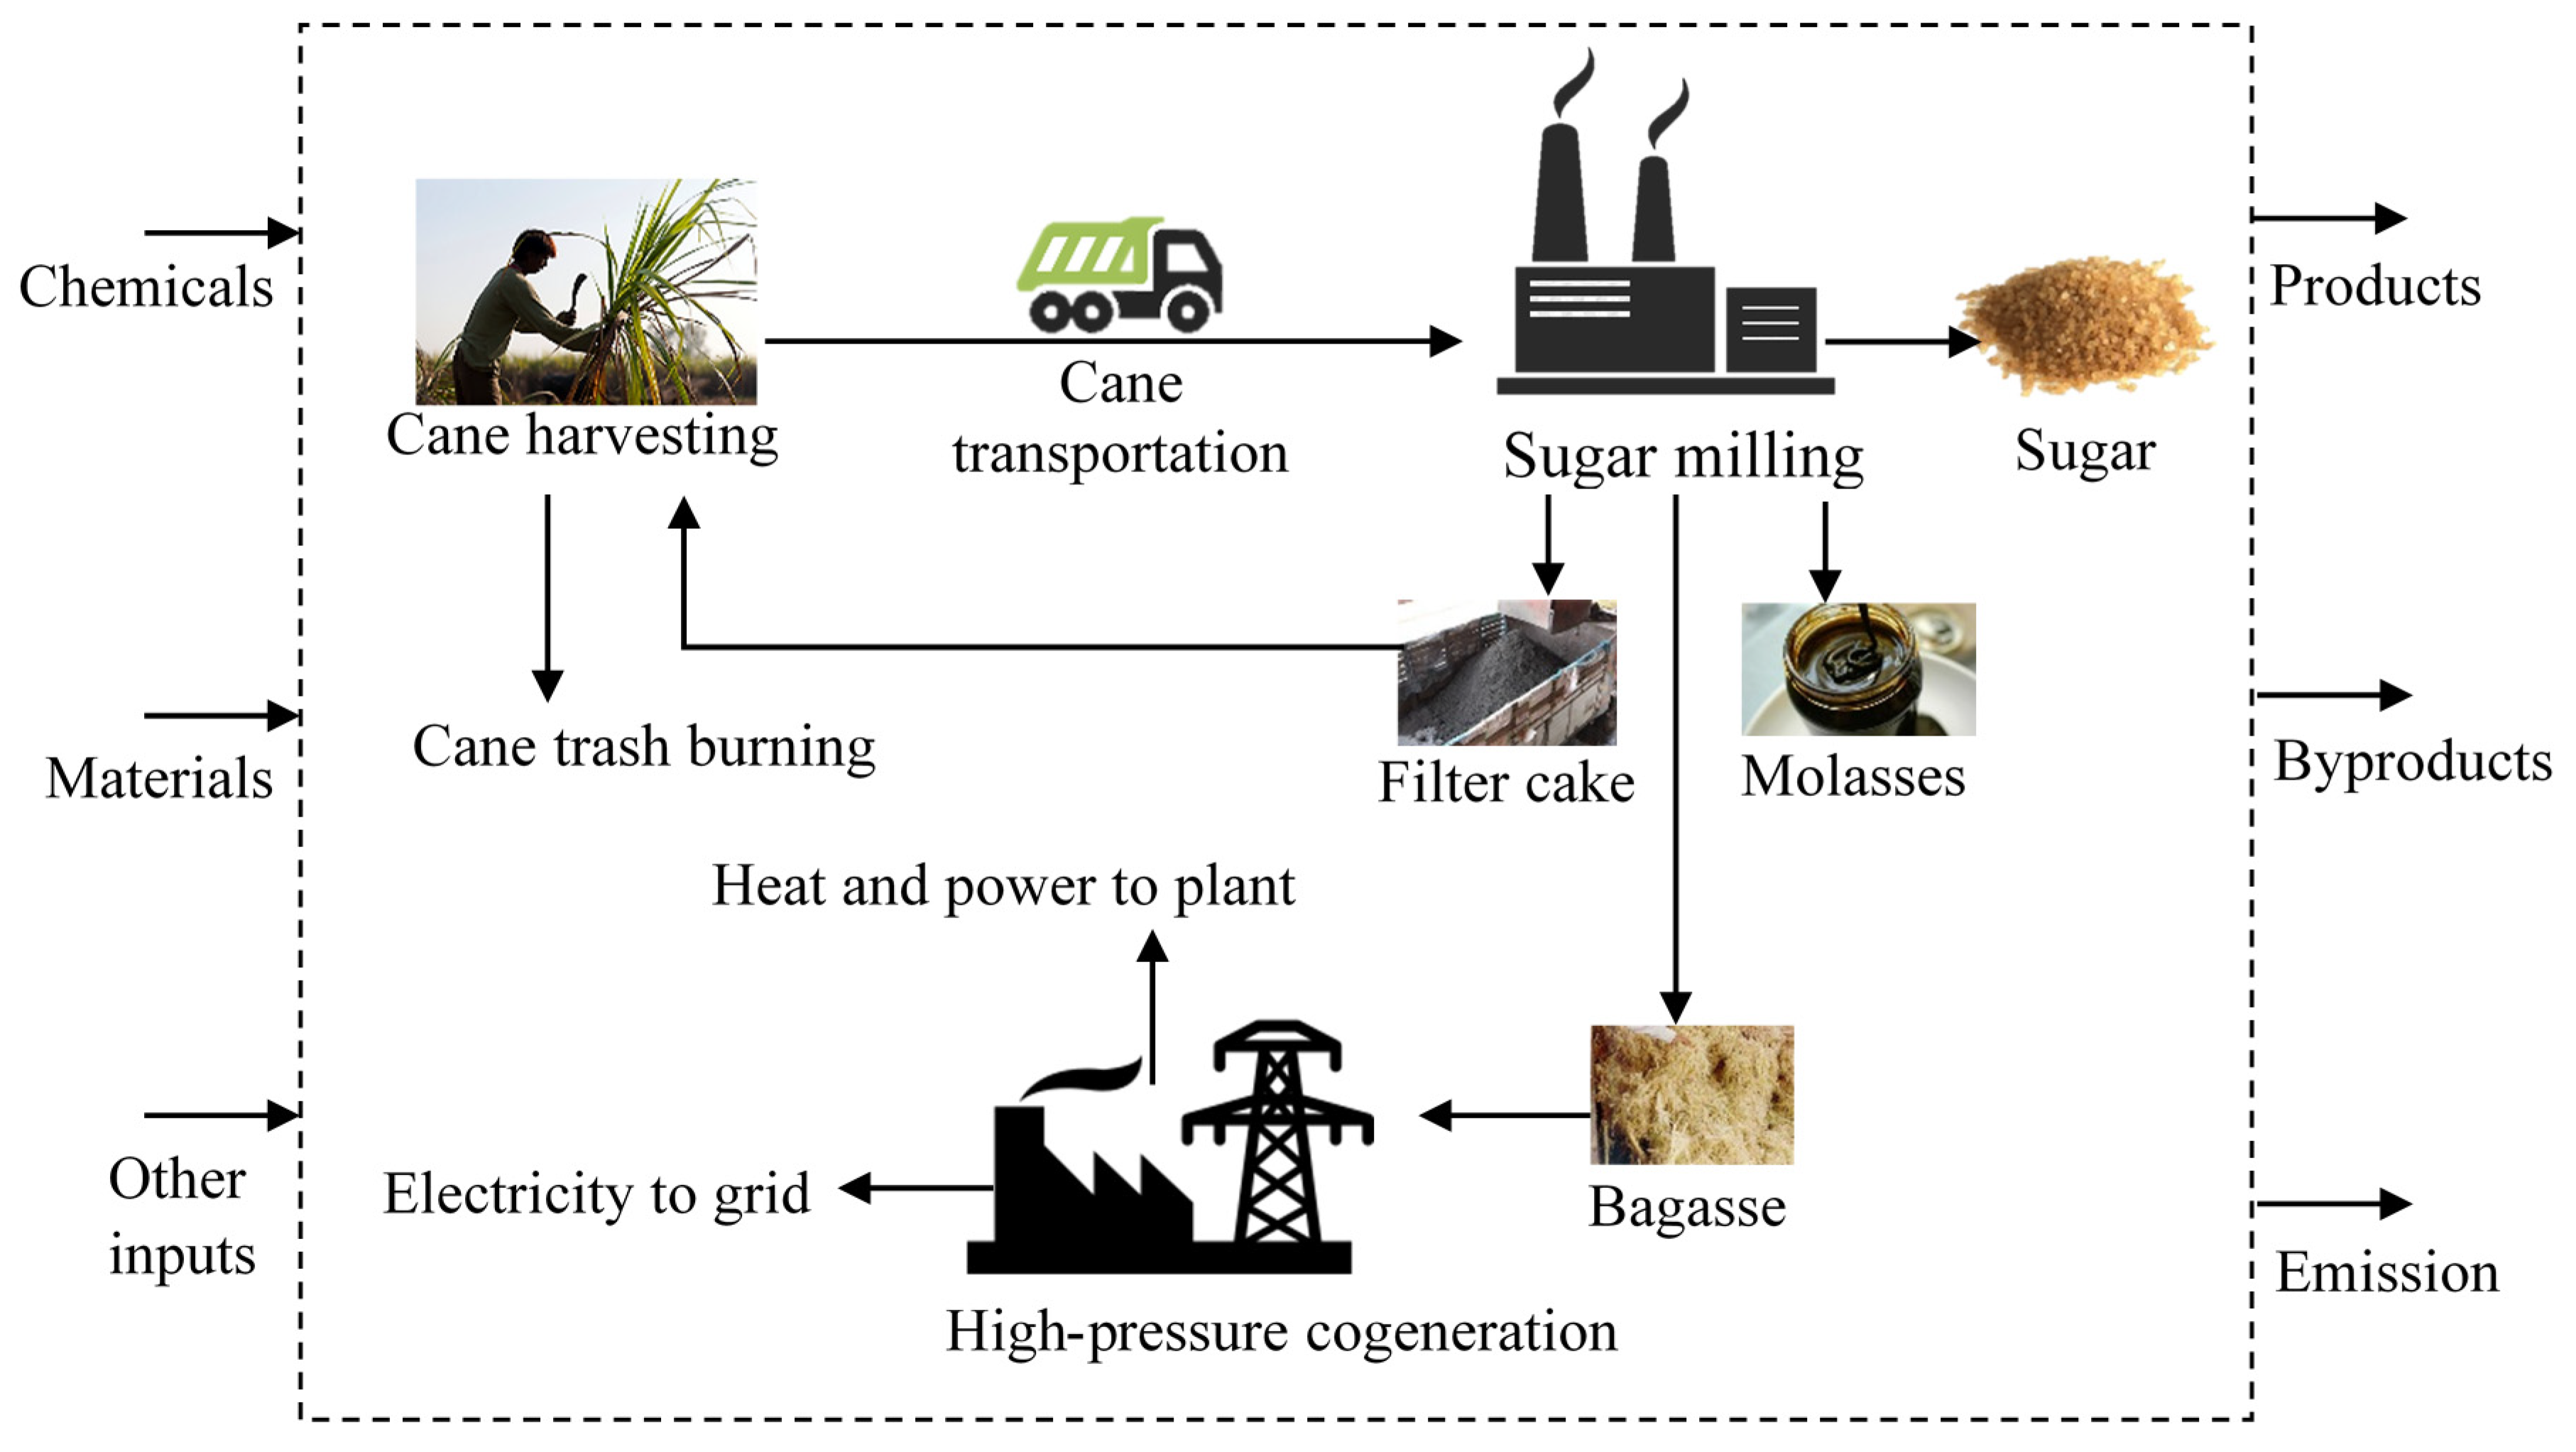
The goal of this study was to carry out an environmental and economic performance assessment of bagasse-based high-pressure cogeneration in Pakistan. The assessment was performed from cradle to gate involving the agricultural stage for the cultivation of cane; the transportation stage for the transportation of cane to the mill and bagasse to the power plant; and the industrial stage, including the production of bagasse at the sugar mill and the burning of bagasse in a high-pressure (HP) cogeneration plant to produce steam and electricity. Steam and electricity from the plant are used to meet the plant’s own needs and the surplus electricity is then sent to the national grid. The functional unit of this study was considered as the production of 1 MWh of exportable electricity from a bagasse-based power plant. The life cycle product system of a bagasse-based high-pressure cogeneration power plant is shown in Figure 5.
The high-pressure cogeneration power plant uses the conventional thermal power plant technology based on the Rankine Cycle. The bagasse is used as a fuel in traveling grate water tube boilers generating high-pressure steam with the parameters set as 813.15 K and 11 MPa. This steam is fed to the extraction cum condensing turbine. During crushing season, low-pressure (LP) steam from the turbine is sent to the sugar mill. The power plant’s auxiliary systems include the fuel and ash handling, raw water and storage system, reverse osmosis water treatment plant, cooling tower, and electrical systems, etc. A schematic diagram of a bagasse-based high-pressure cogeneration plant is shown in Figure 6.

2.2. Inventory Analysis

The inventory was developed using the primary and secondary data. The agricultural data, sugar milling data, most of the emission factors, and material production impacts were acquired from secondary sources through the literature review of research articles, scientific reports, and industrial reports, etc. The primary data were collected through filling the predesigned questionnaire by visiting a bagasse-based high-pressure cogeneration power plant located in Pakistan. The list of required data, their types, and sources are given in Table 1.
The plantation of the first crop is carried out in the spring (February to March) and autumn (September) seasons; however, most of the cultivation is performed in the spring season. Crop management practices consist of irrigation, fertilization, and the application of weed/pest control chemicals. The crop is cultivated mainly in a semi-arid region with annual precipitation ranging from 100 mm to a little above 400 mm. Therefore, cane crop requires intensive irrigation. The fertilization includes the application of nitrogen, phosphorous and potassium (NPK) contents; the most common types of fertilizers applied in sugarcane fields are urea, di-ammonium phosphate, and single super phosphate. Organic fertilizers, including manure and filter cake, are also applied. For weed control, both chemical application (mainly ametryn plus atrazine) and mechanical control (inter-culture) are used. Pest control is performed by the application of chemicals (mainly carbofuran and chlorpyrifos) and by using the biocontrol methods (i.e., use of trichogramma cards). Harvesting is performed manually. The post-harvest burning of cane trash is commonly practiced. However, the government has made strict laws to ban cane trash burning in the near future due to the severe smog issues in the region. Usually, there are 1–2 ratoon crops after a new plantation [26,27,28]. Considering the functional unit of 1 MWh of exportable electricity, the reference flow of cane to meet this requirement is around 19.2 Mg of sugarcane. The inventory data for agricultural stage per functional unit are given in Table 2.
The cane is transported from the farm to the sugar mill in tractor trollies. In the sugar mill, the shredded cane is sent to the mills for juice extraction. Bagasse is separated from sugar juice and sent to storage for the use of heat and power generation. The sugarcane juice is passed through the heating, liming and clarification, evaporation, and crystallization processes. The raw sugar is separated from molasses and then treated in the refinery via remelting, clarification, decolorization, evaporation, and crystallization. The white refined sugar obtained from the refinery is dried, graded, and packed [30,31]. It is important to mention that in Pakistan all the raw sugar is processed in the sugar refinery to produce refined white sugar. Therefore, bagasse is considered to be a co-product of molasses and white refined sugar (referred to as sugar in this study). The requirement of bagasse to fulfill the functional unit of 1 MWh of exportable electricity was found as around 2.41 Mg of bagasse. The inventory data for sugar milling are shown in the following Table 3.
The low-pressure cogeneration data were obtained from sugar mills. For low-pressure cogeneration (steam parameters: 623.15 K and 2.4 MPa), the production of 2 Mg of steam requires around 1 Mg of bagasse, while 11 Mg of steam is required to generate 1 MWh of electricity. The process steam requirements of sugar mills are around 420 kg of steam on average per 1 Mg of cane crushing.
Based on the data from the power plant, for high-pressure cogeneration (steam parameters: 813.15 K and 11 MPa) during in-season, 1 Mg of bagasse produces 2.54 Mg of steam, and 5.2 Mg per hour of steam is required to produce 1 MWh of electricity. During the off-season, 1 Mg of bagasse produces 2.51 Mg of steam while 3.9 Mg per hour of steam is required to produce 1 MWh of electricity. To produce 1 MWh of exportable electricity, around 1.27 MWh of electricity production is required considering the in-house consumption of the plant (i.e., sugar mill and power plant). The process steam requirement for the attached sugar mill is around 360 kg of steam per 1 Mg of cane crushing. The inventory data for 1 MWh of exportable electricity are given in the following Table 4.
The values of total electricity generation and percentage share of different fuels for producing the country’s grid mix were derived from [10] and are given in Table 5. The grid mix electricity of Pakistan was modeled in SimaPro software by modifying the values from the USLCI database.

2.3. Impact Assessment

The environmental impact assessment was carried out at both the midpoint and endpoint levels using the ReCiPe 2016 Hierarchist [34] as the method of life cycle impact assessment with the help of SimaPro software [35]. The following most relevant midpoint impact categories were included; climate change, fine particulate matter formation, terrestrial acidification, freshwater eutrophication, marine eutrophication, land use, fossil resource scarcity, and water consumption. Moreover, all the endpoint impact categories were considered, including the damage to human health, damage to ecosystem quality, and damage to resource availability.
Climate change was considered due to the significant GHG emissions from agricultural activities. The burning of biomass also leads to the emission of several pollutants (e.g., SO2, NOx, and PM2.5), contributing to fine particulate matter formation. The consideration of terrestrial acidification, freshwater eutrophication, and marine eutrophication was also very important due to the use of agro-chemicals (e.g., fertilizers, herbicides, fungicides, pesticides) and energy in the biomass production phase. The grid mix of the country depends heavily on fossil energy; for this reason, fossil resource scarcity was considered. The water consumption was also estimated due to the water-intensive nature of sugarcane cultivation systems, particularly due to the high irrigation requirement. Similarly, the cultivation of sugarcane requires fertile land; therefore, land use category is also calculated to evaluate the occupation of agricultural land as m2 year (m2a crop eq.).
The endpoint impact categories representing final damages were included in addition to the midpoint impact categories because they show the relative importance of the various midpoint categories to the final damage to human health, ecosystem quality, and fossil resource scarcity.
The Environmental Prices method [36], which reflects the shadow prices, was used to evaluate the price of the environment in monetary values. The Environmental Prices method uses the IPCC methodology for climate change, while for other impacts it follows the ReCiPe 2008 impact assessment method, which is an earlier version of ReCiPe 2016, used in this study [34,37]. These prices show the willingness to pay for avoiding the environmental impacts. As the average environmental prices are given for Europe, they were adapted for Pakistan using Equation (1):
E P P a k = E P E U   × ( G D P P a k G D P E U ) i e × ( 1 +   P +   I )
where EPPak represents the environmental price in Pakistan, EPEU represents the environmental price in Europe, GDPPak represents the GDP per capita in Pakistan, GDPEU represents the GDP per capita in Europe, ie shows the income elasticity, ∆P represents the percentage of price inflation, and ∆I represents the percentage of income change. The values used for the calculation are given in Table 6. The environmental price provides the single score weighted environmental impacts in monetary terms, hence they help to analyze the environmental profile in monetary values.
Multiple products were being produced at the sugar milling stage; therefore, the economic allocation was performed based on surplus bagasse available for electricity generation. The allocation factor for bagasse from sugar milling plants with low-pressure cogeneration was taken as 0.07, and for bagasse from sugar milling plants with high-pressure cogeneration it was taken as 0.17.

3. Results and Discussion

The environmental performance of the bagasse-based power generation and grid mix electricity production in Pakistan were evaluated and are compared.

3.1. Midpoint Impacts

In Table 7, the midpoint impact results of bagasse-based electricity and the grid mix of Pakistan are presented per MWh of exportable electricity production. The obtained results revealed that in the case of bagasse-based electricity, the global warming was mainly caused by fertilizer application (direct and indirect N2O emissions) and the use of fossil fuels in sugarcane production. The heavy dependence of the grid mix electricity of Pakistan on imported fossil fuels is the main reason for this significant difference in the GHG emissions (i.e., 399 kg CO2 eq per MWh).
The grid mix electricity showed higher environmental repercussions in terms of fine particulate matter formation (i.e., 1.64 kg PM2.5 eq per MWh of exportable electricity) in comparison to the bagasse-based electricity. There is almost a 50% reduction potential (i.e., 0.817 kg PM2.5 eq per MWh) in fine particulate matter formation if the bagasse-based electricity is compared with grid mix electricity.
There are various environmental precursors (e.g., NH3, NOx, SOx) which contribute to terrestrial acidification. In the agricultural phase, the anthropogenic N inputs or N mineralization (i.e., the application of synthetic fertilizers) result in the volatilization of NH3 and NOx from managed soils. For instance, urea (CO(NH2)2) is converted into ammonium (NH4+), hydroxyl ion (OH), and bicarbonate (HCO3) in the presence of water and urease enzymes [42]. With the increase in pH, this ionized NH4+ is released into the atmosphere as NH3. Therefore, in the case of bagasse-based electricity, the major contribution in terms of terrestrial acidification was due to the emission of NH3 and NOx from fertilizer application, and biomass and fossil fuel burning in the agricultural phase. However, the bagasse-based electricity is still a suitable option in terms of terrestrial acidification compared to the current grid mix electricity. The obtained results showed that the grid mix electricity caused more damage to the environment in terms of terrestrial acidification (i.e., 5.63 kg SO2 eq per MWh); eventually, the bagasse-based electricity has an acidification reduction potential of 0.66 kg SO2 eq per MWh.
Being of agricultural origin, bagasse-based electricity performed worse than grid electricity for impacts associated with cultivation. For example, the application of macro nutrients (e.g., phosphorus and nitrogen-based fertilizers) in the crop production phase resulted in a higher freshwater eutrophication for bagasse-based electricity in comparison to the grid mix. Likewise, for marine eutrophication, bagasse-based electricity performed worse. As can be anticipated, this was also the case for land use as well as water consumption, where the bagasse-based electricity had higher impacts. On the other hand, being of agricultural origin was also an advantage for bagasse-based electricity, resulting in a lower impact on fossil resource scarcity; this is, in fact, one of reasons for promoting bio-based energy carriers.
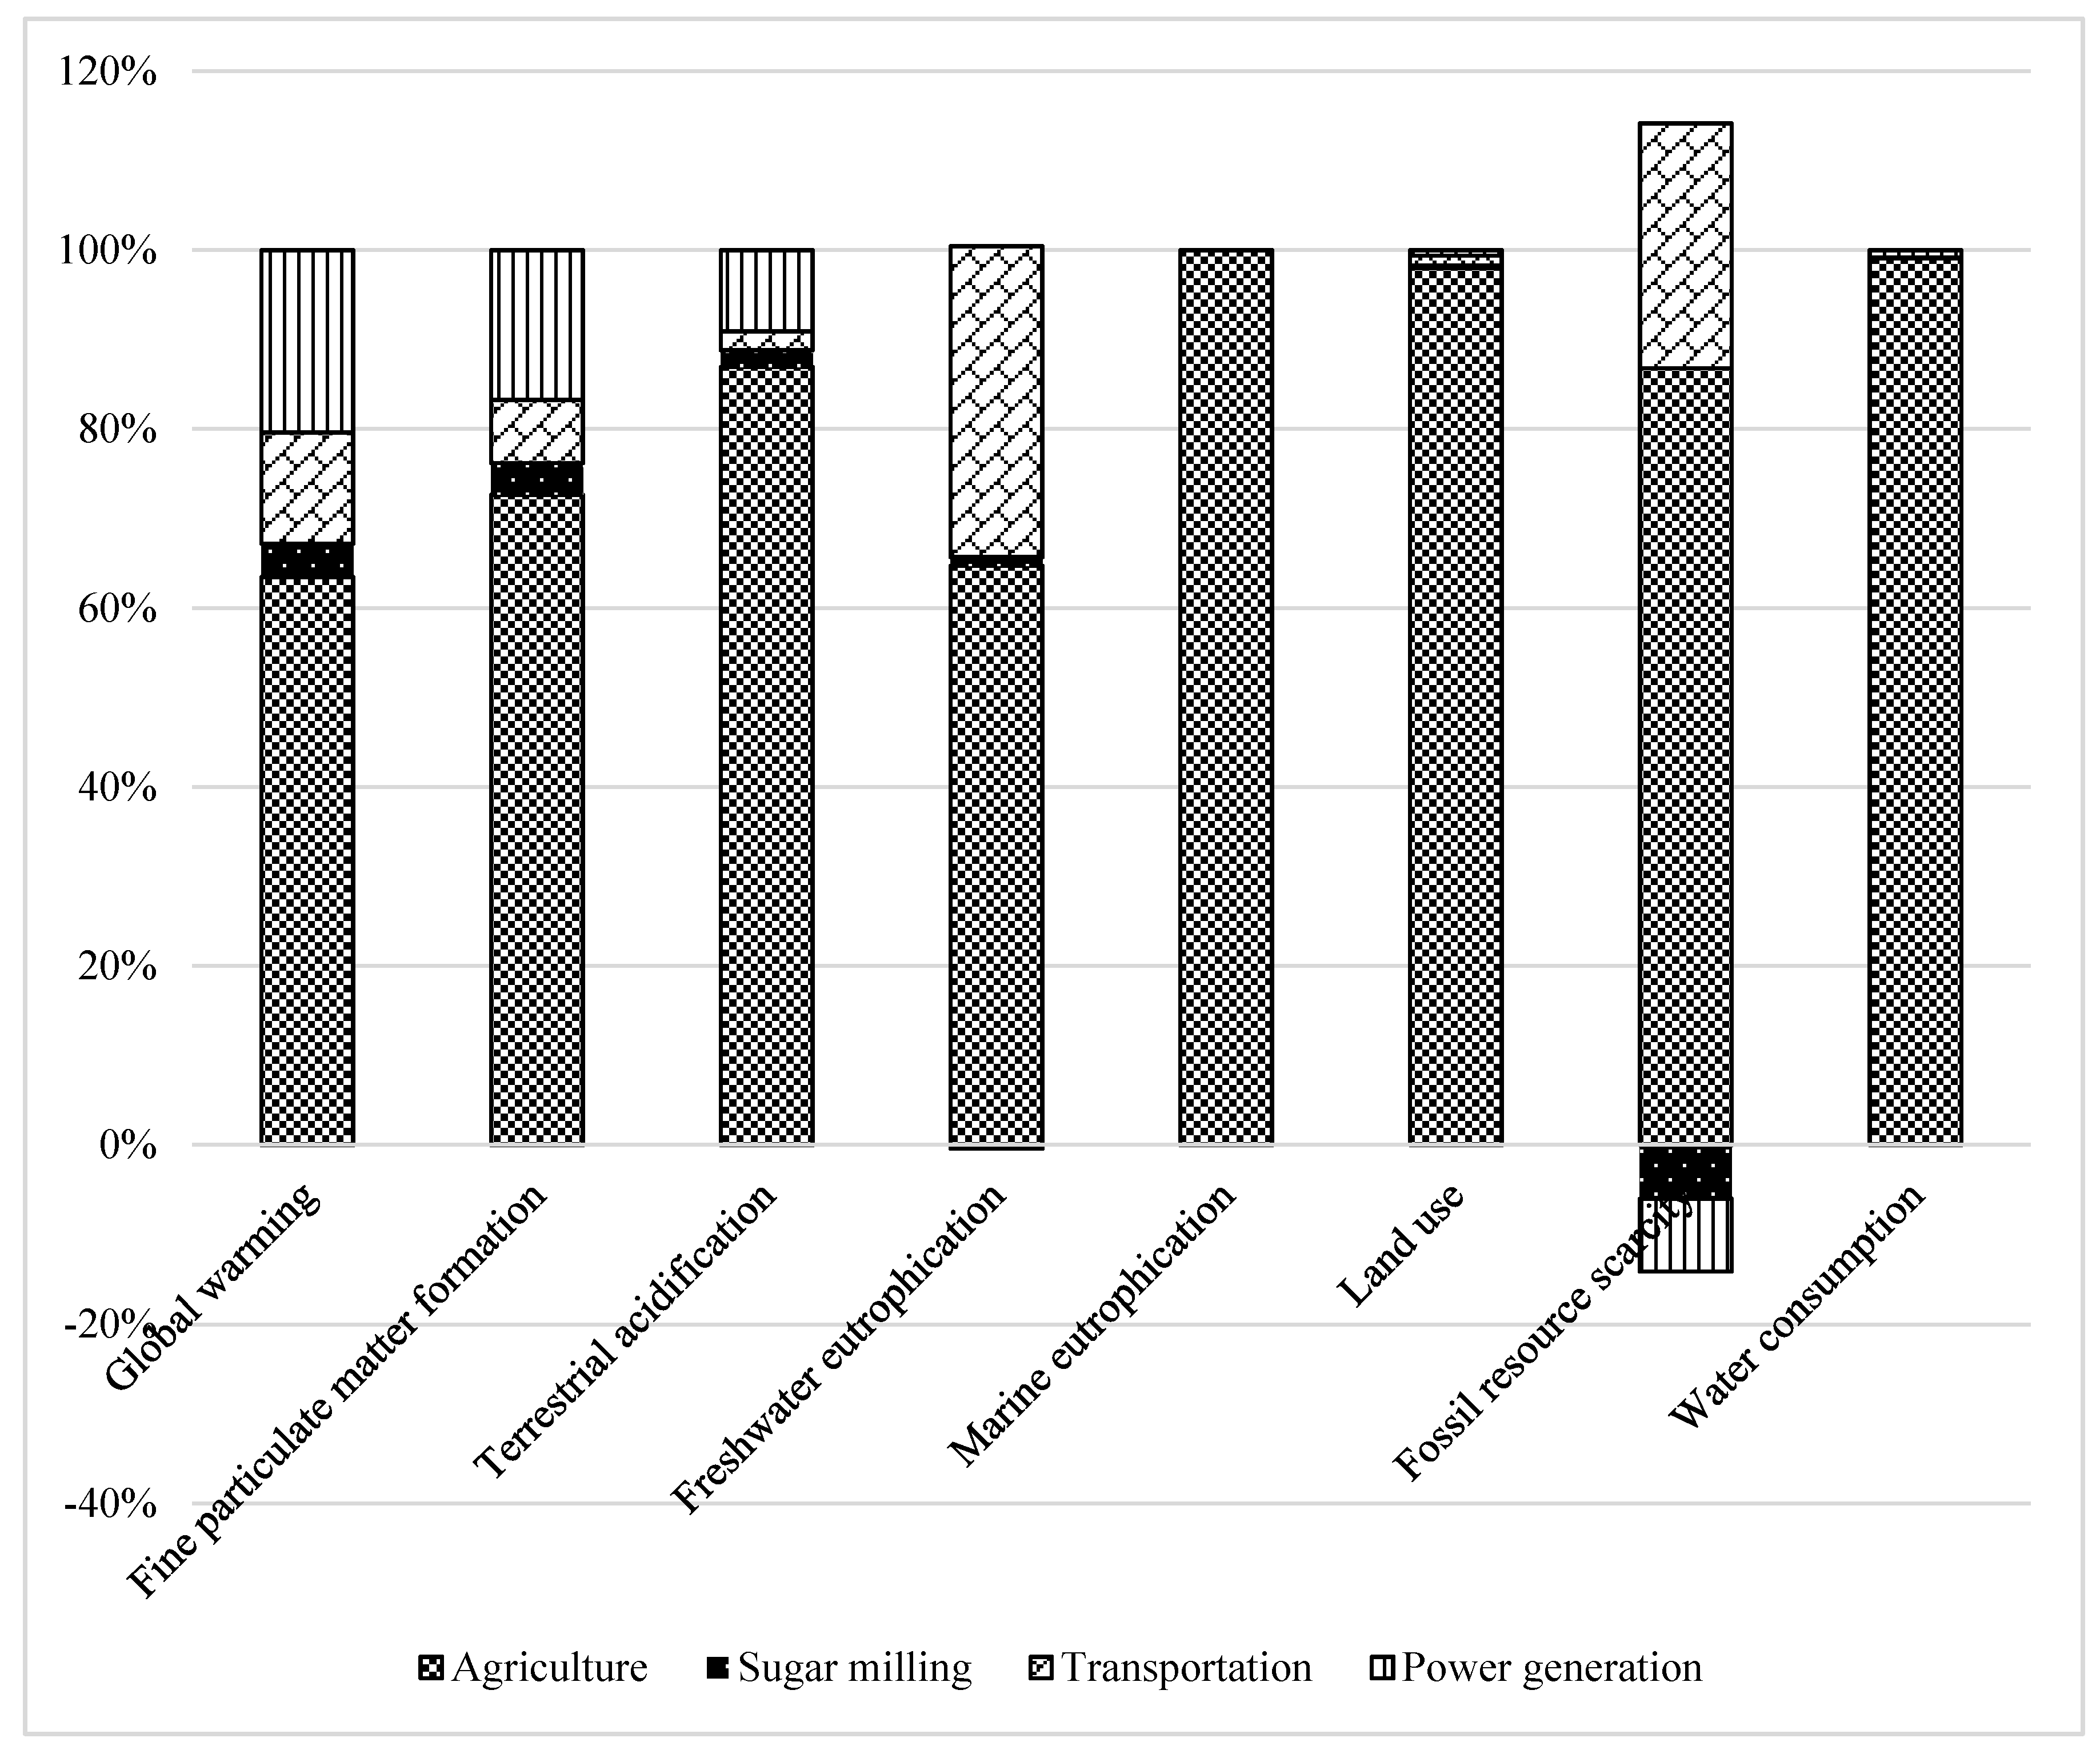
Figure 7 shows the contribution of different life cycle stages from bagasse-based exportable electricity production towards the midpoint impact results. The considered life cycle stages include; agriculture, sugar milling, transportation (sugarcane and bagasse), and power generation. Crop production contributes the most to all impact categories. However, transportation also plays a significant role in terms of freshwater eutrophication and fossil resource scarcity. Power generation has a significant contribution to global warming, fine particulate matter formation, and terrestrial acidification. It results in credits for fossil resource scarcity due to the displacement of conventional NPK fertilizers by the ash generated in the combustion process. Sugar milling had the lowest contribution to all the considered impacts due to the use of bagasse internally for steam and power generation.

3.2. Endpoint Impacts

Endpoint impacts are defined at the final damage level and include damages to the three areas of protection, viz., human health, ecosystem quality, and resource availability. The values for these are shown in Table 8. Bagasse-based electricity performs better than the grid mix for human health and resource availability, but worse for ecosystem quality. This is intuitively understandable for ecosystem quality and resource availability as bagasse is an agricultural product and thus has a large impact on ecosystems but conserves fossil resources. To understand this is in more detail, the underlying contribution by the midpoint impacts needs to be considered. Damage to human health is contributed by global warming, fine particulate matter formation, and water consumption. Bagasse-based electricity performs better for the first two as discussed in Section 3.1, leading to a slightly better performance than grid mix electricity. The relative contributions of the three midpoint impacts to the damage to human health are shown in Figure 8. Fine particulate matter is the most significant midpoint impact category in the case of electricity grid mix followed by global warming; water consumption has virtually no contribution. However, in the case of bagasse-based electricity, water consumption is the biggest contributor followed by the fine particulate matter and global warming.
Damage to ecosystem quality is caused by global warming, freshwater eutrophication, marine eutrophication, land use, and water consumption. All these are mainly contributed by agriculture and hence, bagasse-based electricity performs much worse (almost five times) than grid mix electricity (Table 8). As seen in Figure 9, global warming and terrestrial acidification are the dominant impact categories contributing to ecosystem quality damage for grid mix electricity. However, water consumption shows the most significant contribution in the case of bagasse-based electricity, followed by land use, terrestrial acidification, and global warming.

3.3. Weighted Environmental Prices

The potential threat/damage to the environment in terms of monetary values is represented in the Table 9. The weighted environmental prices are expressed as USD 2015 per MWh of exportable electricity production either by the bagasse-based or by the grid mix electricity. The overall environmental prices are given with respect to the considered environmental impact categories. The obtained results showed that the grid mix electricity had higher impacts in terms of weighted environmental price (i.e., 15.75 USD 2015 per MWh of exportable electricity production) than the bagasse-based electricity, which is responsible for lesser stress on the environment in terms of monetary values. In both cases, fine particulate matter and terrestrial acidification had the highest contribution. Fossil resource scarcity and water consumption had no contribution.
A comprehensive overview of the pros and/or cons considering the comparative performance of bagasse and grid mix electricity is presented in Table 10.

3.4. Managing the Bagasse-Based Electricity—Policy Discussion and Insights for Stakeholders

The National Electric Power Regulatory Authority (NEPRA) is a government entity responsible for developing electricity-related policies and providing reliable electricity distribution to consumers. NEPRA is also responsible for developing frameworks and standards for new investments and determining tariffs for renewable technologies [13]. As discussed earlier, thermal-based electricity generation currently has the largest share in Pakistan [4]. Considering the situation of the country’s dependence on fossil fuel-based electricity with higher environmental impacts, the government is focusing on developing renewable resources including biomass power plants, especially bagasse-based electricity generation. Nevertheless, the potential of bagasse-based electricity generation has not been sufficiently explored, considering both economic and environmental benefits.
The estimated financial cost or Levelized Cost of Electricity (LCOE) from biomass is about 6.97 PKR/kWh (43.84 USD/MWh) [43] (for fiscal year 2018–2019, 1 USD = 159 PKR) [44], and the environmental cost of bagasse-based electricity generation was computed as 11.78 USD/MWh. The levelized upfront tariff approved by NEPRA in 2017 was 9.096 PKR/kWh (i.e., 57.21 USD/MWh), which was later adjusted to 10.9–12.4 PKR/kWh (i.e., 68.5–77.9 USD/MWh) [43]. On the other hand, the upfront tariff of thermal power generation is 9.7–11.2 PKR/kWh (i.e., 61–70 USD/MWh), while the environmental cost of thermal power generation is 15.75 USD/MWh. Therefore, the total cost (i.e., financial and environmental costs) of bagasse-based electricity generation is 12.77–14.27 PKR/kWh (i.e., 80.3–89.7 USD/MWh), while the total cost of thermal-based electricity generation is around 12.2–13.70 PKR/kWh (i.e., 76.8–86.2 USD/MWh). Therefore, it is evident that the total cost of bagasse-based electricity generation is not significantly different from thermal electricity. Based on this analysis, NEPRA needs to develop some supporting policies to promote bagasse-based electricity generation through policy interventions.
The bagasse-based electricity from high-pressure cogeneration power plants could play a significant role in meeting the ever-increasing energy requirements of the country. Being a locally produced bio-based fuel, the promotion of bagasse-based electricity is in complete alignment with government ambitions of increasing the share of renewable energy and energy security. However, despite the availability potential and government ambitions, the use of bagasse-based electricity is not fully exploited yet. Therefore, considering the results of this study, some suggestions are made for stakeholders (agriculture sector, sugar mills, bagasse sector, and policymakers) for the promotion and sustainable use of bagasse-based electricity.
  • Considering midpoint indicators, bagasse-based electricity performs better than grid mix electricity only for some impact categories, but not all. This requires careful consideration of all the environmental aspects by the decision makers as focusing only on the popular categories, such as global warming and fossil scarcity, could lead to unintended environmental consequences.
  • The results of endpoint categories are quite interesting as they suggest the advantage of bagasse-based electricity only for resource availability. The benefit of bagasse-based electricity towards human health damage was not significant. The grid mix electricity showed a better performance for ecosystem quality.
  • The environmental cost of bagasse-based electricity is less than grid mix electricity. Therefore, environmental cost should be included while calculating the overall cost. This suggests that the relatively higher prices of bagasse-based electricity or financial supports in terms of subsidy and loans for promoting bagasse-based electricity are justifiable within the difference of environmental cost.
  • Most of the impacts of electricity are being caused by the agricultural stage, suggesting that improvement efforts should be focused on reducing the environmental impacts of this stage. For instance, optimizing the use of agro-chemicals, improving irrigation efficiency, avoiding the post-harvest burning of cane trash, and increasing the yield at the agricultural stage could substantially improve the performance of bagasse-based electricity.
  • At the agricultural stage, most of the environmental impacts are from the use of resources, such as land, water, and fertilizers, etc. These resources are crucial for other food crops as well. Therefore, careful consideration should be given to managing the competitive use of resources before making any policies.
  • Considering that bagasse is a byproduct of sugar (food) from sugarcane, the current inefficient use of bagasse using low-pressure cogeneration with no export of electricity is not only a waste of resources, but is also increasing the overall impacts of sugar which otherwise could be shared by the surplus bagasse-based electricity. This requires strict action to discourage the waste of precious resources.
  • As the crushing season in the country lasts for only around four months, this results in less availability of bagasse during the off-season, especially if low-pressure cogeneration plants with no export of electricity also install high-pressure cogeneration with the export of electricity. To address this shortfall, other potential fuels, especially crop residues which are abundantly available in the country, are suggested to be investigated [45,46]. Another promising option is cane trash, which can be collected and used as fuel, as mentioned by Ghani and Gheewala [23] in their study.

4. Conclusions and Recommendation

This study evaluated the environmental impact of bagasse-based electricity from high-pressure cogeneration power plants and grid mix electricity both at midpoint and endpoint levels along with the weighted environmental price. The midpoint results showed that for some impact categories, the bagasse-based electricity performed better than the grid mix electricity; global warming is 70% lower, fine particulate matter formation 50%, terrestrial acidification 12%, and fossil resource scarcity 88%. In a life cycle perspective, bagasse-based electricity is only partially renewable due to the use of fossil-based materials throughout its life cycle. Grid mix electricity performed better than the bagasse-based electricity in terms of eutrophication, as it showed 98% and 99% less impact for the freshwater and marine eutrophication categories, respectively, 99% for land use, and 100% for water consumption. At the endpoint level, the bagasse-based electricity proved to be a favorable option, with resource availability and human health reduced by 85% and 22%, respectively; however, the damage value of ecosystem quality for bagasse-based electricity was higher than grid mix electricity (i.e., 79% less impact). In terms of environmental prices, the bagasse-based electricity proved to be a promising option compared to the grid mix electricity because it displayed 25% less weighted environmental price.
The agricultural phase was found to be the major contributor to all the impact categories. The transportation phase played a significant role in terms of freshwater eutrophication and fossil resource scarcity. Power generation contributed to global warming, fine particulate matter formation, and terrestrial acidification and provided credits for fossil resource scarcity. Sugar milling showed the least significant contribution to all the considered midpoint impact categories. Global warming and water consumption contributed to both the human health and ecosystem quality at endpoint level. Terrestrial acidification, eutrophication, and land use caused the highest damage to the ecosystem quality whereas fine particulate matter was responsible for the damage to human health.
These environmental impact results showed a trade-off situation; the environmental performance of bagasse-based electricity is better than grid mix electricity for some categories but not all. Therefore, a bagasse-based electricity policy without considering all the aspects may result in unavoidable environmental consequences. The higher environmental impact of bagasse-based electricity was mainly from the use of resources over the life cycle (i.e., land, water, and fertilizers, etc.). These resources are limited and compete with other food crops, requiring careful management of these precious resources. However, the environmental price of bagasse-based electricity is less than grid mix, suggesting that a higher cost or financial support to bagasse-based electricity within the difference of environmental price is justifiable.
The environmental performance of bagasse-based electricity could be improved further with better management of different activities over the life cycle, i.e., avoiding cane trash burning, recovery of cane trash, enhanced use of sugarcane byproducts, optimized use of fertilizers and fossil fuels, etc. The recovery of cane trash could provide substantial environmental benefits by preventing its burning as well as ensuring its recovery as a fuel. It is recommended to carry out the social assessment of bagasse-based electricity (e.g., employment generation potential, working conditions) to cover the three pillars of sustainability (i.e., environmental, economic, and social aspects). Further investigation of other cogeneration processes, other available biomass fuels, and the distribution stages of electricity is also recommended.

Author Contributions

Conceptualization, H.U.G. and S.H.G.; methodology, H.U.G. and S.H.G.; software, H.U.G.; validation, S.H.G.; formal analysis, H.U.G., A.M., A.U. and S.H.G.; writing—original draft preparation, H.U.G.; writing—review and editing, S.H.G.; visualization, A.M.; supervision, S.H.G. All authors have read and agreed to the published version of the manuscript.

Funding

The authors would like to express their gratitude to the King Mongkut’s University of Technology Thonburi, Thailand for providing financial help through the Petchra Pra Jom Klao Research Scholarship.

Acknowledgments

The authors would like to express their gratitude to the King Mongkut’s University of Technology Thonburi, Thailand for providing financial help through the Petchra Pra Jom Klao Research Scholarship. The Joint Graduate School of Energy and Environment (JGSEE), King Mongkut’s University of Technology Thonburi and the Center of Excellence on Energy Technology and Environment (CEE), PERDO, Ministry of Higher Education, Science, Research and Innovation are also acknowledged for their financial support.

Conflicts of Interest

The authors declare no conflict of interest.

References

  1. Government of Pakistan. Pakistan’s Implementation of the 2030 Agenda for Sustainable Development Goals; SDG Section, Ministry of Planning, Development, and Reforms, Government of Pakistan: Islamabad, Pakistan, 2019; pp. 1–72.
  2. United Nations. #Envision2030 Goal 7: Affordable and Clean Energy|United Nations Enable. Available online: https://www.un.org/development/desa/disabilities/envision2030-goal7.html (accessed on 1 December 2020).
  3. World Bank. Biomass Resource Mapping in Pakistan: Final Report on Biomass Atlas for Pakistan; World Bank: Washington, DC, USA, 2016; pp. 1–91. [Google Scholar]
  4. Ministry of Finance. Pakistan Economic Survey 2017–2018, Finance Division, Government of Pakistan. 2018. Available online: http://www.finance.gov.pk/survey/chapters_18/Economic_Survey_2017_18.pdf (accessed on 20 August 2020).
  5. FAOSTAT. Countries by Commodity. Food and Agriculture Organization of The United Nations. 2018. Available online: http://www.fao.org/faostat/en/#rankings/countries_by_commodity (accessed on 30 November 2020).
  6. NFS&R. Agricultural Statistics of Pakistan 2017–2018. Ministry of National Food Security and Research. 2019. Available online: http://www.mnfsr.gov.pk/frmDetails.aspx (accessed on 1 May 2020).
  7. PSMA. Pakistan Sugar Mills Association Annual Report 2018; PSMA: Islamabad, Pakistan, 2018.
  8. Eckstein, D.; Hutfils, M.L.; Winges, M. Who suffers most from extreme weather events? Weather-related loss events in 2017 and 1998 to 2017. In Global Climate Risk Index 2019; Germanwatch: Bonn, Germany, 2018. [Google Scholar]
  9. Ministry of Climate Change. Pakistan’s Second National Communication on Climate Change to United Nations Framework Convention on Climate Change (UNFCCC). Ministry of Climate Change, Government of Pakistan. Available online: https://unfccc.int/sites/default/files/resource/183625_Pakistan-NC2-1-Pakistan%20-%20Second%20National%20Communication%20on%20Climate%20Change%202018.pdf (accessed on 15 September 2020).
  10. NEPRA. State of Industry Report, National Electric Power Regulatory Authority (NEPRA); NEPRA: Islamabad, Pakistan, 2019; pp. 1–231. Available online: https://nepra.org.pk/publications/State%20of%20Industry%20Reports/State%20of%20Industry%20Report%202019.pdf (accessed on 8 November 2020).
  11. World Bioenergy Association. Global Bioenergy Statistics 2019. Available online: https://worldbioenergy.org/uploads/191129%20WBA%20GBS%202019_LQ.pdf (accessed on 10 November 2020).
  12. Malik, M.O. High Pressure Cogeneration for Sugar Sector in Pakistan; HP Cogen-Pak: Islamabad, Pakistan, 2016. [Google Scholar]
  13. NEPRA. NEPRA|Tariff Generation Upfront. 2020. Available online: https://nepra.org.pk/tariff/GenerationUpfront.php (accessed on 1 December 2020).
  14. AEDB. Final Report on Biomass Atlas for Pakistan; AEDB: Islamabad, Pakistan, 2016. [Google Scholar]
  15. International Organization for Standardization. ISO 14040 Environmental Management—Life Cycle Assessment—Principles and Framework; International Organization for Standardization: Geneva, Switzerland, 2006. [Google Scholar]
  16. International Organization for Standardization. ISO 14044 Environmental Management—Life Cycle Assessment—Requirements and Guidelines; International Organization for Standardization: Geneva, Switzerland, 2006. [Google Scholar]
  17. Turconi, R.; Boldrin, A.; Astrup, T.F. Life cycle assessment (LCA) of electricity generation technologies: Overview, comparability and limitations. Renew. Sustain. Energy Rev. 2013, 28, 555–565. [Google Scholar] [CrossRef] [Green Version]
  18. Gil, M.P.; Moya, A.M.C.; Dominguez, E.R. Life cycle assessment of the cogeneration processes in the Cuban sugar industry. J. Clean. Prod. 2013, 41, 222–231. [Google Scholar] [CrossRef]
  19. Ramjeawon, T. Life cycle assessment of electricity generation from bagasse in Mauritius. J. Clean. Prod. 2008, 16, 1727–1734. [Google Scholar] [CrossRef]
  20. Silva, D.A.L.; Delai, I.; Montes, M.L.D.; Ometto, A.R. Life cycle assessment of the sugarcane bagasse electricity generation in Brazil. Renew. Sustain. Energy Rev. 2014, 32, 532–547. [Google Scholar] [CrossRef]
  21. Janghathaikul, D.; Gheewala, S.H. Bagasse—A sustainable energy resource from sugar mills daranee. Asian J. Energ. Environ. 2006, 7, 356–366. [Google Scholar]
  22. Jenjariyakosoln, S.; Gheewala, S.H.; Sajjakulnukit, B.; Garivait, S. Energy and GHG emission reduction potential of power generation from sugarcane residues in Thailand. Energy Sustain. Dev. 2014, 23, 32–45. [Google Scholar] [CrossRef]
  23. Ghani, H.U.; Gheewala, S.H. Comparative life cycle assessment of byproducts from sugarcane industry in Pakistan based on biorefinery concept. Biomass Convers. Biorefinery 2018, 8, 979–990. [Google Scholar] [CrossRef]
  24. Hiloidhari, M.; Banerjee, R.; Rao, A.B. Life cycle assessment of sugar and electricity production under different sugarcane cultivation and cogeneration scenarios in India. J. Clean. Prod. 2020, 125170. [Google Scholar] [CrossRef]
  25. Ghani, H.U.; Gheewala, S.H. Environmental sustainability assessment of molasses-based bioethanol fuel in Pakistan. Sustain. Prod. Consum. 2020, 27, 402–410. [Google Scholar] [CrossRef]
  26. Afghan, S.; Qureshi, M.A. Sugarcane Cultivation in Pakistan; Shakarganj Sugar Research Institute: Jhang, Pakistan, 2005. [Google Scholar]
  27. Malik, K.B. Cane and Sugar Production; Punjab Agricultural Research Board (PARB): Lahore, Pakistani, 2011.
  28. Ali, R.Z. Advanced Sugarcane Production Technology; Sugarcane Research Institute: Faisalabad, Pakistan, 2011.
  29. Ghani, H.U.; Silalertruksa, T.; Gheewala, S.H. Water-energy-food nexus of bioethanol in Pakistan: A life cycle approach evaluating footprint indicators and energy performance. Sci. Total Environ. 2019, 687, 867–876. [Google Scholar] [CrossRef] [PubMed]
  30. Hugot, E. Handbook of Cane Sugar Engineering; Elsevier Publishing Company: Amsterdam, The Netherlands, 1986. [Google Scholar]
  31. Rein, P. Cane Sugar Engineering; Bartens, K.G.A., Ed.; Springer: Berlin, Germany, 2007. [Google Scholar]
  32. Gomez, D.R.; Watterson, J.D.; Americano, B.B. Stationary Combustion. In IPCC Guidelines for National Greenhouse Gas Inventories; IPCC: Kyoto, Japan, 2006. [Google Scholar]
  33. U.S. Environmental Protection Agency. Emission Factor Documentation for Bagasse Combustion in Sugar Mills; U.S. EPA: Durham, NC, USA, 1997.
  34. Huijbregts, M.A.J.; Steinmann, Z.J.N.; Elshout, P.M.F.; Stam, G.; Verones, F.; Vieira, M.; Zelm, R.V. ReCiPe2016: A harmonized life cycle impact assessment method at midpoint and endpoint level. Report I: Characterisation. Int. J. Life Cycle Assess. 2017, 22, 138–147. [Google Scholar] [CrossRef]
  35. Goedkooop, M.; Oele, M.; Leijting, J.; Ponsioen, T.; Meijer, E. Introduction to LCA with SimaPro; PRé Consultants: Amersfoort, The Netherlands, 2016. [Google Scholar]
  36. Bruyn, S.D.; Bijleveld, M.; Graaff, L.D.; Schep, E.; Schroten, A.; Vergeer, R.; Ahdou, S. Environmental Prices Handbook Environmental Prices Handbook; CE Delft: Delft, The Netherland, 2018. [Google Scholar]
  37. Goedkoop, M.; Heijungs, R.; Huijbregts, M.; de Schryver, A.; Struijs, J.; van Zelm, R. ReCiPE 2008: A Life Cycle Impact Assessment Method Which Comprises Harmonised Category Indicators at the Midpoint and the Endpoint Level; PRé Consultants: Amersfoort, The Netherlands, 2013. [Google Scholar]
  38. Eurostat. Eurostat—Tables, Graphs and Maps Interface (TGM) Table. 2020. Available online: https://ec.europa.eu/eurostat/tgm/table.do?tab=table&plugin=1&language=en&pcode=sdg_08_10 (accessed on 29 November 2020).
  39. Macrotrends. Pakistan GDP Growth Rate 1961–2020|MacroTrends. 2020. Available online: https://www.macrotrends.net/countries/PAK/pakistan/gdp-growth-rate (accessed on 29 November 2020).
  40. Statista. Pakistan: Inflation Rate 2014–2024|Statista. 2020. Available online: https://www.statista.com/statistics/383760/inflation-rate-in-pakistan/ (accessed on 29 November 2020).
  41. Datacommons. Pakistan—A Country in Asia. 2020. Available online: https://datacommons.org/place/country/PAK (accessed on 29 November 2020).
  42. Klein, C.D.; Novoa, R.S.A.; Ogle, S. N2O emissions from managed soils, and CO2 emissions from lime and urea application. In IPCC Guidelines for National Greenhouse Gas Inventories; IPCC: Kyoto, Japan, 2006. [Google Scholar]
  43. Uzair, M.; Sohail, S.S.; Shaikh, N.U.; Shan, A. Agricultural residue as an alternate energy source: A case study of Punjab province, Pakistan. Renew. Energy 2020, 162, 2066–2074. [Google Scholar] [CrossRef]
  44. State Bank of Pakistan. Exchange Rates for Mark-to-Market Revaluation—History. 2020. Available online: https://www.sbp.org.pk/ecodata/rates/m2m/M2M-History.asp (accessed on 2 December 2020).
  45. Kamran, M.; Mudassar, M.; Abid, I.; Fazal, M.R.; Ahmed, S.R.; Abid, M.I.; Khalid, R.; Hussain, S. Reconsidering the power structure of Pakistan. Int. J. Renew. Energy Res. 2019, 9, 480–492. [Google Scholar]
  46. Kashif, M.; Awan, M.; Nawaz, S.; Amjad, M.; Talib, B.; Farooq, M.; Nizami, A.-S.; Rehan, M. Untapped renewable energy potential of crop residues in Pakistan: Challenges and future directions. J. Environ. Manag. 2020, 256, 109924. [Google Scholar] [CrossRef]
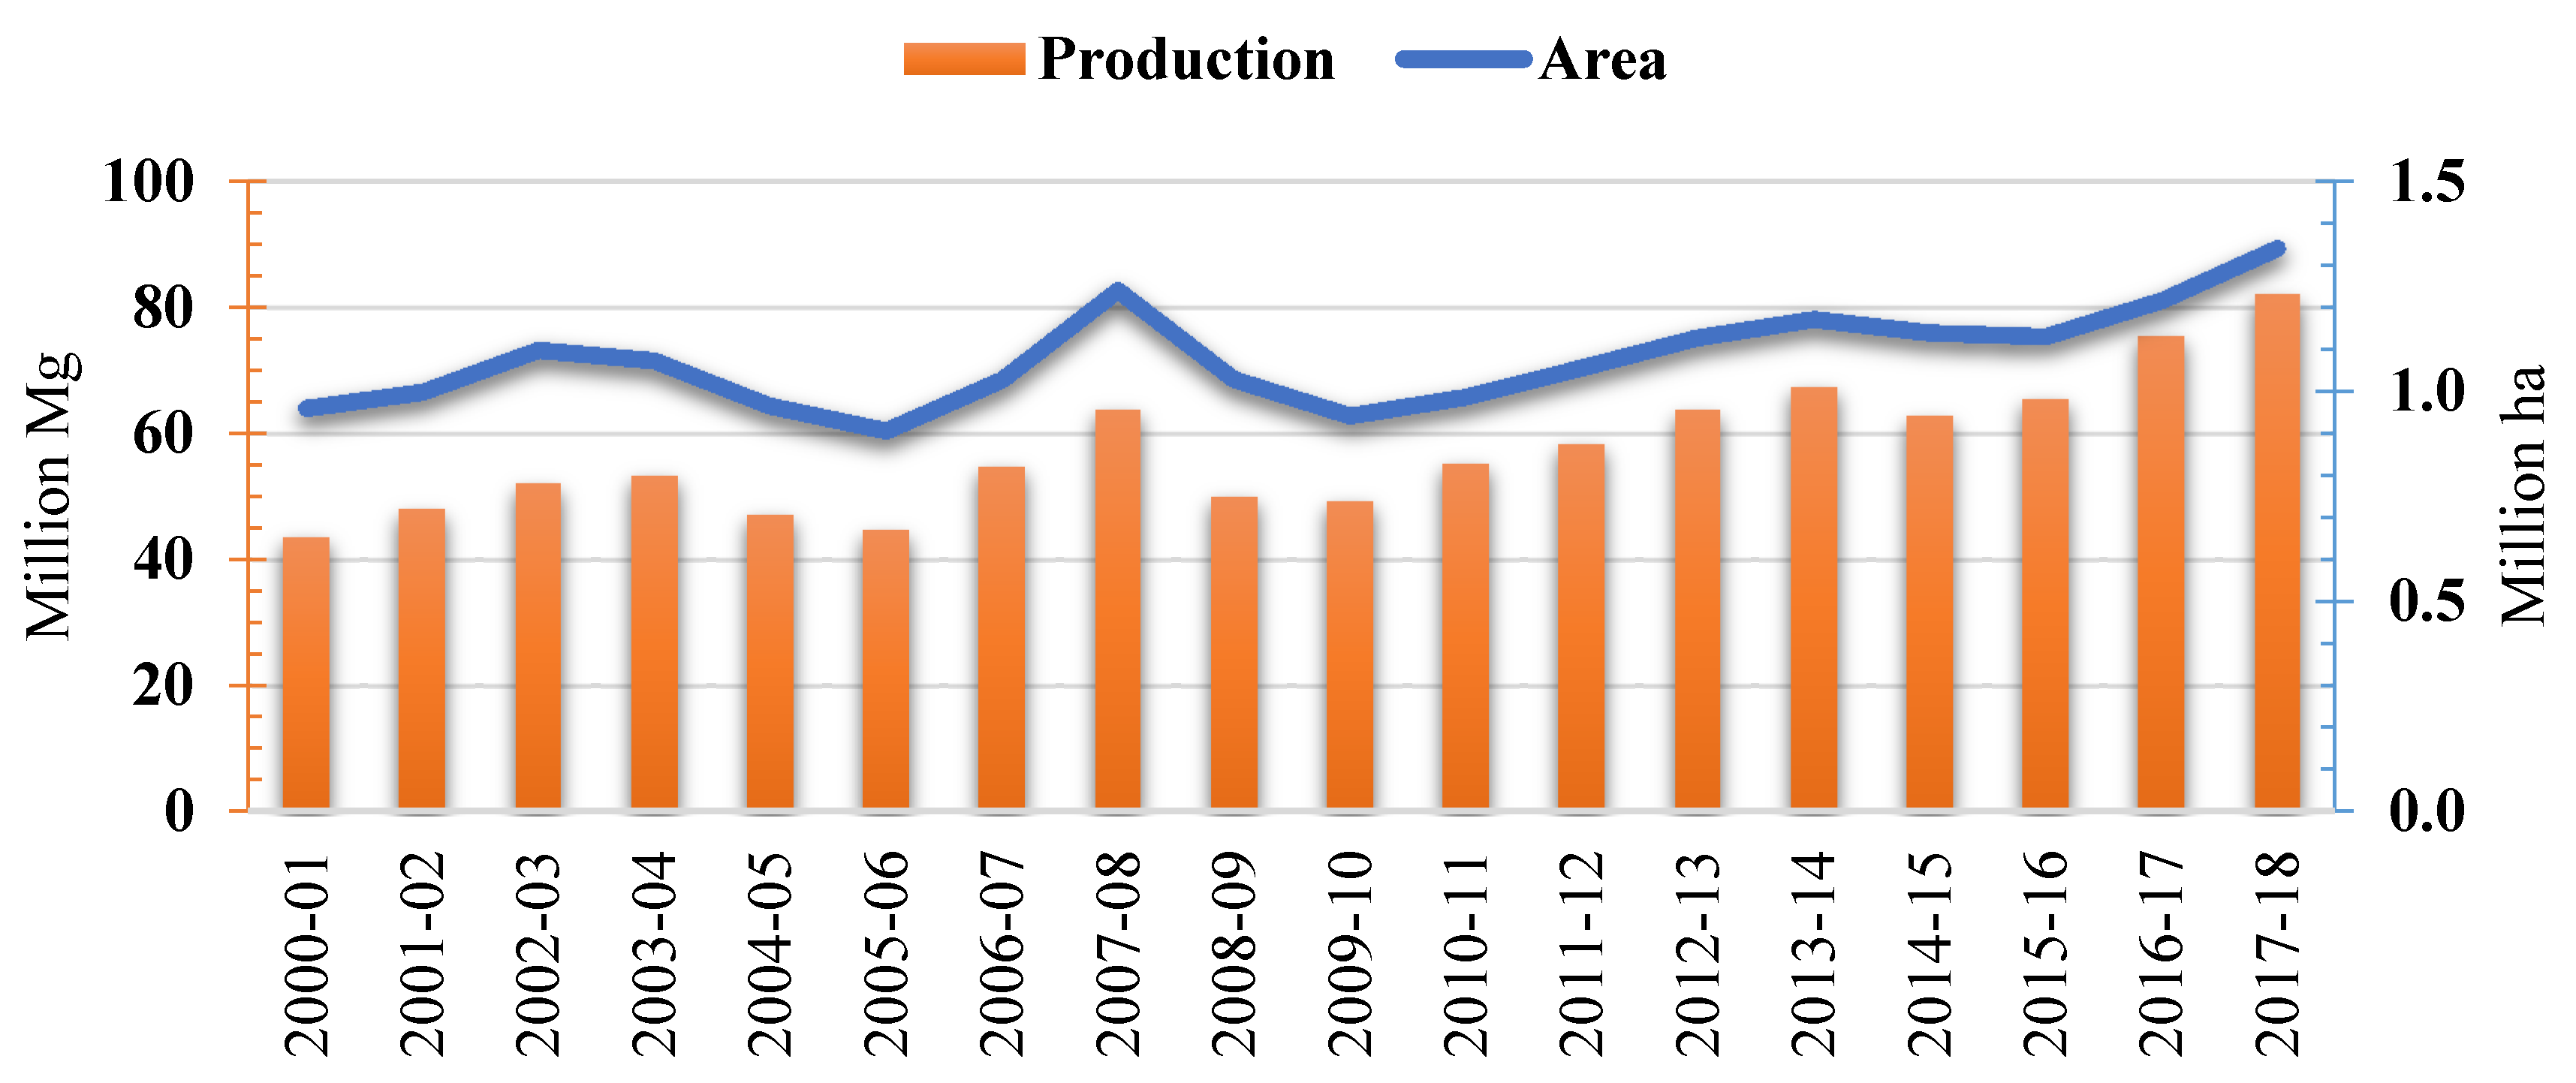
Figure 1. Annual production and area under sugarcane cultivation [5].
Sustainability 12 10594 g001
Figure 2. Provincial share of sugarcane production and acreage in Pakistan [5].
Sustainability 12 10594 g002
Figure 3. The percentage share of electricity generated by the type of fuel [9].
Sustainability 12 10594 g003
Figure 4. Map of bagasse-based electricity generation potential in Pakistan (retrieved from [14]).
Sustainability 12 10594 g004
Figure 5. The life cycle product system of a bagasse-based high-pressure cogeneration power plant.
Sustainability 12 10594 g005
Figure 6. Bagasse-based high-pressure cogeneration plant.
Sustainability 12 10594 g006
Figure 7. Contribution of different stages towards environmental impacts (midpoint).
Sustainability 12 10594 g007
Figure 8. Contribution of midpoint categories towards environmental damages (Human health) of bagasse-based and grid mix electricity.
Sustainability 12 10594 g008
Figure 9. Contribution of midpoint categories towards environmental damages (Ecosystem quality) of bagasse-based and grid mix electricity.
Sustainability 12 10594 g009
Table 1. The required inventory data, types, and sources.
Data TypeRequired Data Source
Secondary dataAgricultural field data
-
Cane cultivation
-
Input of seeds, fuels, agro-chemicals (fertilizers and weed/pest control), and water, etc.
Transportation of cane
Sugar milling
-
Materials, chemicals, fuels, and energy requirements
-
Waste generated
Heat and power generation data (low-pressure cogeneration)
-
Materials, chemicals, bagasse, and water, etc.
-
Waste generated and its use
Mainly from the study conducted by Ghani and Gheewala [25]
Missing values obtained from other studies and reports
Materials and chemicals production
-
Agro-chemicals, industrial chemicals, and other materials
Transport, fuel production, and burning
National grid mix of electricity production
Inventory databases available with SimaPro software, mainly from Ecoinvent and U.S. Life Cycle Inventory (USLCI) databases
Cane trash burning, fertilizer and pest/weed control chemical application, wastewater treatmentGhani and Gheewala [25]
Primary dataBagasse-based high-pressure cogeneration
-
Fuel requirements, water, chemicals, steam generation, and power production, etc.
Interviews, industrial reports, and calculations
Table 2. Inventory data for agricultural stage per functional unit (1 MWh) (derived from Ghani and Gheewala [25]).
ComponentValue
Seed (kg)826
Diesel for agricultural operations (L)10.86
Fertilization (mineral)
N (kg)61.20
P (kg)23.62
K (kg)7.30
Fertilization (natural)
N (kg)3.70
P (kg)1.87
K (kg)1.61
Pesticide and herbicide chemicals
Pesticide (kg)9.04
Herbicides (kg)0.56
Micronutrients
Zinc sulfate (kg)0.88
Sulfur (kg)0.35
Humic acid (mL)659
Irrigation requirements1
Rainwater (m3)1306
Irrigation water (m3)3994
Fuel for irrigation
Diesel (L)29.67
Electricity (kWh)43
1 Derived from Ghani et al. [29].
Table 3. Inventory data for sugar milling stage per functional unit (1 MWh) (derived from Ghani and Gheewala [25]).
ComponentValue
Inputs
Cane (Mg)19.20
Lime (kg)12.84
Phosphoric acid (kg)0.76
Caustic soda (kg)1.22
Water (m3) 18.05
Land (m2) 119.2
Outputs
Sugar (kg)1924
Molasses (kg)864
Bagasse (kg)2409
Filter cake (kg)576
Wastewater (m3)2.46
1 Calculated based on the data obtained from plants.
Table 4. The inventory data of the power plant for 1 MWh of exportable electricity.
ComponentValue
Inputs
Bagasse from own plant (Mg) 11.61
Bagasse from outside plants (Mg) 20.80
Fuel for transportation (L) 30.90
Water (m3)4.86
Land (m2)1.06
NaOCl 40.07
H2SO4 40.24
HCl 40.24
Outputs
Exportable electricity (MWh)1
Ash (kg) 548
Emissions 6
N2O (kg)7.23 × 10⁻²
CH4 (kg)5.42 × 10⁻¹
CO2 biogenic (kg) 71.70 × 10³
NOx (kg)1.30
PM (kg)9.18
PM10 (kg)1.49
Polycyclic organic matter (kg)1.20 × 10⁻³
Wastewater (m3) 81.27
1 The bagasse from the attached sugar mill plant is considered to meet the needs for a total of 165 days (120 days in-season and 45 days off-season). 2 The bagasse from outside sugar plants is considered to be used for a total of around 105 days. 3 An average distance of 40 km was considered based on nearby sugar plants for sourcing the bagasse. 4 Chemicals are mainly used for water treatment. 5 Ash value is acquired from industrial reports and it is sent back to the crop production stage as an avoided product to NPK fertilizer. 6 Derived from the Intergovernmental Panel on Climate Change (IPCC) [32] and U.S. Environmental Protection Agency [33]. 7 The biogenic CO2 is not included in global warming calculations because of its short cycle. 8 The wastewater includes the blowdown and drain water from boilers, cooling towers, and water treatment plants.
Table 5. Grid mix electricity generation by fuel type (fiscal years (FY) 2018–2019) in Pakistan.
Fuel TypeGWhShare (%)
Gas2801120.44
Regasified liquefied natural gas (LNG)3081322.49
Residual Fuel Oil1382610.09
High Speed Diesel280.02
Coal1672512.20
Hydro3309624.15
Nuclear91366.67
Wind32522.37
Solar7710.56
Bagasse8940.65
Import (Iran)4870.36
Total137039100
Table 6. The economic values used for adapting environmental prices for Pakistan.
ComponentUnitValueSource
GDP per capita in Europe (GDPEU)USD25,920[38]
GDP per capita in Pakistan (GDPPak)USD1357[39]
Price inflation (∆P)%4.53[40]
Percentage of income change (∆I) %5.53[41]
Table 7. Environmental impact results (midpoint) per MWh of exportable electricity.
Impact CategoryUnitBagasse-BasedGrid Mix
Global warmingkg CO2 eq174573
Fine particulate matter formationkg PM2.5 eq8.23 × 10−11.64
Terrestrial acidificationkg SO2 eq4.975.63
Freshwater eutrophicationkg P eq1.08 × 10−22.51 × 10⁻⁴
Marine eutrophicationkg N eq6.38 × 10−15.51 × 10⁻³
Land usem2a crop eq1812.20
Fossil resource scarcitykg oil eq23198
Water consumptionm34433.44 × 10−2
Table 8. Environmental impact results (endpoint) per MWh of exportable electricity.
Impact CategoryUnitBagasse-BasedGrid Mix
Human healthDALY1.22 × 10−31.56 × 10⁻³
Ecosystem qualityspecies.yr1.32 × 10−52.82 × 10⁻⁶
Resource availabilityUSD20139.0760.3
Table 9. Weighted environmental prices per MWh of exportable electricity.
Impact Category Environmental Prices (USD 2015)
Bagasse-BasedGrid Mix
Global warming1.113.67
Fine particulate matter formation3.657.29
Terrestrial acidification4.214.76
Freshwater eutrophication2.26 × 10−35.28 × 10⁻⁵
Marine eutrophication2.24 × 10−11.94 × 10⁻³
Land use2.583.14 × 10−2
Fossil resource scarcity00
Water consumption00
Total11.7815.75
Table 10. The summarization of the pros and/or cons considering the comparative performance of bagasse and grid mix electricity.
Environmental/
Economic Indicators
Pros and/or Cons
BagasseGrid Mix
Global warming70% less impactThe heavy dependence on fossil fuels is the main reason for higher GHG emissions
Fine particulate matter formation50% less impact
Terrestrial acidification12% less impact
Freshwater eutrophicationThe application of phosphorus in the crop production phase resulted in a higher freshwater eutrophication98% less impact
Marine eutrophicationThe application of nitrogen-based fertilizers in the crop production phase resulted in a higher marine eutrophication99% less impact
Land useLand intensive nature of agricultural phase99% less impact
Fossil resource scarcity88% less impact Being of fossil-based origin was the main reason for higher impact
Water consumptionWater intensive nature of agricultural phaseComparatively negligible use of water
Human health85% less impact
Ecosystem quality22% less impact
Resource availability79% less impact
Environmental prices (USD 2015)25% less weighted environmental price
Publisher’s Note: MDPI stays neutral with regard to jurisdictional claims in published maps and institutional affiliations.