Abstract
Innovation is an inevitable way for cities to achieve sustainable development. The occurrence of innovation activities is a complex systemic behavior. Its spatial distribution has some location selection laws, which are the result of interaction and feedback between various spatial influence factors. We explain the impact mechanism from the microscale using a street unit in a city. Hangzhou was selected as a case study. First, we systematically selected factors influencing the spatial distribution of innovation activities as the independent variable based on the demands of innovation subjects. Patents were used as the dependent variable to represent the spatial distribution of innovation activities. Second, ensemble algorithms (Boosting) were used to analyze the influence contribution of independent variables to dependent variables. Then, based on the aspects of innovation driving force, which are innovation resources and innovation environments, relevant factors were divided into the following seven categories: innovation industry concentration, knowledge intensity, innovative talent resources, service facilities, external transportation convenience, public transportation convenience, and ecological environment. We interpreted the impact mechanism and made corresponding suggestions for urban innovation space planning.
1. Introduction
Innovation is the most important factor used to promote sustainable economic development and social progress in the era of the knowledge economy, and it is the core competitiveness feature that is pursued by cities. Cities gather talented individuals, universities, research institutions, and high-tech enterprises and are the main output locations for new ideas and technologies [1,2,3]. Therefore, innovation activities are most active and abundant within cities. Florida and Adler [4] treat the city as a potential innovation hub and suggest that innovation and entrepreneurship do not simply take place in cities, but in fact require cities in order to develop. Not all urban spaces are conducive to the development of innovation activities because of the particularity of innovation. The formation and development of urban innovation space for conducting innovation activities require certain basic conditions and have different spatial characteristics and laws from traditional urban spaces [5]. According to Schumpeter’s theory, innovation has agglomeration effects [6]. Industrial production tends to be located close to the origin of raw materials according to industrial location theory, and there are locational preferences found in the spatial distribution pattern of innovation activities. The construction of urban innovation space used for carrying out innovation activities is responsible for the success of urban sustainable innovation-driven development. Exploring the spatial influence factors involved in the distribution pattern of innovation activities is an important step to understand the spatial development laws of innovation activities. It is also an urgent issue that needs to be resolved in the implementation of a strategy of urban sustainable innovation development.
Innovation activities have special spatial distribution characteristics in cities. It is possible to optimize innovation space layouts by using urban planning to promote innovation development. The first task needed to achieve this is to clarify the influence factors of the spatial distribution of innovation activities in the city. Urban planning can optimize the spatial structure of innovation spaces by guiding the influence factors and can then achieve innovation development. At present, research on innovation mainly concentrates on the macroscale, such as national and regional scales, regarding the city as a unit. This research also currently studies the relationship between cities and innovation, such as through evaluations of urban innovation capacity and urban innovation efficiency [7,8]. However, there are relatively few studies on the spatial distribution of innovation activities within cities, and quantitative research on influence factors is lacking. For example, Duan et al. used postal-level data to analyze the spatial distribution of innovation activities in Shanghai and Beijing [9]. However, their data did not explain the internal mechanisms that caused this spatial distribution. In general, the quantitative research on the location selection rules of innovation activities within cities is scarce.
With the development of technology, the era of big data has arrived. As an important branch of artificial intelligence technology, machine learning has been widely used in various scientific research models and plays an irreplaceable role in this context. Powerful big data analysis and calculation technology make it possible to analyze mass data. Ensemble learning is an important specific algorithm for machine learning. It has been applied to many fields, such as medicine, statistics, and probability theory [10,11]. Based on the mining and analysis of existing data, ensemble learning obtains data rules and uses these rules to make predictions [12]. The operation of urban innovation activities is a system. Its spatial distribution has many influence factors and its influence mechanism is complex. Simple models cannot accurately express and fit the influence relationships and mechanisms. There is a need for a more elaborate explanatory model. Ensemble learning has higher accuracy and powerful forecasting capabilities, and can cope with complex problems such as urban planning decisions. Ensemble learning can combine multiple weak models to characterize the influence factors of spatial distribution of innovation activities and train analysis models based on real data to explain the influence mechanisms. We can both optimize and predict the spatial distribution of innovation activities caused by urban planning.
We think that (1) innovation activities are active within cities, and their spatial distribution has locational preferences, (2) only by clarifying the factors that influence the spatial distribution of innovation activities and the mechanism can we scientifically make plans for innovative activities that promote innovation, and (3) ensemble learning is an efficient and accurate method that can cope with complex problems. It can accurately explain the influence mechanism of various factors on the spatial distribution of innovation activities and has powerful prediction functions. Patent data reflect effective innovation outputs, and the research on innovation activities using patents has been widely recognized by scholars. The city is the most basic and important unit that can effectively implement innovation development policies and plans. It is important to conduct research on the factors influencing the spatial distribution of innovation activities if we want to figure out the development laws governing innovation spaces within cities. Therefore, we used patents to characterize innovation activities, and an ensemble learning algorithm was applied to analyze the influence mechanism of spatial factors and its effects on the spatial distribution of innovation activities. These results can provide support for spatial decision-making and development planning of urban innovation.
The remainder of this article is structured as follows: Section 2 provides a literature review; Section 3 establishes a framework for analyzing influencing factors under demand orientation from the perspective of innovation subjects; Section 4 describes the research method and data; Section 5 constructs an interpretation model based on the ensemble learning algorithm, and the operation results are obtained to analyze how these factors affect the spatial distribution of innovation activities; and Section 6 includes our conclusions and limitations.
2. Literature Review
Many scholars have observed and described the spatial distribution of innovation activities and found that the spatial description of innovation activities has certain characteristics and laws. New economic geography believes that economic activities have significant agglomeration characteristics. As an economic activity, innovation also has spatial imbalance and polarization characteristics, and agglomeration characteristics change with time. Feldman and Florida [13] characterized innovation activities with patents and found that innovation activities have a high degree of spatial autocorrelation. Lim [14] observed differences in the spatial distribution of innovative activity across US metropolitan areas and found that the concentration of innovative activity in a metropolitan area is spatially correlated to the concentration of neighboring metropolitan areas. Xu et al. [15] explored the spatial characteristics and mechanisms of innovation activities in Jiangsu province of China and found that spatial distribution of innovation activities is spatially correlated, and the spatial differences characterized by time show a trend of agglomeration–dispersion–re-aggregation.
A city gathers excellent innovation talents, innovation companies leading cutting-edge science and technology, and scientific research institutions and becomes the most critical spatial dimensions for innovation. Relevant scholars have gradually analyzed the spatial distribution of innovation activities from the macroscale to the city scale and found that the spatial distribution of innovation activities in cities is affected by different factors. Méndez and Moral [16] conducted a study of Spanish cities in metropolitan sectors that are highly prized socially and environmentally and have strengthened the presence of knowledge-intensive services and highly qualified human resources and found that innovative companies often cluster in and around the vibrant downtown for developed service industries. Halbert [17] thought that innovative companies are expected to be in higher places and satellite cities, relying on expressways to maintain convenient connection space and an excellent ecological environment. Feldman and Florida [13] examined the geographic sources of innovation, focusing specifically on the relationship between product innovation and the underlying infrastructure comprised of agglomerations of firms in related manufacturing industries, geographic levels of industrial R&D, concentrations of university R&D, and business service firms. Geographic concentrations of infrastructure could enhance the capacity for innovation.
Scholars tried to explain the influence mechanism when they realized that the spatial distribution of innovation is influenced by many factors. Florida [18] explained the spatial agglomeration of innovative activities from the perspective of agglomeration of creative classes and proposed that regions that have large numbers of creative class members are also some of the most affluent and growing. Teirlinck and Spithoven [19] supported the idea that innovation is spatially organized and the organization of innovation depends on the physical, socio-economic, and cultural environment, and they discussed the distribution mechanism of innovation activities from aspects of enterprise openness, external knowledge connection, and innovation environment. Ellison and Glaeser [20] noted that agglomerations may arise based on localized industry-specific spillovers, and natural advantages may account for a substantial portion of observed geographic concentration. We can see that related studies are qualitative analyses of impact factors and interpretations of impact mechanisms.
Most studies characterized innovation activities with innovative outputs [5]. Patent data reflect effective innovation output, and the research on innovation activities using patents has been widely recognized by scholars. David [21] used US patent and citation data to measure technological relatedness between major patent classes and to form the links of a knowledge network. Acs et al. [22] provided an exploratory and a regression-based comparison of the innovation count data and patents and proved that patents could be the measurement of innovation activities. Jaffe et al. [23] considered patents as the evidence of the extent to which knowledge spillovers are geographically localized. The use of patent data to observe and analyze the organizational mechanism and spatial development characteristics of innovation activities has become a more common research strategy.
In terms of quantitative analysis of influence factors, knowledge function is the main theoretical model. It is assumed that there is a linear combination relationship between factors [24,25]. A linear regression model is very commonly used to analyze the relationship between features, while sometimes, the model is a weak learner with a low goodness of fit. We selected the linear model as a reference model. Ensemble learning is a kind of machine learning. It combines weak models and uses collective wisdom to obtain a better model which helps to prevent underfitting and overfitting [26]. The algorithm can generate a model based on real data that has high goodness of fit. When we encounter new situations, the model can provide us with corresponding judgments. According to individual learners, the ensemble learning algorithm is divided into two categories: one is the serialization method in which individual learners are strong, dependent, and must be generated serially; and the other is a parallel method in which individual learners are not strong or dependent and can be generated simultaneously. The former is represented by Boosting [27,28]. From the perspective of bias variance, the difference from parallel ensemble learning is that Boosting mainly focuses on reducing bias [29]. To get a model with excellent goodness of fit and outstanding prediction, we used Boosting to construct our model.
Through the literature review, in terms of research scale, the analysis of influence factors on the spatial distribution of innovation activities takes the city as an independent observation unit and does not explain the impact mechanism from more of a microscale within the city. In terms of research content, scholars pay more attention to how to create industrial atmosphere. The analysis of influence factors is fragmented and lacks systemic analysis, which leads to the result that the mechanism is not clearly explained. Innovation subjects are people or organizations that can innovate and engage in innovation activities. The analysis of influence factors on location selection of innovation activities should be based on the needs of innovation subjects to obtain factors systematically. In terms of research methods, scholars analyze the impact mechanism through the qualitative method, while we need more quantitative methods and explanation models with remarkable goodness of fit and prediction function.
Therefore, we systematically identified the influence factors of the spatial distribution of innovation activities based on the needs of innovation subjects. Patents at the street level were used to represent innovation activities. Ensemble learning was applied to analyze the influence factors and their impact mechanism on spatial distribution of innovation activities. Hangzhou was selected as a case study. This study fills the gap in the research on selecting the influence factors based on the needs of innovation subjects and on explaining the impact mechanism from the street scale within the city. We applied ensemble learning of computer science to the field of urban planning for factors analysis, providing evidence for better understanding the formation mechanism of the spatial distribution characteristics of innovation activities within the city and for guiding the construction of innovation city.
3. Influence Factors of the Spatial Distribution of Urban Innovation Activities
Under the conditions of the new economy, the driving factors for socio-economic growth have gradually changed from material elements such as labor and land in the industrial economy to innovative elements such as talents and technology in the knowledge economy [30]. Innovation talents and industries have become the core driving factors and innovation subjects. Attracting innovation talents and supporting innovation industries play a key role in innovation development [18]. Therefore, studying the spatial needs of innovation subjects (innovative industries and innovative talents) can obtain the key factors that influence the spatial distribution of innovation activities.
3.1. Demand Characteristics of Innovation Industries
The important feature of innovation development is that knowledge is the core element of production input, and traditional elements such as land and labor have no significant effect on the development of innovation industries [30,31]. Innovation industries can be divided into high-tech industries and cultural creative industries according to the amount of knowledge resources input [32]. The core needs of the innovation industries have become knowledge capital, and knowledge and information have become more and more important in economic activities. Since knowledge is rooted in individuals, innovation activities are more likely to occur in areas with high-quality labor resources [33,34]. Abundant human resources can form a high-quality labor pool to meet the needs of innovative industries, allowing the two to match each other faster to reduce the opportunity cost of waiting for partners [35]. Universities and research institutes are important sources of knowledge innovation, and their knowledge spillover effect is regarded as the fundamental driving force for the concentration and development of innovative activities [36,37]. Under the effect of the knowledge spillover, the distribution of innovation industries has a significant spatial agglomeration trend and characteristics. At the same time, the clustering of innovation industries can enhance the cooperation and interaction of enterprises, accelerate the diffusion of innovation, reduce the cost of knowledge acquisition, and further strengthen the knowledge spillover effect [38]. Therefore, to have more information elements of knowledge and technological innovation, knowledge-intensive areas and clusters of innovation industries will be the preferred locations for innovation industries. Considering the efficiency and path of knowledge flow, the convenience of transportation is also an important factor influencing the location selection of innovative industries [39].
3.2. Demand Characteristics of Innovation Talents
Innovation talents are the main carrier of knowledge output and spillover. The gathering of innovation talents can further promote the innovation of knowledge and technology [40]. The behavioral characteristics, work styles, and lifestyles of innovation talents have different requirements for urban innovation space. Based on the needs of innovation talents for the innovation environment, the provision of corresponding supporting service facilities can not only increase the attractiveness to innovation talents, but also strengthen the adaptability of the innovation space to the personality characteristics of innovation talents, forming a virtuous cycle of promoting innovation. According to the survey, the space needs of innovative talents have significant ethnic characteristics: young, high levels of education, high income levels, and high requirements for the quality of working and living environments. The realization of the demand of innovation talents depends on certain urban functions, including catering, leisure, sports, medical, education, transportation, and residence. The realization of these functions needs convenient and diversified service facilities, such as restaurants, cafes, gyms, primary and secondary schools, hospitals, etc. Talents want efficient, convenient, green and accessible transportation, and an ecological living environment.
3.3. Analysis Framework of Influence Factors under Demand Orientation
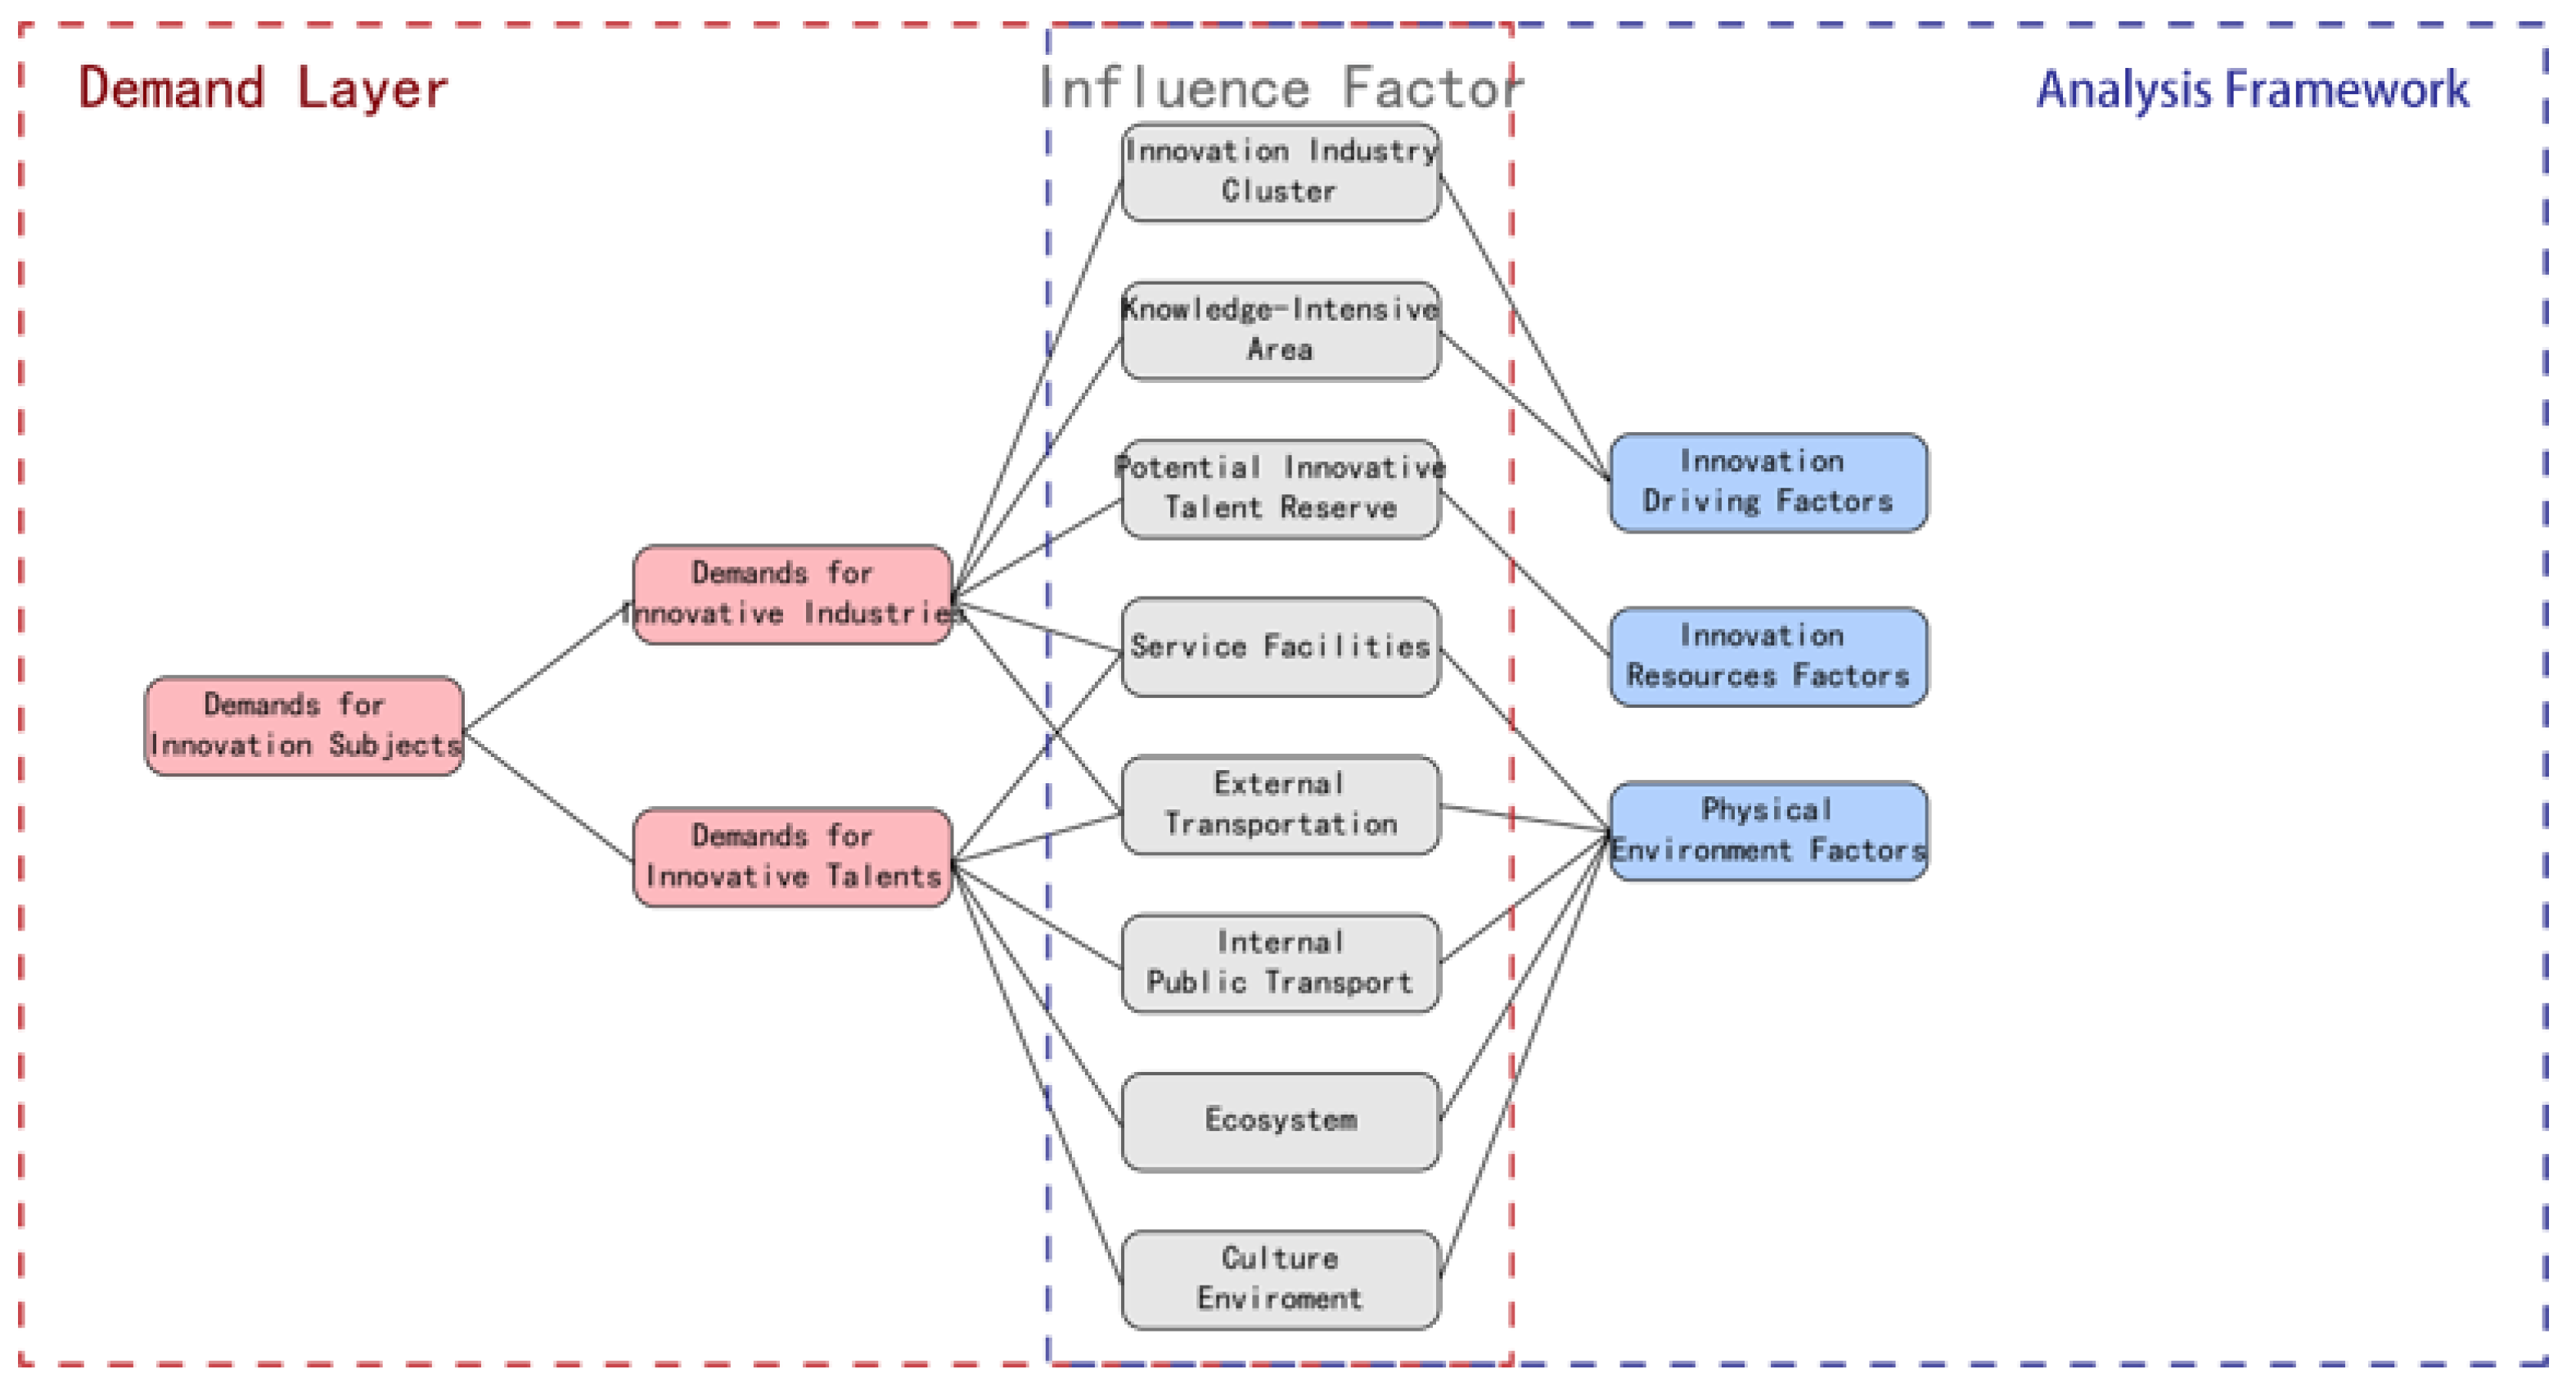
From the perspective of the demands of innovation subjects, the above-mentioned impact factors were classified, optimized, and improved to form an analysis framework. Factors were sorted into three categories—innovation driving factor, innovation resource factor, and innovation environmental factors. Innovation driving factors refer to subjects with innovative capability, such as innovation enterprises, universities, and research institutions, which are the driving force for innovation. Innovation resource factor refers to talents required for innovation as the foundation. Innovation environment factors are service facilities, traffic conditions, ecological environment, and cultural environment, which are important supports for innovation and development. There are eight sub-categories: innovation industry agglomeration degree, knowledge intensity, innovation talent density, service facilities convenience, external transportation convenience, public transportation convenience, ecological environment, and cultural environment. The analysis framework consists of 19 impact factors: high-tech industry density, cultural and creative industry density, university density, scientific research institution density, talent density, primary school density, middle school density, hospital density, sports facility density, catering facility density, leisure facility density, airport accessibility, high-speed rail station accessibility, bus station accessibility, subway station accessibility, park accessibility, mountain accessibility, water accessibility, and cultural heritage buffer zone accessibility (Figure 1).
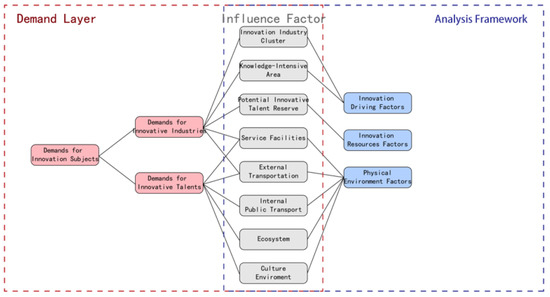
Figure 1.
The formation of innovative space evaluation system framework.
4. Research Design, Data, and Methods
4.1. Research Design
Section 3 identified 19 spatial factors that influence the spatial distribution of innovation activities from the perspective of the needs of the innovation subject based on the literature analysis. The overall research process was mainly divided into four steps. First, we collected and processed data that can characterize the impact factors and the spatial distribution of innovation activities. Second, influence factors were independent variables, and the innovation activities were dependent variables. Through Pearson correlation analysis, factors whose correlation with spatial distribution of innovation activities was moderate, strong, or very strong were selected for the construction of the explanation model. At the same time, the multiple linear regression model was used as the reference model to further verify the rationality of the factors’ selection process. Then, all samples were divided into training and testing data. A training set was used to construct the interpretation model based on the ensemble learning algorithm. A testing set was used to test the accuracy and generalization of the model. Mean square error (MSE) and R2 were used to test model accuracy. Finally, we analyzed the influence factors and its mechanism on the spatial distribution of innovation activities (Figure 2).

Figure 2.
Research flowchart.
4.2. Research Object
Hangzhou, which is a typical and representative city in the field of innovation and development in China, was selected as the study object. The specific scope included Xihu District, Shangcheng District, Xiacheng District, Gongshu District, Jianggan District, Binjiang District, Xiaoshan District, Yuhang District, and Fuyang District, including a total of 121 towns.
4.3. Data Collecting and Data Processing
4.3.1. Data Collecting
Innovation industries—Data came from point of information (POI) on Baidu map (Baidu, Beijing, China, 2000), consisting of a total of 1256 cultural and creative enterprises (including press and publishing, radio, television, film and audio-visual industry, cultural and art industry, sports and entertainment industry) and 3625 high-tech companies (electronics and information technology industry, bio-engineering and new medical technology industry, new materials and applied technology industry, new energy and energy-efficient technology industry, and advanced manufacturing technology industry).
Universities and research institutes—Data came from POI on Amap (Amap, Beijing, China, 2010), consisting of a total of 167 universities and 138 scientific research institutions.
Talents—Data on the education level of Hangzhou’s population came from the survey of Hangzhou Public Security Bureau in December 2016. Talent refers to an urban resident with a bachelor’s degree and under 60 years old.
Service facilities—Data of schools, hospitals, sports, restaurants, and leisure facilities came from POI on Baidu map (Baidu, Beijing, China, 2000). Other data were obtained from relevant land plans.
Patent—We collected patent application data from the State Intellectual Property Office of China for Hangzhou City of 2016, totaling 55,614 items.
4.3.2. Data Processing
(1) Characterization data of influence factors (independent variables)
First, ArcMap10 (ESRI, Genelux, CA, USA, 2010) was used to unify data type and the spatial coordinate system. Second, nuclear density was applied to fit the spatial distribution of high-tech industry density, cultural and creative industry density, university density, scientific research institution density, talent density, primary school density, secondary school density, hospital density, sports facility density, catering facility density, leisure facility density, bus station density, and subway station density. The grid accuracy was 150 × 150 m. ArcMap10 (ESRI, Genelux, CA, USA, 2010) was used and multi-circle buffer analysis was performed on factors: airport accessibility, high-speed rail station accessibility, park accessibility, mountain accessibility, water accessibility, and cultural heritage buffer zone accessibility. Features were rasterized with a grid accuracy of 150 × 150 m. Different buffers of each feature were reclassified and assigned a score (Table 1). The characteristic data of each street in the city on each factor were the sum of all its grid.

Table 1.
Evaluation criteria for indicators calculated by the buffer.
(2) Characterization data of spatial distribution of innovation activities (dependent variable)
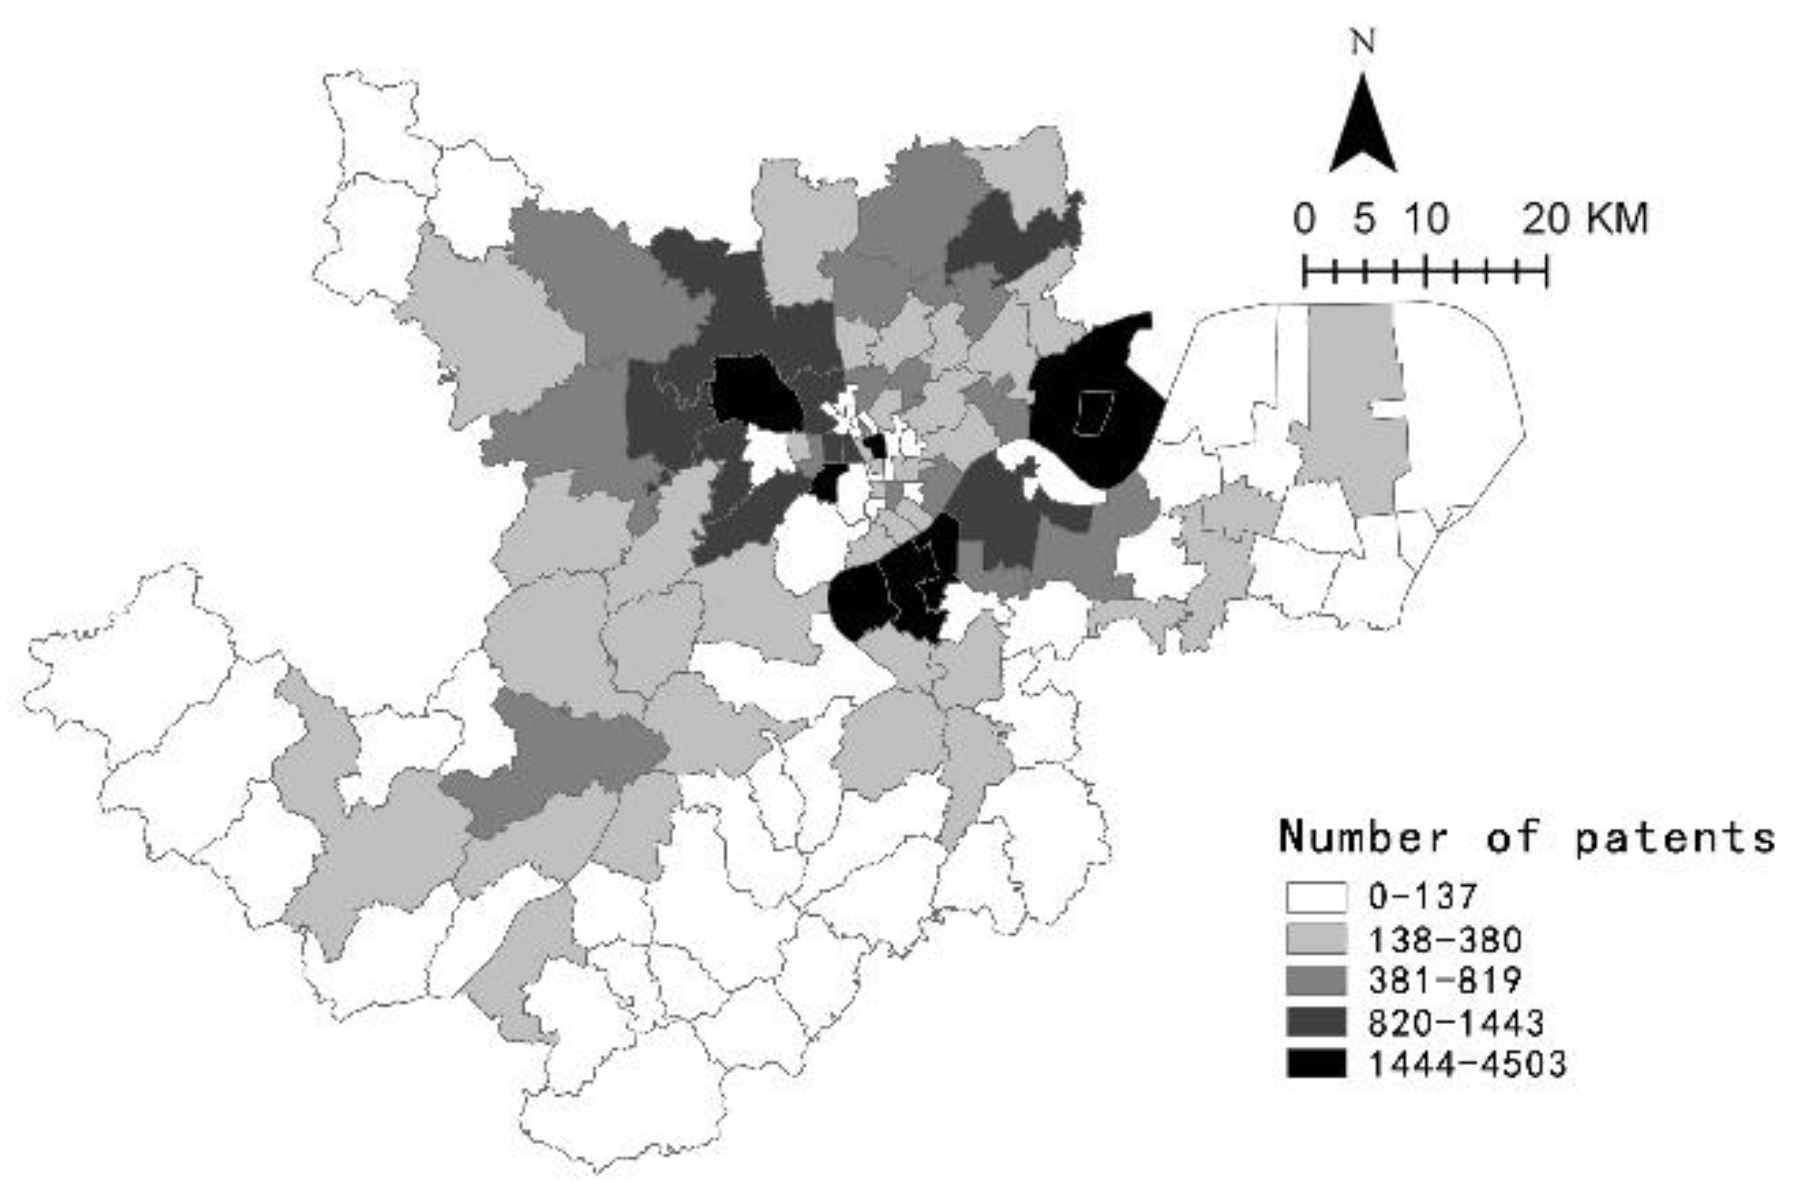
We counted the number of patents in each street and used the number of street-level patents to characterize the spatial distribution of innovation activities. The minimum was 0, and the maximum was 4503 patents. In the subsequent research content, the number of patents of each street was used as the dependent variable.
4.4. Research Method
4.4.1. Correlation Analysis Based on Pearson Coefficient
Correlation analysis is one of the basic analysis methods in classical statistics. It is used to determine whether there is dependency relationship between variables and how close the dependency relationship is [41]. Pearson correlation coefficient r is commonly used to deal with two sets of variables:
where represents the number of samples (the number of streets), and represent the observations of the th group of variables, and and represent the average of and . It can be proved that r is a quantity in the interval [−1,1]. If r > 0, it indicates a positive correlation. If r < 0, it indicates a negative correlation. If r = 0, it indicates no correlation. The larger the absolute value, the stronger the correlation.
4.4.2. Construction of Interpretation Model Based on Ensemble Learning
Ensemble learning can complete learning tasks by integrating multiple learners [42]. Compared with another ensemble learning algorithm, to reduce model bias, we chose Boosting as the ensemble algorithm. Boosting is a family of ensemble algorithms that can effectively improve accuracy of a model. Its working mechanism is as follows: First, a base learner is obtained from the initial training set. The training sample distribution is adjusted according to the performance of the learner, and the incorrect samples in previous base learner could receive more attention in the following steps. The next base learner is trained based on the adjusted samples. Then, the above steps are repeated until the number of base learners reaches K, which is specified in advance. Finally, the K base learners are combined and weighted to promote weak learners to strong learners [29,43]. A single learner may cause weak generalization performance. Combined multiple learners will reduce this risk [44]. Therefore, we selected Multilayer Perceptron Boosting (MLP–Boost) and Extreme Gradient Boosting (XGBoost) to train two component learners, and eventually form the final interpretation model by equal weighted combinations.
(1) Component learner 1: MLP-Boost
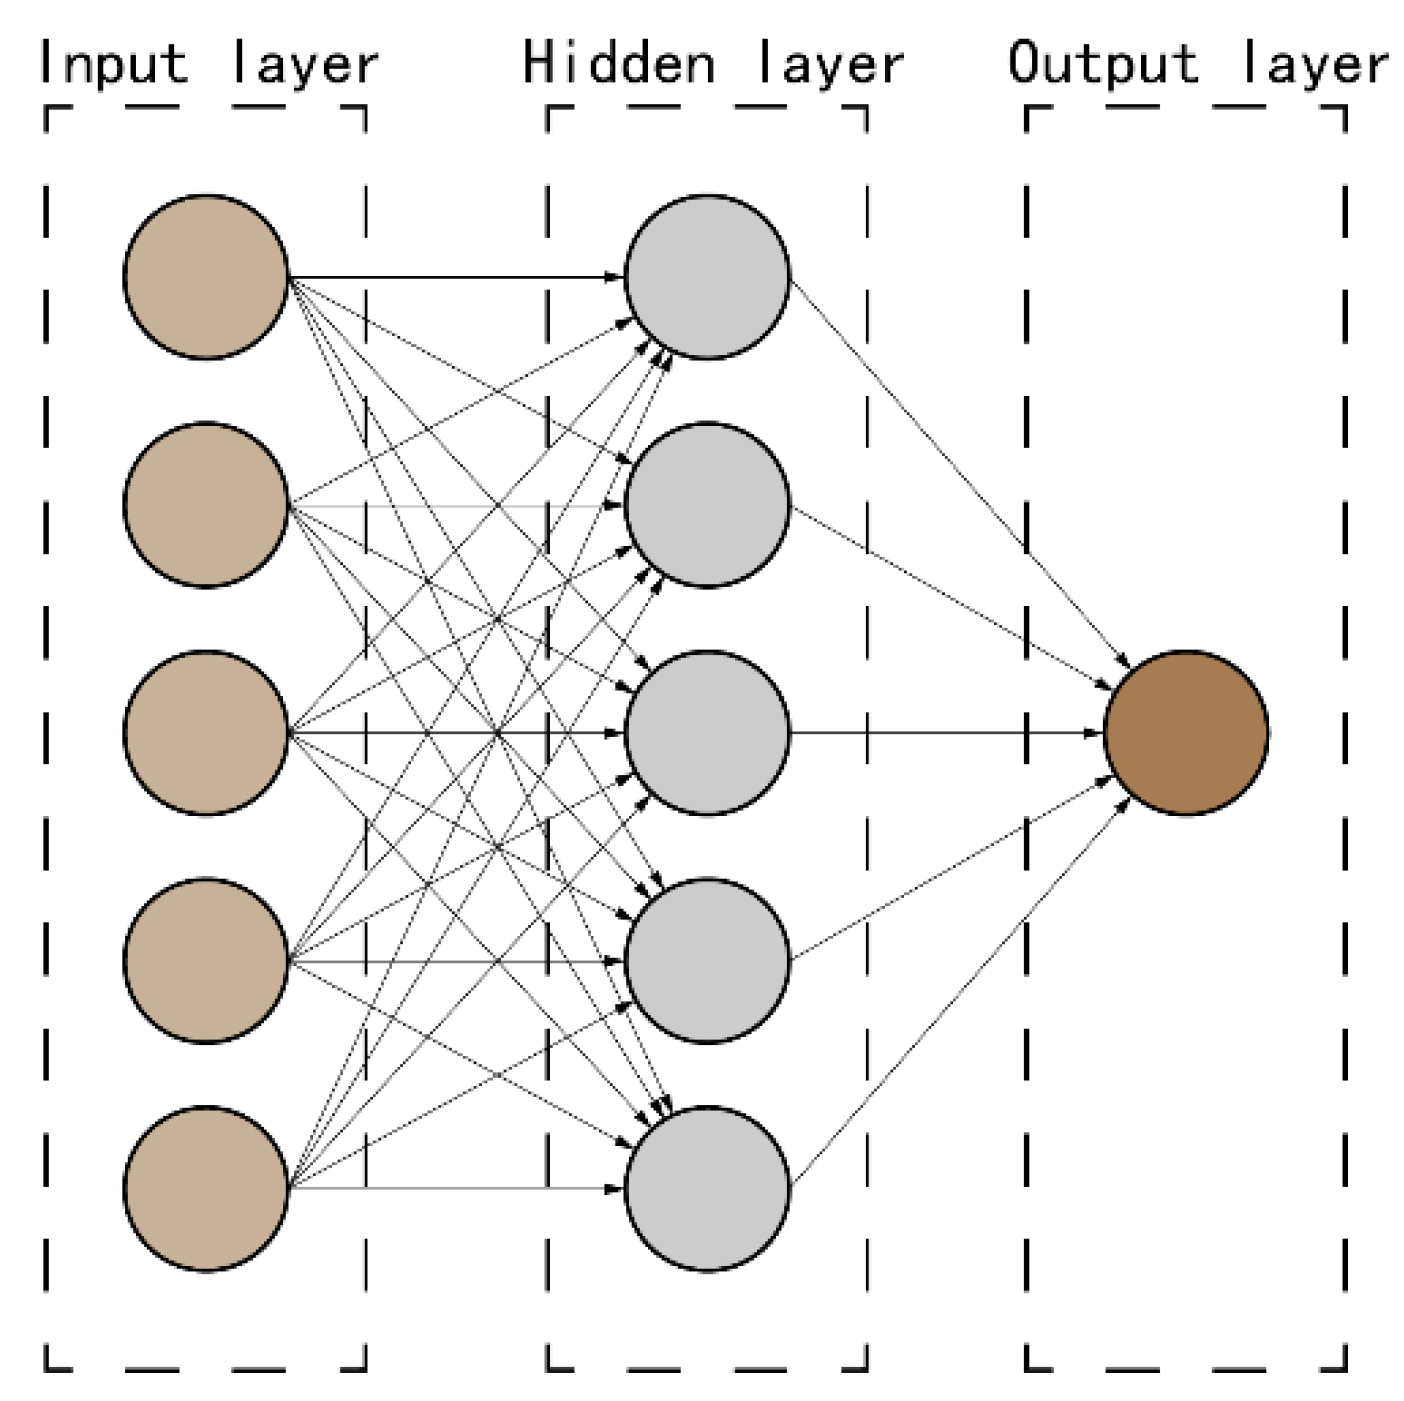
MLP is a feed forward artificial neural network, a supervised learning algorithm that mimics a biological neural network [45]. It includes three parts—an input layer, a hidden layer, and an output layer. The hidden layer can contain one or more layers of neurons. Taking the single hidden layer MLP as an example (Figure 3), the input layer variable X, which includes the influence factors of spatial distribution of innovation activity, will be connected to the hidden layer neurons, and the hidden layer neurons will be further connected to the output layer. The layers are fully connected, which means that all of the neurons in the previous layer should connect to all neurons in the next layer. The connection between two neurons includes a linear decision boundary and an activation function.
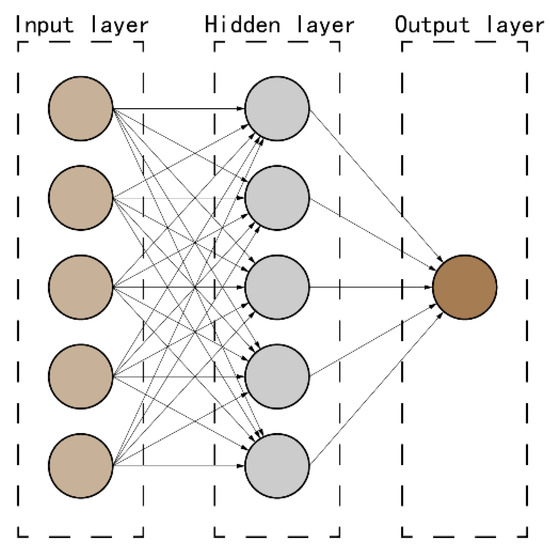
Figure 3.
Operate mechanism of multilayer perceptron (MLP).
Equation (2) is the linear decision boundary, and Equation (3) is the activation function. For the neurons in the first and second layers, represents a certain variable in the first layer and is its weight; is the bias parameter; and is the output of a neuron in the second layer and the input of the next stage. The algorithm achieves the goal by connecting multiple variables with linear and non-linear combinations. It can efficiently construct complex non-linear models [46]. Faced with the spatial non-stationary characteristics of innovation activities and their influence factors, MLP has strong applicability. Boosting is used to iteratively train many weak learners (like MLP) with a training set to integrate them into a strong model and improve model accuracy.
(2) Component learner 2: XGBoost
XGBoost is an ensemble algorithm which takes CART tree as a weak estimator. The CART tree is a binary decision tree and works for both classification and regression problems [47]. In a single binary tree, each sample can always be assigned to a branch in each node, and finally reaches a leaf node to complete the regression. XGBoost obtains the result by adding the value of each leaf node. Like the gradient boosting tree, XGBoost adds a regression tree in every round of iteration process to improve the model fitness:
where is the estimated number of patents in the Kth round, and represents the decision tree added in the Kth round. K is a hyperparameter, which is the maximum number of iterations in the algorithm, to control the termination of the algorithm [48].
4.4.3. Accuracy Detection Methods of Models
To evaluate models, we calculated the Mean Square Error (MSE) and R2 of models. MSE is the expectation of the square of difference between the estimated values and the true values. It gets smaller if the model becomes stronger. R2 is the coefficient of determination and it equals the square of the Pearson Correlation coefficient between the true values and estimated values of the dependent variable. The goodness of fit of model is better with an R2 closer to 1. Both are commonly used to evaluate models:
where represents the number of samples (the number of streets), represents the estimated number of patents of street , represents the true number of patents of street , and represents the average true number of patents.
5. Research Results
5.1. Correlation Analysis of Influence Factors and Innovation Activities
The natural segmentation method was used to classify the number of patents at the street level to obtain the basic pattern of the spatial distribution of innovation activities. The spatial correlation of the spatial distribution pattern of innovation activities was calculated by Moran Index, and it is 0.25. The index indicates that the spatial distribution of innovation activities has agglomeration characteristics and that innovation occurs in certain specific blocks (Figure 4). We can see that the location of innovation activities prefers certain spatial factors.
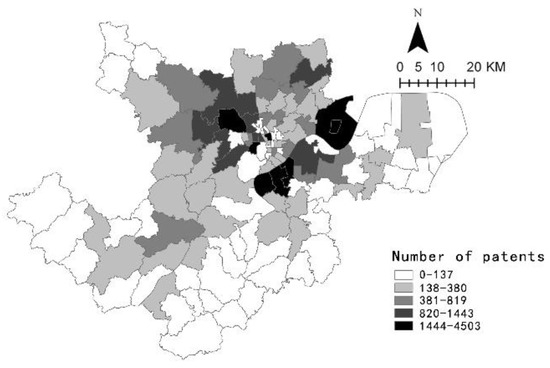
Figure 4.
Number of patents in the streets.
Section 3 identified 19 spatial factors that influence the spatial distribution of innovation activities from the perspective of the needs of the innovation subject based on the literature analysis. To clarify the effective influence of influence factors on innovation activities, Pearson Coefficient was used to analyze the correlation between each influence factor and innovation activity. According to the value of |r|, correlation relationship was divided into “very weak” (0 < |r| ≤ 0.2), “weak” (0.2 < |r| ≤ 0.4), “moderate” (0.4 < |r| ≤ 0.6), “strong” (0.6 < |r| ≤ 0.8), and “very strong” (0.8 < |r| ≤ 1). Fourteen influence factors were selected to construct the interpretation model, whose correlation coefficient with innovation activities was higher than 0.4 (moderate, strong, and very strong) (Table 2). They can be classified into three categories and seven sub-categories according to Section 3. Five factors: scientific research institution density, airport accessibility, mountain accessibility, water accessibility, and cultural heritage buffer zone accessibility, which were excluded due to a low Pearson Coefficient with the spatial distribution of innovation activities. Scientific research institutions are important knowledge production institutions, but they have not played a corresponding role in driving innovation in the process of innovation patent output. The impact of airport accessibility, mountain accessibility, water accessibility, and cultural heritage buffer zone accessibility on the spatial distribution pattern of innovation activities may work effectively on a larger spatial scale rather than the street scale.

Table 2.
Correlation between the factors and the spatial distribution of innovation activities.
Multiple linear regression is an important statistical analysis method to analyze the correlation between variables. Multiple linear regression analysis was performed two times as reference experiments—19 influence factors as the independent variable and the number of patents as the dependent variable, and 14 influence factors as the independent variable and the number of patents as the dependent variable. The R2 values of multiple linear regressions were 0.74 and 0.73. The goodness of fit of the multiple model did not decrease significantly after the factors with weak correlation with innovation activities were removed. This proves again that the factors removed have little contribution to the model. In addition, 14% of the estimated values in the linear regression are negative, which conflicts with fact. In short, the R2 of multiple linear regression is not very good and estimated values of the model show negative results. These reflect insufficiency of the linear regression model and there is a claim for more a elaborate explanatory model. Reference experiments indicate that the multiple linear regression model can only explain the influence trend of the factors on innovation activities, and is not applicable for accurate prediction and judgment of innovation activities. We can see that the relationship between the independent variables and the dependent variable is more complex, and it cannot be explained by a simple linear model. A more elaborate explanatory model is needed.
5.2. Interpretation Model and Operation Results Based on Boosting
Taking 14 influence factors as independent variables and the number of patents representing innovation activities as dependent variables, the data set has 121 samples (the number of streets). In general, MLP is sensitive to data. First, the data need to be Z-score normalized. Fourteen factors are listed as feature vectors, and their characteristic data are clarified in Section 4. We generated eigenvalues of each factor through Z-score, and there were 14 eigenvalues that were used as input for the models. The accuracy of the MLP can be improved without losing data structure information, and the CART tree cannot be affected. The processed data can be applied to both models simultaneously. Second, the data set was split into training set and testing set; 80% of the samples were randomly selected as training samples to construct the model, and remaining 20% of the samples were testing samples to test the accuracy and generalization of the model.
Then, the training samples were put into MLP-Boost and XGBoost to construct the interpretation model. For the MLP-Boost, after repeat adjustments to the number iterations, it was found that when the number of iterations exceeds 10, the model accuracy no longer increases significantly and the algorithm does not suffer from local convergence, so the number limit of iterations of the model was set to 10. For XGBoost, to ensure the accuracy of the model and its generalization ability, the number of iterations was set to 30. The trained model and the estimated values were derived. The estimated values were compared with the real values, and the calculation results are shown in Table 3. Compared with the reference experience model (linear regression), the R2 of the two models was significantly improved. The R2 of linear regression was only 0.73, while the R2 of XGBoost was 0.999 and the MSE was only 44.31, which shows a very remarkable goodness of fit. The R2 of MLP-Boost also reached 0.996. The results also prove that the linear model has limitation for the selected problem-solving, and the ensemble algorithm is more suitable for analyzing the factors influencing the spatial distribution of innovation activities.

Table 3.
R2 and mean square error (MSE) of models.
After the construction of the model, the testing samples were put into MLP-Boost and XGBoost to calculate the R2 and MSE. The performance of both models on the testing set was weaker than the training set, but both achieved excellent goodness of fit. This indicates that the model shows strong explanatory ability. The goodness of fit of XGBoost (0.933) was better than that of MLP-Boost (0.919), and the MSE of MLP-Boost was significantly lower than that of XGBoost, which shows that XGBoost is more accurate and MLP-Boost is more stable with strong generalization and prediction ability. Therefore, the two Boosting models have their own advantages in the performance of the training set and the testing set. Their integration can help improve the goodness of fit and generalization ability of the model. The combination of model results used in this study was:
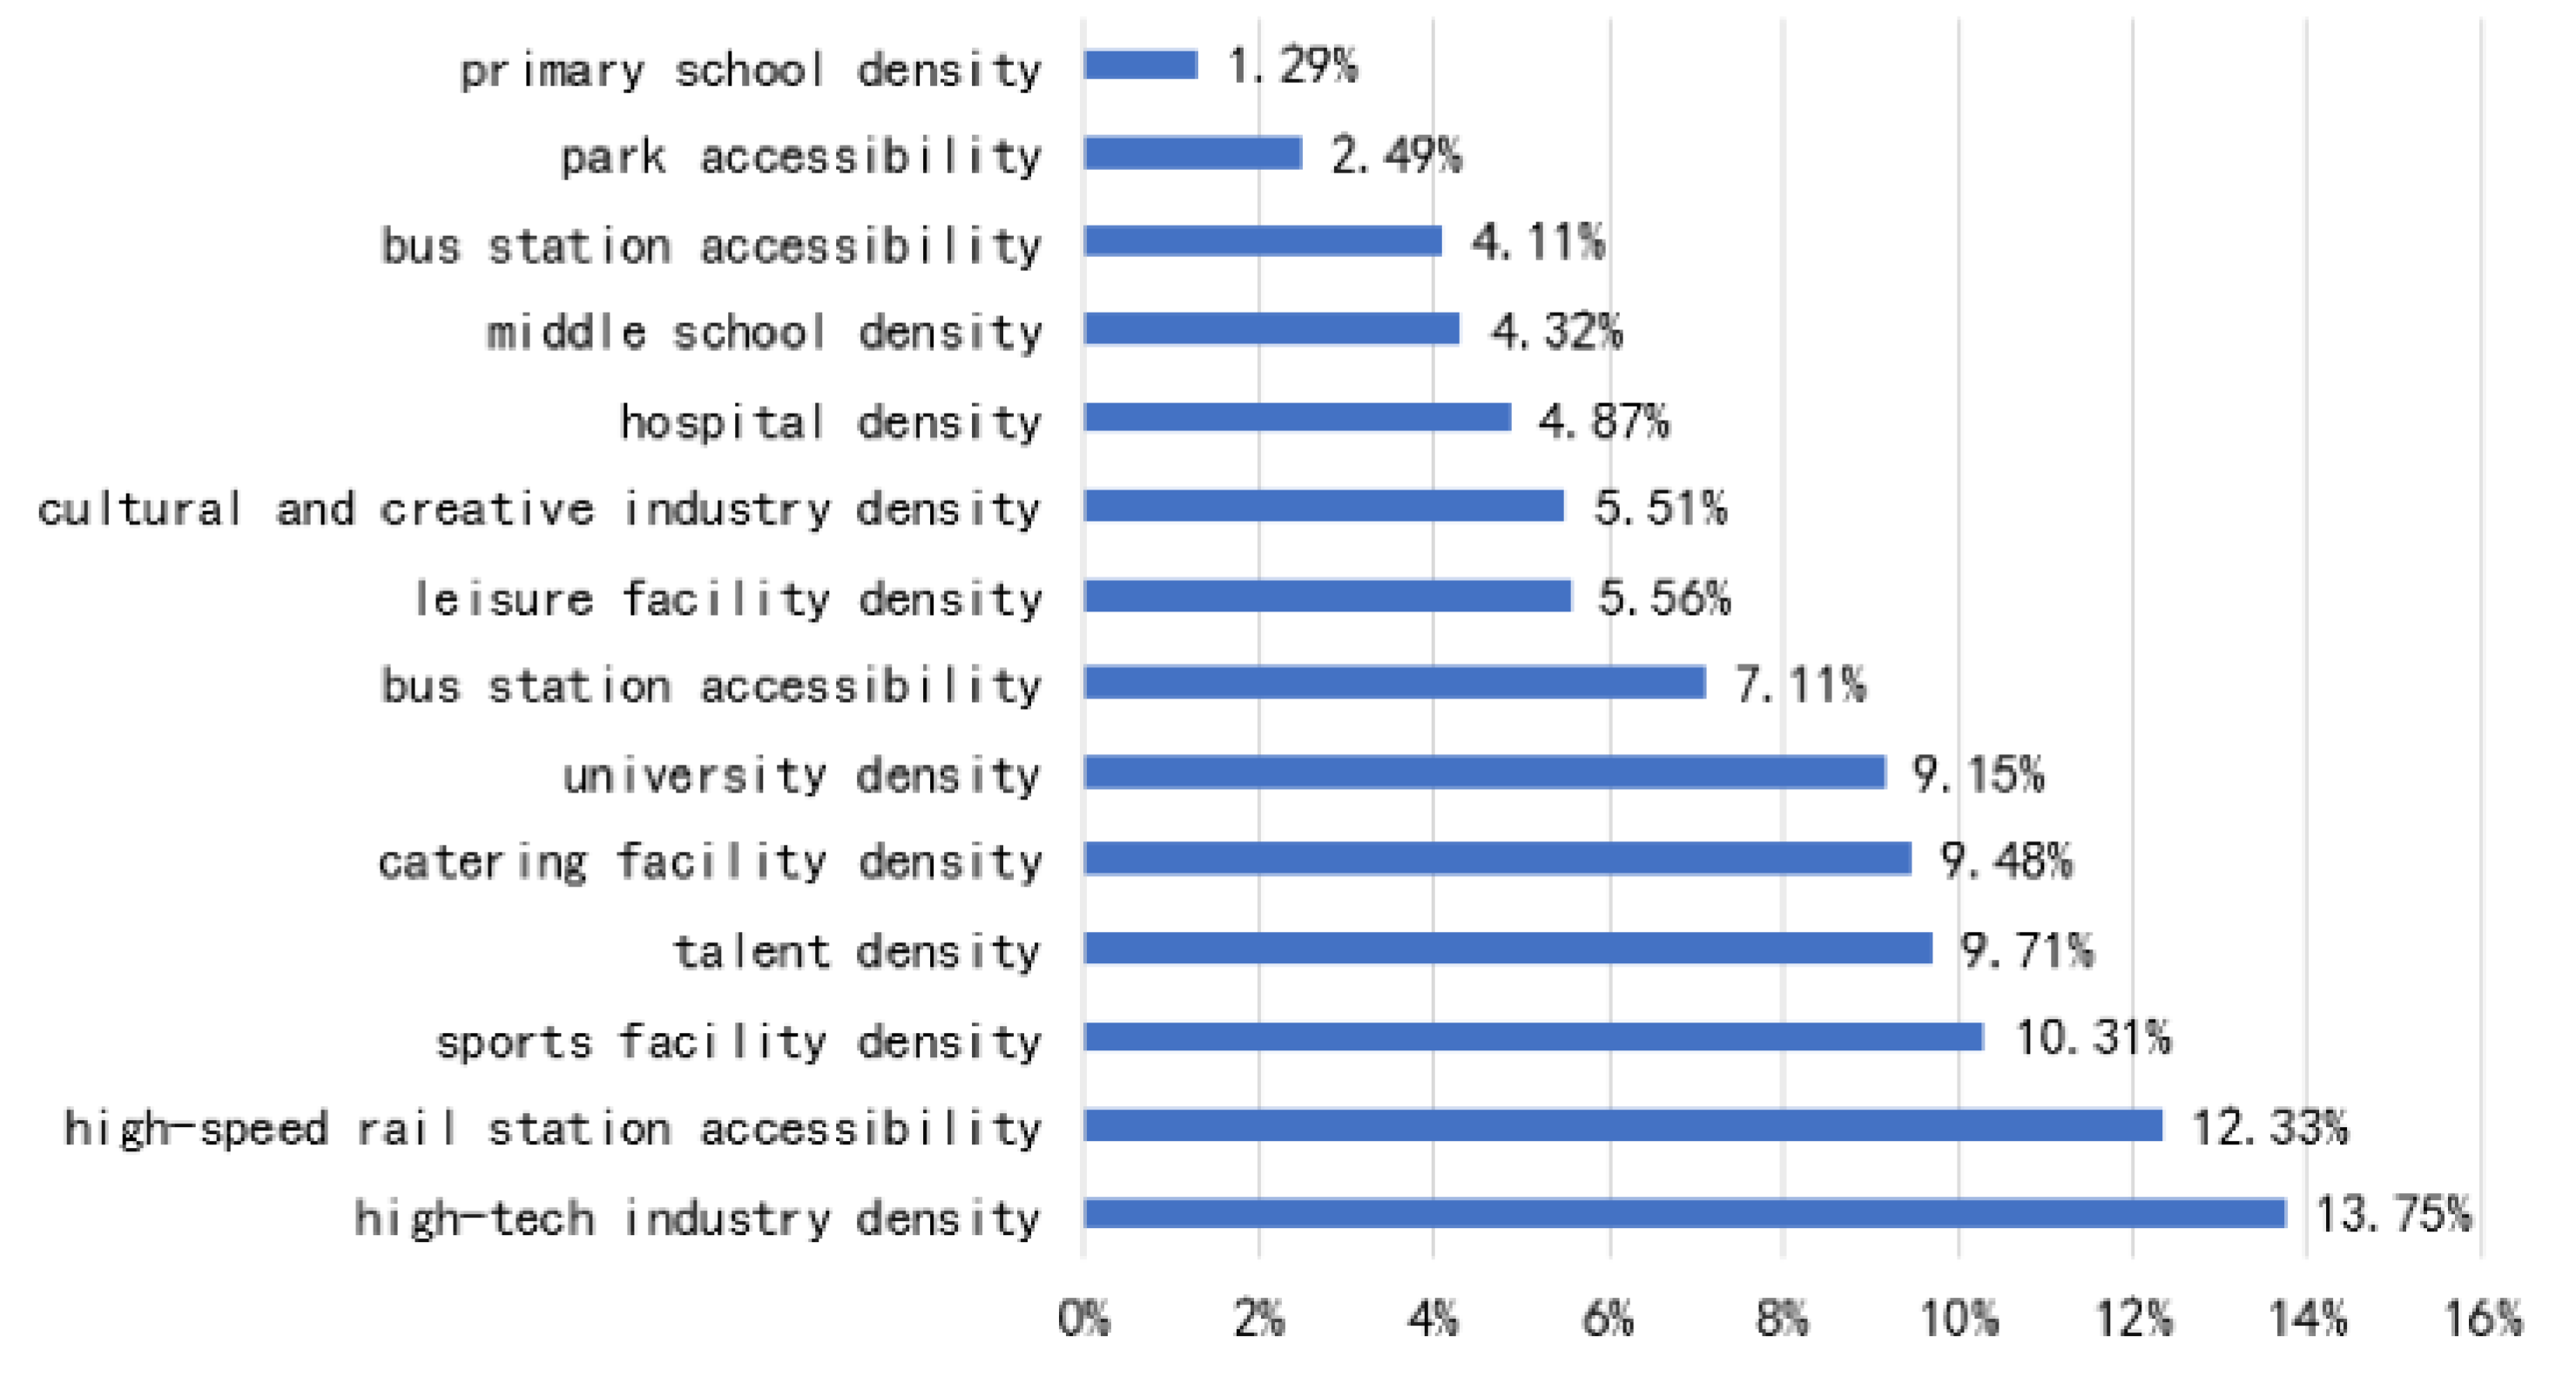
The training set and the testing set were input into the combined model and the R2 and MSE were calculated. The R2 of the combined model was 0.999 with the training set, which was better than MLP-Boost and almost the same as XGBoost. The R2 of the combined model was 0.995 with the testing set and the MSE was smaller, which was better than both models. At the same time, the final combined model also performed better in terms of the fit of the overall sample, and its estimated value was closer to the true value. The combined model had stronger interpretation and prediction abilities. Therefore, the combined model was used as the final interpretation model. The training samples were calculated and analyzed to obtain the contribution rate of each factor to the spatial distribution of innovation activities (Figure 5). From highest to lowest, they were high-tech industry density (13.75%), high-speed rail station accessibility (12.33%), sports facility density (10.31%), talent density (9.71%), catering facility density (9.48%), university density (9.15%), subway accessibility (7.11%), leisure facility density (5.56%), cultural and creative industry density (5.5%), hospital density (4.87%), middle school density (4.32%), bus station accessibility (4.11%), park accessibility (2.49%), and primary school density (1.29%).
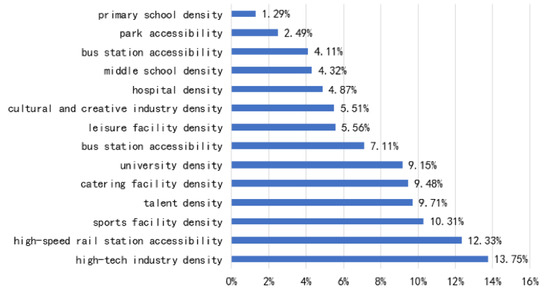
Figure 5.
The contribution rate of each factor to the spatial distribution of innovation activities.
5.3. Analysis of the Influence Factors on Spatial Distribution of Innovation Activities
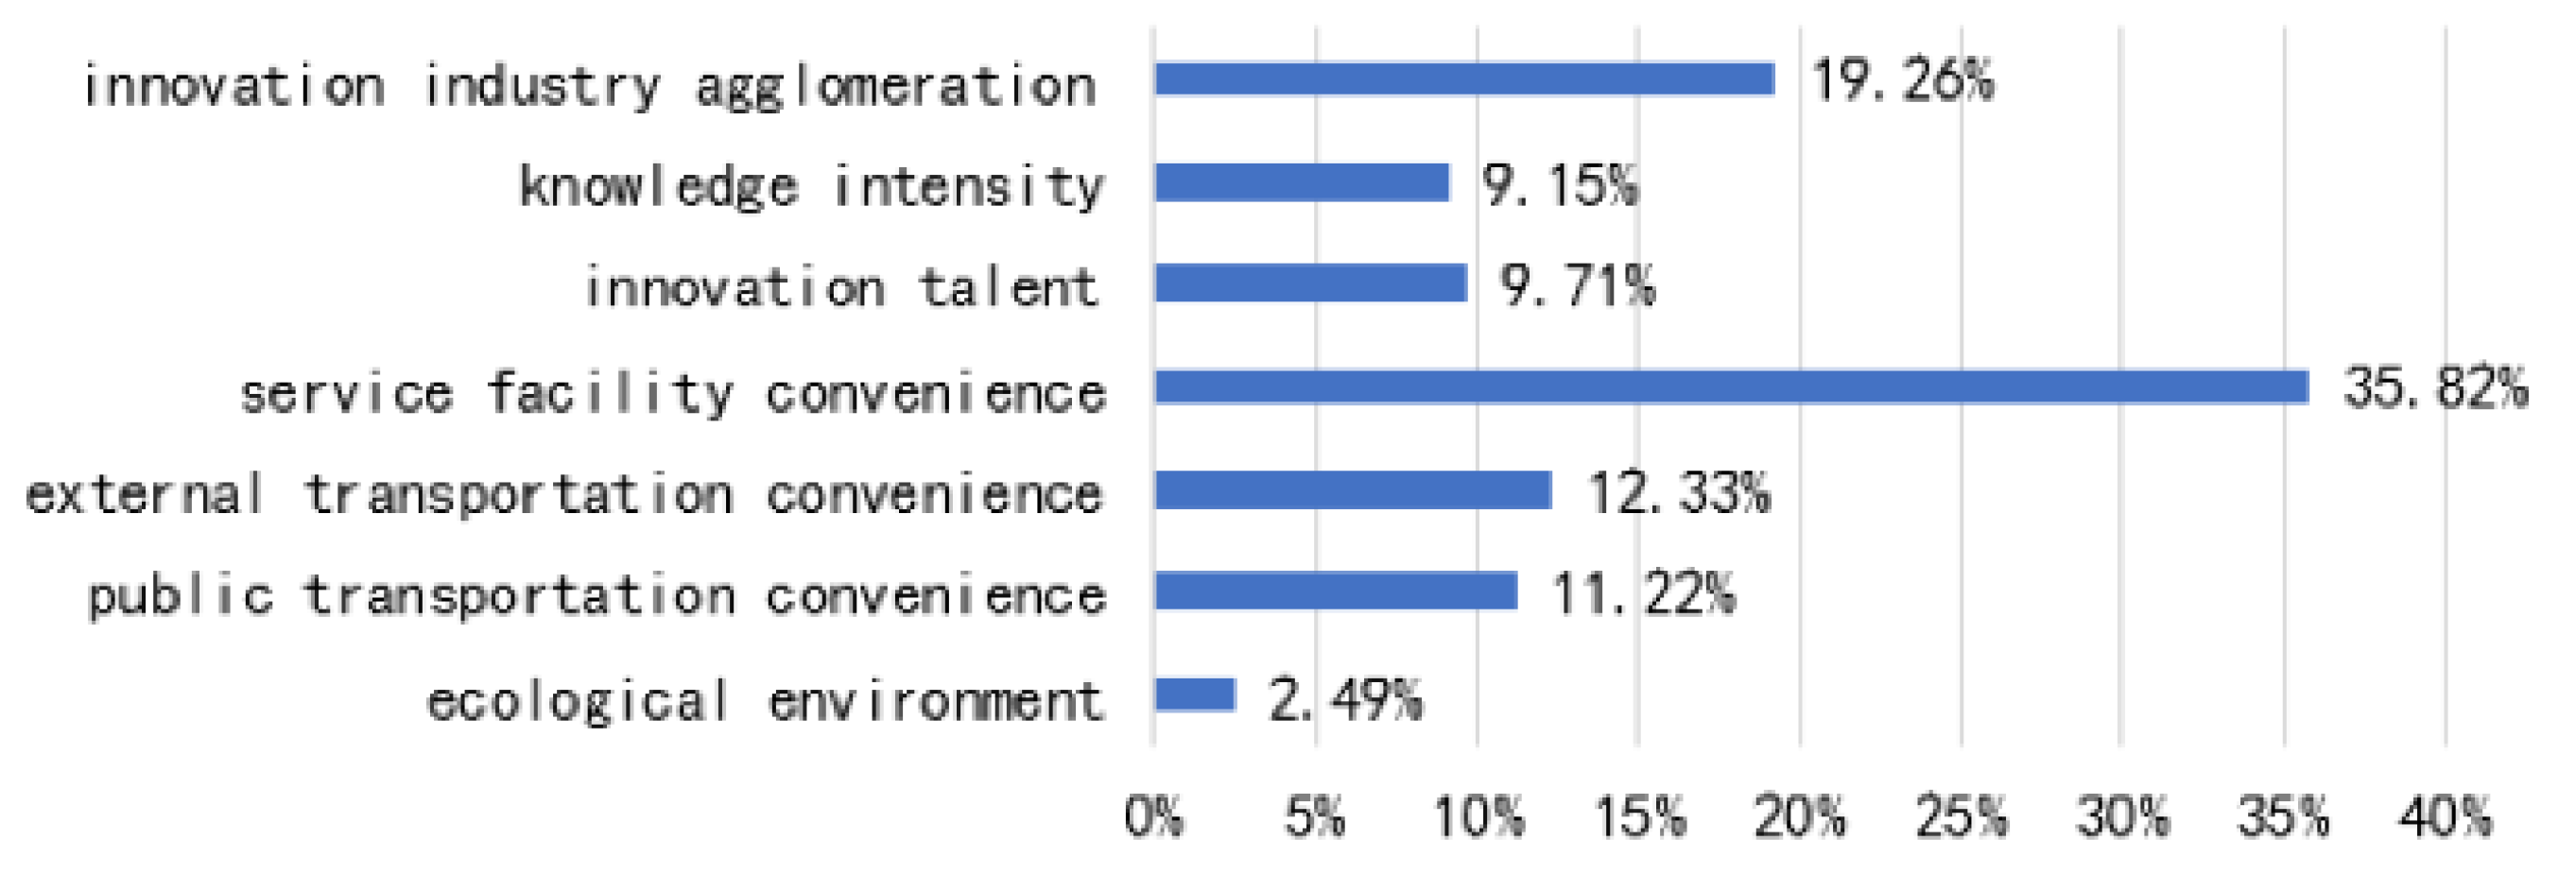
The operation of innovation activities is a complex system, so that its spatial distribution does not simply follow a linear pattern, but alternatively a result of the interaction and feedback between the various spatial influence factors. The 14 factors can be summarized in three categories and seven sub-categories, as before (Figure 6). We interpreted the factors and their influences according to this classification.
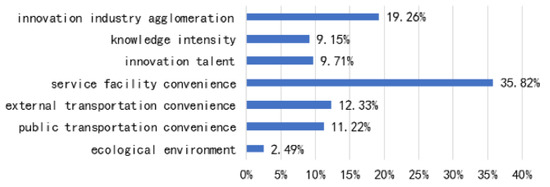
Figure 6.
The contribution rate of sub-categories to the spatial distribution of innovation activities.
5.3.1. Innovation Driving Force
(1) Innovation industry density
The spatial distribution of innovative industries such as high-tech industries and cultural creative industries has agglomeration characteristics (Figure 7). Agglomeration effects can enhance cooperation and interaction between enterprises, accelerate innovation diffusion, reduce the cost of knowledge acquisition, and further strengthen the knowledge spillover effect. High-tech industries distribute along major roads and extend east–west. Industrial parks such as Xiasha Economic Park, Future Sci-Tech Park, National High-tech Zone (Binjiang District), and West Lake Sci-Tech Park have become the core of the cluster. The cultural and creative industries are mainly distributed in urban central areas (Gongshu District), presenting a circle-like distribution. At the same time, they form an agglomeration core in Xiasha Economic Park, National High-tech Zone (Binjiang District), and China Academy of Art University Science Park.

Figure 7.
Spatial distribution of Innovation driving factors.
(2) Knowledge intensity
The endogenous growth theory regards universities as important sources of knowledge creation and spillover. Because of the geographical proximity, innovative subjects such as enterprises around the university have more opportunities to absorb new knowledge with lower cost through the knowledge spillover effect. Universities in Hangzhou are mainly concentrated in Xihu District, which is a central area with a long history and profound culture, and Xiasha University Town. Besides, the future science and technology city block, Liuxia Street and Zhuantang Street in Xihu District, and Binjiang District also have rich science and education resources.
5.3.2. Innovation Resource
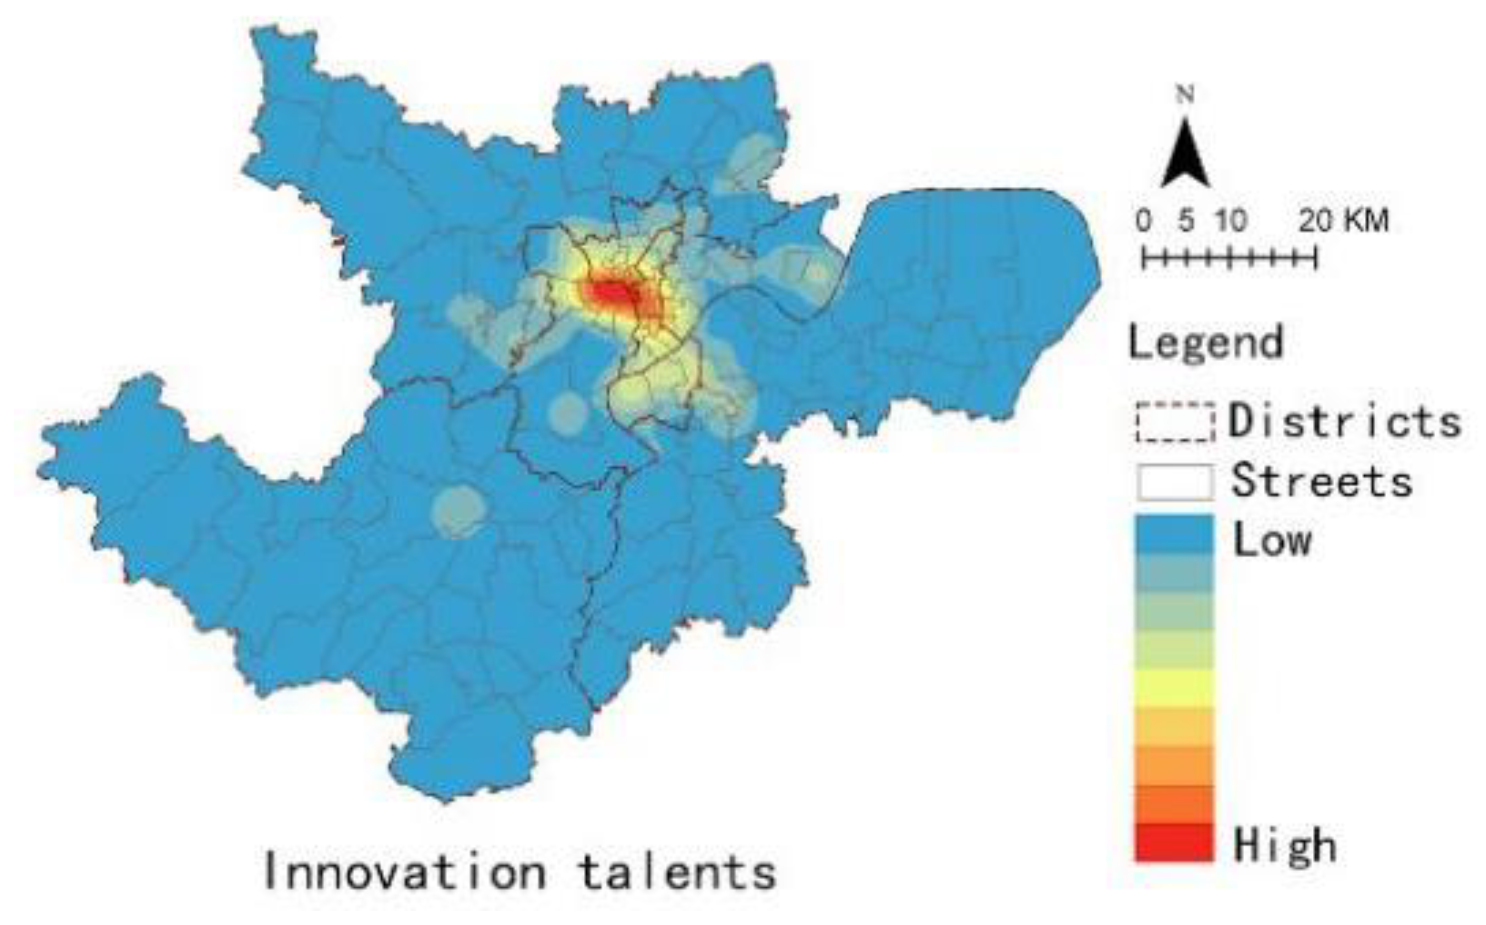
Innovation talents are the basic and most important resource for the development of innovative activities. At the end of 2016, the scale of Hangzhou’s innovative talents was 813,500, accounting for 12.72% of the total population. Xihu District has the largest group of innovative talents, about 217,700 in total. Furthermore, the talents in Binjiang District was 125,500, accounting for 38.12% of the population, which is the highest proportion. Innovative talents have downtown preference in their distribution, following a circle-like distribution. The scale of talents in the city periphery is relatively small (Figure 8).
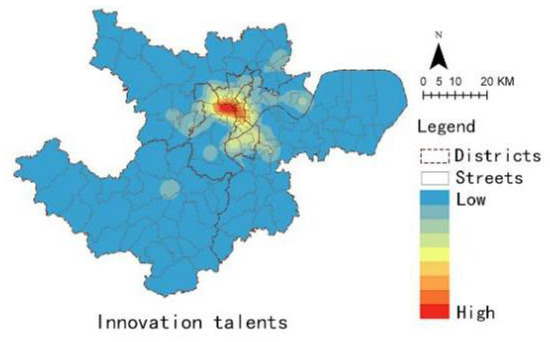
Figure 8.
Spatial distribution of talents.
5.3.3. Innovation Environment
(1) Distribution of Service Facilities
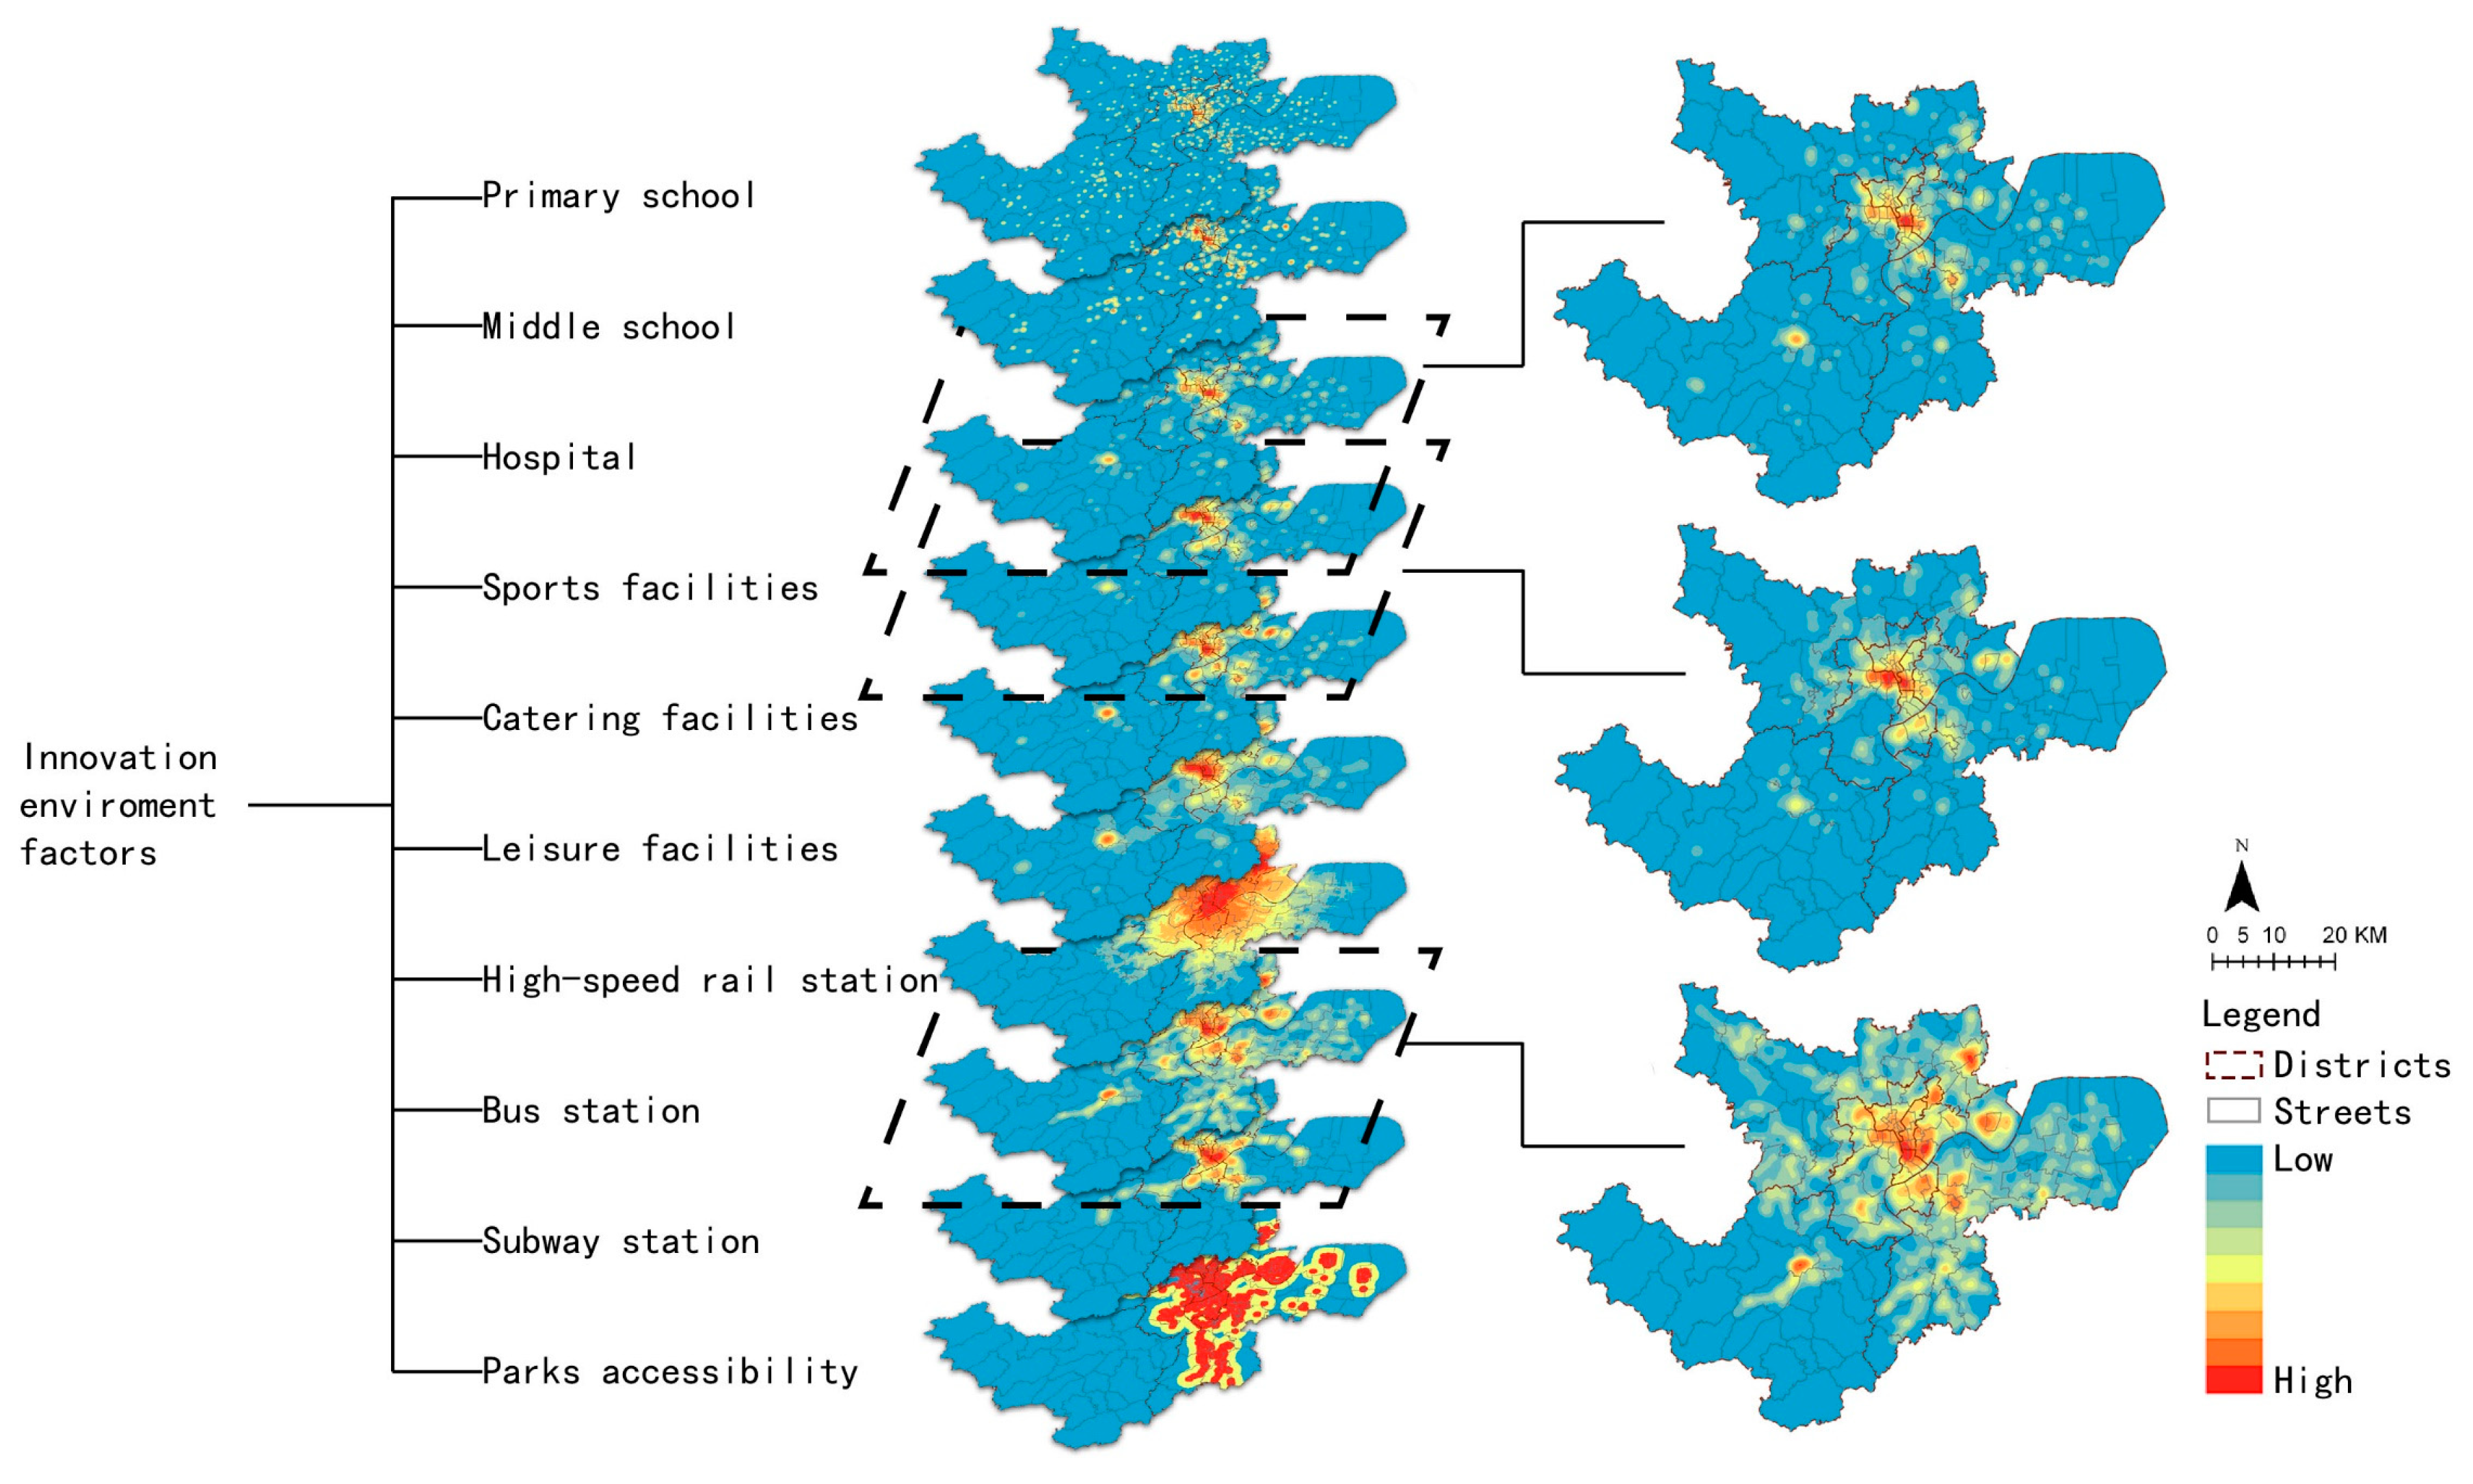
Service facilities are the most important factors with the highest contribution proportion (35.82%) on the spatial distribution of innovation activities. Hospitals and schools have similar spatial distribution characteristics, mainly concentrating in downtown (Figure 9). These two types of facilities are not unique factors that merely affect the spatial distribution of innovation activities, but global factors that can affect multiple aspects of the city, so that their contribution to the spatial distribution of innovation activities is limited. Sports facilities, catering facilities, and leisure facilities disperse over an extensive area with localized concentrations. Unlike hospitals and schools, they do not overly concentrate in the downtown area, but evenly distribute in the built-up area with evident agglomeration. Each district, and even the streets, have relatively independent service facility centers. The contribution of sports facilities on the spatial distribution of innovative activities is greater than catering facilities and leisure facilities, indicating that talents pay more attention to a healthy and vibrant lifestyle in daily life.
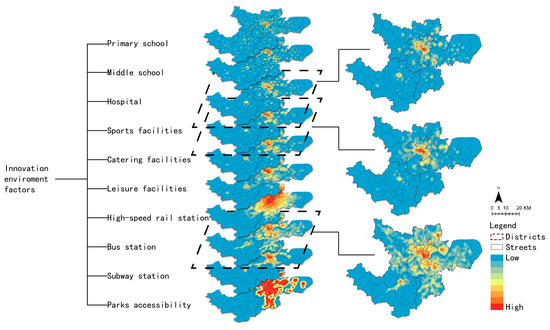
Figure 9.
Spatial distribution of Innovation environment factors.
(2) External transportation
As an important mode of external transportation tool of the city, the high-speed rail contributes 12.33% to the impact on innovative activities. The advantages of convenience, safety, and efficiency make the high-speed rail a main transportation of information and talents flowing between cities. Compared with general transportation methods, it has more stations and lines (each city is served by at least one high-speed rail station), which can help the flow of innovative knowledge spread more effectively. High-speed rail stations are generally built in suburban areas and are convenient for people in Shangcheng District, Xiacheng District, Jianggan District, and Yuhang District to access.
(3) Public transportation
Public transportation, including buses and subways, is the main commuting way for innovative talents in cities, and plays an important role in the development of innovative industries. Subway stations are densely located in the center of the city and extend to suburban areas, such as Future Sci-Tech Park, Linping Group, and Liangzhu Group, forming a radial structure. Bus stations cover a wider area, with a large density and even distribution, and form a mature network structure. Due to shorter commute times and higher on-time punctuality, subways have become an efficient, green transportation method preferred by innovation talents.
(4) Ecological environment
Innovation subjects show the demand and longing for the natural environment and a superior ecological environment. High-level recreation has become a universal way to relieve stress. The parks in Hangzhou are mostly concentrated in Xixi Wetland, West Lake Scenic Area, and the areas along the Qiantang River.
6. Conclusions and Limitation
6.1. Conclusions
In terms of the driving force for innovation, innovation development regards the high-tech industry as a pillar. Location plays an important role in technological innovation activities. In areas where economic activity is concentrated, geographical proximity of enterprises not only facilitates face-to-face communication, but also facilitates forward-to-back market contacts among enterprises, and is more conducive to the further concentration of labor and knowledge spillovers. In general, the geographical proximity caused by the spatial concentration of innovation industries not only reduces the inherent uncertainty of innovation activities, but also increases the possibility of corporation between enterprises. It helps innovation subjects to be aware of the value of heterogeneous knowledge, especially reducing the cost of scientific development and commercialization of innovation results, which in turn promotes the growth of innovation output. At the same time, as an important knowledge producer, the surrounding blocks of universities have created favorable conditions for R&D cooperation in production, teaching, and research. Although information technology makes knowledge transfer no longer solely dependent on geography, the choice of location for innovative activities is still constrained by geographic space. Agglomeration makes contribution to the inflow and outflow of knowledge. Geographical proximity can increase the frequency of knowledge interaction and can accelerate the production and diffusion of innovation. Therefore, driven by innovation, knowledge-intensive areas and clusters of innovation industries are the preferred locations for innovative activities.
In terms of innovation resource, the innovation economy is a new type of economy that is primarily supported by intellectual resources, that is, talents, which promotes the coordinated and sustainable development of humans and nature. Under the goal of sustainable development, today’s urban competition has become a competition for innovation talents. As knowledge holders, innovative talents have become the intellectual subjects that promote the innovation and development of cities. Human creativity is an inexhaustible source of innovation and development, and it is the main way for the flow and diffusion of innovative knowledge. Therefore, in the process of urban innovation and development, attention should be paid to the use of space for the gathering of innovative talents. The mixed use of land for work and life is conducive to the balance of work and residence. Reducing the commuting time of innovative talents can improve the quality of life and working efficiency of talents. At the same time, it can also reduce labor costs for enterprises.
In terms of innovation environment, in the era of the knowledge economy, society has shifted from an industrial society with economic growth as its core to a post-industrial society with innovation as its core. The development of innovative activities also requires corresponding changes in the city’s service functions. Traditional industrial society requires cities to provide basic services that meet the needs of individual life and production. In the era of the knowledge economy, urban functions need to shift their focus to providing higher-level living services and professional and technical services for innovation subjects. The needs of innovation subjects are not all material needs, but more spiritual needs. With the transformation of urban service functions, the setting of urban public service facilities should also change. The city should provide humanized information service facilities and places to meet people’s psychological and cultural needs. The physical functions of traditional cities are divided into four major functions: residence, work, recreation, and transportation. Through the analysis of factors, it will be found that this mechanical classification is no longer suitable for the era of knowledge economy. In the new era, city functions need to be integrated based on the needs of the innovation subjects. The development of urban innovation should fully consider the needs of innovative talents and provide corresponding humanized, personalized, and comprehensive support facilities to increase the attractiveness to talents. This makes a city a highland of talents to promote the creation of innovative activities.
The ensemble learning algorithm is an important research path and calculation method in this research. The interpretation model constructed by the ensemble algorithm has significantly better accuracy and prediction ability than a single model. This algorithm can be used to help analyze complex problems and is widely applied in medical, computer, and other disciplines. The location selection of urban innovation activities is a complex process and is the result of the comprehensive action of multiple factors. Simple linear relationship models cannot accurately explain the underlying mechanism, and more precise interpretation models are needed. Based on real data, ensemble learning accurately explores the contribution of each factor to the spatial distribution of innovation activities. The model fits the non-linear and complex relationship between the factors and the spatial distribution pattern of innovation activities, supporting the planning and construction of innovation space. The model constructed by the ensemble learning algorithm has better goodness of fit than general regression models and has remarkable prediction ability, which was verified in this study. We applied the ensemble learning algorithm to the field of urban planning. On the one hand, it had practical significance for the exploration of Hangzhou’s urban innovation development law and the planning of innovative activity space. On the other hand, we proposed a new path for the research on space planning of innovation activities, which has important reference significance for the research of sustainable innovation development in other cities.
6.2. Limitations
The traditional research on the spatial distribution of innovation activities paid more attention to the macroscale. This study fills the gap in research on influence factors on spatial distribution of innovation activities selected based on the needs of the innovation subjects. The ensemble learning algorithm was used to conduct models to explain the impact mechanism from a more micro-scale unit (street scale) in the city. This is an innovation of this research to introduce ensemble algorithms into urban governance. However, the analysis of the spatial distribution of innovation activities within cities was dependent on the spatial scale. The model may present different estimation accuracies under different spatial scales. In addition, some factors were restricted by data acquisition and were not included in the analysis framework (such as the policy environment). In the future, more comprehensive research can be carried out based on data from more sources. At the same time, the influence factors of this study were selected based on the investigation of Hangzhou’s innovation subjects. Because of the differences in the socio-economic development of cities, the contribution proportion of influence factors on the spatial distribution of innovation activities in different cities may be different.
Author Contributions
J.W. revised and approved the manuscript; N.L. collected and cleaned all of the data, and finished the calculation and analyzed the results; Y.R. conceived the research and methodology. N.L. is responsible for future questions from readers as the corresponding author. All authors read and agreed to the published version of the manuscript.
Funding
This research was supported by the National Nature Science Foundation Project (51238011).
Acknowledgments
The authors are grateful for the support of the National Nature Science Foundation. The contents of this paper are solely the responsibility of the authors and do not represent the official views of the institutes and funding agencies.
Conflicts of Interest
The authors declare no conflict of interest.
References
- Feldman, M.P.; Audretsch, D.B. Innovation in cities: Science-based diversity, specialization and localized competition. Eur. Econ. Rev. 1999, 43, 409–429. [Google Scholar] [CrossRef]
- Ciccone, A. Agglomeration effects in Europe. Eur. Econ. Rev. 2002, 46, 213–227. [Google Scholar] [CrossRef]
- Packalen, M.; Bhattacharya, J. Cities and ideas. Natl. Bur. Econ. Res. 2015. [Google Scholar] [CrossRef]
- Florida, R.; Adler, P.; Mellander, C. The city as innovation machine. Reg. Stud. 2016, 51, 86–96. [Google Scholar] [CrossRef]
- Liu, N.N.; Wang, J.W.; Song, Y. Organization mechanisms and spatial characteristics of urban collaborative innovation networks: A case study in Hangzhou, China. Sustainability 2019, 11, 5988. [Google Scholar] [CrossRef]
- Schumpeter, J.A. The Theory of Economic Development, 16th ed.; Transaction Publishers: Piscataway, NJ, USA, 2012; pp. 72–87. [Google Scholar]
- He, S.H.; Du, D.B.; Jiao, M.Q.; Lin, Y. Spatial-temporal characteristics of urban innovation capability and impact factors analysis in China. Sci. Geogr. Sin. 2017, 37, 1014–1022. [Google Scholar]
- Du, Z.W.; Lv, L.C.; Huang, R. Spatial pattern of in-dustrial innovation efficiency for Chinese cities at prefecture level and above. Sci. Geogr. Sin. 2016, 36, 321–327. [Google Scholar]
- Duan, D.Z.; Du, D.B.; Liu, C.L. Spatio-temporal evolution of urban innovation structure based on zip code geodatabase: An empirical study from Shanghai and Beijing. J. Geogr. Sci. 2016, 26, 1707–1724. [Google Scholar] [CrossRef]
- Wang, R.F.; Weng, Y.C.; Zhou, Z.G.; Chen, L.Y.; Hao, H.X.; Wang, J. Multi-objective ensemble deep learning using electronic health records to predict outcomes after lung cancer radiotherapy. Phys. Med. Biol. 2019, 64, 245005. [Google Scholar] [CrossRef]
- Kadir, S.; Selami, B.; Muhammet, F.A. An ensemble learning estimation of the effect of magnetic coupling on switching frequency value in wireless power transfer system for electric vehicles. Sn Appl. Sci. 2019, 1, 1712. [Google Scholar]
- Morpurgo, R.; Mussi, S. An intelligent diagnostic support system. Expert Syst. 2001, 18, 43–58. [Google Scholar] [CrossRef]
- Feldman, M.P.; Florida, R. The geographic sources of innovation: Technological infrastructure and product innovation in the United States. Ann. Assoc. Am. Geogr. 1994, 84, 210–229. [Google Scholar] [CrossRef]
- Lim, U. The spatial distribution of innovative activity in US metropolitan areas: Evidence from patent data. J. Reg. Anal. Policy 2003, 33, 97–98. [Google Scholar]
- Xu, H.Y.; Hsu, W.L.; Lu, X.Y. Research on spatial characteristics and mechanisms of regional innovation capacity in Jiangsu Province, China. IEEE Int. Conf. Adv. Manuf. 2018, 81–84. [Google Scholar] [CrossRef]
- Méndez, R.; Moral, S.S. Spanish cities in the knowledge economy: Theoretical debates and empirical evidence. Eur. Urban Reg. Stud. 2011, 18, 136–155. [Google Scholar] [CrossRef]
- Halbert, L. Collaborative and collective: Reflexive co-ordination and the dynamics of open innovation in the digital industry clusters of the Paris region. Urban Stud. 2012, 49, 2357–2376. [Google Scholar] [CrossRef]
- Florida, R. The Rise of the Creative Class-Revisited: Revised and Expanded; Basic Books: New York, NY, USA, 2014. [Google Scholar]
- Teirlinck, P.; Spithoven, A. The spatial organization of innovation: Open innovation, external knowledge relations and urban Structure. Reg. Stud. 2008, 42, 689–704. [Google Scholar] [CrossRef]
- Ellison, G.; Glaeser, E.L. The geographic concentration of industry: Does natural advantage explain agglomeration? Am. Econ. Rev. 1999, 89, 311–316. [Google Scholar] [CrossRef]
- David, L.R. Technological relatedness and knowledge space: Entry and exit of US cities from patent classes. Reg. Stud. 2015, 49, 1922–1937. [Google Scholar]
- Acs, Z.J.; Anselin, L.; Varga, A. Patents and innovation counts as measures of regional production of new knowledge. Res. Policy 2002, 31, 1069–1085. [Google Scholar] [CrossRef]
- Jaffe, A.; Trajtenberg, M.; Henderson, R. Geographic localization of knowledge spillovers as evidenced by patent citations. Q. J. Econ. 1993, 108, 577–598. [Google Scholar] [CrossRef]
- Griliches, Z. Issues in assessing the contribution of research and development to productivity growth. Bell J. Econ. 1979, 10, 92–116. [Google Scholar] [CrossRef]
- Fischer, M.M.; Varga, A. Spatial knowledge spillovers and university research: Evidence from Austria. Ann. Reg. Sci. 2003, 37, 303–322. [Google Scholar] [CrossRef]
- Dietterich, T.G. Ensemble methods in machine learning. In Proceedings of the 1st International Workshop on Multiple Classifier Systems (MCS), Cagliari, Italy, 21–23 June 2000; pp. 1–15. [Google Scholar]
- Friedman, J.H. Greedy function approximation: A gradient boosting machine. Ann. Stat. 2001, 29, 1189–1232. [Google Scholar] [CrossRef]
- Breiman, L. Bagging predictors. Mach. Learn. 1996, 24, 123–140. [Google Scholar] [CrossRef]
- Schapire, R.E.; Freund, Y. Boosting: Foundations and Algorithms; MIT Press: Cambridge, MA, USA, 2012. [Google Scholar]
- Ancori, B. The economics of knowledge. Ind. Corp. Chang. 2000, 9, 255–287. [Google Scholar] [CrossRef]
- Boulding, K.E. The economics of knowledge in life and the knowledge of economics. Am. Econ. Rev. 1966, 56, 1–13. [Google Scholar]
- Wu, J.S. Knowledge Economics; Capital University of Economics and Trade Press: Beijing, China, 2007. [Google Scholar]
- Strange, W.; Hejazi, W.; Tang, J. The uncertain city: Competitive instability, skills, innovation and the strategy of agglomeration. J. Urban Econ. 2006, 59, 331–351. [Google Scholar] [CrossRef]
- Sun, Y.K.; Li, G.P.; Yuan, W.W.; Sun, T.S. The spatial concentration of innovation and its mechanisms: A literature review and prospect. Hum. Geogr. 2017, 32, 17–24. [Google Scholar]
- Berliant, M.; Reed, R.R.; Wang, P. Knowledge exchange, matching, and agglomeration. J. Urban Econ. 2006, 60, 69–95. [Google Scholar] [CrossRef]
- Koskinen, K.U.; Vanharanta, H. The role of tacit knowledge in innovation process of small technology companies. Int. J. Prod. Econ. 2002, 80, 57–64. [Google Scholar] [CrossRef]
- Audretsch, D.B.; Lehmann, E.E.; Warning, S. University spillovers and new firm location. Res. Policy 2005, 34, 1113–1122. [Google Scholar] [CrossRef]
- Swap, W.; Leonard, D.; Shield, M.; Abram, L. Using mentoring and storytelling to transfer knowledge in the workplace. J. Manag. Inf. Syst. 2011, 18, 95–114. [Google Scholar] [CrossRef]
- Wu, J.S. Research on the Factors affecting the location choice of high-tech industrial parks. Sci. Technol. Prog. Policy 2008, 3, 83–86. [Google Scholar]
- Almeida, P.; Kogut, B. Localization of knowledge and the mobility of engineers in regional networks. Manag. Sci. 1999, 45, 905–916. [Google Scholar] [CrossRef]
- Waldmann, P. On the use of the Pearson correlation coefficient for model evaluation in genome-wide prediction. Front. Genet. 2019, 10, 899. [Google Scholar] [CrossRef]
- Zhou, Z.H. Ensemble Methods: Foundations and Algorithms; Chapman & Hall/CRC: Boca Raton, FL, USA, 2012. [Google Scholar]
- Bartlett, P.; Freund, Y.; Lee, W.S.; Schapire, R.E. Boosting the margin: A new explanation for effectiveness of voting methods. Ann. Stat. 2002, 26, 1651–1686. [Google Scholar]
- Webb, G.I. MultiBoosting: A technique for combining boosting and wagging. Mach. Learn. 2000, 40, 159–196. [Google Scholar] [CrossRef]
- Kohonen, T. An introduction to neural computing. Neural Netw. 1988, 1, 3–16. [Google Scholar] [CrossRef]
- Gerstner, W.; Kistler, W. Spiking Neuron Models: Single Neurons, Populations, Plasticitu; Cambridge University Press: Cambridge, UK, 2002. [Google Scholar]
- Zhou, Z.H. Machine Learning; Qinghua University Press: Beijing, China, 2016. [Google Scholar]
- Chen, T.C.; Guestrin, C. XGBoost: A scalable tree boosting system. In Proceedings of the KDD’16: The 22nd ACM SIGKDD International Conference on Knowledge Discovery and Data Mining, San Francisco, CA, USA, 13–17 August 2016; pp. 785–794. [Google Scholar]
© 2020 by the authors. Licensee MDPI, Basel, Switzerland. This article is an open access article distributed under the terms and conditions of the Creative Commons Attribution (CC BY) license (http://creativecommons.org/licenses/by/4.0/).

