Abstract
Sustainable development is a long-term solution for urban development and a guideline for urban development. Only by better coordination around the population, resources, and environment can the city achieve sustained and steady development. In order to evaluate the efficiency of sustainable urban development under environmental constraints, this paper takes 13 prefecture-level cities in Jiangsu Province as an example. To address the infeasibility problem in the Malmquist-Luenberger (M-L) index, a modified M-L index analysis method based on the new directional distance function (DDF) is adopted. Combined with the consideration of desirable and undesirable outputs, a linear programming model for sustainable urban development evaluation is constructed to provide a scientific decision-making basis for sustainable development of the city. The results show that the growth of sustainable urban development efficiency is not only related to desirable outputs but also affected by undesirable outputs. Technical change is the main driver of most sustainable urban development efficiency growth. However, efficiency changes also affect the sustainable development potential of cities to a certain extent. Through the modified M-L index analysis, we analyze the characteristics of different regions of Jiangsu Province, the changes in efficiency and the impact of technological innovation on sustainable urban development, and give policy recommendations to promote sustainable urban development.
1. Introduction
Sustainable urban development refers to the long-term, stable and sustained economic growth and structural optimization of the city within a certain time and space, thus realizing urbanization and urban modernization. While meeting the needs of the current urban population for survival and development, we must also consider the needs of future urban population survival and development, maintain the corresponding potential reserves, and enable the city to maintain a balanced development [1,2,3,4]. Sustainable urban development includes sustainable development of population, economy, resources, environment, and society. It depends not only on the supporting conditions such as resources and environment, but also on the quality of urban human resources, the speed of economic growth, and the advantages and disadvantages of economic benefits. Generally, economists believe that economic growth driven solely by resource inputs is extensive and unsustainable. However, if we can comprehensively consider indicators such as population, economy, resources, environment, and society, we can call it sustainable economic development [5,6,7,8,9].
For a long time, when measuring the development of China’s cities, more considerations are given about the efficiency of energy consumption and resource utilization, and the relationship between energy consumption and urbanization, and economic growth [10,11,12,13,14]. For example, Shen et al. [10] analyzed a model depicting the trend of Chinese urbanization, and explored relationships between urbanization and the supply and demand of major energy and mineral resources and between the gross domestic product (GDP) and the urbanization of China. Zhang et al. [11] examined the causal relationship between energy consumption and economic growth in the regional and sectoral aspects by adopting provincial panel data in China from 1995 to 2008. As the scale of the economy continues to expand, the city’s demand for various resources and energy continues to rise. Improving the energy supply structure and improving energy efficiency are strategic choices for cities to achieve sustainable development. However, the sustainable development of cities also depends on the city’s ability to create and agglomerate capital, the number of urban labor, the degree of openness, urban infrastructure and so on [15,16].
The research on the sustainable development of the urban economy is deepening and perfecting [17,18,19,20,21,22]. The research objects, methods, and evaluation indicators are gradually transformed from individual cities, qualitative descriptions and single evaluation indicators into urban agglomerations, quantitative analysis, and comprehensive evaluation indicators [23,24,25,26,27]. For example, Yigitcanlar et al. [28] introduced a multiscalar urban sustainability approach by linking two sustainability assessment models to evaluate sustainability performances in micro- and mezzo-levels and generate multiscalar results for the macro-level. Shaker et al. [29] presented a quantitative and spatial assessment of 25 multi-metric indices across 36 European nations. Yang et al. [30] presented a comprehensive indicator system for regional sustainability assessment for co-evaluating the level of economic, social, and environmental subsystems. Yang et al. [31] put forward a linear dimensionless coordinate system of sustainable urban development to conduct a quantitative analysis in 287 cities in the eastern, central, and western regions in China. Tan et al. [32] proposed an integrated model of nonlinear principal component analysis and Gram Schmidt orthogonalization, and presented a novel regional sustainable development assessment method and framework from three perspectives for the society-economy-environment system of the Bohai Rim region.
Although there are many models and methods for assessing the sustainable development of the urban economy, the Malmquist-Luenberger index analysis method is also one of the important methods to measure the economic efficiency of the city. Most M-L index methods measure labor and capital investment as the input of the urban economy, and GDP as the output of the urban economy [33,34,35,36]. For example, Zhang [33] proposed a method for the evaluation of total factor productivity (TFP) based on the super-efficiency Data Envelopment Analysis (DEA) model and the Malmquist-Luenberger index, to analysis of the low-carbon TFP index of the Wan Jiang region and the northern Anhui region in Anhui Province in central China. However, the rapid economic development has brought about a series of ecological problems. With many problems of resource consumption and environmental damage, scholars have paid more and more attention to this problem. For example, Kumar [37] examined conventional and environmentally sensitive total factor productivity (TFP) in 41 developed and developing countries over the period of 1971 to 1992. Choi et al. [38] used the metafrontier Malmquist-Luenberger (MML) index to measure the environmentally sensitive productivity and analyze its decompositions on China’s regional productivity growth. Zhang et al. [39] proposed the metafrontier non-radial Malmquist CO2 emission performance index (MNMCPI) for measuring dynamic changes in total-factor CO2 emission performance over time.
The above literature still has the following shortcomings in the study of sustainable urban development efficiency: (1) The indicators for assessing the sustainable development of the urban economy are relatively simple, and should take into account indicators such as population, economy, resources, environment, and society; (2) Most of the undesirable outputs are limited to the emission of exhaust gas, ignoring the harm of other wastes to urban development; (3) In order to solve the infeasibility problem of the M-L index in calculating the directional distance of the cross-period, the modified M-L index method should be used for the calculation. Based on the existing research theories and methods of urban economic sustainable development, this paper takes 13 prefecture-level cities in Jiangsu Province as an example. The article uses the modified M-L index analysis method to study the regional economic comparison and its influencing factors on the sustainable development of urban economy around the coordinated development of urban population, resources, and environment, to provide a scientific decision-making basis for the long-term sustainable development of the city.
2. Materials and Methods
2.1. Data
The Jiangsu Province in China in our data consisted of 13 prefecture-level cities. The start year of 2009 and the end year of 2017 were chosen due to data integrity and availability. Taking Jiangsu Province as an example, this paper solves the M-L index and its decomposition of 13 prefecture-level cities in Jiangsu Province. We obtained data from these sources: the China Urban Statistical Yearbook (2010–2018) [40], the statistical yearbooks of 13 prefecture-level cities (2010–2018) [41,42,43,44,45,46,47,48,49,50,51,52], the Yangtze River Delta City Yearbook (2010–2014) [53], the Jiangsu Statistical Yearbook (2010, 2011, 2015, 2017, 2018) [54] and the Eco-Environment Bureau of Yangzhou, Taizhou, Lianyungang, Suqian and Huai’an [55,56,57,58,59] (The data mainly comes from the China Urban Statistical Yearbook and the 13 prefecture-level city statistical yearbooks. For the links of these yearbooks, see the references [40,41,42,43,44,45,46,47,48,49,50,51,52,53,54,55,56,57,58,59]). Very little missing data was estimated via the linear interpolation method.
This paper has selected China’s Jiangsu Province as the research object of sustainable urban development efficiency growth and sustainable urban development governance policies. Jiangsu is located on the eastern coast of China, with the Yellow Sea in the east, Shanghai and Zhejiang in the southeast, Anhui in the west, and Shandong in the north. It is one of the most developed provinces in China and has 13 prefecture-level cities. The location of Jiangsu Province is shown in Figure 1. The cities and their distribution in Jiangsu Province are shown in Figure 2. The 13 prefecture-level cities were aggregated into “South, Middle, and North” zones by historical factors. Therefore, its economic development also has the characteristics of obvious regional agglomeration and geographical development. It has formed a pattern of agglomeration in the three regions of the South Jiangsu (Nanjing, Suzhou, Wuxi, Changzhou, Zhenjiang), the Middle Jiangsu (Yangzhou, Taizhou, Nantong) and the North Jiangsu (Xuzhou, Lianyungang, Suqian, Huai’an, Yancheng).
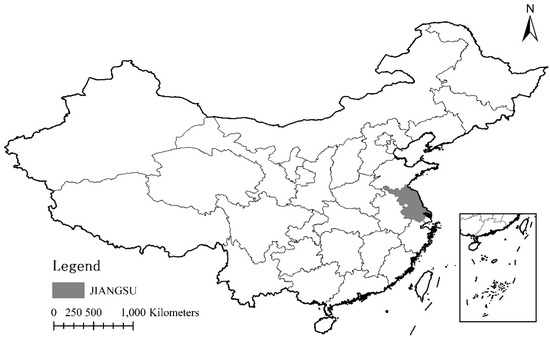
Figure 1.
The Location Map of Jiangsu Province in China.
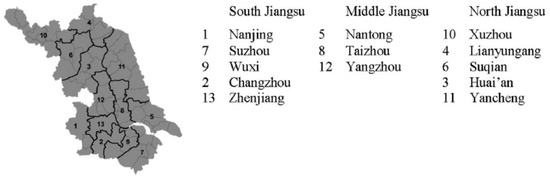
Figure 2.
Cities and their distribution in Jiangsu Province in China.
2.2. Methods
(1) Improved Directional Distance Function and Linear Programming Model
The Malmquist-Luenberger (M-L) index applies a directed distance function (DDF) to standard Malmquist production efficiency measurements to assess environmental productivity growth for undesirable output. However, when calculating the cross-period DDF, the M-L index has the same infeasibility problem as the Malmquist index does. In order to address this infeasibility problem, a modified M-L index analysis method based on the new DDF is selected to guarantee non-negative reference targets for all metrics. According to the directional distance function set by Du et al. [60], this paper changes the direction vector in the directional distance function and solves the infeasibility problem of the M-L index.
Suppose there are n decision making units (DMUs), each of which uses i kinds of inputs to obtain j kinds of desirable outputs and m kinds of undesirable outputs , and the direction vector is assumed to be g(t2) = (). Then the improved directional distance function at this time is:
where t1 = t, t2 = t + 1, t is time period; is the input element vector of the t2-th input; and are the t2-th desirable output vector and the undesirable output vector respectively; g(t2) is the direction vector, which refers to the direction in which the desirable output increases rather than the desirable output decreases; , ; refers to the distance between the actual input and output and its projection on the production frontier function; the greater the becomes, the lower the efficiency of the decision-making unit is desirable to be, the lower the efficiency of input and output, and the greater the potential for output expansion.
is defined as the set of production possibilities for the period t1, that is, the production frontier function, as shown in Equation (2). According to the setting of Du et al. [60], the undesirable output with weak disposition is included in the input-output efficiency evaluation, and the constraints on the undesirable output are appropriately relaxed.
Among them, is the intensity variable related to the scale return.
Through the above improved directional vector, combined with the DEA theory, the linear programming model for solving the direction distance function obtained by substituting Equation (2) into Equation (1) is [60]:
where t1 = t, t2 = t + 1. represents the input quantity of the i-th input element of the j-th decision-making unit in the t1-th period; represents the output quantity of the r-th desirable output item of the j-th decision-making unit in the t1-th period; represents the output quantity of the p-th undesirable output item of the j-th decision-making unit in the t1-th period.
(2) Modified Malmquist-Luenberger Index
In this paper, the modified Malmquist-Luenberger index analysis method is used to study urban economic development efficiency. Based on the above model, the M-L index for the t or t + 1 period is defined as [60]:
To avoid the arbitrariness of the reference technique [60], the M-L index can also be defined as the geometric mean of the two period indices, as shown below.
In 1994, Fare et al. decomposed the Malmquist productivity index into technical changes (TECH-ch) and technical efficiency changes (TE-ch) [61]. Similarly, the modified Malmquist-Luenberger index can also be decomposed into two components, characterizing efficiency change and technical change respectively.
where D represents the global directional distance function; P is the global set of production possibilities, which includes both desirable and undesirable outputs. M-L, EC, and TC are the input-output efficiency, efficiency change, and technical change of the decision-making unit at a certain time. If the M-L, EC, and TC indexes are greater than one, respectively, it means that the input-output efficiency is improved, the efficiency is improved, and the technology is improved. On the contrary, if the three values are less than one, the input-output efficiency is reduced, the efficiency is lowered, and the technology is backward. By analyzing the M-L index and its decomposition items, it is possible to observe the changing trend of economic development efficiency and the changes of influencing factors, so as to provide appropriate suggestions for the sustainable development of each city’s economy.
3. Analysis
China has achieved remarkable economic growth in the past decade. However, the economic boom comes at the expense of the environment to some extent. The constraints from the environment and resources pose a huge threat to a healthy and sustainable economic development in China. Therefore, this study focuses on environmental constraints when assessing the healthy and sustainable development of the urban economy. It should be considered from the perspective of creating a stable society, in terms of economic development, convenient living, universal education, scientific development, adequate resources, ecological balance, and beautiful environment. In addition, it should also combine immediate performance with desirable potential to determine the evaluation criteria for sustainable urban development. The sustainable development of cities should be analyzed around the needs of the people, emphasizing the quality of the population and cultivating the social environment and living environment. The evaluation of resources should emphasize its effective use and the material civilization that can be brought to the people. The evaluation of the environment is mainly to evaluate the people’s good living environment, and thus it is a scientific and feasible evaluation.
3.1. Indicator Selection
In order to measure the sustainable development capability of the urban economy, we try to measure the five aspects including resource input, economic development, environmental carrying capacity, social development, and scientific and technological innovation. The amount of resources invested mainly reflects the demand for resources and energy in cities and is the cornerstone of sustainable development. Economic development mainly reflects the state of urban economic development and is the condition for sustainable urban development. Environmental carrying capacity mainly reflects the impact of resources, environmental endowments and economic development on environmental conditions, and is a strategic choice for sustainable urban development. Social development mainly reflects the level of comprehensive social development and is the guarantee for sustainable urban development. Scientific and technological innovation mainly reflects the development potential of the economy, intelligence, and environment, and is the potential for sustainable urban development.
For the assessment in this study, we use energy consumption, the science and education input, and labor as inputs. The undesirable outputs are industrial solids, sulfur dioxide (SO2), industrial wastewater and industrial dust, and the desirable output is Gross Domestic Product (GDP). Energy consumption is used to measure the energy needs of the region, namely, the amount of resources invested. GDP is used to measure regional economic development capabilities. Industrial solids, sulfur dioxide (SO2), industrial wastewater, and industrial dust are used to measure regional environmental sustainability. The labor force guarantees the future urban population and can be used to measure the sustainability of regional social development. Science and education input guarantees the quality of the future urban population and can be used to measure the sustainable innovation of regional science and technology.
In this study, energy consumption, labor, and GDP can be directly obtained from the China Urban Statistical Yearbook [40], the Yangtze River Delta Statistical Yearbook [53], the Jiangsu Statistical Yearbook [54], and the 13 prefecture-level cities (2010–2018) [41,42,43,44,45,46,47,48,49,50,51,52]. Additionally, the science and education input can be added by the investment in science and education in the yearbook. However, the energy consumption values of Nanjing (2009–2017), Yancheng (2009–2012) and Xuzhou (2013, 2017) cannot be obtained directly from the yearbook. Therefore, we use different types of energy consumption in the Nanjing Statistical Yearbook and the China Urban Statistical Yearbook to estimate the annual standard coal consumption based on the primary energy consumption method. Industrial solids, sulfur dioxide (SO2), industrial wastewater and industrial dust can be directly obtained from the China Urban Statistical Yearbook, the 13 prefecture-level city statistical yearbooks, and the environmental annual reports of the city eco-environment bureaus, which have been all mentioned above.
3.2. Results
In this section, we calculate the modified M-L index to assessing 13 prefecture-level cities’ sustainable development efficiency in Jiangsu Province from 2009 to 2017. These results provide a reference basis for the scientific decision-making of the long-term sustainable development of cities. In the study, in order to guarantee non-negative reference targets for all desirable and undesirable metrics, we adopted a modified M-L index analysis method. Focusing on the coordinated development of urban economy, population and environment, we have analyzed and evaluated the efficiency of sustainable urban development and its influencing factors. We use energy consumption, science and education input, and labor as input; the desirable output is regional GDP; the undesirable outputs are industrial solids, sulfur dioxide, industrial wastewater and industrial dust emissions in the region.
Based on the modified DDF specified from Formula (1) to Formula (4), we calculated the M-L productivity indexes of each year and its components EC (efficiency change) and TC (technical change) from 2009 to 2017. These results reflect the economic efficiency and the annual average degree of change in its influencing factors of different cities in Jiangsu Province. If the M-L index calculated in (8) is greater than one, there is an improvement in sustainable urban development efficiency. Accordingly, a higher M-L index indicates greater development efficiency. On the contrary, an M-L index that is less than one implies development efficiency regression. The TC index or EC index greater than one indicates that technical change or efficiency improvement can help the efficiency of sustainable urban development. On the contrary, if the TC index or EC index is less than one, it means that the technology has an impact on the sustainable development efficiency of the city due to technological degradation or inefficiency.
(1) The M-L Indexes of 13 Prefecture-Level Cities in Jiangsu Province
The results of the average annual M-L indexes are presented in Table 1 for the whole sample period. Figure 3 demonstrates year-on-year changes of the 13 prefecture-level cities and the South Jiangsu, Middle Jiangsu, and North Jiangsu zones concerning the M-L indexes. Figure 3a shows the M-L indexes of 13 prefecture-level cities, and Figure 3b shows the average annual M-L indexes of the South Jiangsu, Middle Jiangsu, and North Jiangsu. Figure 3c–e compares the M-L indexes of the prefecture-level cities in the South Jiangsu, Middle Jiangsu, and North Jiangsu, respectively.

Table 1.
The M-L indexes of 13 prefecture-level cities in Jiangsu Province.
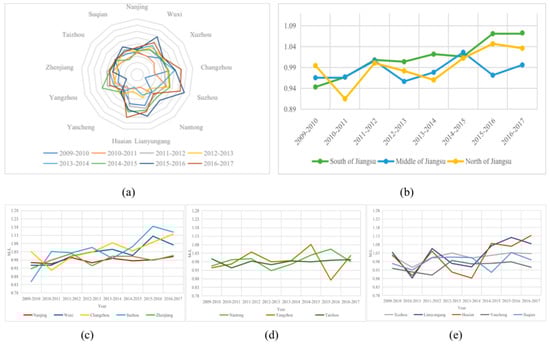
Figure 3.
The annual M-L indexes growths of 13 prefecture-level cities in Jiangsu Province: (a) the M-L indexes of 13 prefecture-level cities; (b) the average annual M-L indexes of the South Jiangsu, Middle Jiangsu, and North Jiangsu; (c) the M-L indexes of the prefecture-level cities in the South Jiangsu; (d) the M-L indexes of the prefecture-level cities in the Middle Jiangsu; (e) the M-L indexes of the prefecture-level cities in the North Jiangsu.
From Table 1 and Figure 3b, during the sample period of 2010–2017, we noted that the M-L indexes of South Jiangsu performed better than Middle Jiangsu and North Jiangsu. As shown in Figure 3c, the development trend of Nanjing and Zhenjiang is relatively consistent, while Suzhou, Wuxi and Changzhou have a relatively strong development trend in recent years. From Figure 3d, we found that the M-L indexes of the cities in Middle Jiangsu are relatively stable. However, the M-L index of Yangzhou in 2015–2016 was 0.8724, which was a sharp decline. From Figure 3e, we found that the M-L indexes of the cities in North Jiangsu is relatively volatile, especially Lianyungang and Huai’an.
However, as shown in Table 1, the M-L index of Suzhou in 2009–2010 is 0.8485, which lowered the average level of South Jiangsu in 2009–2010. The average annual M-L index of North Jiangsu is 0.9151, which is lower than the other periods. According to the China Urban Statistical Yearbook [40], we found that Suzhou’s sulfur dioxide (SO2) emissions in 2010 were 496,377 tons, while Suzhou’s sulfur dioxide (SO2) emissions in 2011 were 191,925 tons. Therefore, Suzhou’s sulfur dioxide (SO2) emissions in 2010 significantly affected the M-L index of Suzhou in 2009-2010. From the China Urban Statistical Yearbook [40], we found that the undesirable outputs (industrial solids, sulfur dioxide (SO2), industrial wastewater and industrial dust emissions) of North Jiangsu in 2011 has increased significantly compared to 2010, and the North Jiangsu’s M-L indexes have dropped significantly during 2010–2011. The reason for this phenomenon is very likely due to that the growth of sustainable urban development efficiency is not only related to desirable outputs but is also affected by undesirable outputs.
(2) The TC Indexes of 13 Prefecture-Level Cities in Jiangsu Province
The results of the average annual TC indexes are presented in Table 2 for the whole sample period. Figure 4 demonstrates year-on-year changes of the 13 prefecture-level cities and the South Jiangsu, Middle Jiangsu, and North Jiangsu zones concerning the TC indexes. Figure 4a shows the TC indexes of 13 prefecture-level cities, and Figure 4b shows the average annual TC indexes of the South Jiangsu, Middle Jiangsu, and North Jiangsu. Figure 4c–e compares the TC indexes of the prefecture-level cities in the South Jiangsu, Middle Jiangsu, and North Jiangsu, respectively.
Table 2.
The TC indexes of 13 prefecture-level cities in Jiangsu Province.
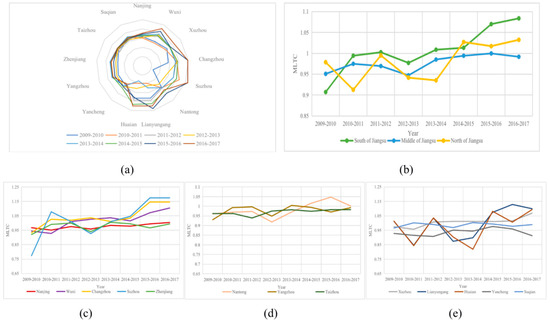
Figure 4.
The annual TC indexes growths of 13 prefecture-level cities in Jiangsu Province: (a) the TC indexes of 13 prefecture-level cities; (b) the average annual TC indexes of the South Jiangsu, Middle Jiangsu, and North Jiangsu; (c) the TC indexes of the prefecture-level cities in the South Jiangsu; (d) the TC indexes of the prefecture-level cities in the Middle Jiangsu; (e) the TC indexes of the prefecture-level cities in the North Jiangsu.
From Figure 3b and Figure 4b, we noted that the M-L productivity indexes and TC indexes of the South Jiangsu, Middle Jiangsu, and North Jiangsu zones shared a very similar changing trend. As shown in Figure 3c and Figure 4c, we found that the trends of the TC indexes and the M-L indexes in Nanjing and Zhenjiang are very stable, while Suzhou, Wuxi, and Changzhou have a relatively strong development trend in recent years. The TC indexes and M-L indexes of these cities are very similar. As shown in Figure 3d and Figure 4d, we noted that the changing trend of the TC indexes and the M-L indexes are consistent in Nantong, Taizhou, and Yangzhou. As shown in Figure 4e, we found that the changing trends in Xuzhou, Yancheng, and Suqian are relatively stable, while the fluctuations in Lianyungang and Huai’an are strong and consistent.
From Figure 4 and Table 2, we noted that the South Jiangsu witnessed a steady improvement in the TC indexes, while the Middle Jiangsu is relatively stable, and the North Jiangsu is relatively volatile. According to the analysis above, the M-L productivity indexes and TC indexes shared a very similar changing trend for most cities. However, as shown in Figure 3d and Figure 4d, we found that Yangzhou’s TC indexes and M-L indexes performed differently during 2015-2016. It can be seen that the M-L index of Yangzhou encountered a sharp decline during 2015-2016, while the TC index of Yangzhou during 2015-2016 was very stable. The reason for this phenomenon is probably due to the impact of the EC index on the performance of Yangzhou’s M-L index.
(3) The EC Indexes of 13 Prefecture-Level Cities in Jiangsu Province
The results of the average annual EC indexes are presented in Table 3 for the whole sample period. Figure 5 demonstrates year-on-year changes of the 13 prefecture-level cities and the South Jiangsu, Middle Jiangsu, and North Jiangsu zones concerning the EC indexes. Figure 5a shows the EC indexes of 13 prefecture-level cities, and Figure 5b shows the average annual EC indexes of the South Jiangsu, Middle Jiangsu, and North Jiangsu. Figure 5c–e compares the EC indexes of the prefecture-level cities in the South Jiangsu, Middle Jiangsu, and North Jiangsu, respectively.
Table 3.
The EC indexes of 13 prefecture-level cities in Jiangsu Province.
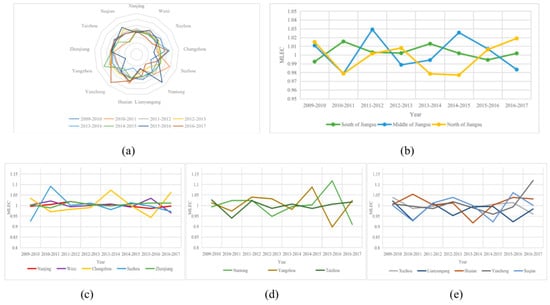
Figure 5.
The annual EC indexes growths of 13 prefecture-level cities in Jiangsu Province: (a) the EC indexes of 13 prefecture-level cities; (b) the average annual EC indexes of the South Jiangsu, Middle Jiangsu, and North Jiangsu; (c) the EC indexes of the prefecture-level cities in the South Jiangsu; (d) the EC indexes of the prefecture-level cities in the Middle Jiangsu; (e) the EC indexes of the prefecture-level cities in the North Jiangsu.
From Table 3 and Figure 5, we noted that the average annual EC indexes remained generally fluctuating around 1 for most cities and years. As shown in Table 3, we calculated the average annual EC indexes for the South Jiangsu, Middle Jiangsu, and North Jiangsu over the period of 2009-2017. As shown in Table 3, we found that the South Jiangsu has fewer years and that its average annual EC indexes are less than 1, which indicates that the efficiency of the South Jiangsu performed better than that of the Middle Jiangsu and North Jiangsu.
As shown in Figure 5d, we noted that Yangzhou’s EC index encountered a sharp decline during 2015–2016, and Nantong’s EC index encountered a sharp decline during 2016–2017. Combining with Figure 3d and Figure 4d, we found that the TC indexes trend of these two cities is relatively stable, while the M-L indexes and EC indexes shared a very similar changing trend during 2015–2017. This phenomenon can be explained by that the change of the EC indexes also affects the change of the M-L indexes to a certain extent.
3.3. Discussion
Figure 3, Figure 4 and Figure 5 demonstrate year-on-year changes of the South Jiangsu, Middle Jiangsu, and North Jiangsu zones with respect to the M-L indexes, EC, and TC respectively. As demonstrated by comparing Table 1, Table 2 and Table 3 and Figure 3, Figure 4 and Figure 5, the M-L productivity index and TC index shared a very similar changing trend, whereas EC index remained generally fluctuating around 1 for most cities and years. The results revealed that the sustainable urban development efficiency growth measured by the M-L productivity indexes was mainly contributed by technical change. The specific analysis and discussion are as follows.
(1) The Sustainable Development Efficiency of South Jiangsu Performed Better.
On the whole, the M-L indexes of South Jiangsu performed well, and the sustainable development efficiency of South Jiangsu is relatively high (as shown in Figure 3b). As can be seen from M-L indexes results, the overall sustainable urban development performance in South Jiangsu is better. From the geographical point of view (as shown in Figure 2), the South Jiangsu is located in the core area of the Yangtze River Delta and close to Shanghai. In particular, Suzhou, Wuxi, and Changzhou are the closest to Shanghai. They are the main areas for Shanghai’s industrial transfer, technology, and product diffusion, and are strongly influenced by Shanghai’s economic radiation.
As shown in Table 1 and Figure 3, the M-L productivity indexes of Suzhou, Wuxi, and Changzhou perform better than that of Nanjing or Zhenjiang. At the same time, the South Jiangsu not only has the Shanghai-Nanjing railway, the expressway traverses east and west, but also the Beijing-Hangzhou Canal runs through the north and south. Based on that, its transportation cost is low, communication conditions are good, it is easy to develop high-end industries and attract investment. Therefore, the overall sustainable development efficiency of cities in southern Jiangsu performed better.
The North Jiangsu is located in a relatively backward area at the junction of the four provinces of Jiangsu, Shandong, Henan, and Anhui. It is relatively far from the economically developed areas of China, and the radiation effect of receiving economic centers is relatively weak. Although the transportation conditions in the North Jiangsu have also been greatly improved in recent years, the industry and technology are constantly being upgraded, but the overall economic benefits are still slightly lower than those in developed regions.
(2) The Environmental Factors Play an Important Role in Sustainable Urban Development.
As we have previously pointed out, due to the performance of the M-L index of Suzhou in 2009–2010 and North Jiangsu in 2010–2011, the growth of sustainable urban development efficiency is not only related to desirable outputs but also affected by undesirable outputs. As the scale of the economy continues to expand, the demand for resources and energy in cities is also rising [62]. It can be seen that under the existing environmental protection policies and technologies, urban social and economic development is increasingly constrained by the environment [63,64]. If the city does not find a reasonable solution, it will further improve the energy efficiency of the city. With the increase of undesirable output, it will restrict the sustainable development of cities. Therefore, it is of vital importance to consider environmental concerns when assessing the sustainable development efficiency of the city.
(3) The M-L Productivity Indexes and TC Indexes Shared a Very Similar Changing Trend.
According to the calculation results of the TC indexes, the change trend of the TC indexes and the M-L indexes in the South Jiangsu, Middle Jiangsu, and North Jiangsu are very similar. This suggests that technical change was the main driver of most sustainable urban development efficiency growth.
Most cities of the South Jiangsu witnessed a steady improvement. For the five cities in the South Jiangsu, their geographical economic advantages are obvious; talent attraction and industrial layout have entered a mature stage, and economic development has stabilized. As shown in Figure 3 and Figure 4, the performance of the M-L indexes and the TC indexes in the cities of the South Jiangsu have not been always well. This phenomenon can be explained by that the marginal effects of technological factors on urban economies are declining, in which small-scale inputs can only produce fewer desirable outputs. However, the TC indexes of Suzhou, Wuxi, and Changzhou have a strong upward trend in recent years (as shown in Figure 4c). Faced with the pressure of economic transformation, cities in the South Jiangsu are striving to find breakthroughs. In recent years, Suzhou, Wuxi, and Changzhou have continuously combined technology breakthroughs, such as the Internet and Artificial Intelligence, to try to take a new step in high-end manufacturing and urban management efficiency. Therefore, the development trend of the M-L indexes and the TC indexes in recent years is strong. The urban industrial structure of the South Jiangsu has not yet been perfected, technological innovation has expanded from point to point, and the impact of technological changes on the urban economy has gradually increased.
The development trend of the TC indexes and the M-L indexes in Middle Jiangsu are relatively stable. The TC indexes of Middle Jiangsu are mostly less than one, which indicates that the technology of Middle Jiangsu needs to be further improved (as shown in Figure 3d). Therefore, the Middle Jiangsu should continue to strengthen resources and talent investment, enhance the marginal effect of technological innovation in advantageous industries, help technological innovation and enterprise development in disadvantaged industries, and adjust the industrial layout in a two-pronged manner in order to form an all-round high-density industrial structure.
The development trend of the TC indexes and the M-L indexes in North Jiangsu are relatively fluctuating. As shown in Table 1 and Table 2, during the entire sample period of 2009–2017, the TC indexes and the M-L indexes of Xuzhou performed well; most are greater than one. While the TC indexes and the M-L indexes in North Jiangsu performed less well. As shown in Figure 3e and Figure 4e, we found that the changing trends of the TC indexes and the M-L indexes in North Jiangsu are slightly different. This phenomenon can be explained by that the cities in the North Jiangsu, where the economic development is relatively backward, the internal industrial structure is still not perfect, and the influence of technological factors on the urban economy has not fully manifested. Therefore, the North Jiangsu should use existing resources, technology, and talents to further develop advantageous industries, and actively carry out inter-city cooperation, build a supporting industrial chain, and achieve technological innovation to drive economic development.
(4) The EC Indexes Remained Generally Fluctuating around One for Most Cities and Years.
According to the calculation results of the EC indexes, the EC indexes of each city in the South, Middle and North of Jiangsu fluctuate around 1 (as shown in Table 3). Combined with the above analysis, we can find that technical efficiency and technological change have a common impact on the sustainable development of the regional economy. However, technological change is the main driving force. As we have previously pointed out, the sustainable urban development efficiency growth measured by the M-L productivity indexes was mainly contributed by technical change.
As shown in Table 3, the efficiency improvement in the South Jiangsu is still better than that in the Middle Jiangsu and North Jiangsu. The reason for this phenomenon is very likely due to spatial layout, and that the distribution of cities in the South Jiangsu is more concentrated, which is conducive to the exchange and diffusion of information and technology between cities and cities, and forms a certain scale agglomeration effect, thereby improving the efficiency of resources. In addition, the cities of the South Jiangsu attract talents far more than the cities of the Middle and North of Jiangsu. The increase in population density is conducive to the social division of labor, which is conducive to attracting investment and conducive to the development of the service industry. This has further promoted the rapid development of the South Jiangsu and formed a virtuous cycle of the economy. Combined with the above analysis, we found that there is a certain gap in the efficiency of sustainable economic development in Jiangsu Province.
From the perspective of a sustainable development, this paper uses the modified M-L indexes to assess the economic development of the city, while taking into account the negative impact of outputs on the environment. Under this assessment model, cities must consider not only the growth of GDP but also the environmental performance of productivity. To achieve a balanced regional economic development in Jiangsu Province, the government should formulate targeted differentiation policies based on the characteristics and the influencing factors of different cities when considering sustainable urban development.
(1) As the most economically developed region in Jiangsu Province, the South Jiangsu has changed its own mode of economic growth in recent years, and has improved the efficiency of economic transformation with science and technology. All cities in the South Jiangsu should constantly seek breakthroughs from the outside, introduce cutting-edge technology and high-end projects, enhance their independent innovation capabilities, accelerate the construction of an international talent team, and accumulate technology to discover the next economic breakthrough.
(2) Located in the central part of Jiangsu Province, the Middle Jiangsu fully accepted the radiation of Shanghai and the South Jiangsu, attracting more pillar industries to settle in the Middle Jiangsu. Cities in the Middle Jiangsu should accelerate the pace of technological change, self-improve the industrial structure, gradually improve the industrial clusters, adapt to the new economic environment, and promote the development of regional innovation consciousness.
(3) As a region with a relatively slow economic development in Jiangsu, cities in the North Jiangsu should pay attention to protecting the ecological environment while improving urban economic development. The cities in the North Jiangsu use their own labor advantages to actively undertake the industrial transfer in the South Jiangsu, vigorously promote new industrialization, and improve the efficiency of traditional industries with advanced information technology. In recent years, cities in the North Jiangsu have also increased their financial investment in science and education, encouraging private capital to invest in education, taking science and education to prosper the cities, and strengthening the cities. On the basis of making full use of existing resources, the government of the North Jiangsu should actively promote the coordinated development of urban and rural areas, enhance the development momentum of the urban economy, and strengthen the concentration and driving functions of the central cities to further improve urbanization. According to the existing situation, North Jiangsu should actively seek a green growth model to optimize the economic structure and promote sustainable economic development with environmental protection to be considered.
4. Conclusions
This paper aims at the evaluation of sustainable urban development under environmental constraints. Taking 13 prefecture-level cities in Jiangsu Province as an example, a modified M-L indexes analysis method based on the new directional distance function (DDF) is used to guarantee non-negative reference targets for all desirable and undesirable metrics. Therefore, around the balanced development of urban economy, population, environment and resources, the efficiency of sustainable urban development and its influencing factors are analyzed, to provide a scientific decision basis for long-term sustainable urban development. In the article, we use energy consumption, science, and education input, labor as input; the desirable output is regional GDP; the undesirable outputs are industrial solids, sulfur dioxide, industrial wastewater, and industrial dust emissions in the region.
By calculating the ML value and its decomposition terms (TC value and EC value) of 13 prefecture-level cities in Jiangsu Province, we analyzed the sustainable development efficiency and potential of the South Jiangsu, Middle Jiangsu, and North Jiangsu. The results show that the growth of sustainable urban development efficiency is not only related to desirable outputs but also affected by undesirable outputs. The M-L productivity index and TC index shared a very similar changing trend, whereas EC index remained generally fluctuating around 1 for most cities and years. These results indicate that technical efficiency and technological change have a common impact on the sustainable development of the regional economy, while technological change is the main driving force. Additionally, there is a certain gap in the efficiency of sustainable economic development in Jiangsu Province. Accordingly, we gave some suggestions based on the different characteristics and influencing factors of the city to further improve sustainable urban development efficiency, with the increase in desirable output and environmental protection to be considered.
Author Contributions
Conceptualization, Y.W. and G.Y.; methodology, G.Y.; software, Y.Y.; validation, Y.W., G.Y. and X.Z.; formal analysis, X.Z.; investigation, Y.Y.; resources, Y.W.; data curation, X.Z.; writing—original draft preparation, Y.W.; writing—review and editing, G.Y.; visualization, Y.Y.; supervision, X.Z.; project administration, Y.Y. All authors have read and agreed to the published version of the manuscript.
Funding
This research received no external funding.
Conflicts of Interest
The authors declare no conflict of interest.
References
- Li, Y.; Yang, W.; Shen, X.; Yuan, G.; Wang, J. Water Environment Management and Performance Evaluation in Central China: A Research Based on Comprehensive Evaluation System. Water 2019, 11, 2472. [Google Scholar] [CrossRef]
- Yang, W.; Li, L. Energy Efficiency, Ownership Structure, and Sustainable Development: Evidence from China. Sustainability 2017, 9, 912. [Google Scholar] [CrossRef]
- Shen, X.; Yang, W.; Sun, S. Analysis of the Impact of China’s Hierarchical Medical System and Online Appointment Diagnosis System on the Sustainable Development of Public Health: A Case Study of Shanghai. Sustainability 2019, 11, 6564. [Google Scholar] [CrossRef]
- Li, L.; Yang, W. Total Factor Efficiency Study on China’s Industrial Coal Input and Wastewater Control with Dual Target Variables. Sustainability 2018, 10, 2121. [Google Scholar] [CrossRef]
- Krugman, P. The myth of Asia’s miracle. Foreign Aff. 1994, 62–78. [Google Scholar] [CrossRef]
- Young, A. The tyranny of numbers: confronting the statistical realities of the East Asian growth experience. Q. J. Econ. 1995, 110, 641–680. [Google Scholar] [CrossRef]
- Young, A. Gold into base metals: Productivity growth in the People’s Republic of China during the reform period. J. Polit. Econ. 2003, 111, 1220–1261. [Google Scholar] [CrossRef]
- Baumgärtner, S.; Quaas, M. What is sustainability economics? Ecol. Econ. 2010, 69, 445–450. [Google Scholar] [CrossRef]
- Westley, F.; Olsson, P.; Folke, C.; Homer-Dixon, T.; Vredenburg, H.; Loorbach, D.; Thompson, J.; Nilsson, M.; Lambin, E.; Sendzimir, J.; et al. Tipping toward sustainability: emerging pathways of transformation. Ambio 2011, 40, 762. [Google Scholar] [CrossRef]
- Shen, L.; Cheng, S.; Gunson, A.J.; Wan, H. Urbanization, sustainability and the utilization of energy and mineral resources in China. Cities 2005, 22, 287–302. [Google Scholar] [CrossRef]
- Zhang, C.; Xu, J. Retesting the causality between energy consumption and GDP in China: Evidence from sectoral and regional analyses using dynamic panel data. Energy Econ. 2012, 34, 1782–1789. [Google Scholar] [CrossRef]
- Sun, X.; Li, J.; Qiao, H.; Zhang, B. Energy implications of China’s regional development: new insights from multi-regional input-output analysis. Appl. Energy 2017, 196, 118–131. [Google Scholar] [CrossRef]
- Wang, Z.; Feng, C.; Zhang, B. An empirical analysis of China’s energy efficiency from both static and dynamic perspectives. Energy 2014, 74, 322–330. [Google Scholar] [CrossRef]
- Li, L.; Hu, J. Ecological total-factor energy efficiency of regions in China. Energy Policy 2012, 46, 216–224. [Google Scholar] [CrossRef]
- Bao, S.; Chang, G.H.; Sachs, J.D.; Woo, W.T. Geographic factors and China’s regional development under market reforms, 1978--1998. China Econ. Rev. 2002, 13, 89–111. [Google Scholar] [CrossRef]
- Jiang, X.; He, X.; Zhang, L.; Qin, H.; Shao, F. Multimodal transportation infrastructure investment and regional economic development: A structural equation modeling empirical analysis in China from 1986 to 2011. Transp. Policy 2017, 54, 43–52. [Google Scholar] [CrossRef]
- Singh, R.K.; Murty, H.R.; Gupta, S.K.; Dikshit, A.K. An overview of sustainability assessment methodologies. Ecol. Indic. 2012, 15, 281–299. [Google Scholar] [CrossRef]
- Pearce, D.; Barbier, E.; Markandya, A. Sustainable Development: Economics and Environment in the Third World; Routledge: London, UK, 2013. [Google Scholar]
- Bateman, I.J.; Mace, G.M.; Fezzi, C.; Atkinson, G.; Turner, K. Economic analysis for ecosystem service assessments. Environ. Resour. Econ. 2011, 48, 177–218. [Google Scholar] [CrossRef]
- Yigitcanlar, T.; Dur, F. Developing a sustainability assessment model: The sustainable infrastructure, land-use, environment and transport model. Sustainability 2010, 2, 321–340. [Google Scholar] [CrossRef]
- Schandl, H.; Hatfield Dodds, S.; Wiedmann, T.; Geschke, A.; Cai, Y.; West, J.; Newth, D.; Baynes, T.; Lenzen, M.; Owen, A. Decoupling global environmental pressure and economic growth: scenarios for energy use, materials use and carbon emissions. J. Clean. Prod. 2016, 132, 45–56. [Google Scholar] [CrossRef]
- Wei, Y.; Huang, C.; Li, J.; Xie, L. An evaluation model for urban carrying capacity: A case study of China’s mega-cities. Habitat Int. 2016, 53, 87–96. [Google Scholar] [CrossRef]
- Yang, W.; Yuan, G.; Han, J. Is China’s air pollution control policy effective? Evidence from Yangtze River Delta cities. J. Clean. Prod. 2019, 220, 110–133. [Google Scholar] [CrossRef]
- Gao, H.; Yang, W.; Yang, Y.; Yuan, G. Analysis of the Air Quality and the Effect of Governance Policies in China’s Pearl River Delta, 2015–2018. Atmosphere 2019, 10, 412. [Google Scholar] [CrossRef]
- Yang, W.X.; Li, L.G. Efficiency evaluation of industrial waste gas control in China: A study based on data envelopment analysis (DEA) model. J. Clean. Prod. 2018, 179, 1–11. [Google Scholar] [CrossRef]
- Yuan, G.; Yang, W. Evaluating China’s Air Pollution Control Policy with Extended AQI Indicator System: Example of the Beijing-Tianjin-Hebei Region. Sustainability 2019, 11, 939. [Google Scholar] [CrossRef]
- Yang, W.X.; Li, L.G. Analysis of Total Factor Efficiency of Water Resource and Energy in China: A Study Based on DEA-SBM Model. Sustainability 2017, 9, 1316. [Google Scholar] [CrossRef]
- Yigitcanlar, T.; Dur, F.; Dizdaroglu, D. Towards prosperous sustainable cities: A multiscalar urban sustainability assessment approach. Habitat Int. 2015, 45, 36–46. [Google Scholar] [CrossRef]
- Shaker, R.R.; Zubalsky, S.L. Examining patterns of sustainability across Europe: a multivariate and spatial assessment of 25 composite indices. Int. J. Sustain. Dev. World Ecol. 2015, 22, 1–13. [Google Scholar] [CrossRef]
- Yang, Q.; Ding, Y.; De Vries, B.; Han, Q.; Ma, H. Assessing regional sustainability using a model of coordinated development index: A case study of mainland China. Sustainability 2014, 6, 9282–9304. [Google Scholar] [CrossRef]
- Yang, B.; Xu, T.; Shi, L. Analysis on sustainable urban development levels and trends in China’s cities. J. Clean. Prod. 2017, 141, 868–880. [Google Scholar] [CrossRef]
- Tan, F.; Lu, Z. Assessing regional sustainable development through an integration of nonlinear principal component analysis and Gram Schmidt orthogonalization. Ecol. Indic. 2016, 63, 71–81. [Google Scholar] [CrossRef]
- Zhang, S. Evaluating the method of total factor productivity growth and analysis of its influencing factors during the economic transitional period in China. J. Clean. Prod. 2015, 107, 438–444. [Google Scholar] [CrossRef]
- Oh, D. A global Malmquist-Luenberger productivity index. J. Product. Anal. 2010, 34, 183–197. [Google Scholar] [CrossRef]
- Oh, D.; Heshmati, A. A sequential Malmquist--Luenberger productivity index: environmentally sensitive productivity growth considering the progressive nature of technology. Energy Econ. 2010, 32, 1345–1355. [Google Scholar] [CrossRef]
- Woo, C.; Chung, Y.; Chun, D.; Seo, H.; Hong, S. The static and dynamic environmental efficiency of renewable energy: A Malmquist index analysis of OECD countries. Renew. Sustain. Energy Rev. 2015, 47, 367–376. [Google Scholar] [CrossRef]
- Kumar, S. Environmentally sensitive productivity growth: a global analysis using Malmquist--Luenberger index. Ecol. Econ. 2006, 56, 280–293. [Google Scholar] [CrossRef]
- Choi, Y.; Oh, D.; Zhang, N. Environmentally sensitive productivity growth and its decompositions in China: a metafrontier Malmquist--Luenberger productivity index approach. Empir. Econ. 2015, 49, 1017–1043. [Google Scholar] [CrossRef]
- Zhang, N.; Choi, Y. Total-factor carbon emission performance of fossil fuel power plants in China: A metafrontier non-radial Malmquist index analysis. Energy Econ. 2013, 40, 549–559. [Google Scholar] [CrossRef]
- National Bureau of Statistics of China. The China Urban Statistical Yearbook, 2010–2018; China Statistics Press: Beijing, China, 2019.
- Bureau of Statistics of Changzhou. Statistical Yearbook of Changzhou, 2010–2018. Available online: http://tjj.changzhou.gov.cn/class/OEJCMFCP (accessed on 28 August 2019).
- Bureau of Statistics of Huai’an. Statistical Yearbook of Huai’an, 2010–2018. Available online: http://tjj.huaian.gov.cn/tjnj/list.html (accessed on 28 August 2019).
- Bureau of Statistics of Xuzhou. Statistical Yearbook of Xuzhou, 2017–2018. Available online: http://tj.xz.gov.cn/TJJ/sjfb/004011/ (accessed on 28 August 2019).
- Bureau of Statistics of Yancheng. Statistical Yearbook of Yancheng, 2015–2018. Available online: http://tjj.yancheng.gov.cn/col/col1779/index.html (accessed on 28 August 2019).
- Bureau of Statistics of Zhenjiang. Statistical Yearbook of Zhenjiang, 2010–2018. Available online: http://tjj.zhenjiang.gov.cn/tjzl/tjnj/ (accessed on 28 August 2019).
- Municipal Government of Suqian. Statistical Yearbook of Suqian, 2010–2017. Available online: http://www.suqian.gov.cn/cnsq/tjnj/list_none.shtml (accessed on 28 August 2019).
- Bureau of Statistics of Lianyungang. Statistical Yearbook of Lianyungang, 2010–2018. Available online: http://tjj.lyg.gov.cn/tjxxw/tjnj/tjnj.html (accessed on 28 August 2019).
- Bureau of Statistics of Nanjing. Statistical Yearbook of Nanjing, 2010–2018. Available online: http://221.226.86.104/file/index.htm (accessed on 28 August 2019).
- Bureau of Statistics of Nantong. Statistical Yearbook of Nantong, 2016–2018. Available online: http://tjj.nantong.gov.cn/ntstj/tjnj/tjnj.html (accessed on 28 August 2019).
- Bureau of Statistics of Suzhou. Statistical Yearbook of Suzhou, 2010–2018. Available online: http://www.sztjj.gov.cn/SztjjGzw/sjtj/003005/ (accessed on 28 August 2019).
- Bureau of Statistics of Taizhou. Statistical Yearbook of Taizhou, 2010–2018. Available online: http://tjj.taizhou.gov.cn/art/2016/6/4/art_2443_591843.html (accessed on 28 August 2019).
- Bureau of Statistics of Wuxi. Statistical Yearbook of Wuxi, 2010–2018. Available online: http://tj.wuxi.gov.cn/ztzl/tjnj/index.shtml (accessed on 28 August 2019).
- China Economic and Social Big Data Research Platform. The Yangtze River Delta City Yearbook, 2010–2014. Available online: http://data.cnki.net/trade/Yearbook/Single/N2013050001?z=Z021 (accessed on 28 August 2019).
- Bureau of Statistics of Jiangsu. Statistical Yearbook of Jiangsu, 2010–2018. Available online: http://tj.jiangsu.gov.cn/col/col4009/index.html (accessed on 28 August 2019).
- The Eco-Environment Bureau of Yangzhou. The Annual Environmental Quality Bulletin of Yangzhou, 2010–2018. Available online: http://hbj.yangzhou.gov.cn/yzhbjceshi/ndhjzlgb/list.shtml (accessed on 28 August 2019).
- The Eco-Environment Bureau of Taizhou. The Annual Environmental Quality Bulletin of Taizhou, 2010–2018. Available online: http://hbj.taizhou.gov.cn/col/col43871/index.html (accessed on 28 August 2019).
- The Eco-Environment Bureau of Suqian. The Annual Information Disclosure Report of Suqian, 2010–2018. Available online: http://www.suqian.gov.cn/cnsq/xxgkml/xxgk_main_mulu.shtml?channel_id=gengduo&webSiteId=a77ae2ccc3e241abb091cc62cb5553de&narrow=false (accessed on 28 August 2019).
- The Eco-Environment Bureau of Lianyungang. The Annual Information Disclosure Report of Lianyungang, 2010–2018. Available online: http://hbj.lyg.gov.cn/xxgknb/xxgknb.html (accessed on 28 August 2019).
- The Eco-Environment Bureau of Huai’an. The Annual Environmental Quality Bulletin of Huai’an, 2010–2018. Available online: http://sthjj.huaian.gov.cn/hjzl/hjgb/list.html (accessed on 28 August 2019).
- Du, J.; Chen, Y.; Huang, Y. A modified Malmquist-luenberger productivity index: Assessing environmental productivity performance in China. Eur. J. Oper. Res. 2018, 269, 171–187. [Google Scholar] [CrossRef]
- Färe, R.; Grosskopf, S.; Margaritis, D. Efficiency and productivity: Malmquist and more. Meas. Product. Effic. Product. growth 2008, 5, 522–622. [Google Scholar]
- Yang, W.; Li, L. Efficiency Evaluation and Policy Analysis of Industrial Wastewater Control in China. Energies 2017, 10, 1201. [Google Scholar] [CrossRef]
- Yuan, G.; Yang, W. Study on optimization of economic dispatching of electric power system based on Hybrid Intelligent Algorithms (PSO and AFSA). Energy 2019, 183, 926–935. [Google Scholar] [CrossRef]
- Yang, Y.; Yang, W. Does Whistleblowing Work for Air Pollution Control in China? A Study Based on Three-party Evolutionary Game Model under Incomplete Information. Available online: https://www.researchgate.net/publication/330315569_Does_Whistleblowing_Work_for_Air_Pollution_Control_in_China_A_Study_Based_on_Three-party_Evolutionary_Game_Model_under_Incomplete_Information (access on 1 January 2020).


© 2020 by the authors. Licensee MDPI, Basel, Switzerland. This article is an open access article distributed under the terms and conditions of the Creative Commons Attribution (CC BY) license (http://creativecommons.org/licenses/by/4.0/).