Article

Sustainability of Reinforced Concrete Beams with/without BF Influenced by Cracking Capacity and Chloride Diffusion

1
College of Civil Engineering and Architecture, Zhejiang University of Technology, Hangzhou 310014, China
2
School of Civil Engineering, Beijing Jiaotong University, Beijing 100044, China
3
Key Laboratory of Civil Engineering Structure & Disaster Prevention and Mitigation Technology of Zhejiang Province, Hangzhou 310014, China
*
Author to whom correspondence should be addressed.
Sustainability 2020, 12(3), 1054; https://doi.org/10.3390/su12031054
Submission received: 16 December 2019 / Revised: 20 January 2020 / Accepted: 24 January 2020 / Published: 2 February 2020
(This article belongs to the Section Sustainable Engineering and Science)

Abstract

:
Concrete’s production causes pronounced environmental impacts. It is confirmed that adding basalt fiber (BF) into concrete can improve the mechanical properties and reduce the chloride diffusion coefficient of concrete. Moreover, research on the environmental impact of BF and its application in concrete has gradually emerged in recent years. However, there is little research on the chloride diffusivity of concrete structures with BF under the coupling interaction of external loads and chloride action. Therefore, at first, six beams were cast to obtain the depth-dependent chloride diffusivity of concrete under the coupling interaction of chloride penetration and 50% and 80% of the cracking capacity. Then, a functional unit (FU) combining durability, cracking capacity and volume was proposed to evaluate the sustainability of the concrete structure. In addition, three extra FUs (volume, considering volume and cracking capacity simultaneously and considering volume, cracking capacity and durability simultaneously) were also proposed and compared with the first FU. Results indicate that, regardless of the applied load level, the average chloride diffusion coefficient of a reinforced concrete (RC) beam with BF is larger than that of an ordinary RC beam. Moreover, the sorting of life cycle assessment (LCA) results will vary significantly with the different preset functional units. When taking the cracking capacity into consideration, adding BF into concrete is a suitable solution to improve the sustainability of RC beams.

1. Introduction

Basalt fiber (BF), obtained after extrusion from basalt-based molten igneous volcanic rock, is extensively used due to its cost-effectiveness and exceptional functional properties [1,2]. Recently, BF has gained extensive attentions due to the fact that adding BF into concrete (basalt fiber-reinforced concrete, BFRC) can improve the mechanical properties. Elshafie et al. [3] reviewed the influences of BF lengths and BF contents on the mechanical strength of concrete and concluded that when the length of BF was between 12 and 24 mm and the content of BF by total volume was between 0.10% and 0.50%, the mechanical strength could be enhanced. Katkhuda et al. [4] suggested that the compressive strength of concrete may minimally increase as the BF content increases until it reaches 1%, but the flexural and splitting tensile strength of concrete showed a significant improvement. Zhang et al. [5] investigated the properties of BFRC at different fiber contents and observed a significantly improved dynamic compressive strength of concrete with the addition of a reasonable basalt fiber content under different loading rates.
Chloride attack is an important influence factor on the durability of reinforced concrete (RC) structures [6,7]. Research insisted that adding BF in concrete is beneficial to reduce the chloride diffusion coefficient [8]. Actually, most of the real concrete structures are subject to the external loads, resulting from the fact that chloride transport in concrete is affected by environmental factors [9] and external loads [10,11]. Thus, it is necessary to conduct in-depth research on the chloride diffusion under the coupling interaction of external loads and chloride action. Based on the experiment results on the chloride diffusivity of concrete in tensile and compressive zones, Wang et al. [12] insisted that the chloride concentration increased with flexural stress in the tensile zone of concrete, regardless of the stress level, but decreased with compressive stress at first and increased until the stress increased up to 55% of compressive strength in the compressive zone of concrete. To explore the characteristics of chloride diffusivity at different depths of concrete sections, Wang et al. [13] proposed a model by establishing the relationship between flexural load levels and chloride diffusion coefficients. As concerns grow over sustainable development, it is important that the environmental implications of adding BF into concrete should be properly considered. The technique to address this issue is known as life cycle assessment (LCA) [14]. Research on the environmental impact of BF and its application in concrete has gradually emerged in recent years. Jamshaid et al. [15] suggested that BF should be classified as a sustainable material since BF is made of natural material and no chemical additives as well as any solvents, pigments or other hazardous materials are added during its production. De Fazio [16] estimated that the energy required to produce BF in an electric furnace should be 5 kWh/kg.
In this paper, to calculate the life cycle sustainability of basalt fiber-reinforced concrete, the coupling effects of external loads and chloride penetration on the chloride diffusivity of concrete are taken into consideration. At first, six beams are cast to obtain the depth-dependent chloride diffusivity of concrete, by the model proposed by Zhang et al. [17]. Then, a functional unit combining the durability (the depth-dependent chloride diffusivity), cracking capacity and volume of the concrete beam is proposed to evaluate the integrated sustainability of the concrete structure. In addition, three other functional units (volume, considering volume and cracking capacity simultaneously and considering volume and durability simultaneously) are also proposed and compared with the first indicator. It is worth noting that energy consumption is selected as an environmental indicator for comparing the ordinary concrete beam and the concrete beam with BF due to the lack of life cycle inventory.

2. Experiment Method

2.1. Raw Materials and Mix Proportion of Tested Concrete

In this study, common river sand with a fineness modulus of 2.5 and gravel with a maximum size of 40 mm were used as fine aggregates and coarse aggregates, respectively. Besides, Qian-Chao cement with a strength grade of 32.5 (Portland Cement) was used. BF was produced by Shanghai Erjin Basalt Fiber Co. Ltd. of Heng Dian Group. Its filament diameter and thermal conductivity was 12–15 μm and 0.03~0.04 W / m k , respectively. In addition, the tensile strength of BF was 4100-4500 MPa and the density was 2800 kg/m3. Besides, the modulus of elasticity of BF was 100~110 GPa . Table 1 shows the concrete mixture proportions in this test, in which the percentage of BF represents the volume percentage in cement. The water to cement ratio was kept as 0.60 for the tested concrete. For each concrete mixture, three cubic specimens with a side length of 150 mm were cast to determine the compressive strength of concrete after curing for 28 days in a standard environment. The result for the 28 d compressive strength of concrete is shown in Table 1.

2.2. Test Methods and Exposure Environment

For the chloride penetration in RC beams with different flexural loads, six RC beams were cast with a length of 1100 mm and a rectangular cross-section of 100 × 150 mm, including two beams for determining cracking capacity (one RC beam and one BFRC beam), two RC beams and two BFRC beams for the chloride penetration test under different flexural loads. The steel reinforcements used included two top support rebars and two bottom longitudinal rebars, both with 8 mm diameter and the transverse stirrups with 6 mm diameter and a spacing of 150 mm (see Figure 1).
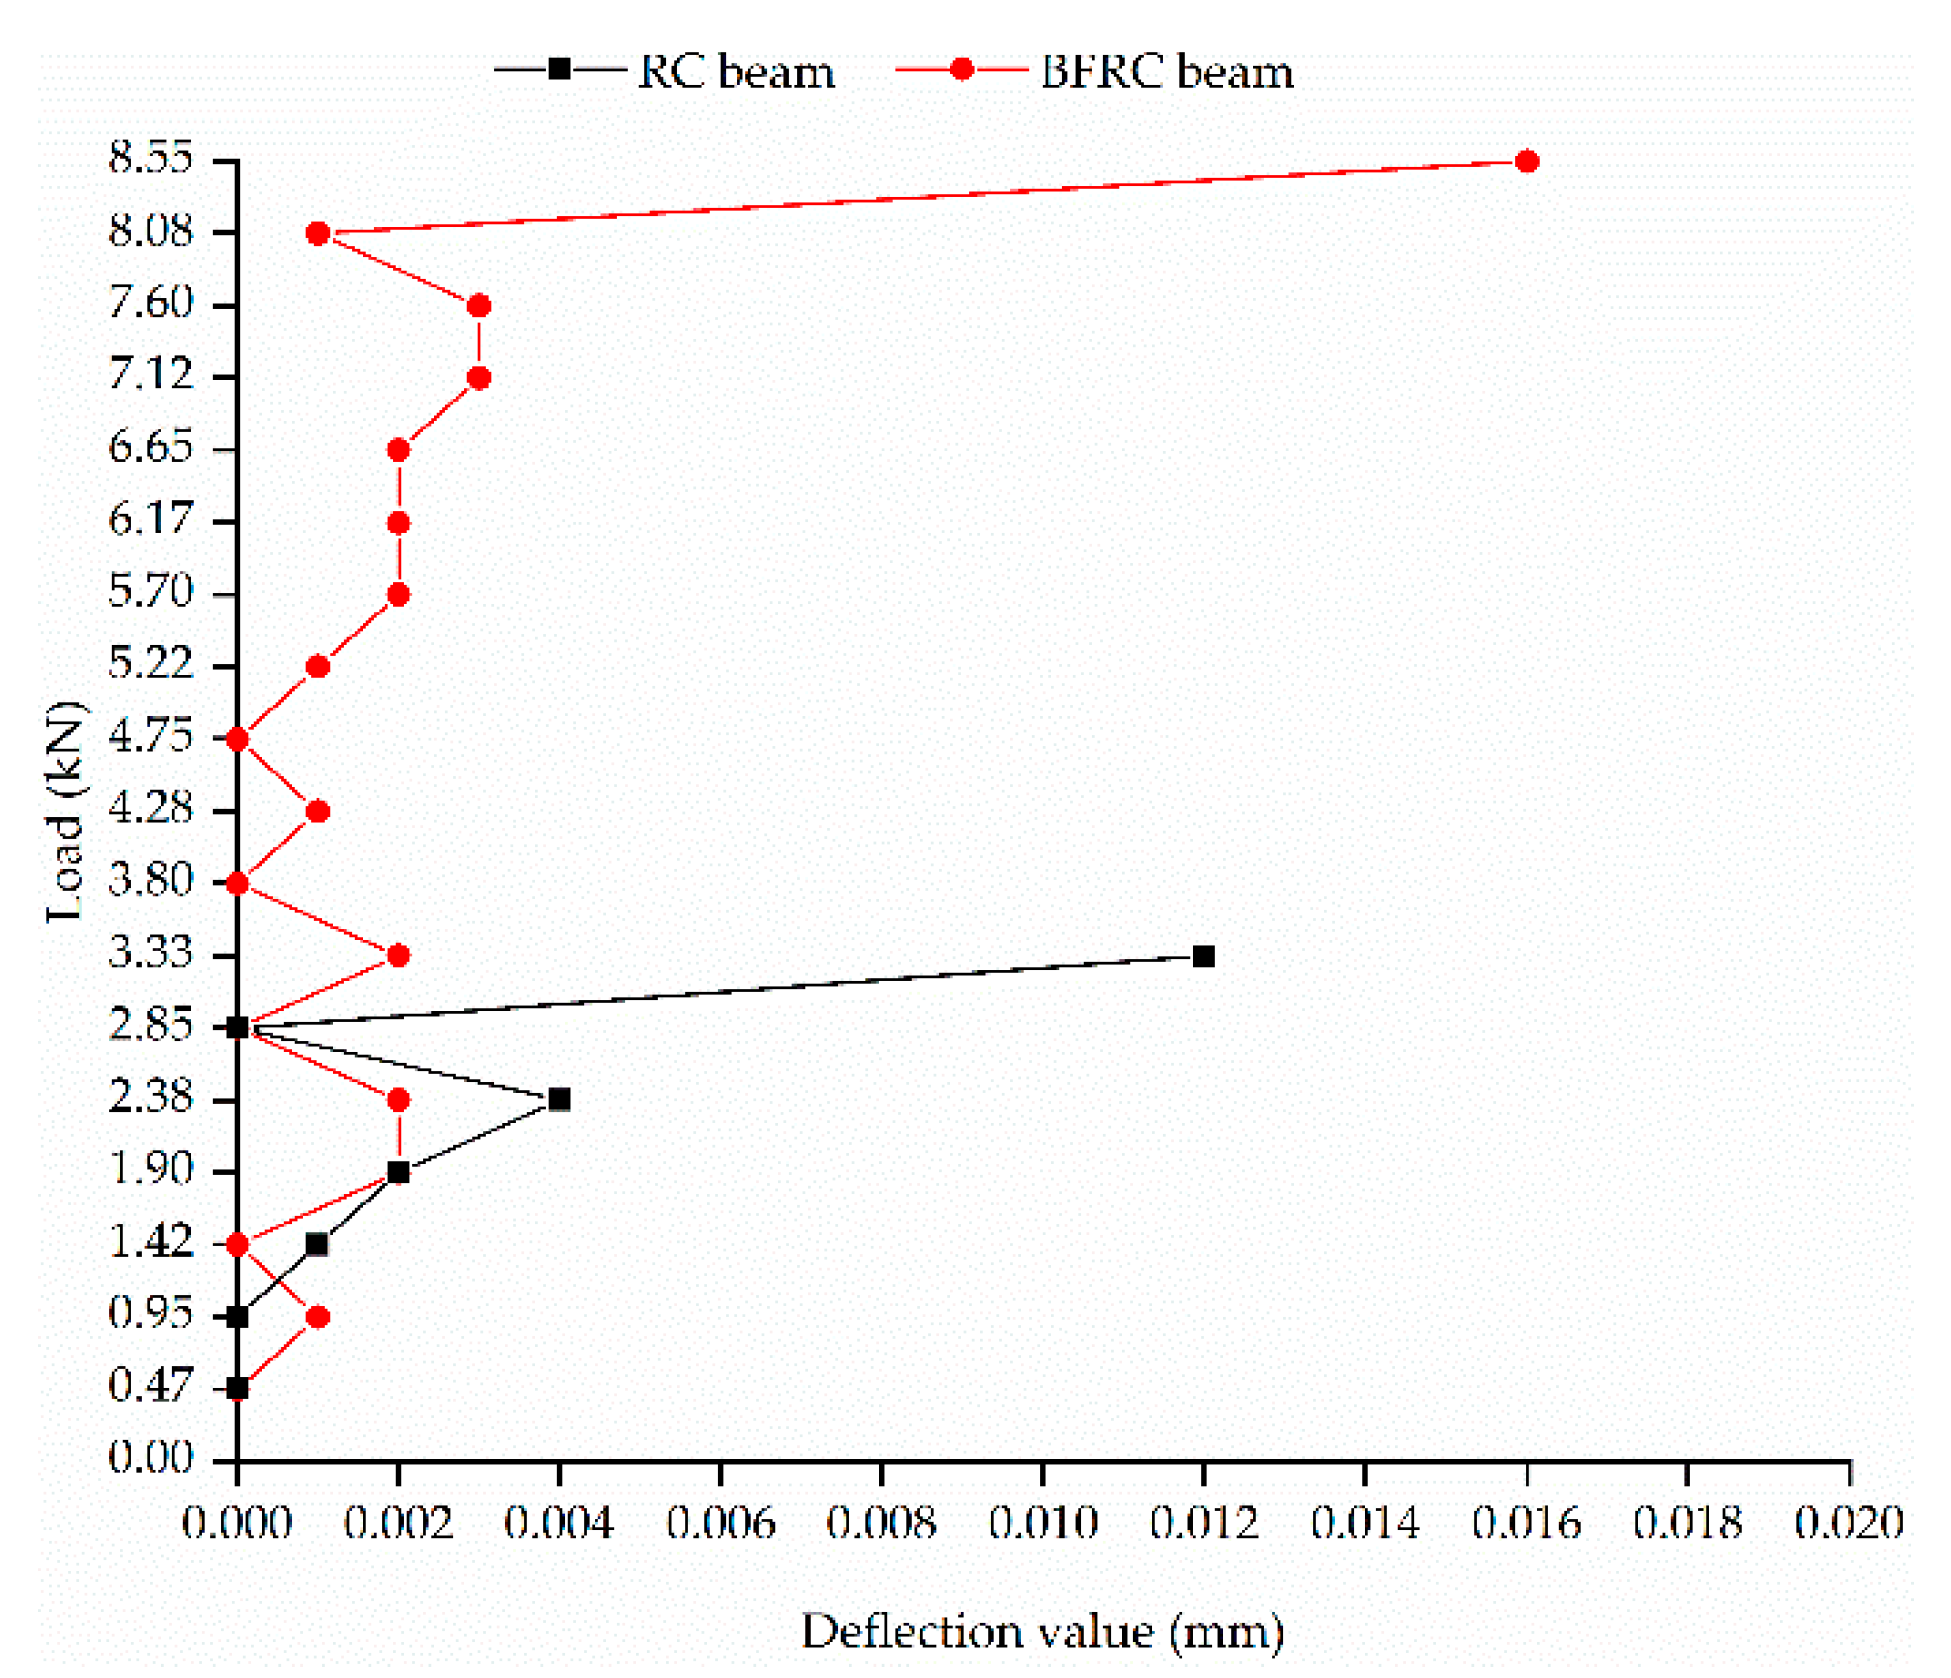
The load value in the serviceability limit states of test beam (Fs) was calculated at first. After the standard curing of 28 days, three micrometer gauges with an accuracy of 0.001 mm were installed at both ends and the midspan of the RC/BFRC beam, respectively, to collect the deflection data. According to the provisions in Standard for Test Method of Concrete Structures (GB/T 50152-2012) [18], after the standard curing of 28 days, a destruction test was applied to the beams to obtain the cracking capacity (Fcr). Loads were applied progressively, with a loading amplitude and load-keeping time of 0.05 Fs and 15 min, respectively. When there was an obvious inflection point with a sudden deflection in the load-deformation curve at the midspan tension of the RC/BFRC beam, as shown in Figure 2 (the deformation was largest in the midspan of the test beam), it could be considered as cracks appeared in the beam, loading was terminated, then the cracking capacity (Fcr) (the load corresponding to the cracking moment) was determined according to the applied previous level of load.
Based on the load-deflection curves shown in Figure 2, it can be seen that when the applied loads were 3.33 kN and 8.55 kN, there was an obvious inflection point with a sudden rising deflection in the load-deflection curve at the midspan of the RC beam and the BFRC beam. The cracking capacity (Fcr) was determined according to the applied previous level of load, which was 2.85 kN and 8.08 kN, respectively. Thus it can be concluded that the cracking capacity of the beam can be obviously improved by adding BF into concrete.
Table 2 shows the nomenclature and the relevant applied loads. Beam LB referred to the beam that was produced by concrete with BFs and beam LC referred to the beam that was produced by ordinary concrete. According to the measured cracking capacity Fcr, two different flexural loads (50% Fcr and 80% Fcr) were applied to the test beams, with an anchor drawing instrument. The magnitude of the applied load is shown in Table 2.
The main climatic parameters in the artificial climate simulation environment were designed based on those in the field downstream estuary of Qiantang River. According to the China Meteorological Data in site [19], the average air temperature and relative humidity were 16.78 °C and 78.23% in Spring, 26.54 °C and 79.86% in Summer, 16.89 °C and 79.86% in Autumn and 5.87 °C and 74.94% in Winter.
After the standard curing of 28 days, epoxy resin was used to coat the side faces of the four test beams to ensure the unidirectional chloride penetration, i.e., chloride transports in the top and bottom surface of specimens. After the hardening of the epoxy resin, all the tested beams were exposed to the artificial simulated climate box, which included 2 h sprayed with 5% NaCl solution, followed by 46 hours of drying for exposing each 48 h. The total exposure time was 80 d. In the artificial climate simulation experiment, to achieve an accelerated effect, four environmental conditions were set to simulate the four seasons, moreover, the simulated temperature was set as approximately twice the average temperature of one season in the natural tidal environment. The temperature and humidity were kept constant in a 48 h cycle, and were changed in the next cycle according to the predefined parameters in Table 3. Thus, an 8 d exposure time in the simulated environment was used to simulate a four-season cycle in the natural marine environment. Moreover, the exposure time of 80 d was equivalent to 10 complete cycles in the simulated environment.

2.3. Chloride Concentrations Measure Method

After the four test beams were exposed for 80 d under the above-mentioned simulated environmental conditions, two cores (Core sample A and B in Figure 1) with a diameter of 30 mm from the pure bending section of each beam were drilled to reduce the randomness caused by material and test errors. Therefore, the free chloride concentration at the corresponding depth of the test beam was the average value of two measured data obtained from the core samples A and B. The detailed measure procedure of chloride concentrations can be found in our previous paper [20]. The test equipment was Thermo Scientific Orion Dual Star pH/ISE/mV meter with an accuracy of 0.05% Parts Per Million (PPM). According to the reading of the meter, the free chloride ion concentration expressed by the mass percentage of chloride to concrete can be calculated. The detailed steps can be found in our previous literature [20].

2.4. Calculation Model for Chloride Diffusion Coefficients in Concrete under Flexural Loads

Zhang et al. [17] proposed the model for calculating the chloride concentrations in concrete at different depths under flexural loads. The detailed derivation process is not covered in this paper.
Tension   zone : C ( x , t ) = C 1 [ 1 erf ( x x 1 2 D 0 ,   ref ( 1 + k 1 M x t ,   i I 0 f t + k 2 ( M x t ,   i I 0 f t ) 2 + k 3 ( M x t ,   i I 0 f t ) 3 ) t ref m t 1 m ) ]
Compression   zone : C ( x , t ) = C 1 [ 1 erf ( x x 1 2 D 0 ,   ref ( 1 + k 1 | M x c ,   i | I 0 f c + k 2 ( | M x c ,   i | I 0 f c ) 2 + k 3 ( | M x c ,   i | I 0 f c ) 3 ) t ref m t 1 m ) ]
where C 1 is the peak value of free chloride concentration in concrete, i.e., the measured concentration at the interface of convection zone and stable diffusion zone (%), x 1 is the convection zone depth ( mm ), x is the distance from the surface of the concrete samples ( mm ), D 0 ,   ref is the apparent chloride diffusion coefficient at the reference exposure time t ref without stress state ( m 2 / s ), t is the exposure time (d), M is the bending moment of the beam section ( kN m ), x t ,   i and x c ,   i are the distance from the neutral axis in tensile and compressive concrete, respectively ( mm ), I 0 is the moment of inertia ( m 4 ), k 1 , k 2 and k 3 are constants, depending on the forms of force and exposure conditions, f t and f c are the tensile and compressive strength of concrete ( MPa ) and m is the age reduction factor of the apparent chloride diffusion coefficient, influenced by concrete constituents, ambient temperature and humidity, etc.
In addition, due to the fact that only one exposure time (80 d) was set in our manuscript, the chloride diffusion coefficient at 80 d exposure time was taken as D 0 ,   ref , i.e., the reference exposure time t ref = 80 d. Moreover, the time dependency of chloride diffusivity was ignored, thus the value of m was 0.
Substituting the chloride concentration at depth x and time t obtained from Equation (1) or Equation (2) into Fick’s second law, the chloride diffusion coefficients can be fitted, as shown in Equation (3):
C ( x , t ) t = D x ( C ( x , t ) x )
According to China’s standard (CECS: 220-2007) [21], the chloride diffusion coefficients D in concrete can be determined, as shown in Equation (4):
D = x 2 × 10 6 4 t [ erf 1 ( 1 C ( x , t ) / C s ) ] 2
where C ( x , t ) is the chloride concentration at depth x and time t , C s is the surface chloride concentration in concrete and erf ( x ) is the error function, erf ( x ) = 2 π 0 x e t 2 d t .
Moreover, by considering the influence of the convection zone, the chloride diffusion coefficients should be expressed as follows:
D = ( x x 1 ) 2 × 10 6 4 t [ erf 1 ( 1 C ( x , t ) / C 1 ) ] 2

3. Theoretic Analytical Methods

3.1. Life Cycle Assessment (LCA)

LCA [14] can evaluate the environmental burdens of products quantitatively by four steps, including (1) goal and scope definition; (2) life cycle inventory (LCI); (3) life cycle impact assessment (LCIA); and (4) interpretation.

Goal and Scope Definition

Goal and scope definition can describe the product system in terms of system boundary and functional unit [14,22]. It is vital to select the functional unit adequately since, for the same product systems, different evaluation results may be generated according to the selected functional units [23,24]. In this research, we aimed to quantify and compare the sustainability of concrete beams with/without BF. Damineli et al. [25] indicated that the sustainability of concrete can be defined by environmental loads imposed to deliver one unit functional performance, the performance can be measured by compressive strength, carbonation resistance and other relevant indicators. It is well known that cracks can facilitate the transport of gases and water, which is important for structures subjected to water/vapor pressure [26]. Similarly, cracks provide easy paths for chloride penetration, for cracks with a width exceeding 0.10 mm. Chloride transport in the cracks of the concrete sample is similar to that in liquid [27]. Therefore, the cracking capacity is important since it is necessary to check crack width when the limit state of serviceability of a structure is computed. An improved cracking capacity can delay the appearance of cracks in RC structures, and eventually influences the chloride transport into concrete [28]. Thus, the cracking capacity should be chosen as an important indicator to analyze the sustainability of the RC beam. Müller et al. [29] insisted that the durability of concrete structures should count as an indispensable input to calculate the sustainability of concrete or concrete structures. In the chloride environment, the chloride diffusion coefficient can be considered as a durability indicator of RC structures. Therefore, to analyze the effect of the cracking capacity and chloride diffusion coefficient on the sustainability of the concrete beam, four different functional units were chosen: (1) the volume of concrete beam; (2) the cracking capacity of concrete beam; (3) the depth-dependent chloride diffusion coefficient of concrete beam; and (4) the combination of the cracking capacity and the chloride diffusion coefficient. Moreover, the reasons that a higher cracking capacity and a lower chloride diffusion coefficient are beneficial to the sustainability of concrete structures were considered in setting functional units (FUs). A smaller value of FU means a better environmental impact. Table 4 shows the adopted FUs in this paper. In Table 4, Ei refers to the energy consumption of 1 m3 concrete with/without BF, Vi denotes the volume of the concrete beam with/without BF and Fcr,i and Di denote the cracking capacity and the chloride diffusion coefficient, respectively.

3.2. Life Cycle Inventory and Impact Assessment

To calculate the magnitude and source of energy consumption, the decomposition method was adopted. The transport of each constituent was not incorporated in the LCA since the raw materials of concrete with/without BF were nearly identical, except BF whose addition could be negligible. In addition, the quantities of the reinforcement bar in the concrete member were the same, thus the environmental impact of the reinforcement bar was not considered. Thus, energy consumption in the raw material production stage of the concrete member was solely considered, as calculated in the following:
E = i = 1 n ( Q i × ξ i )
where Q i is the unit weight of raw material i and ξ i is the energy consumption factor of ith raw material.
Table 5 shows the energy consumption factor of raw materials.

4. Results and Discussion

4.1. Related Parameters Profile of Chloride Diffusion

4.1.1. Free Chloride Ion Concentration in Concrete

It is well known that chloride penetration is much easier in the tensile concrete zone than that in the compressive concrete zone, since cracks are prone to occur in the tensile zone under loads in concrete beams. Therefore, this paper only studied the chloride transport in tensile concrete by taking the influence of the depth-dependent stress state on the chloride diffusivity of concrete into consideration. After reaching the expected exposure time (80 d), the samples were taken back to the laboratory to conduct the corresponding tests. First of all, two cores from the pure bending section of each beam were drilled, then, the free chloride concentrations at different depths were measured and the average free chloride concentrations of two cores at each depth were determined, as shown in Figure 3.
It can be seen from Figure 3 that when the applied load level was 50% Fcr, after exposing for 80 d, no convection zone could be observed in the tensile zone of the BFRC beam. However, under other circumstance, there was an obvious convection zone in the tested concrete. When the applied load level was 50% Fcr, the depth of convection zone x 1 in the RC beam was 6.00 mm, and the corresponding peak value of chloride ion concentration C 1 was 0.13%. For the 80% Fcr load level, the values of x 1 and C 1 were 8.00 mm/6.00 mm and 0.18%/0.17% in the BFRC/RC beams, respectively. Therefore, it can be seen that the appearance of the convection zone was influenced by the concrete constituents and external load. In the stable diffusion zone, the free chloride concentrations increased with flexural loads at the same depth. Besides, the addition of BF had a reduction (aggravation) effect on free chloride concentration with 50% (80%) Fcr.

4.1.2. Chloride Diffusion Coefficients in Concrete

From Equation (5), it can be seen that if the convection zone depth x 1 and the peak value of chloride concentration C 1 are known, and for a certain exposure time t, according to the measured free chloride concentration at different depth C ( x , t ) , the corresponding chloride diffusion coefficients (D) can be calculated. The corresponding calculation results for the chloride diffusion coefficient of concrete in the tensile zone at different depths under different flexural loads of the test beam can be calculated, as shown in Table 6. It can be observed that the chloride diffusion coefficient increases with the applied load level. In addition, regardless of the applied load level, the average value of the chloride diffusion coefficient of the concrete beam with BF (LB) is larger than that of LC. The reasons that the chloride diffusion coefficient of the concrete beam with BF (LB) is larger than that of LC may be attributed to the following. According to previous research, at an early exposure time, the addition of BF may increase the quantity of harmful pores, which is closely related to chloride diffusion. In our test, the exposure age was 80 d, which can be considered as an early age. In addition, some internal micro cracks may be introduced during the hardening of cementitious materials when adding BF into concrete, resulting in weaker interfaces.

4.2. Energy Consumption of Concrete Member with/without BF under Different Stress Levels

According to Equation (6), the energy consumption of 1 m3 concrete with/without BF can be calculated, as shown in Figure 4.
From Figure 4, it can be observed that when adding extra BF into concrete to produce 1 m3 concrete, concrete with BF (857.67 MJ/m3) consumed slightly more energy than ordinary concrete (852.45 MJ/m3). Moreover, cement accounted for the majority of the energy consumption of the concrete. Similarly, the energy consumption of the BFRC beam (14.15 MJ) was slightly higher than that of the RC beam (14.07 MJ), since the geometric sizes between the BFRC beam and the RC beam were similar. The main reason can be attributed to the fact that only 0.10% BF was added, although the energy required for BF production is extremely high, nearly eight times that for cement production.
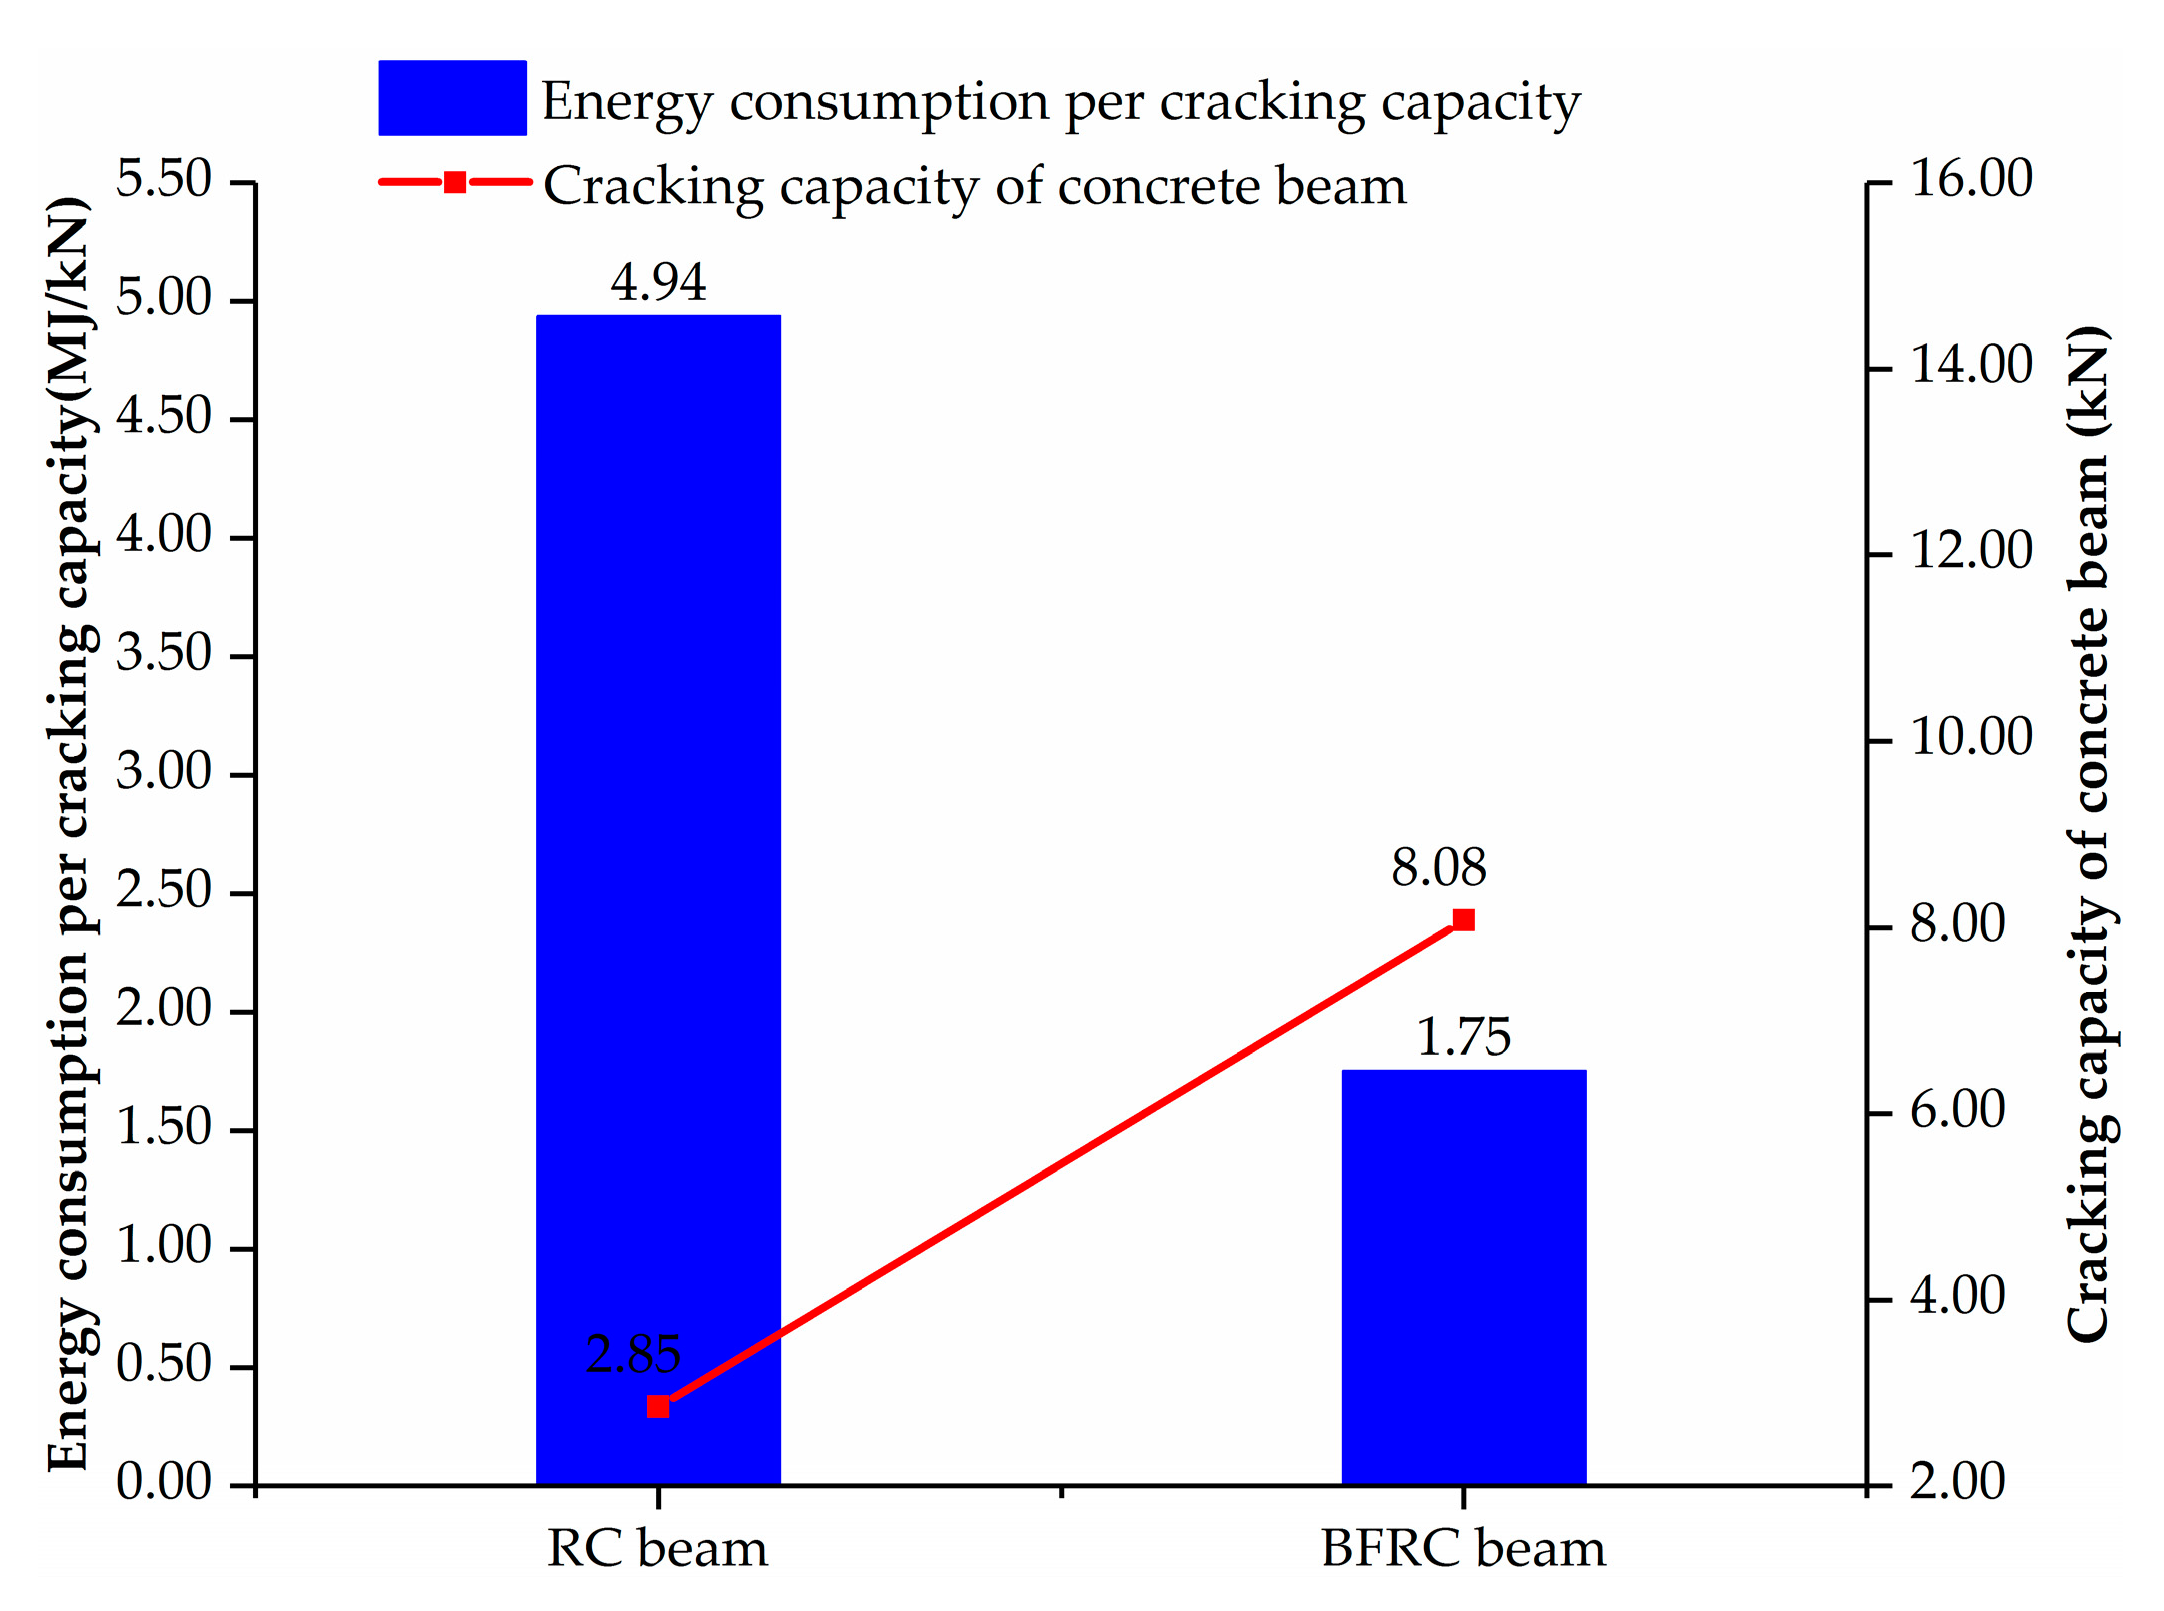
According to the preset FU2, the sustainability of the concrete beam can be calculated by considering the effect of the cracking capacity. The result was expressed by energy consumption per unit cracking capacity of the beam, as shown in Figure 5. As mentioned above, adding BF into concrete can obviously improve the cracking capacity of the concrete beam. Hence, although the energy consumption of the BFRC beam was slightly higher than that of the RC beam, the energy consumption per cracking capacity of the BFRC beam was far less than that of the RC beam.
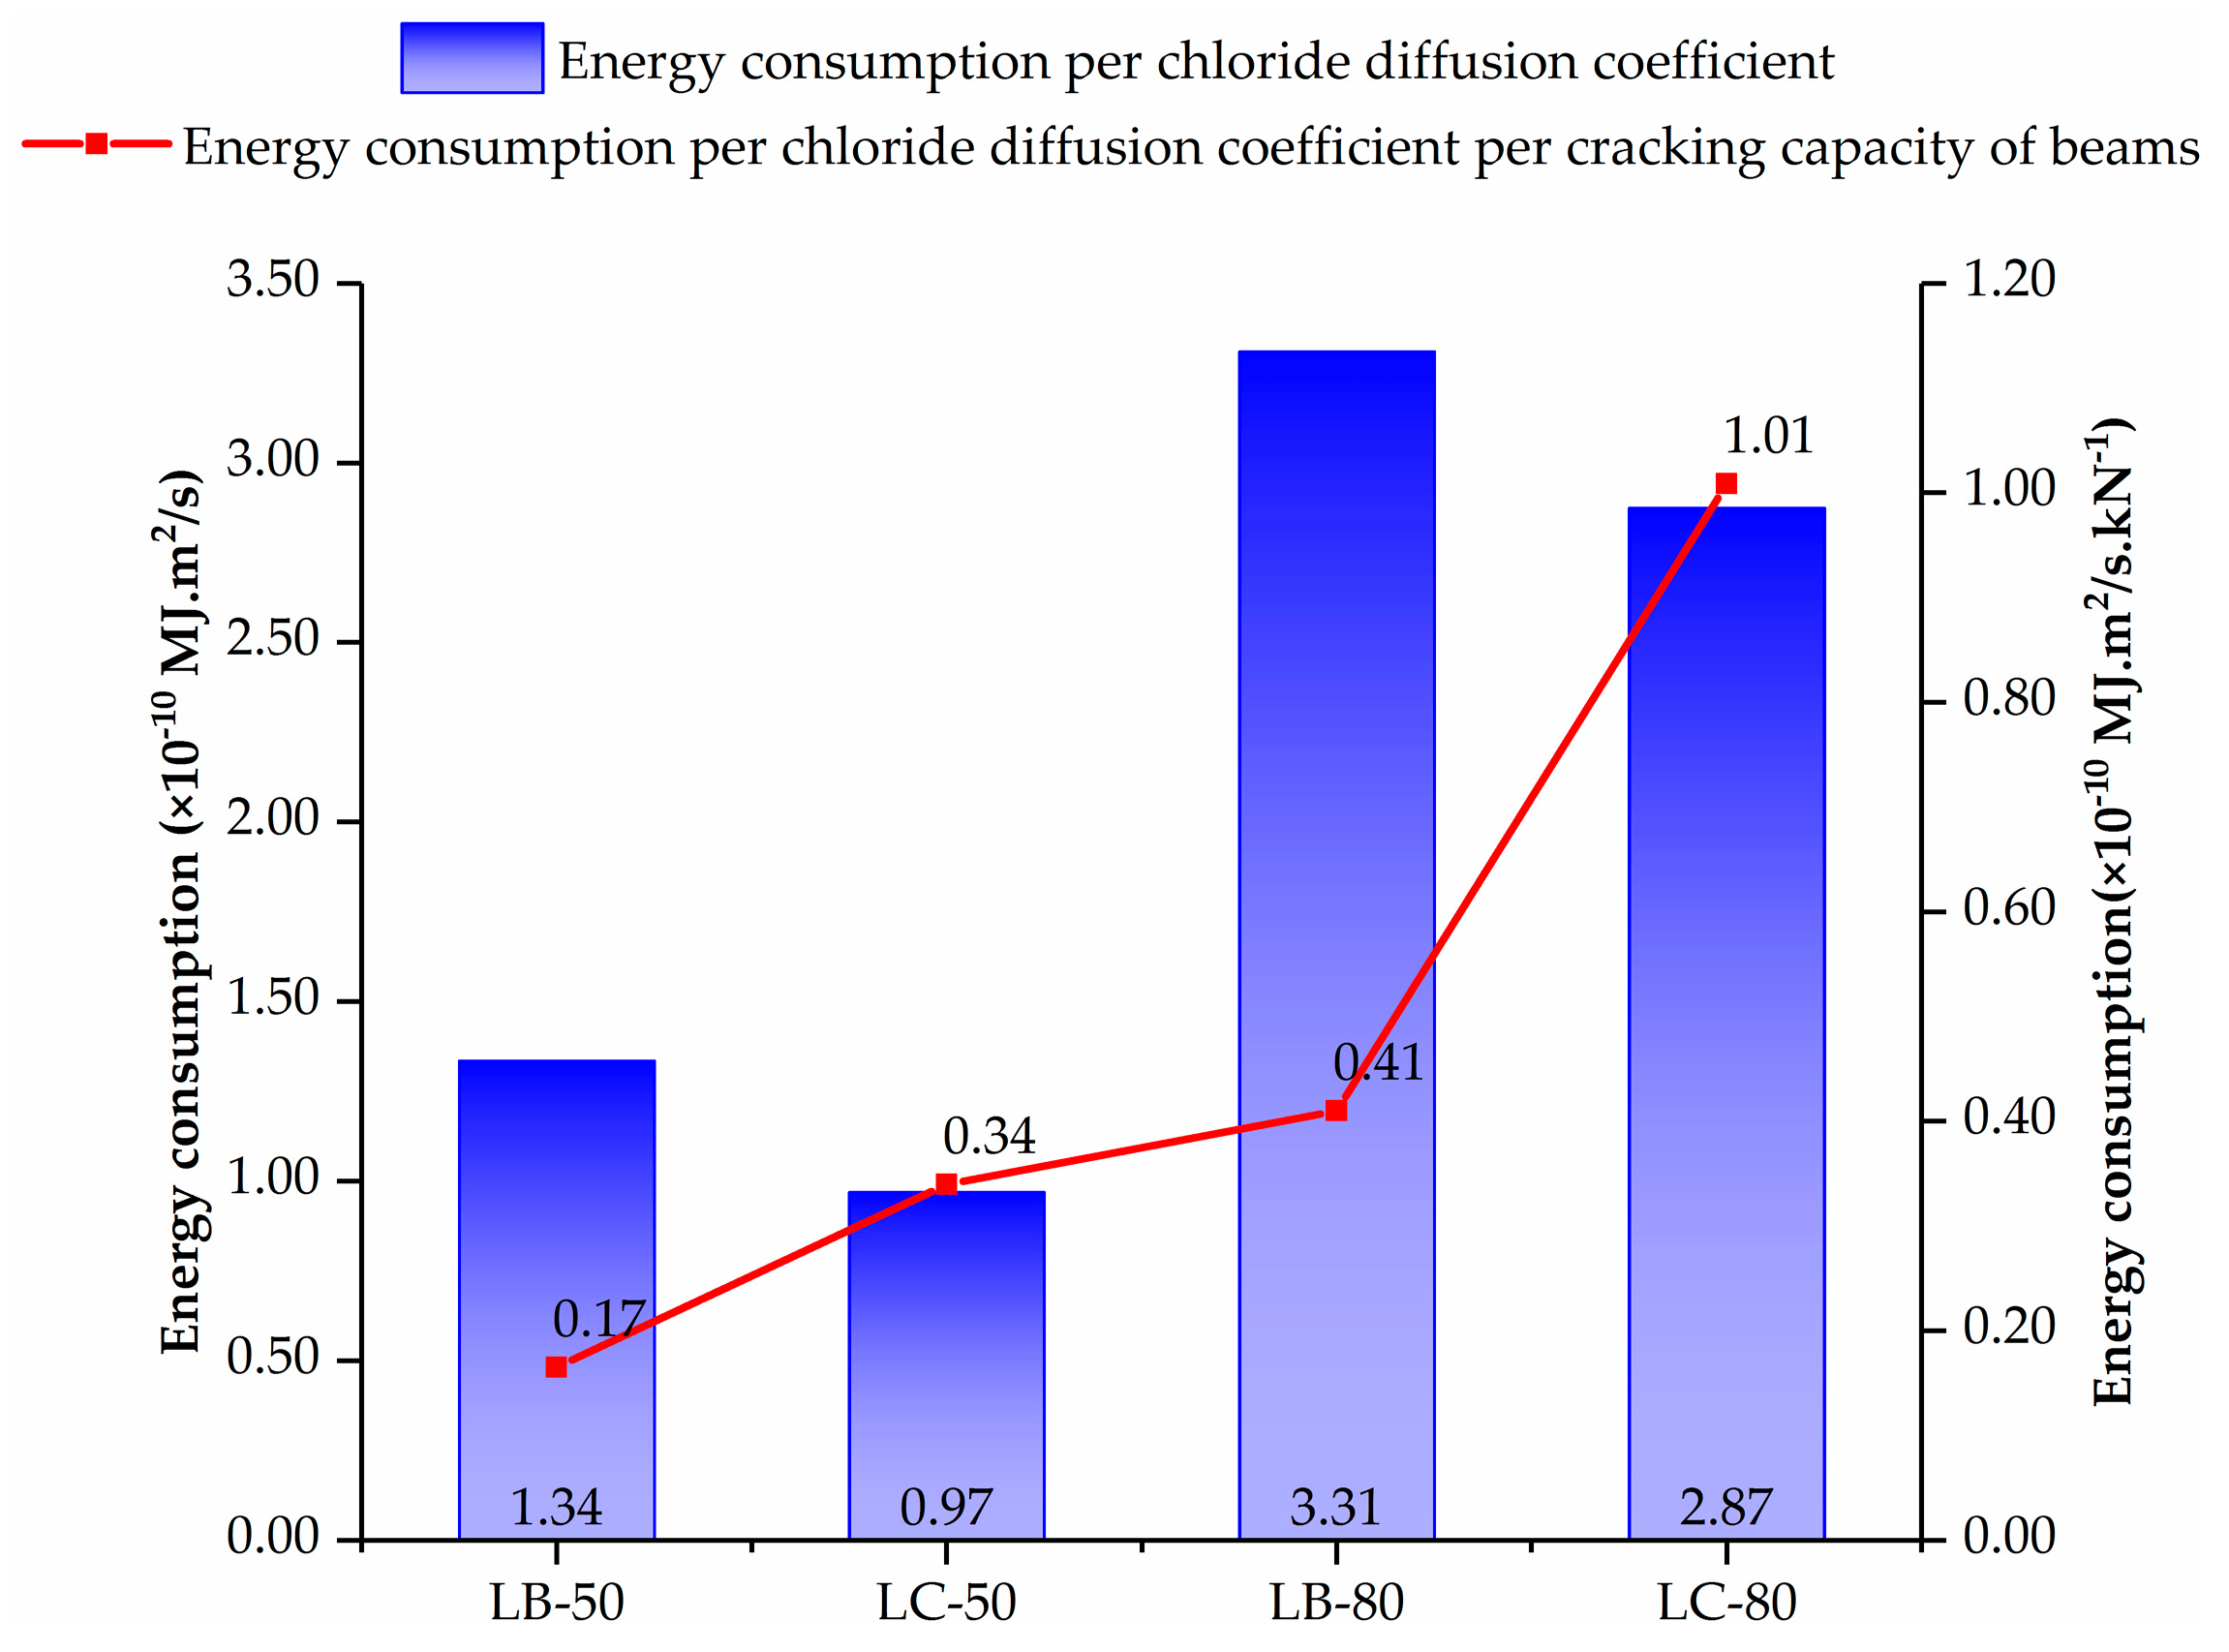
Based on the fitted chloride diffusion coefficient, calculation results on preset FU3 and FU4 can be obtained, as shown in Figure 6. It can be observed that energy consumption per chloride diffusion coefficient of the BFRC beam was larger than that of the RC beam, regardless of the applied stress level. However, an opposite result can be observed in energy consumption per chloride diffusion coefficient per cracking capacity. In addition, energy consumption per chloride diffusion coefficient and energy consumption per chloride diffusion coefficient per cracking capacity of beams both increased with stress level, indicating an adverse effect of stress on the calculation results.

5. Conclusions and Limitations

5.1. Conclusions

This paper carried out a sustainability analysis of test beams with/without BF by taking the cracking capacity and the chloride diffusion coefficient into consideration. Chloride diffusivity was determined by considering the effect of stresses at different depths, which is noteworthy for the real structures subject to the external loads in the chloride environment. Besides, four different functional units were proposed in the sustainability analysis. The following conclusions can be drawn:
(1) Adding BF into concrete can improve the cracking capacity of the RC beam effectively. However, the average chloride diffusion coefficient of the BFRC beam is larger than that of the RC beam, regardless of the applied load level. In addition, the chloride diffusion coefficient increases with the applied load level.
(2) The selected functional units have significant influences on the final assessment results of the studied beams. When taking the cracking capacity into consideration, i.e., for the functional units of energy consumption per cracking capacity (FU2) as well as energy consumption per chloride diffusion coefficient per cracking capacity (FU4), adding BF into concrete is a suitable solution to improve the sustainability of RC beams.

5.2. Limitations

Some limitations still exist, as shown in the following:
(1) Only 0.10% BF is added into concrete, making it difficult to support decision making for the optimal addition of BF. In future studies, relevant experiments on concrete beams with different BF additions should be conducted.
(2) In this paper, a sole indicator (energy consumption) was considered to evaluate the sustainability of concrete beams with/without BF, due to the incomplete inventory data. With the well-established life cycle inventory, the environmental impact with various indicators, such as global warming potential (GWP), acidification and ozone depletion, etc., should be evaluated. Moreover, the inventory data from different researchers was used in this paper [16,30,32]. As it is well known, due to the existence of uncertainty in inventory data, its quality can influence the final LCA assessment results significantly [33,34]. In future research, it is necessary to address data uncertainty in LCA analysis by scenario analysis and/or the Monte Carlo (MC) simulation method.

Author Contributions

Conceptualization, Y.Z. and J.Z.; methodology, Y.Z.; software, C.M.; validation, Y.Z., C.M., J.W., H.L., Y.G. and J.Z.; formal analysis, C.M.; investigation, J.W.; resources, Y.Z., Y.G. and J.Z.; data curation, H.L.; writing—original draft preparation, Y.Z. and J.Z.; writing—review and editing, Y.Z., C.M. and J.Z.; visualization, H.L.; supervision, Y.Z. and J.Z.; project administration, Y.Z.; funding acquisition, J.Z. All authors have read and agreed to the published version of the manuscript.

Funding

This research was funded by the Natural Science Foundation of Zhejiang Province, grant number LQ18G010007, LY19E090006 and LY17E090007; the National Natural Science Foundation of China, grant number 50879079 and 51279181.

Conflicts of Interest

The authors declare no conflict of interest.

References

  1. Fiore, V.; Scalici, T.; Di Bella, G.; Valenza, A. A review on basalt fibre and its composites. Compos. Part B Eng. 2015, 74, 74–94. [Google Scholar] [CrossRef]
  2. Ramakrishnan, V.; Panchalan, R.K. A new construction Material-Non-corrosive basalt bar reinforced concrete. Spec. Publ. 2005, 229, 253–270. Available online: https://www.concrete.org/publications/internationalconcreteabstractsportal/m/details/id/14741 (accessed on 1 October 2019).
  3. Elshafie, S.; Whittleston, G. A Review of the Effect of Basalt Fibre Lengths and Proportions on the Mechanical Properties of Concrete. Int. J. Res. Eng. Technol. 2015, 4, 458–465. [Google Scholar]
  4. Katkhuda, H.; Shatarat, N. Improving the mechanical properties of recycled concrete aggregate using chopped basalt fibers and acid treatment. Constr. Build. Mater. 2017, 140, 328–335. [Google Scholar] [CrossRef]
  5. Zhang, H.; Wang, B.; Xie, A.; Qi, Y. Experimental study on dynamic mechanical properties and constitutive model of basalt fiber reinforced concrete. Constr. Build. Mater. 2017, 152, 154–167. [Google Scholar] [CrossRef]
  6. Mehta, P.K. Durability of concrete-fifty years of progress. ACI Spec. Publ. 1991, 126, 1–32. Available online: https://www.concrete.org/publications/internationalconcreteabstractsportal/m/details/id/1998 (accessed on 1 October 2019).
  7. Suryavanshi, A.K.; Swamy, R.N.; Cardew, G.E. Estimation of diffusion coefficients for chloride ion penetration into structural concrete. Mater. J. 2002, 99, 441–449. [Google Scholar]
  8. Zhu, H. Experimental Study on Durability of Basalt Fiber Concrete. Master’s Thesis, Wuhan University of Technology, Wuhan, China, 2009. Available online: http://cdmd.cnki.com.cn/Article/CDMD-10497-2009102680.htm (accessed on 1 October 2019). (In Chinese).
  9. Ghahari, S.A.; Ramezanianpour, A.M.; Esmaeili, M. An Accelerated Test Method of Simultaneous Carbonation and Chloride Ion Ingress: Durability of Silica Fume Concrete in Severe Environments. Adv. Mater. Sci. Eng. 2016, 2016, 1–12. Available online: https://www.hindawi.com/journals/amse/2016/1650979/ (accessed on 1 October 2019). [CrossRef] [Green Version]
  10. Al-Kutti, W.A.; Rahman, M.K.; Shazali, M.A.; Baluch, M.H. Enhancement in Chloride Diffusivity due to Flexural Damage in Reinforced Concrete Beams. J. Mater. Civ. Eng. 2014, 26, 658–667. [Google Scholar] [CrossRef]
  11. Wu, J.; Li, H.; Wang, Z.; Liu, J. Transport model of chloride ions in concrete under loads and drying-wetting cycles. Constr. Build. Mater. 2016, 112, 733–738. [Google Scholar] [CrossRef]
  12. Wang, H.; Lu, C.; Jin, W.; Bai, Y. Effect of External Loads on Chloride Transport in Concrete. J. Mater. Civ. Eng. 2011, 23, 1043–1049. [Google Scholar] [CrossRef]
  13. Wang, Y.; Lin, C.; Cui, Y. Experiments of Chloride Ingression in Loaded Concrete Members under the Marine Environment. J. Mater. Civ. Eng. 2014, 26, 04014012. [Google Scholar] [CrossRef]
  14. International Standard Organization (ISO). ISO 14040-Environmental Management-Life Cycle Assessment-Principles and Framework; International Organization for Standardization: Geneva, Switzerland, 2006; Available online: https://www.iso.org/standard/37456.html (accessed on 1 October 2019).
  15. Jamshaid, H.; Mishra, R. A green material from rock: basalt fiber—A review. J. Text. Inst. Proc. Abstracts 2016, 107, 923–937. [Google Scholar] [CrossRef]
  16. De Fazio, P. Basalt fibra: from earth an ancient material for innovative and modern application. Energia, Ambiente Innovazione 2011, 3, 89–96. Available online: https://www.researchgate.net/publication/298105370_Basalt_fiber_From_earth_an_ancient_material_for_innovative_and_modern_application (accessed on 1 October 2019).
  17. Zhang, J.; Zheng, Y.; Wang, J.; Zhang, Y.; Gao, Y. Chloride Transport in Concrete under Flexural Loads in a Tidal Environment. J. Mater. Civ. Eng. 2018, 30, 04018285. [Google Scholar] [CrossRef]
  18. GB/T 50152–2012. Standard for Test Method of Concrete Structures. 2012. Available online: http://www.mohurd.gov.cn/wjfb/201203/t20120326_209263.html (accessed on 1 October 2019).
  19. China Meteorological Data, Qiantang River Weather. Available online: http://www.weatherr40d/101210305.shtml (accessed on 1 March 2019).
  20. Gao, Y.-H.; Zhang, J.-Z.; Zhang, S.; Zhang, Y.-R. Probability distribution of convection zone depth of chloride in concrete in a marine tidal environment. Constr. Build. Mater. 2017, 140, 485–495. [Google Scholar] [CrossRef]
  21. China Association for Engineering Construction Standardization (CECS). Standard for Durability Assessment of Concrete Structures; CECS: Beijing, China, 2007; Available online: http://www.cecs.org.cn/a/infos/xiehuibiaozhun/2013/0921/619.html (accessed on 1 October 2019). (In Chinese)
  22. International Standard Organization (ISO). ISO 14044: Environmental Management-Life Cycle Assessment-Requirements and Guidelines; International Organization for Standardization: Geneva, Switzerland, 2006; Available online: https://www.iso.org/standard/38498.html (accessed on 1 October 2019).
  23. Hischier, R.; Reichart, I. Multifunctional electronic media-traditional media: The problem of an adequate functional unit. Int. J. Life Cycle Assess. 2003, 8, 201–208. [Google Scholar] [CrossRef] [Green Version]
  24. Kim, S.; Dale, B. Ethanol Fuels: E10 or E85—Life Cycle Perspectives. Int. J. Life Cycle Assess. 2006, 11, 117–121. [Google Scholar] [CrossRef]
  25. Damineli, B.L.; Kemeid, F.M.; Aguiar, P.S.; John, V.M. Measuring the eco-efficiency of cement use. Cem. Concr. Compos. 2010, 32, 555–562. [Google Scholar] [CrossRef]
  26. Picandet, V.; Khelidj, A.; Bellegou, H. Crack effects on gas and water permeability of concretes. Cem. Concr. Res. 2009, 39, 537–547. [Google Scholar] [CrossRef] [Green Version]
  27. Peng, J.; Hu, S.; Zhang, J.; Cai, C.; Li, L.-Y. Influence of cracks on chloride diffusivity in concrete: A five-phase mesoscale model approach. Constr. Build. Mater. 2019, 197, 587–596. [Google Scholar] [CrossRef]
  28. Chen, L. The Study on Chloride Corrosion and Bending Cracking Performance of CRC Reinforced Concrete Beams. Master’s Thesis, Tianjin University, Tianjin, China, 2009. Available online: http://cdmd.cnki.com.cn/Article/CDMD-10056-2010090595.htm (accessed on 1 October 2019). (In Chinese).
  29. Müller, H.S.; Haist, M.; Vogel, M. Assessment of the sustainability potential of concrete and concrete structures considering their environmental impact, performance and lifetime. Constr. Build. Mater. 2014, 67, 321–337. [Google Scholar] [CrossRef]
  30. Gu, L. Research on Environmental Impact of China Construction Industry Based on Life Cycle Assessment. Doctoral Dissertation, Tsinghua University, Beijing, China, 2009. Available online: http://cdmd.cnki.com.cn/Article/CDMD-10003-2010214944.htm (accessed on 1 October 2019). (In Chinese).
  31. Oss, H.G.; Padovani, A.C. Cement Manufacture and the Environment Part II: Environmental Challenges and Opportunities. J. Ind. Ecol. 2003, 7, 93–126. [Google Scholar] [CrossRef] [Green Version]
  32. Wang, S. Study on life Cycle Environmental Impact Assessment of Commercial Concrete. Master’s Thesis, Tsinghua University, Beijing, China, 2009. Available online: http://cdmd.cnki.com.cn/Article/CDMD-10003-2010215358.htm (accessed on 1 October 2019). (In Chinese).
  33. Huijbregts, M. Uncertainty and variability in environmental life-cycle assessment. Int. J. Life Cycle Assess. 2001, 7, 173. [Google Scholar] [CrossRef] [Green Version]
  34. Weidema, B.P.; Wesnæs, M.S. Data quality management for life cycle inventories—An example of using data quality indicators. J. Clean. Prod. 1996, 4, 167–174. [Google Scholar] [CrossRef]
Figure 1. Schematic diagram of test beam.
Sustainability 12 01054 g001
Figure 2. Load-deflection curves at the midspan tension of the test beam.
Sustainability 12 01054 g002
Figure 3. Average free chloride ion concentration at each depth in tensile concrete zone after 80 d of exposure time.
Sustainability 12 01054 g003
Figure 4. Energy consumption of 1 m3 concrete and test beams.
Sustainability 12 01054 g004
Figure 5. Cracking capacity and energy consumption per cracking capacity of concrete beams.
Sustainability 12 01054 g005
Figure 6. Energy consumption per chloride diffusion coefficient and energy consumption per chloride diffusion coefficient per cracking capacity.
Sustainability 12 01054 g006
Table 1. Mix proportion of tested concrete (kg·m−3).
No.CementSandGravelWaterBF28 d Compressive Strength (MPa)
ProportionMass
C316.70596.501269.10190.00//18.80
B316.70596.501269.10190.000.10%0.2920.10
Note: C and B refer to ordinary concrete and concrete with Basalt fiber (BF), respectively.
Table 2. Nomenclature and applied loads on the tested beams.
No.Load Level/%Load F/kNNo.Load Level/%Load F/kN
LC-80802.28LB-80806.46
LC-50501.43LB-50504.04
Note: F is the load applied to the test beams.
Table 3. Design parameters in the artificial simulated environment.
Simulation EnvironmentSpringSummerAutumnWinter
Temperature (°C)34533412
Relative humidity (%)78808075
Table 4. Adopted functional units ( F U s ).
No. F U 1
(MJ)
F U 2
(MJ/kN)
F U 3
(×10−10 MJ·m2/s)
F U 4
(×10−10 MJ·m2/s·kN−1)
Detailed description E i × V i E i × V i F max , i E i × V i × D i E i × V i × D i F m a x , i
Table 5. Energy consumption factor of raw materials (MJ/t).
Raw MaterialCement [30]BF [16]Coarse Aggregate Fine Aggregate [31]Water [32]
ξ i 2358.0218,000.0050.0070.002.40
Table 6. Chloride diffusion coefficients in concrete at different depths after 80 d of exposure time (×10−12 m2/s).
Distance from the Surface of the Tensile Zone of Test Beam (mm)
No.0246810
LC-50////5.673.85
LB-50//14.667.258.867.38
LC-80////17.2414.09
LB-80/////14.27
No.1214161820Average
LC-504.855.638.198.8711.126.88
LB-507.928.719.1410.6910.359.44
LC-8018.4123.8021.5422.6625.2720.43
LB-8020.4925.0828.3524.6227.5623.39