Abstract
Cultural firms are an important development factor in economic and social terms. Their objectives are often aimed at maintaining and disseminating the traditions and values of societies. The prosperity of these firms in a nation ensures that its tangible and intangible cultural heritage is made known to other nations and generations. Despite their importance, little is known about their survival and the factors associated with it. This paper analyses data from 6951 Spanish firms, of which 2105 are cultural firms. We have studied the survival of non-cultural firms in comparison with cultural firms and also the impact that profitability, solvency and indebtedness may have on their survival. We have used the Kaplan–Meier method in order to assess their survival and the Harrington–Fleming test and the Cox regression model to check the statistical significance of variables. These variables are key factors influencing the survival of cultural enterprises. Particularly, low solvency in firms increases by twenty the risk of disappearance. This paper contributes to literature highlighting some of the key factors for the survival of cultural enterprises. It provides administrations with a roadmap in order to implement measures for the promotion of the cultural industry, favouring the process of enhancement of cultural heritage.
1. Introduction
The cultural and creative industry (henceforth cultural firms/enterprises) is a main actor in the labour market and a major contributor to regional and national gross domestic product (GDP). This industry is increasingly recognised around the world for its great growth potential [1,2,3] and its impact on territorial wealth [4,5,6]. Moreover, according to the European Commission, such firms become key drivers of creativity and economic and social innovation in other sectors [7]. For this reason, cultural firms constitute a strategic industry in Europe, where some of them are world leaders and competitive exporters in a wide range of fields. The EU trade balance for cultural goods grew from EUR 6.3 billion in 2012 to EUR 8.6 billion in 2017. Furthermore, in 2018, there were 8.7 million people in cultural employment across the EU-28 (3.8% of all employment) [8].
This industry has a very particular characteristic associated with its business models that makes it more fragile than other industries. In the case of cultural firms, it is difficult to predict the value of use in advance as they are subject to high levels of novelty [9]. Save for a few exceptions, traditional methods make no allowance to determine a price for cultural products [10,11]. In many cases, the valuation of cultural products is determined by their uniqueness or prototype characteristics; if their originality is involved [12,13], the prototype of a cultural product itself becomes the end product, thereby raising the risk of failure of the company offering it [14].
Another particularity of cultural firms refers to their costs and sustainability. The existence of sunk costs (hours of rehearsal in performances or song recordings, for example) and the ongoing increasing costs of these industries, called “cost illness” [15], have traditionally led researchers to assume productivity was scarce [15,16]. Therefore, the sustainability of these firms is assumed to be mainly associated with contributions made by public or private patrons, and the parameters to design business policies may consider these particularities to minimize the weakness of cultural firms.
Despite the growing importance of cultural firms, little is known about their survival and the associated factors. Some studies have analysed separately the effect of specific factors in specific cultural sub-sectors, for example, the length of performance runs on stage, initial income from the box office, and nominations for prizes in firms that are active in music, theatre or cinema [17,18]. But there are few studies that have analysed all the firms in the cultural sector in a comprehensive manner.
Several studies related to the survival of manufacturing firms have found it is associated with size, innovation, profitability, solvency, indebtedness and subsidies, among others. For instance, Segarra and Castejón [19] point out that innovation and technological progress is significantly associated with the survival of Spanish manufacturing firms. Correa et al. [20] and Mateut et al. [21] focused on the impact of solvency in the Spanish case. Delmar et al. [22] found that the profitability of Swedish firms is the main factor associated with their survival and growth. Guimaraes [23] analyzed the effect of indebtedness in small enterprises in Brazil; Pellegrini and Muccigrosso [24] and Shin [25] analysed the effect of subsidies in the survival of Italian and Korean firms, respectively. Analyses of these or other factors related to the survival of cultural enterprises are scarce or practically non-existent.
Unquestionably, studies on the survival of firms are essential. They should study what factors are making these firms enter or exit the market and evaluate the impact of business dynamics on productivity growth. In fact, several studies related to the survival of firms have found it is associated with profitability, solvency and indebtedness, among others [23,26]. However, as the cultural industry was not previously analysed in this regard, this study aims to provide a comparative analysis between cultural and non-cultural firms, providing empirical evidence of the variables that determine the survival of cultural firms in Spain. Profitability, solvency and indebtedness are the variables analysed and are used to study how they influence survival.
2. Methodology
In order to analyse what factors may affect the survival of cultural firms, the concept of the cultural firm is defined and the parameters that must be considered are described. We will describe the database used as well as the statistical methodology that allow us to carry out the analysis of the survival of cultural enterprises.
2.1. Definition of Cultural Firm
There is a wide variety of definitions for the cultural firm [27,28]. The European Commission [7] (p.6) defines them as those that produce and distribute goods or services that have an attribute, use or purpose that incorporates or transmits cultural expressions regardless of the value they can incorporate. The Department of Studies, Foresight and Statistics (DEPS in France) [29] (p. 7), dependent on the French Government, defined them as a set of economic activities that combine the functions of conception, creation and production with the industrial functions of large-scale manufacture and marketing, using physical or communication products. The Department for Culture, Media and Sport (DMCS) [30] (p. 5), in the United Kingdom, defines them as “those industries that have their origin in the individual creativity, skill and talent and that have a potential for wealth and employment creation through the generation and exploitation of intellectual property”. They are also seen as an industry that originates from creative or cultural accumulation through the formation and application of intellectual property and has the potential to enhance our living environment [31]. These definitions may be valid when undertaking research of the cultural sector because they are generic and cover a broad interdisciplinary field of activities.
In Spain, the National Institute of Statistics (INE), following the European statistical nomenclature, classifies economic activities and groups them according to the so-called CNAE code (National Economic Activities Classification). However, there is no specific code that brings together the wide range of activities within the cultural sector. The set of cultural activities is divided into different groups established in the CNAE.
Thus, for this paper, we will consider that cultural enterprises are those focusing on cultural, artistic and/or both tangible and intangible heritage activities. This includes activities relating to publishing, libraries, archives, museums, film activities, video, radio and television, shows, recorded music and other manifestations of intangible cultural heritage.
2.2. Parameters
According to the literature on firm duration mentioned in the previous section, there are a number of determining factors in the survival of firms. For our study, the indicator for the survival of the firms is their age. Therefore, the variable of interest is the age of the firms, defined as the time that elapses from their creation until their disappearance or until the moment at which the study is conducted if they continue to remain active in the market. We selected as explanatory variables of their survival, their economic profit, their solvency and their indebtedness. We opted to use accounting information, one of the main approaches used by the literature on the failure of firms [32,33].
Profitability is associated with survival [26,34,35]. According to Pérez Goróstegui [36], economic profitability is the profitability generated by each one of the company assets and it is calculated as the ratio of its gross profit to its total assets.
Solvency also has an impact [20,37,38]. The most solvent firms have the lowest risk of disappearing. Solvency is defined as the ability of the company to respond to its long-term debts. Solvency indicators are very good for predicting business failure and they often bring the prognosis forward by two or three years before this situation happens [20].
Finally, we considered that the debts are the proportion of debt a company supports against its own resources. Authors such as Mata et al. and Guimaraes [23,38] have analysed indebtedness. They find that moderate indebtedness offers greater protection to creditors in the event of insolvency. If the company has little indebtedness, an increase in debt has a positive impact on the survival of the company. Therefore, if there is already a high level of indebtedness, an increase in debt increases the probability of failure of firms, either because the ability of the company to meet the payment obligations of the debt is decreased, or because a highly leveraged company may be subject to predation by rival firms whose leverage is low.
The analysed firms are categorized considering their values for the accounting parameters: positive and negative profitability, low and high solvency, and low and high indebtedness.
2.3. Data Collection
The data used in this paper is a sample from the ARDÁN database. ARDÁN is a business information service that creates databases of firms from all sectors in Spain with economic information from the annual accounts: balance sheet, profit and loss account, annual report, statement of changes in equity and management report, filed with the Companies Registry.
For our research, we selected firms randomly using an automated procedure based on the generation of random numbers. The resulting sample comprises of a total of 6951 Spanish enterprises, being 4846 non-cultural companies and 2105 cultural companies according to the definition provided in the previous section. However, some firms of the sample were not finally considered for the study because relevant data was not available: the company status (e.g., winding-up process, creditors contest), age or accounting variables (company’s profitability, solvency and indebtedness). This uncompleted profile was verified for 1055 non-cultural firms and 699 cultural firms. Consequently, we analysed a total of 1406 cultural firms and 3791 non-cultural firms. Figure 1 shows the histogram of the age distribution of cultural firms. Most are about 20 years old, and few of them surpass 100 years old.
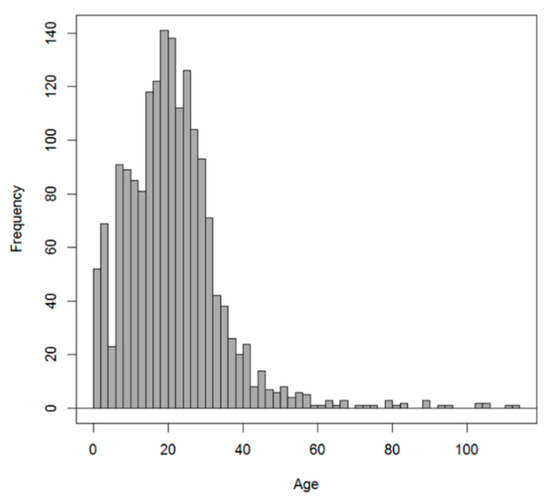
Figure 1.
Age distribution of the cultural enterprises.
Accounting information on the 2016 Annual Accounts of the mentioned enterprises is included in the database. We analysed the factors affecting the survival of cultural enterprises in this selected year.
2.4. Analysis
The exploitation of data has been made using the statistical package R. A summary for each variable is shown through a box plot. We then analysed the survival of firms using the statistical Kaplan–Meier method [39]. This model constructs a survival table that indicates the estimated probability of surviving over a given period, conditioned by the current age. The same table shows the firms’ age, the number of firms at risk, the number of firms that do not survive in that period, the probability of surviving in the given year, its standard error and confidence intervals at 95%. The graphical representation of this curve, through a step function, is the Kaplan–Meier survival curve.
In order to analyse in detail the accounting parameters in non-cultural firms and the effect of the considered categories on their survival, the Harrington–Fleming test [40] is used. This test has been specifically designed to compare survival curves. It allows the assessment of the effect of the considered factors on survival. The null hypothesis to be compared is that there is no difference between the survival curves of the categories of enterprises. A p-value under 0.05 indicates that the effect is statistically significant.
The impact of the considered accounting parameters in the survival of cultural firms in Spain is revealed by the Cox regression model [41]. This model estimates the hazard ratio (HR), which determines whether every analysed parameter has an influence on the survival function. The Cox regression analyses the accounting parameters of cultural firms where the impact of the explanatory variables is proportional, i.e., that HR is constant for any age, a hypothesis that has been proven in the sample data. This test has been applied to non-cultural firms in order to evaluate differences and similarities between both types of firms.
3. Results and Analysis
Once the cultural enterprises were separated from the non-cultural ones, we analysed whether there are differences between the survival of both groups and, if so, what the factors are that influence survival.
3.1. Comparative Assessment of the Survival of Cultural Enterprises Against Non-Cultural Ones
For 2016, the estimated survival of cultural enterprises by Kaplan–Meier is shown in Table 1 where the number of existing firms by age range can be seen together with the number of firms that disappear in the year under review, as well as an estimate of the probability of survival; for example, in 2016, there were 298 firms that were 30 years old or older; 7 disappeared throughout this year. The estimate of the probability of survival is 96.8%. The probability of survival of a cultural enterprise over 50 years old is 92.6%.

Table 1.
Life table of cultural enterprises.
The same analysis was performed for non-cultural enterprises. The table of survival of these firms (Table 2) indicates that the probability of survival of a non-cultural company aged 30 years or over is 98.9% and the probability of survival of firms aged 50 years or older is 96.7%.
Table 2.
Life table of non-cultural enterprises.
The survival curves for both groups, cultural and non-cultural firms are shown in Figure 2. As can be seen, the curve for cultural enterprises is systematically lower; the older the firms, the greater the difference. This shows that cultural firms have lower survival rates. In order to verify that the survival difference between cultural and non-cultural enterprises is statistically significant, we applied the Harrington–Fleming test. As shown in Table 3, the p-value of the test is 0.003, indicating that survival is significantly different between cultural and non-cultural enterprises.
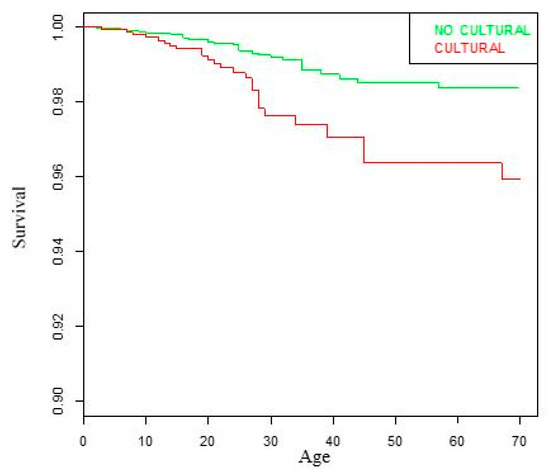
Figure 2.
Survival curve for cultural/non-cultural enterprises.
Table 3.
Harrington–Fleming Test.
We checked to see if the characteristic of being a cultural enterprise is an influential factor in the survival of firms, applying the Cox regression model that allows us to detect the relationship between the risk of a certain event; in our case, the disappearance of the company and one or several variables, whether or not it is cultural.
The results of the model are shown in Table 4. As can be seen, the regression coefficient is positive (coefficient = 0.77), indicating that the risk of disappearance increases in cultural enterprises compared with non-cultural ones where it is at the reference level. As for the p-value obtained (p = 0.0038), its effect is statistically significant. The HR is greater than 1, indicating more risk of disappearance in cultural enterprises. In particular, the HR is 2.161, which means that the risk of disappearance of a cultural company is 2.161 times that of a non-cultural one.
Table 4.
Cox’s model.
3.2. Analysis of Accounting Factors that Influence the Survival of Cultural Enterprises
3.2.1. Profitability
We considered two levels of profitability in cultural enterprises: negative and positive profitability. First, we made a comparison between both groups of cultural enterprises through a box plot. Figure 3 shows the age of both groups of enterprises on the basis of their negative or positive profitability. The median of the group of firms with positive profitability is greater than that of the group of firms with negative profitability. This suggests that the cultural firms with positive profitability tend to be older.
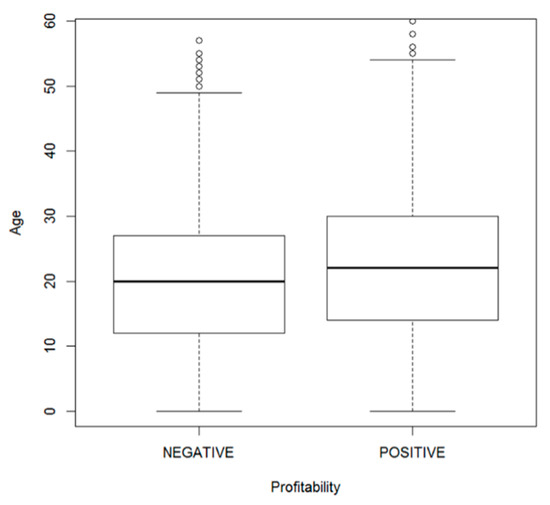
Figure 3.
Box plot for profitability.
The Kaplan–Meier survival curve for both levels of profitability is shown in Figure 4. This figure shows that the survival rate of both groups of cultural enterprises is different. It is noted that cultural enterprises with lower profitability have lower survival rates. This is consistent with studies for firms in other industrial sectors.
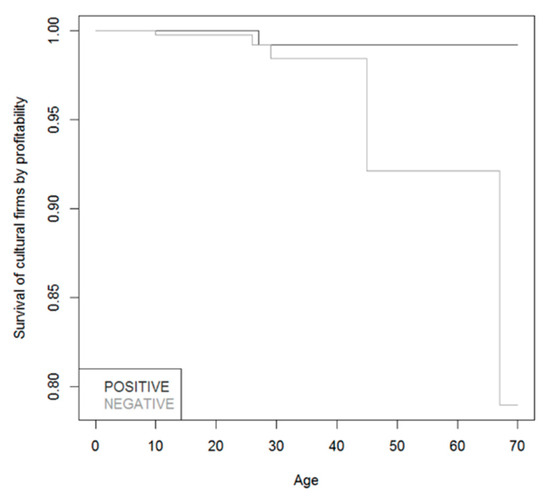
Figure 4.
Survival curve for the cultural firms by profitability.
Table 5 shows the results of the Harrington–Fleming test. The obtained p-value (p = 0.0483) is lower than the significance level commonly used (0.05). This indicates that the effect of profitability on the survival of cultural enterprises is statistically significant.
Table 5.
Harrington–Fleming test.
We checked to see if the profitability factor is an influential factor in the survival of cultural enterprises by applying the Cox regression model. The results are shown in Table 6. The regression coefficient is positive (coefficient = 1.481). This result indicates that the risk of disappearance of cultural enterprises that have negative economic profitability rates is higher compared to those with positive profitability rates, which is the reference level. The obtained p-value (p = 0.0487) shows the statistically significant effect. The HR is 4.39638, indicating that the risk of disappearance of cultural enterprises with negative rates of economic profitability is 4.396 times higher than in those with positive rates of profitability.
Table 6.
Cox’s model.
3.2.2. Solvency
We have compared two groups according to their solvency: low level, up to the first quartile, versus high level.
Figure 5 shows how the median age of cultural enterprises with high solvency is over 20 years, while in the case of firms with low solvency, the median age is around 15 years. This indicates that the firms with greater solvency tend to be older.
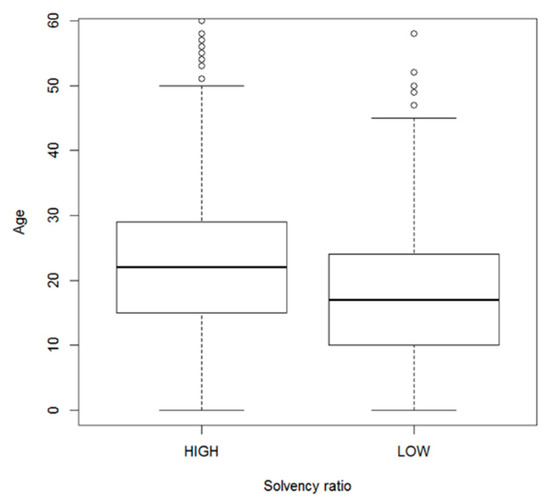
Figure 5.
Box plot for solvency ratio.
Figure 6 represents the survival curve for the cultural firms according to the solvency levels mentioned above. Cultural enterprises with low solvency ratios have lower survival rates; this difference increases with age. Therefore, there is a greater risk of disappearance in those cultural enterprises with low solvency ratios than in those cultural enterprises with high solvency ratios.
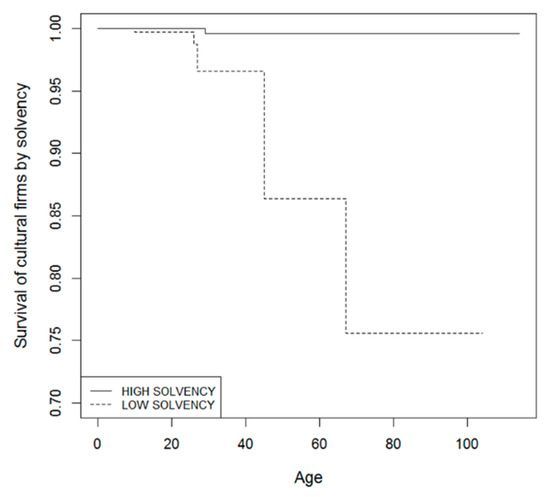
Figure 6.
Survival curve for the cultural firms by solvency.
Table 7 shows the results of the Harrington–Fleming test. The obtained p-value (p = 0.000114) indicates that the difference between both groups of solvency levels is significant.
Table 7.
Harrington–Fleming test.
We checked to see if the low solvency level is an influential factor in the survival of cultural enterprises by applying the Cox regression model. The results of this model are shown in Table 8. It shows that the obtained p-value for the test (p = 0.000301) is clearly lower than the usual level of significance. This indicates that the solvency factor is statistically significant. This confirms that solvency is an important factor in the survival of cultural enterprises. As the value of the HR collected in the table (19.58647) shows, the risk of disappearance in cultural enterprises with a low solvency ratio is multiplied by almost twenty.
Table 8.
Cox’s model.
3.2.3. Indebtedness
Two groups of indebtedness are considered: low and high. There is a high level of indebtedness when its ratio exceeds the mean value; otherwise, we considered it low. Table 9 shows the results of the statistics that describe this ratio for the cultural firms analysed. From these data, we determined that cultural enterprises exceeding the value of 4.362 have a high debt ratio.
Table 9.
Descriptive statistics of the debt ratio.
Then we compared cultural enterprises according to their indebtedness levels. Figure 7 shows the box plot of high and low groups. These show how cultural enterprises with low debt ratios have a higher median age, around 25 years, compared with those whose debt ratios are high, for which the median age is just over 20 years. This seems to indicate that cultural enterprises with low debt ratios tend to be older.
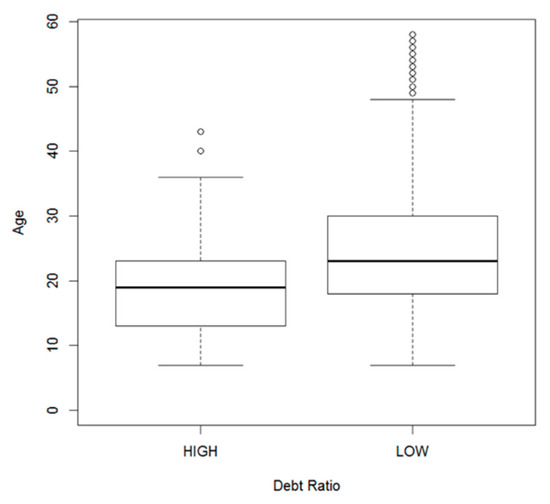
Figure 7.
Box plot for debt ratio.
The survival curve for the cultural firms according to their level of indebtedness is represented in Figure 8. As can be seen, the survival curves for the cultural firms with high and low ratios of indebtedness are different. Cultural enterprises with higher debt ratios have survival rates lower than those whose ratio is low.
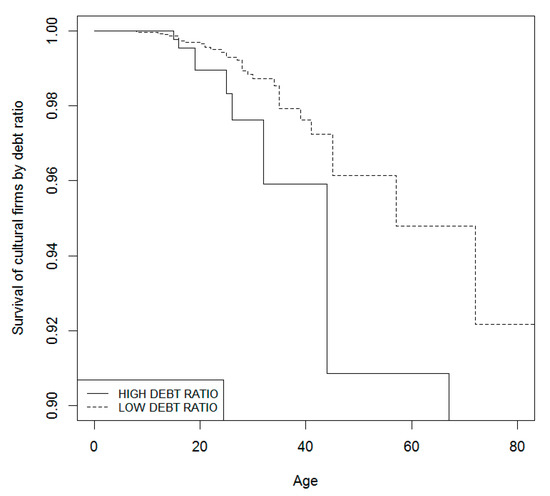
Figure 8.
Survival curve for the cultural firms by indebtedness.
Table 10 presents the results of the Harrington–Fleming test. The p-value obtained (p = 0.0171) shows that this factor is significant because its significance level is lower than the level commonly used (0.05). This indicates that the effect of indebtedness on the survival of cultural enterprises is statistically significant.
Table 10.
Harrington–Fleming test.
We applied the Cox regression model to verify that this factor is influential in the survival of the firms analysed. Table 11 shows the results of this model and indicates that the regression coefficient is positive (coefficient = 1.1729), which shows that the risk of disappearance of cultural enterprises with high debt ratios is greater compared to those with low debt rates, which is the reference level. The p-value (0.0308) indicates that its effect is statistically significant. In particular, as indicated by the HR, the more indebted firms have a risk of disappearance 3.2314 times greater than the less indebted ones.
Table 11.
Cox’s model.
3.3. Analysis of Accounting Factors that Influence the Survival of Non-Cultural Enterprises
In order to evaluate similarities and differences in accounting parameters between cultural and non-cultural firms, profitability, solvency and indebtedness have been obtained for the 3791 non-cultural firms. Applying the Cox regression model, we studied the relationship between these parameters and the firms’ risk of disappearance.
The results from the model for profitability are shown in Table 12. It shows that the regression coefficient is positive (coefficient = 1.2224), indicating that the risk of disappearance increases in non-cultural firms whose profitability is negative compared to those whose profitability is positive at the reference level. The p-value obtained (p = 0.000729) shows the effect is statistically significant. An HR greater than 1 indicates a greater risk of disappearance. In this case, HR has a value of 3.395, which indicates that the risk of disappearance of a non-cultural firm with negative profitability is 3.3952 times higher than that of a firm with positive profitability. The effect is not as significant as for cultural firms.
Table 12.
Cox’s model for non-cultural firms.
Applying the same Cox regression model, we checked to see if the low solvency level is an influential factor in the survival of non-cultural enterprises. The results of this model are shown in Table 12. The resulting p-value (p = 0.00722) reveals that this parameter is statistically significant. It is confirmed that solvency affects the survival of non-cultural enterprises. Considering the HR (2.6572), the risk of disappearance in non-cultural enterprises with a low solvency ratio is doubled in relation to highly solvent companies.
It might be highlighted that solvency is a risk factor for the survival of firms, but especially for cultural firms: HR = 19.586 against HR = 2.657 in non-cultural firms.
Finally, for the third factor under consideration, indebtedness, the same model applied to non-cultural firms in Spain shows there is no statistical significance (p = 0.382) in the analysed period.
4. Conclusions
This article has examined the survival of cultural enterprises against non-cultural ones. In addition, the effect of different accounting factors on the survival of the firms has also been studied.
The conducted study has shown, by using the survival curve of Kaplan and Meier, that the cultural orientation of the firms’ business activity affects their survival. In effect, we have found that the fact of belonging to the group of cultural firms increases the risk of disappearance and that this risk is statistically significant.
We have also analysed the effect of different accounting variables on the survival of cultural enterprises. This study has shown that profitability, solvency and indebtedness are variables that have an influence.
The statistical significance of the above factors has been verified with the Harrington–Fleming test and the Cox regression model. The study shows statistically robust empirical evidence as regards the effect of the variables considered. Similarly, we have shown that profitability, solvency and indebtedness ratios have predictive capabilities to anticipate business failure. In particular, we have seen how the risk of disappearance of highly indebted cultural enterprises is three times that of those not indebted; that cultural enterprises with negative profitability have a risk of disappearance four times higher compared to those with positive profitability; and, finally, that firms with low solvency ratios have a risk of disappearance of almost twenty times higher than those whose solvency ratio is high.
Additionally, we have analyzed the behavior of these ratios in non-cultural firms to reveal differences in behaviour. The results show that the risk of disappearance of companies with low profitability is slightly higher in cultural firms than in non-cultural ones. The behaviour of cultural and non-cultural firms strongly differs in indebtedness: cultural firms with high and low indebtedness show a substantial difference in their risk of disappearance, while this parameter has no statistical significance in non-cultural companies. However, the behaviour of both types of companies especially differs in conditions of low solvency: the risk of disappearance in non-cultural companies with low solvency is 2.7 times higher than companies with high solvency. This index achieves 19.6 in cultural companies.
In view of the results, solvency is the ratio that reveals a risky situation for cultural enterprises with greater intensity, which seems to be consistent with the very nature of such enterprises and spreads the belief of their fragility. For this reason, the evaluation of the position and management of the solvency ratio in cultural enterprises is of utmost importance to the stakeholders in this sector.
This type of analysis is interesting from a triple perspective. First, these studies are relevant for cultural enterprises because they allow the design of business policies to minimise the weakness of cultural enterprises. Second, they are important for administrators because they allow a better understanding of the behaviour of cultural firms and the factors that influence their survival in order to develop effective policies to support a sustainable cultural and creative industry. Third, and finally, because the prosperity of these firms will result in the enhancement of cultural heritage. Due to the importance of this type of study, for future research, it would be interesting to undertake a longitudinal study to see these variables over a longer period.
Author Contributions
Conceptualization, M.d.P.M.D. and A.V.L.; formal analysis, M.d.P.M.D.; A.V.L. and M.d.R.C.; methodology, M.d.P.M.D.; A.V.L. and M.d.R.C.; project administration, M.d.P.M.D. and A.V.L. and M.d.R.C.; Writing—review & editing, M.d.P.M.D., A.V.L. and M.d.R.C. All authors have read and agreed to the published version of the manuscript.
Funding
This Research was funded by European Union though Atlantic CultureScape, grant number eapa_744/2018. APC was funded by EU.
Acknowledgments
This research has been carried out in the framework of the Project AtlanticCultureScape eapa_744/2018; Start Date: 2019-04-12; End date: 2022-03-31.
Conflicts of Interest
The authors declare no conflict of interest.
References
- Cooke, P.; De Propris, L. A policy agenda for EU smart growth: The role of creative and cultural industries. Policy Stud. 2011, 32, 365–375. [Google Scholar] [CrossRef]
- O’Connor, J. Intermediaries and imaginaries in the cultural and creative industries. Reg. Stud. 2015, 49, 374–387. [Google Scholar] [CrossRef]
- Lu, W.M.; Kweh, Q.L.; He, D.S.; Shih, J.M. Performance analysis of the cultural and creative industry: A network-based approach. Nav. Res. Logist. (NRL) 2017, 64, 662–676. [Google Scholar] [CrossRef]
- De-Miguel-Molina, B.; Hervas-Oliver, J.L.; Boix, R.; De-Miguel-Molina, M. The Importance of Creative Industry Agglomerations in Explaining the Wealth of European Regions. Eur. Plan. Stud. 2012, 20, 1263–1280. [Google Scholar] [CrossRef]
- Power, D. Priority Sector Report: Creative and Cultural Industries; European Commission, Ed.; Publications Office of the European Union: Bruxeles, Belgium, 2011. [Google Scholar]
- Fanea-Ivanovici, M. Culture as a Prerequisite for Sustainable Development. An Investigation into the Process of Cultural Content Digitisation in Romania. Sustainability 2018, 10, 1859. [Google Scholar] [CrossRef]
- European Commission. Liberar el Potencial de las Industrias Culturales y Creativas; European Commission: Bruselas, Belgium, 2010. [Google Scholar]
- Eurostat. Culture Statistic. Available online: https://ec.europa.eu/eurostat/documents/3217494/10177894/KS-01-19-712-EN-N.pdf/915f828b-daae-1cca-ba54-a87e90d6b68b (accessed on 10 October 2019).
- O’Connor, J. Las industrias creativas y culturales: Una historia crítica. Ekonomiaz 2011, 78, 24–47. [Google Scholar]
- Hirschman, E.C.; Holbrook, M.B. The experiential aspects of consumption: Consumer fantasies, feelings, and fun. J. Consum. Res. 1982, 9, 132–140. [Google Scholar]
- Lampel, J.; Lant, T.; Shamsie, J. Balancing act: Learning from organizing practices in cultural industries. Organ. Sci. 2000, 11, 263–269. [Google Scholar] [CrossRef]
- Becker, H.S. Arts and crafts. Am. J. Sociol. 1978, 83, 862–889. [Google Scholar] [CrossRef]
- Hirschman, E.C. Aesthetics, ideologies and the limits of the marketing concept. J. Mark. 1983, 47, 45–55. [Google Scholar] [CrossRef]
- Greffe, X.; Simonnet, V. Les entreprises culturelles sont-elles soutenables? Revue d’économie Politique 2010, 120, 57–86. [Google Scholar] [CrossRef]
- Baumol, W.; Bowen, W. Performing Arts: The Economic Dilemma; Twentieth Century Fund: New York, NY, USA, 1966. [Google Scholar]
- Zallo, R. La Economía de la Cultura (y la Comunicación) como objeto de estudio. Zer 2007, 22, 215–234. Available online: https://www.ehu.eus/ojs/index.php/Zer/article/download/3682/3314 (accessed on 19 October 2019).
- Giles, D.E. Survival of the hippest: Life at the top of the hot 100. Appl. Econ. 2007, 39, 1877–1887. [Google Scholar] [CrossRef]
- Madison, D. Increasing returns to information and the survival of Broadway theatre productions. Appl. Econ. Lett. 2004, 11, 639–643. [Google Scholar] [CrossRef]
- Segarra, A.; Callejón, M. New Firms’ Survival and Market Turbulence: New Evidence from Spain. Rev. Ind. Organ. 2002, 20, 1–14. [Google Scholar] [CrossRef]
- Correa, A.; Acosta, M.; Gónzalez, A.L. La insolvencia empresarial: Un análisis empírico para la pequeña y mediana empresa. Rev. Contab.-Span. Account. Rev. 2003, 12, 47–49. [Google Scholar]
- Mateut, S.; Bougheas, S.; Mizen, P. Trade credit, bank lending and monetary policy transmission. Eur. Econ. Rev. 2006, 50, 603–629. [Google Scholar] [CrossRef]
- Delmar, F.; McKelvie, A.; Wennberg, K. Untangling the relationships among growth, profitability and survival in new firms. Technovation 2013, 33, 276–291. [Google Scholar] [CrossRef]
- Guimaraes Barbosa, E. Determinants of Small Business Survival: The Case of Very Small Enterprises of the Traditional Manufacturing Sectors in Brazil. 2016. Available online: https://ssrn.com/abstract=2802706 (accessed on 9 March 2019).
- Pellegrini, G.; Muccigrosso, T. Do subsidized new firms survive longer?. Evidence from a counterfactual approach. Reg. Stud. 2017, 51, 1483–1493. [Google Scholar] [CrossRef]
- Shin, K.; Park, G.; Choi, J.; Choy, M. Factors affecting the survival of SMEs: A study of biotechnology firms in South Korea. Sustainability 2017, 9, 108. [Google Scholar] [CrossRef]
- Mata, J.; Portugal, P. The Survival of New Domestic and Foreign Owned Firms. Strateg. Manag. J. 2002, 23, 323–343. [Google Scholar] [CrossRef]
- United Nations Conference on Trade and Development (UNCTAD). Informe sobre la Economía Creativa; UNCTAD: Geneve, Switzerland, 2010. [Google Scholar]
- Peltoniemi, M. Cultural industries: Product-market characteristics, management challenges and industry dynamics. Int. J. Manag. Rev. 2014, 17, 41–68. [Google Scholar] [CrossRef]
- Département des études, de la prospective et des statistiques (DEPS). Aperçu Statistique des Industries Culturelles; Ministère de la Culture: Paris, Francia, 2006. [Google Scholar]
- Department for Culture, Media and Sport (DMCS). Annual Report; HMSO: London, UK, 2001. [Google Scholar]
- Shih, T.Y. Determinants of enterprises radical innovation and performance: Insights into strategic orientation of cultural and creative enterprises. Sustainability 2018, 10, 1871. [Google Scholar] [CrossRef]
- Altman, E. Financial ratios, discriminant analysis and the prediction of corporate bankruptcy. J. Financ. 1968, 23, 589–609. [Google Scholar] [CrossRef]
- Beccetti, L.; Sierra, J. Bankruptcy risk and productive efficiency in manufacturing firms. J. Bank. Financ. 2003, 27, 2099–2120. [Google Scholar] [CrossRef]
- Lizárraga Dallo, F. Utilidad de la información contable en el proceso de fracaso: Análisis del sector industrial de la mediana empresa. REFC 1997, 93, 871–915. [Google Scholar]
- Markman, G.D.; Gartner, W.B. The effects of Hyper Growth on Firm Profitability. J. Priv. Equity 2002, 5, 58–65. [Google Scholar] [CrossRef]
- Pérez Gorostegui, E. Curso de Economía de la Empresa; Ramón Areces: Madrid, España, 2017. [Google Scholar]
- Hale, G.; Santos, J. The decision to first enter the public bond market: The role of firm reputation, funding choices, and bank relationships. J. Bank. Financ. 2008, 32, 1928–1940. [Google Scholar] [CrossRef]
- Mata, J.; Portugal, P.; Guimaraes, P. The survival of new plants: Entry conditions and post-entry evolution. Int. J. Ind. Organ. 1995, 13, 459–482. [Google Scholar] [CrossRef]
- Kaplan, E.; Meier, P. Nonparametric estimation from incomplete observations. J. Am. Stat. Assoc. 1958, 53, 457–481. [Google Scholar] [CrossRef]
- Harrington, D.; Fleming, T. A class of rank test procedure for censored survival data. Biometrika 1982, 60, 553–566. [Google Scholar] [CrossRef]
- Cox, D.R. Regression models and life–tables. J. R. Stat. Soc. Ser. B. 1972, 34, 187–220. [Google Scholar] [CrossRef]


© 2020 by the authors. Licensee MDPI, Basel, Switzerland. This article is an open access article distributed under the terms and conditions of the Creative Commons Attribution (CC BY) license (http://creativecommons.org/licenses/by/4.0/).