Analysis of the Impact of Land Use on Spatiotemporal Patterns of Surface Urban Heat Island in Rapid Urbanization, a Case Study of Shanghai, China

Abstract
:1. Introduction
2. Data and Methods
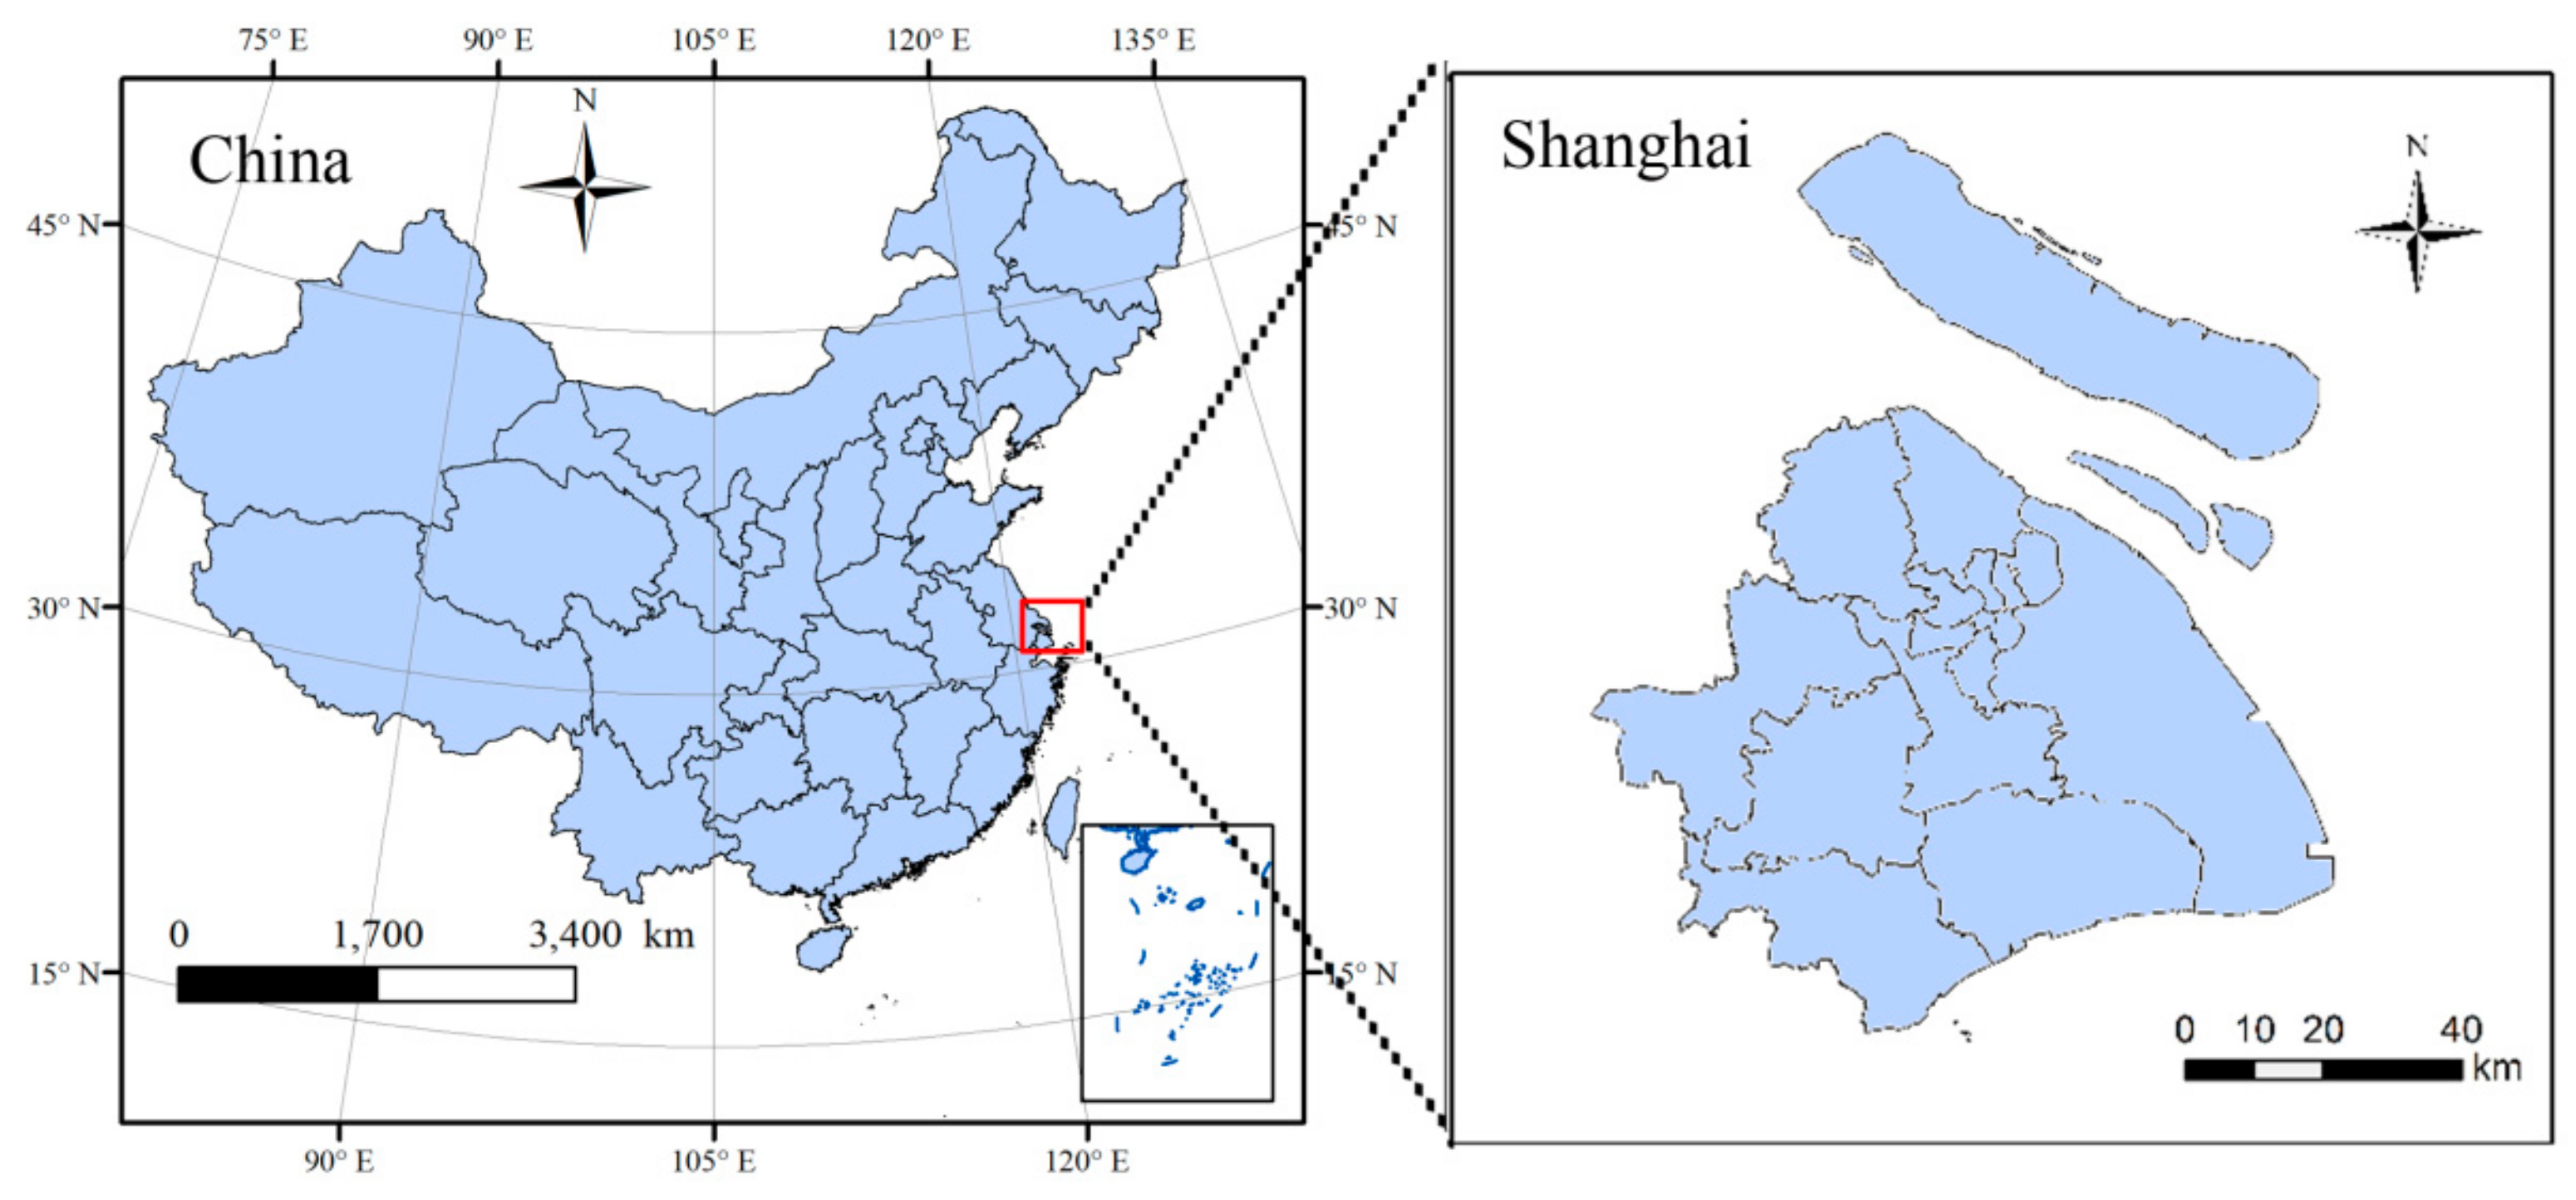
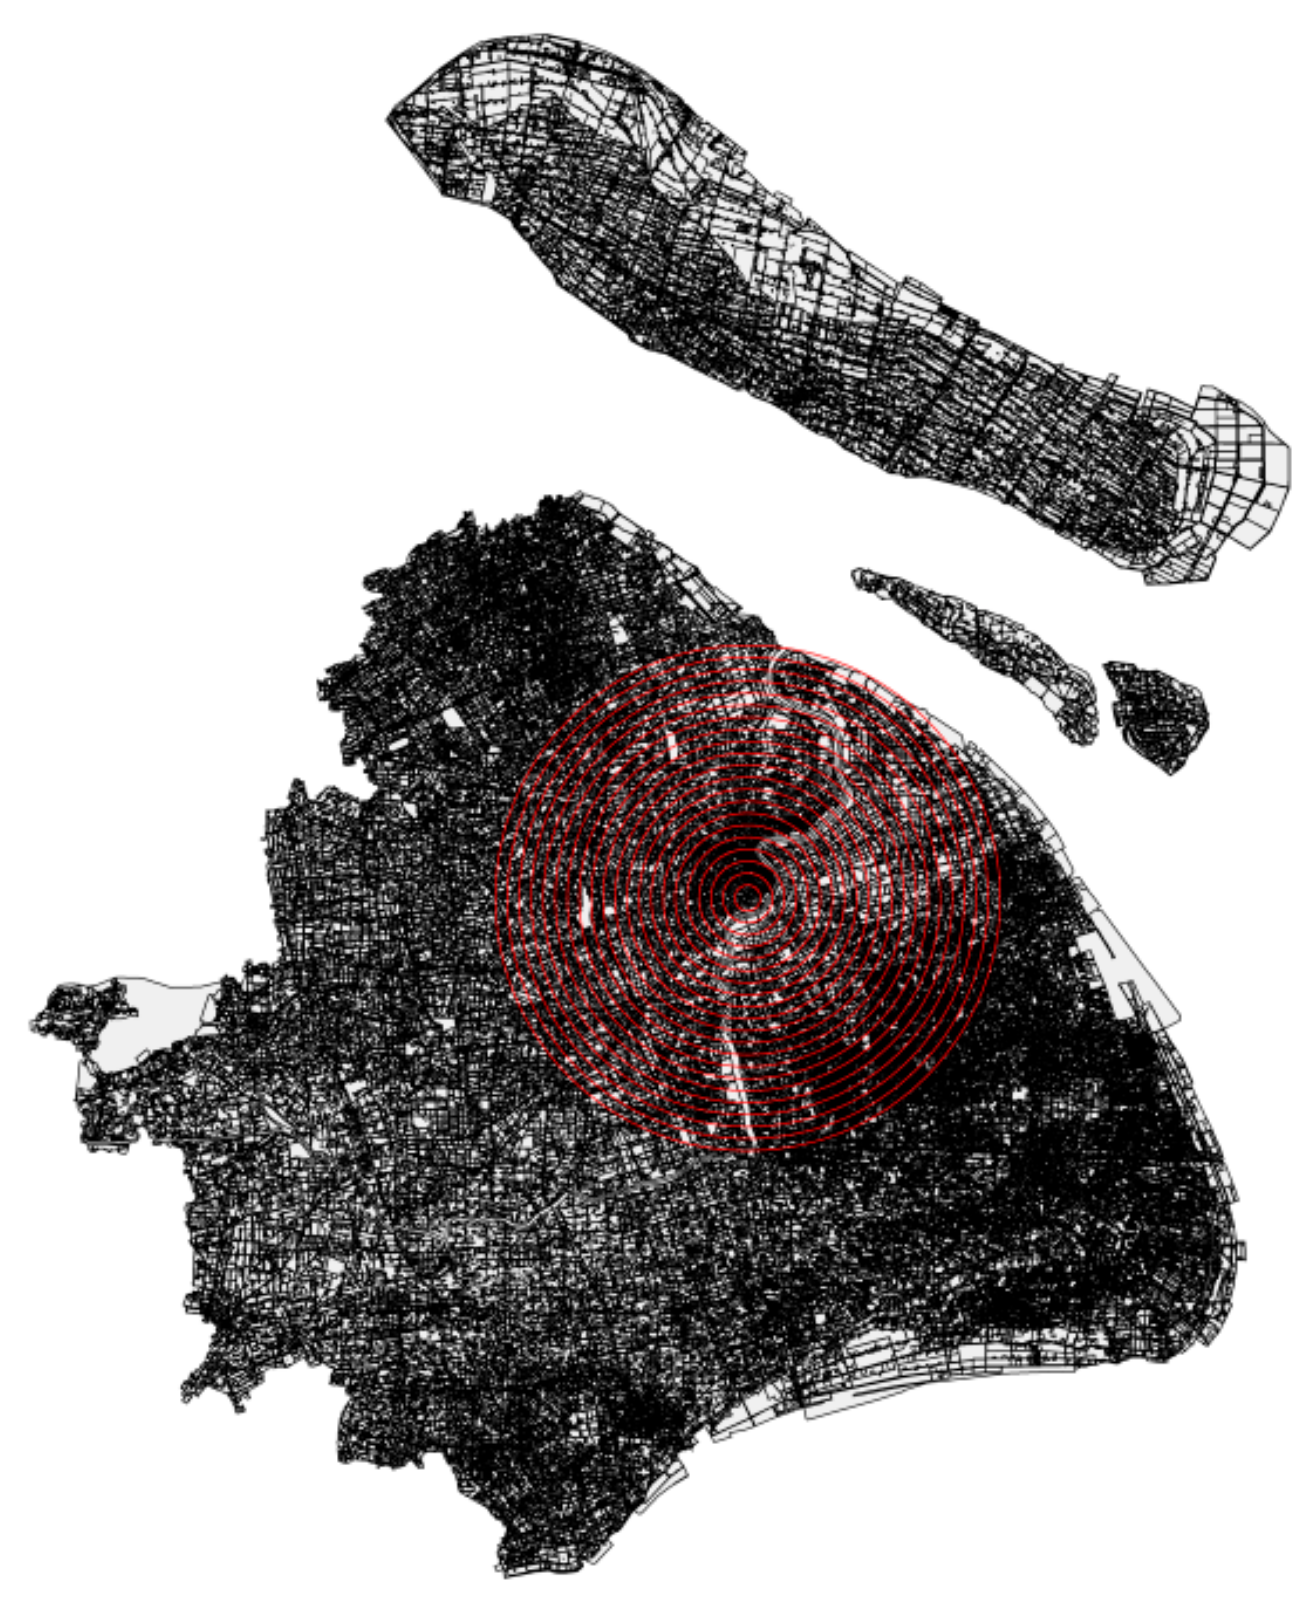
2.1. Study Area
2.2. Data Processing
- (1)
- The thermal feature on the sampled dates are almost the same; and
- (2)
- On the day before the sampled day, the weather condition is stable (without strong wind or rain).
- (1)
- Google Earth high resolution images of Shanghai in 2000, 2004, 2007, and 2015. The images were used for the artificial abstraction of land use.
- (2)
- The air temperature data from 10 meteorological stations on the same date as the RS images to verify the precision of the LST retrieval.
2.3. Research Methods
2.3.1. Land Surface Temperature Retrieval
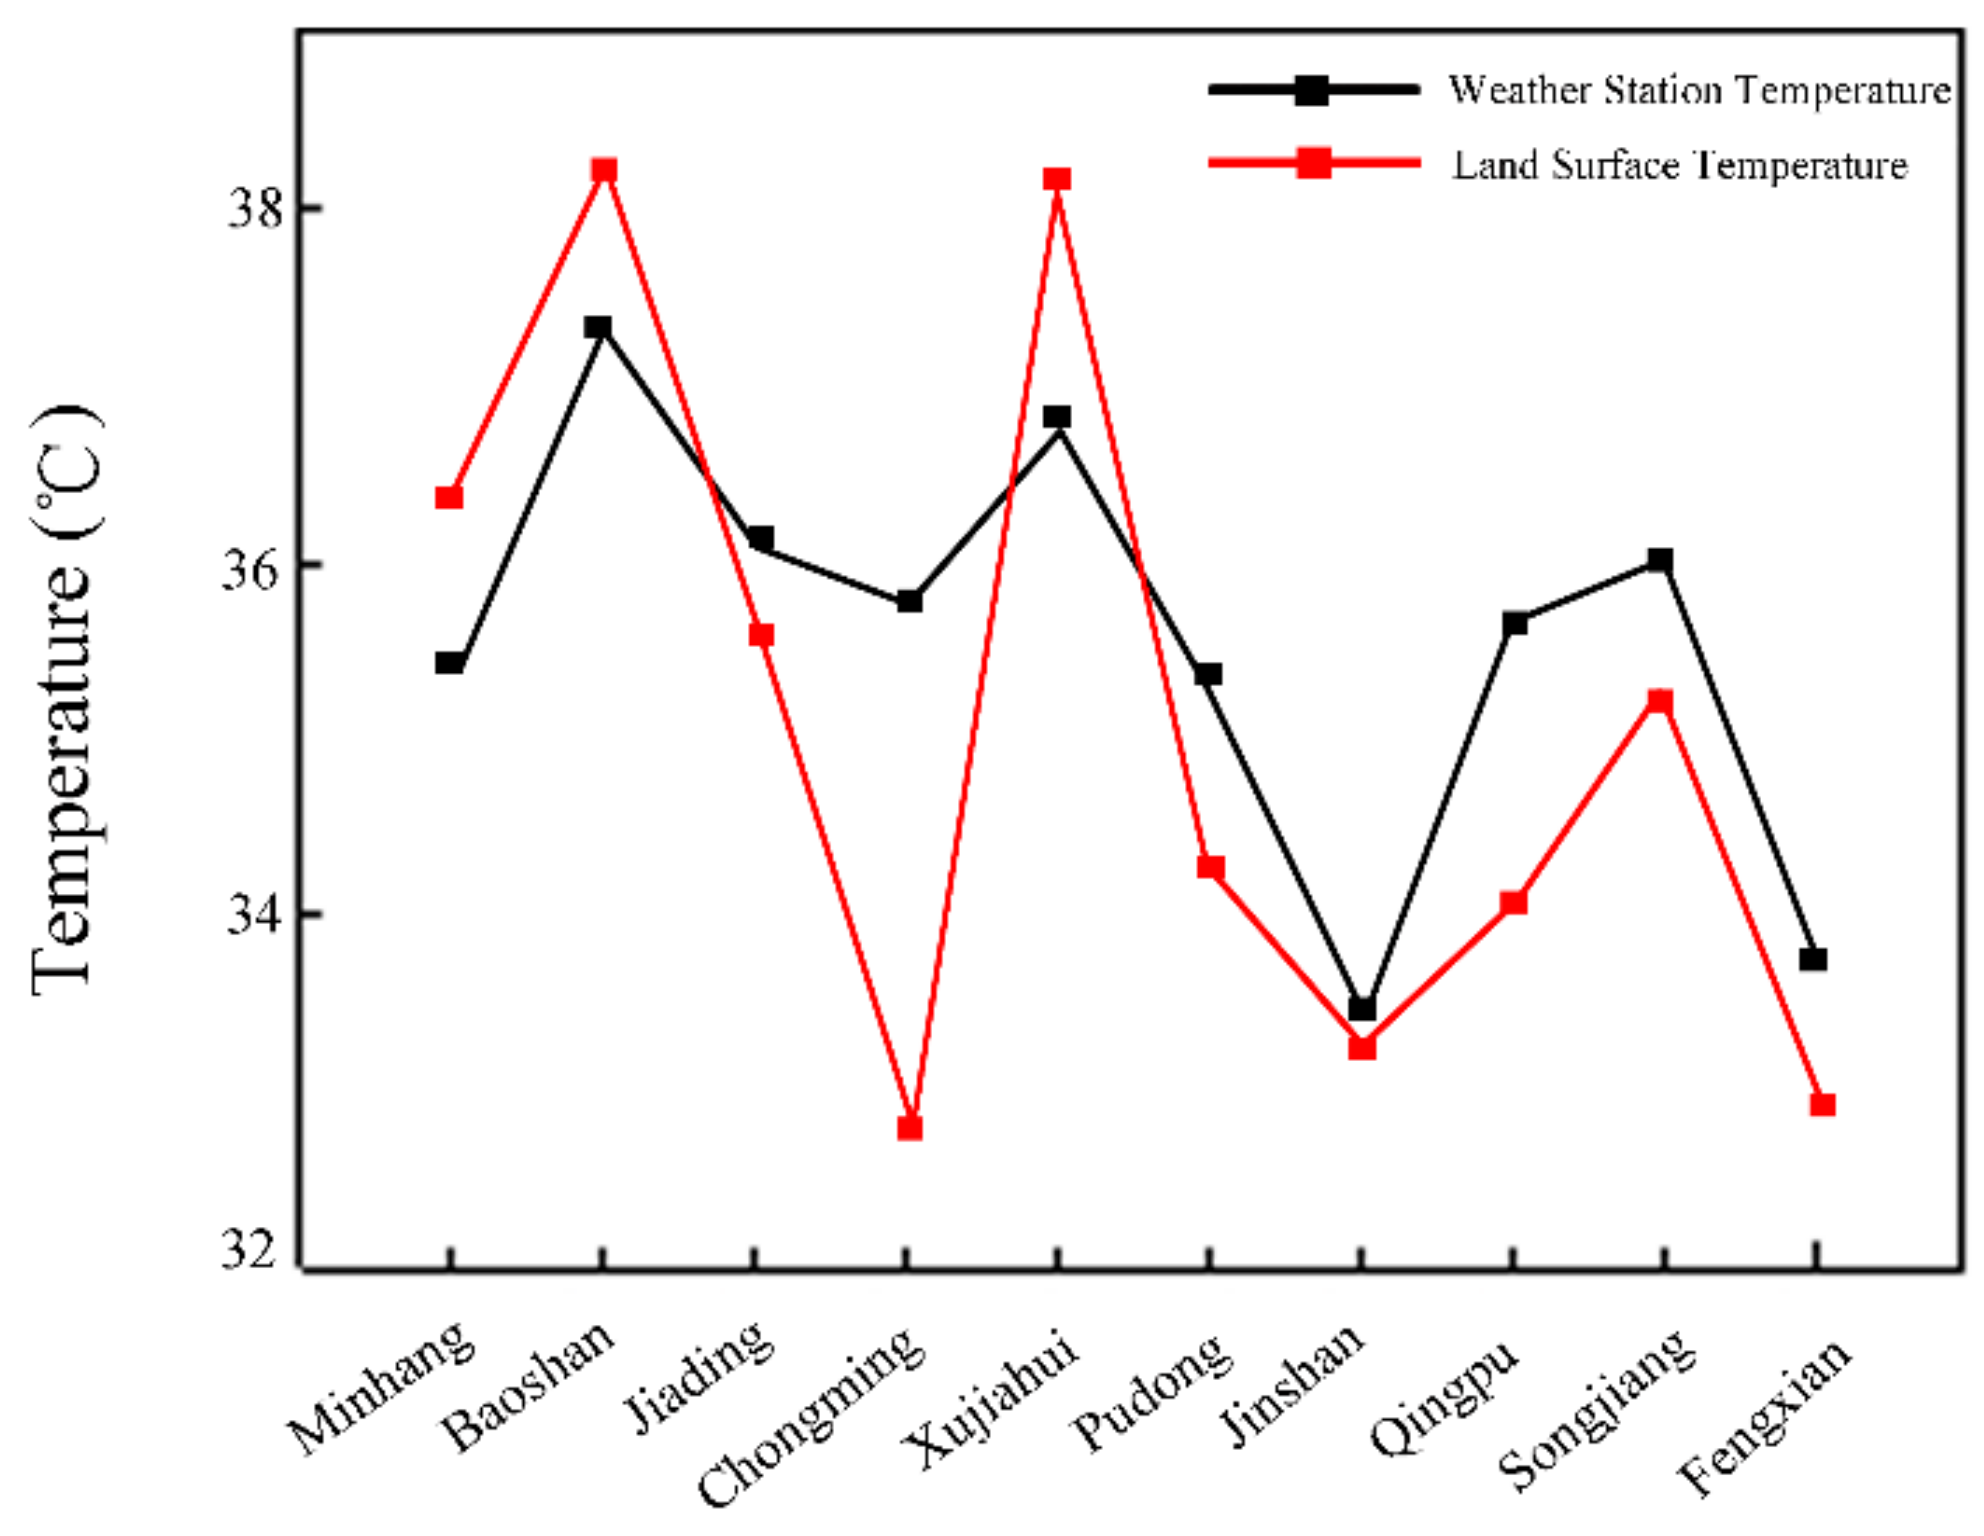
2.3.2. Validation of LST Retrieval
2.3.3. Classification of LST
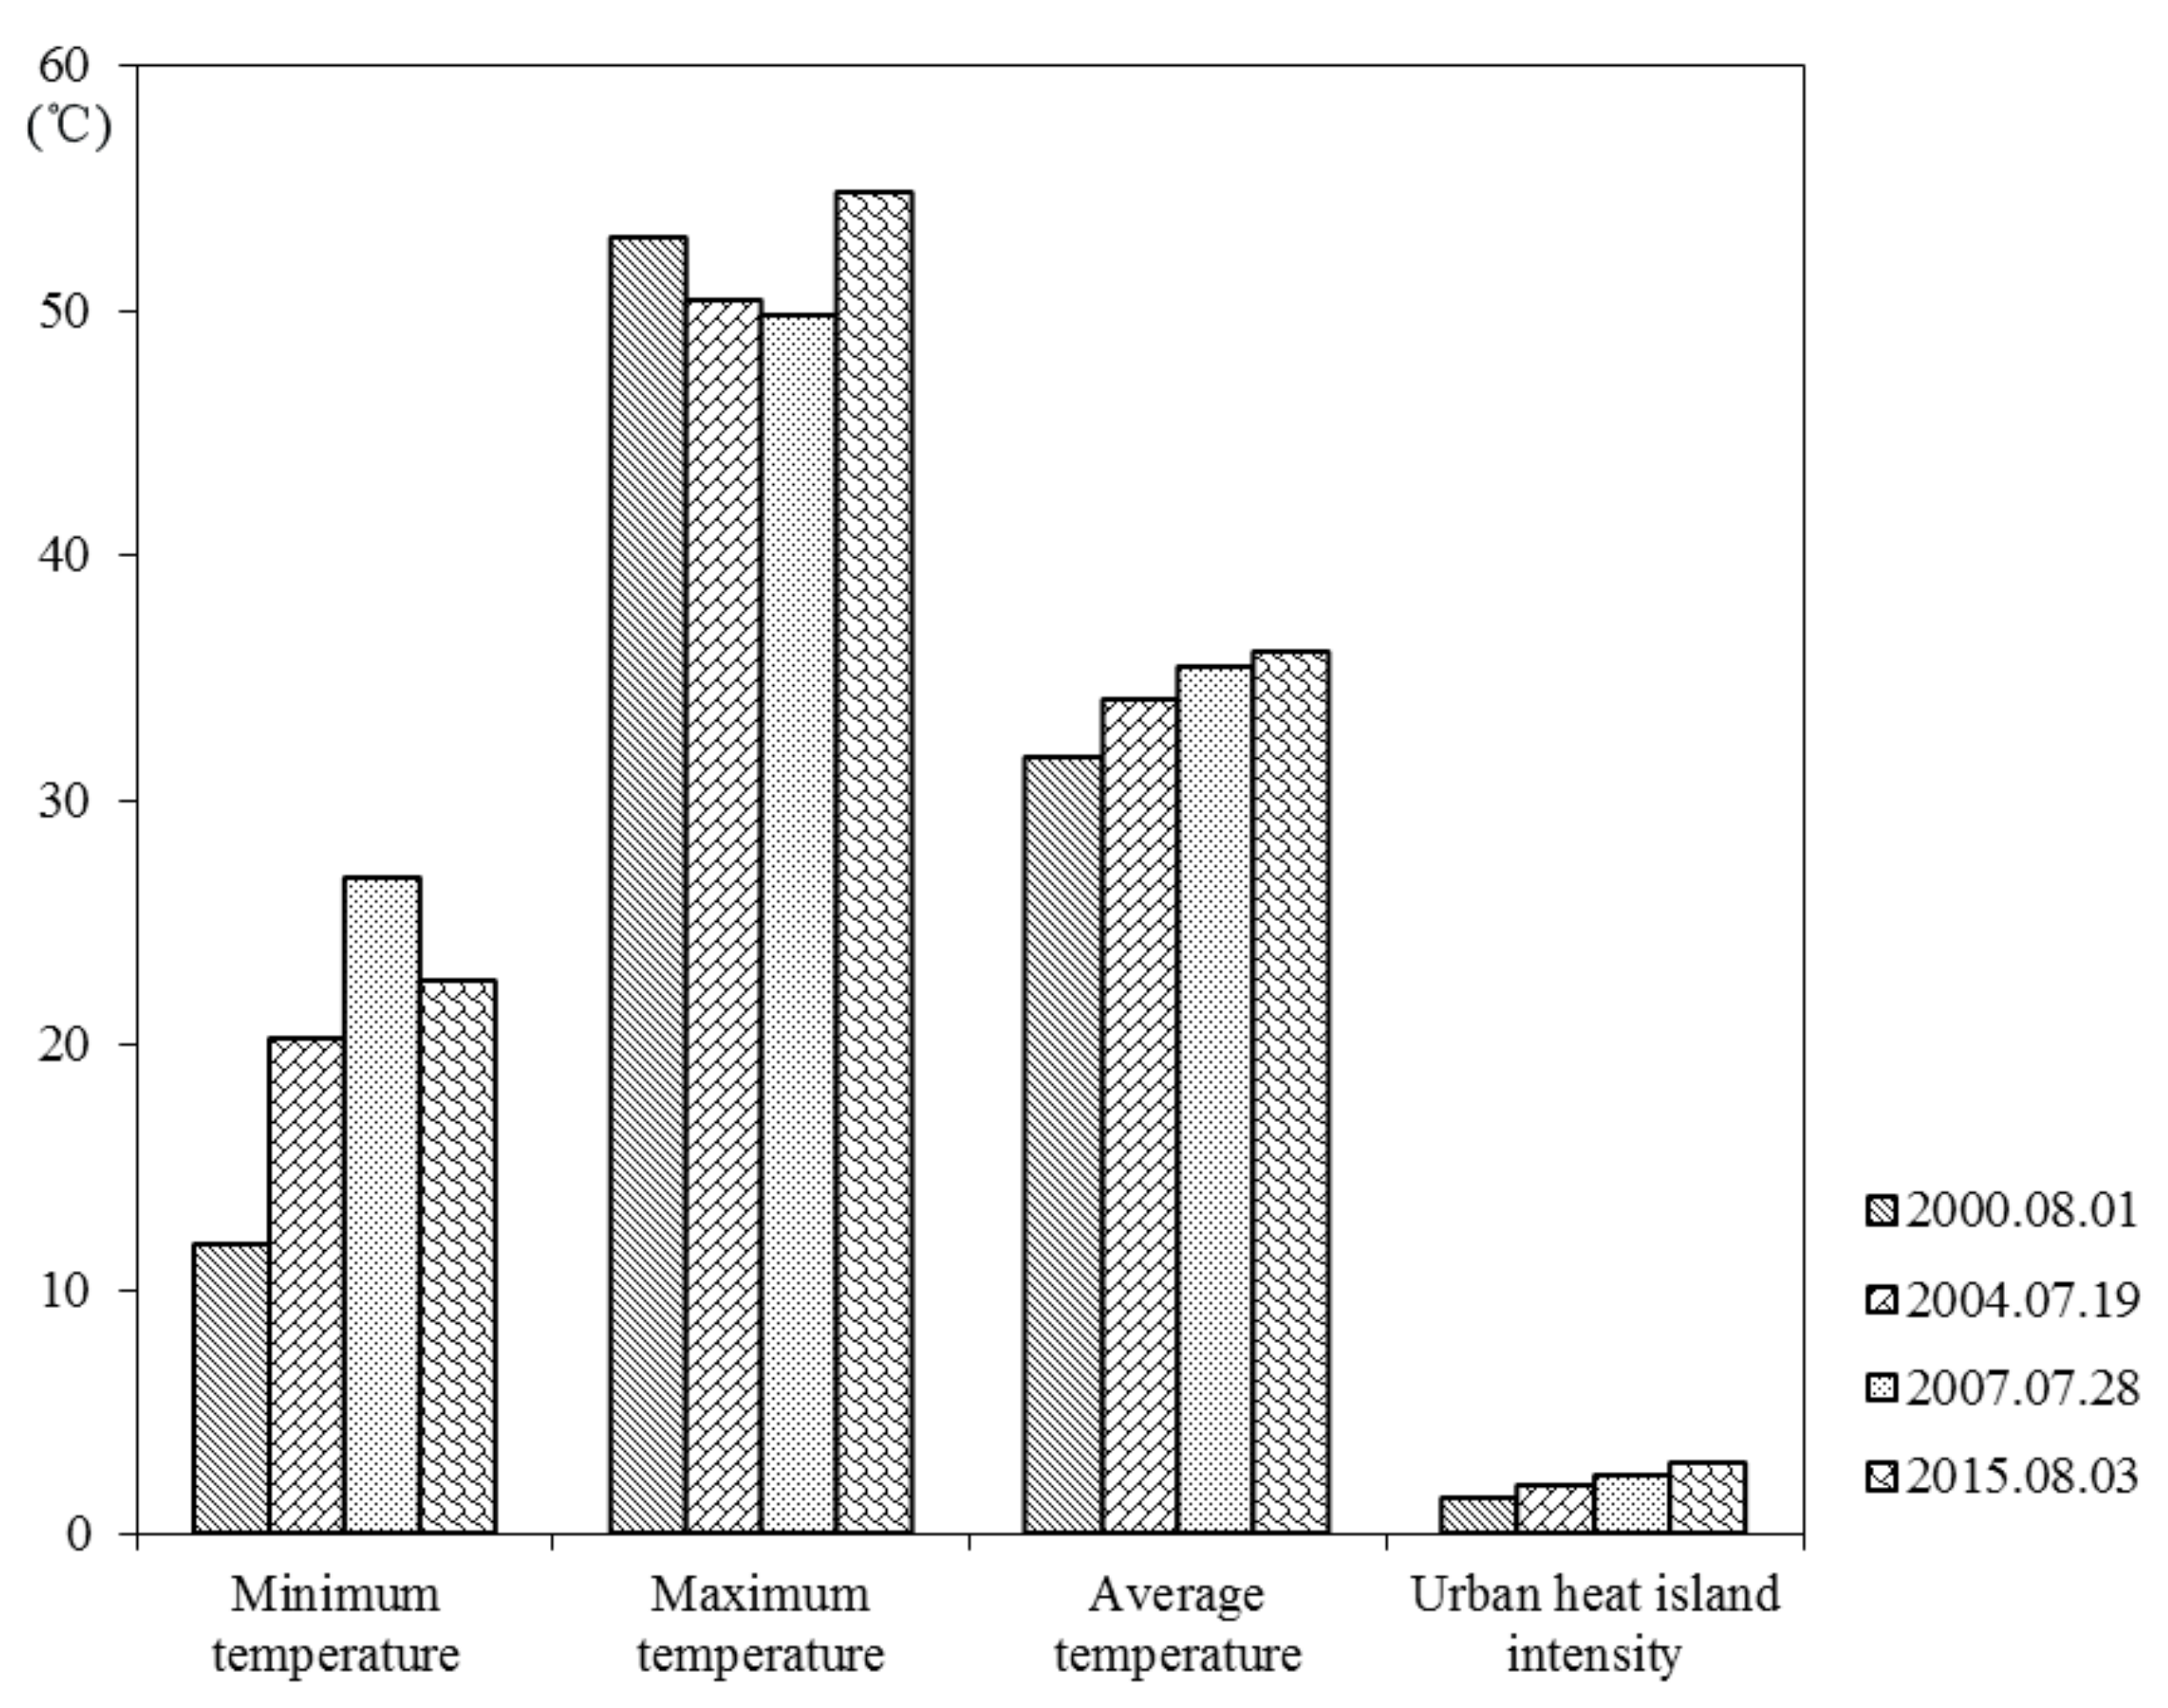
2.3.4. Calculation of UHI Intensity
2.3.5. Classification of Land Use Type
3. Results
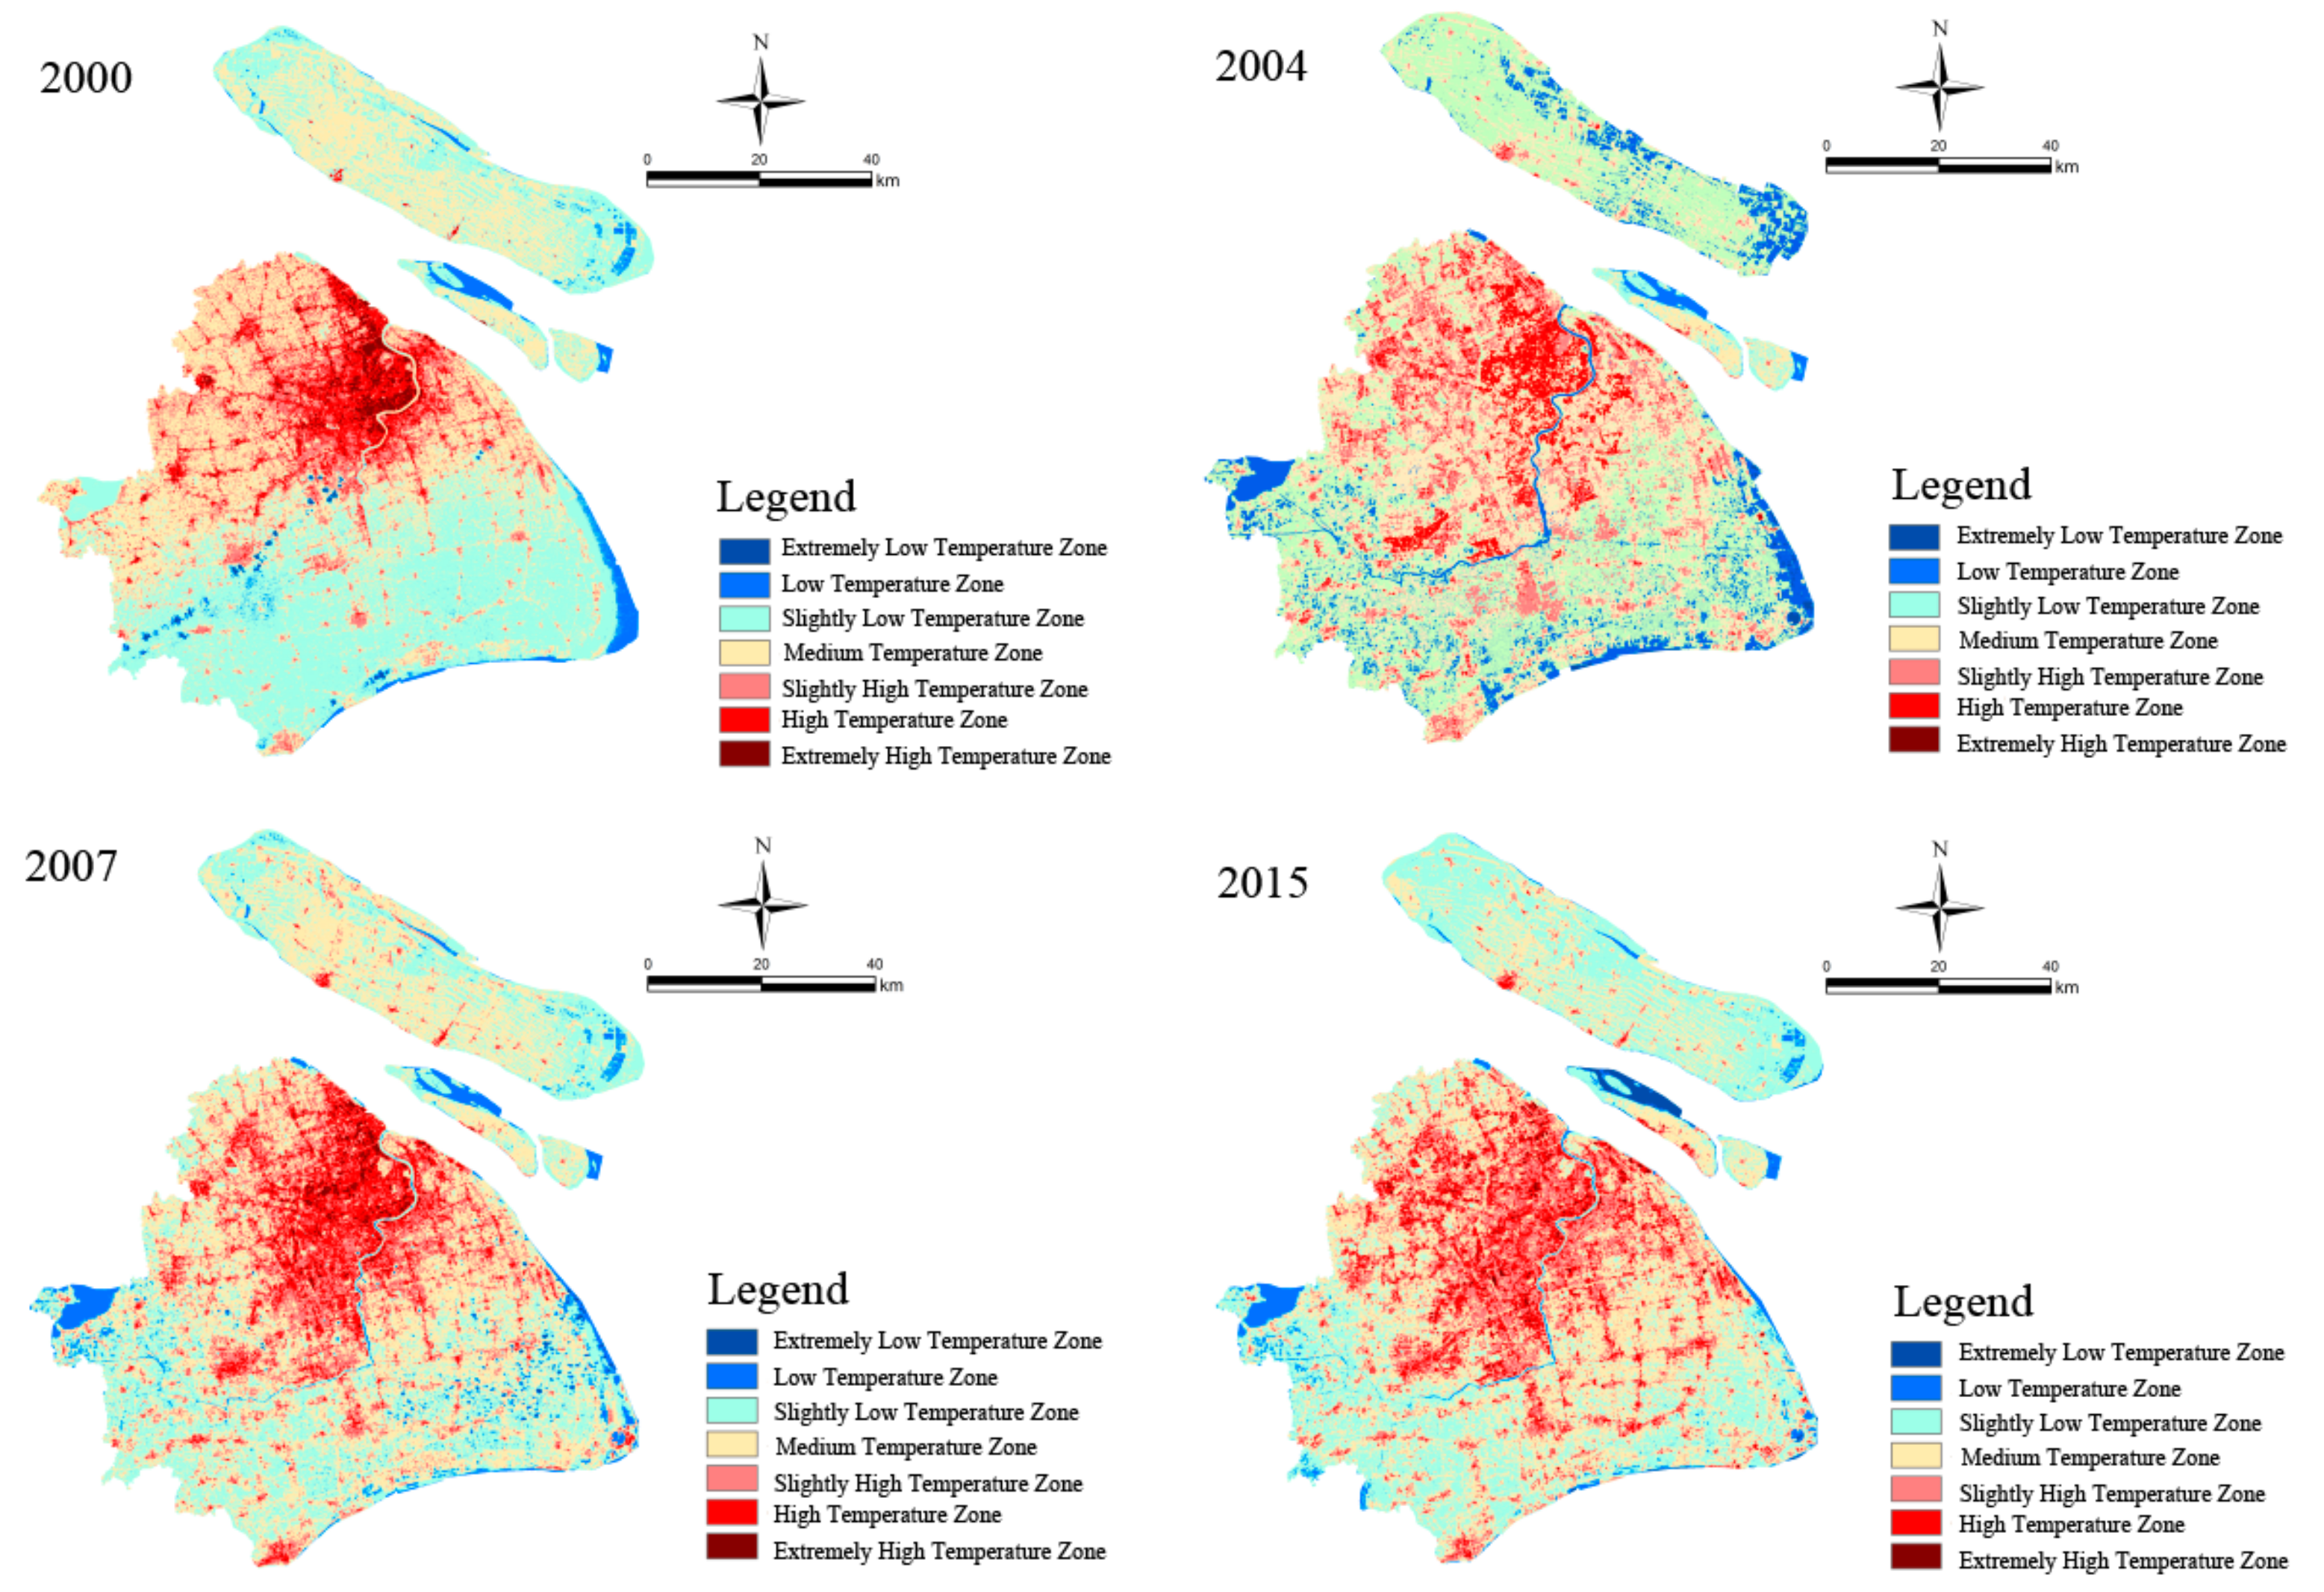
3.1. Spatial and Temporal Pattern of Urban Surface (UHI)
3.1.1. Spatial Distribution Characteristics of Urban Surface UHI
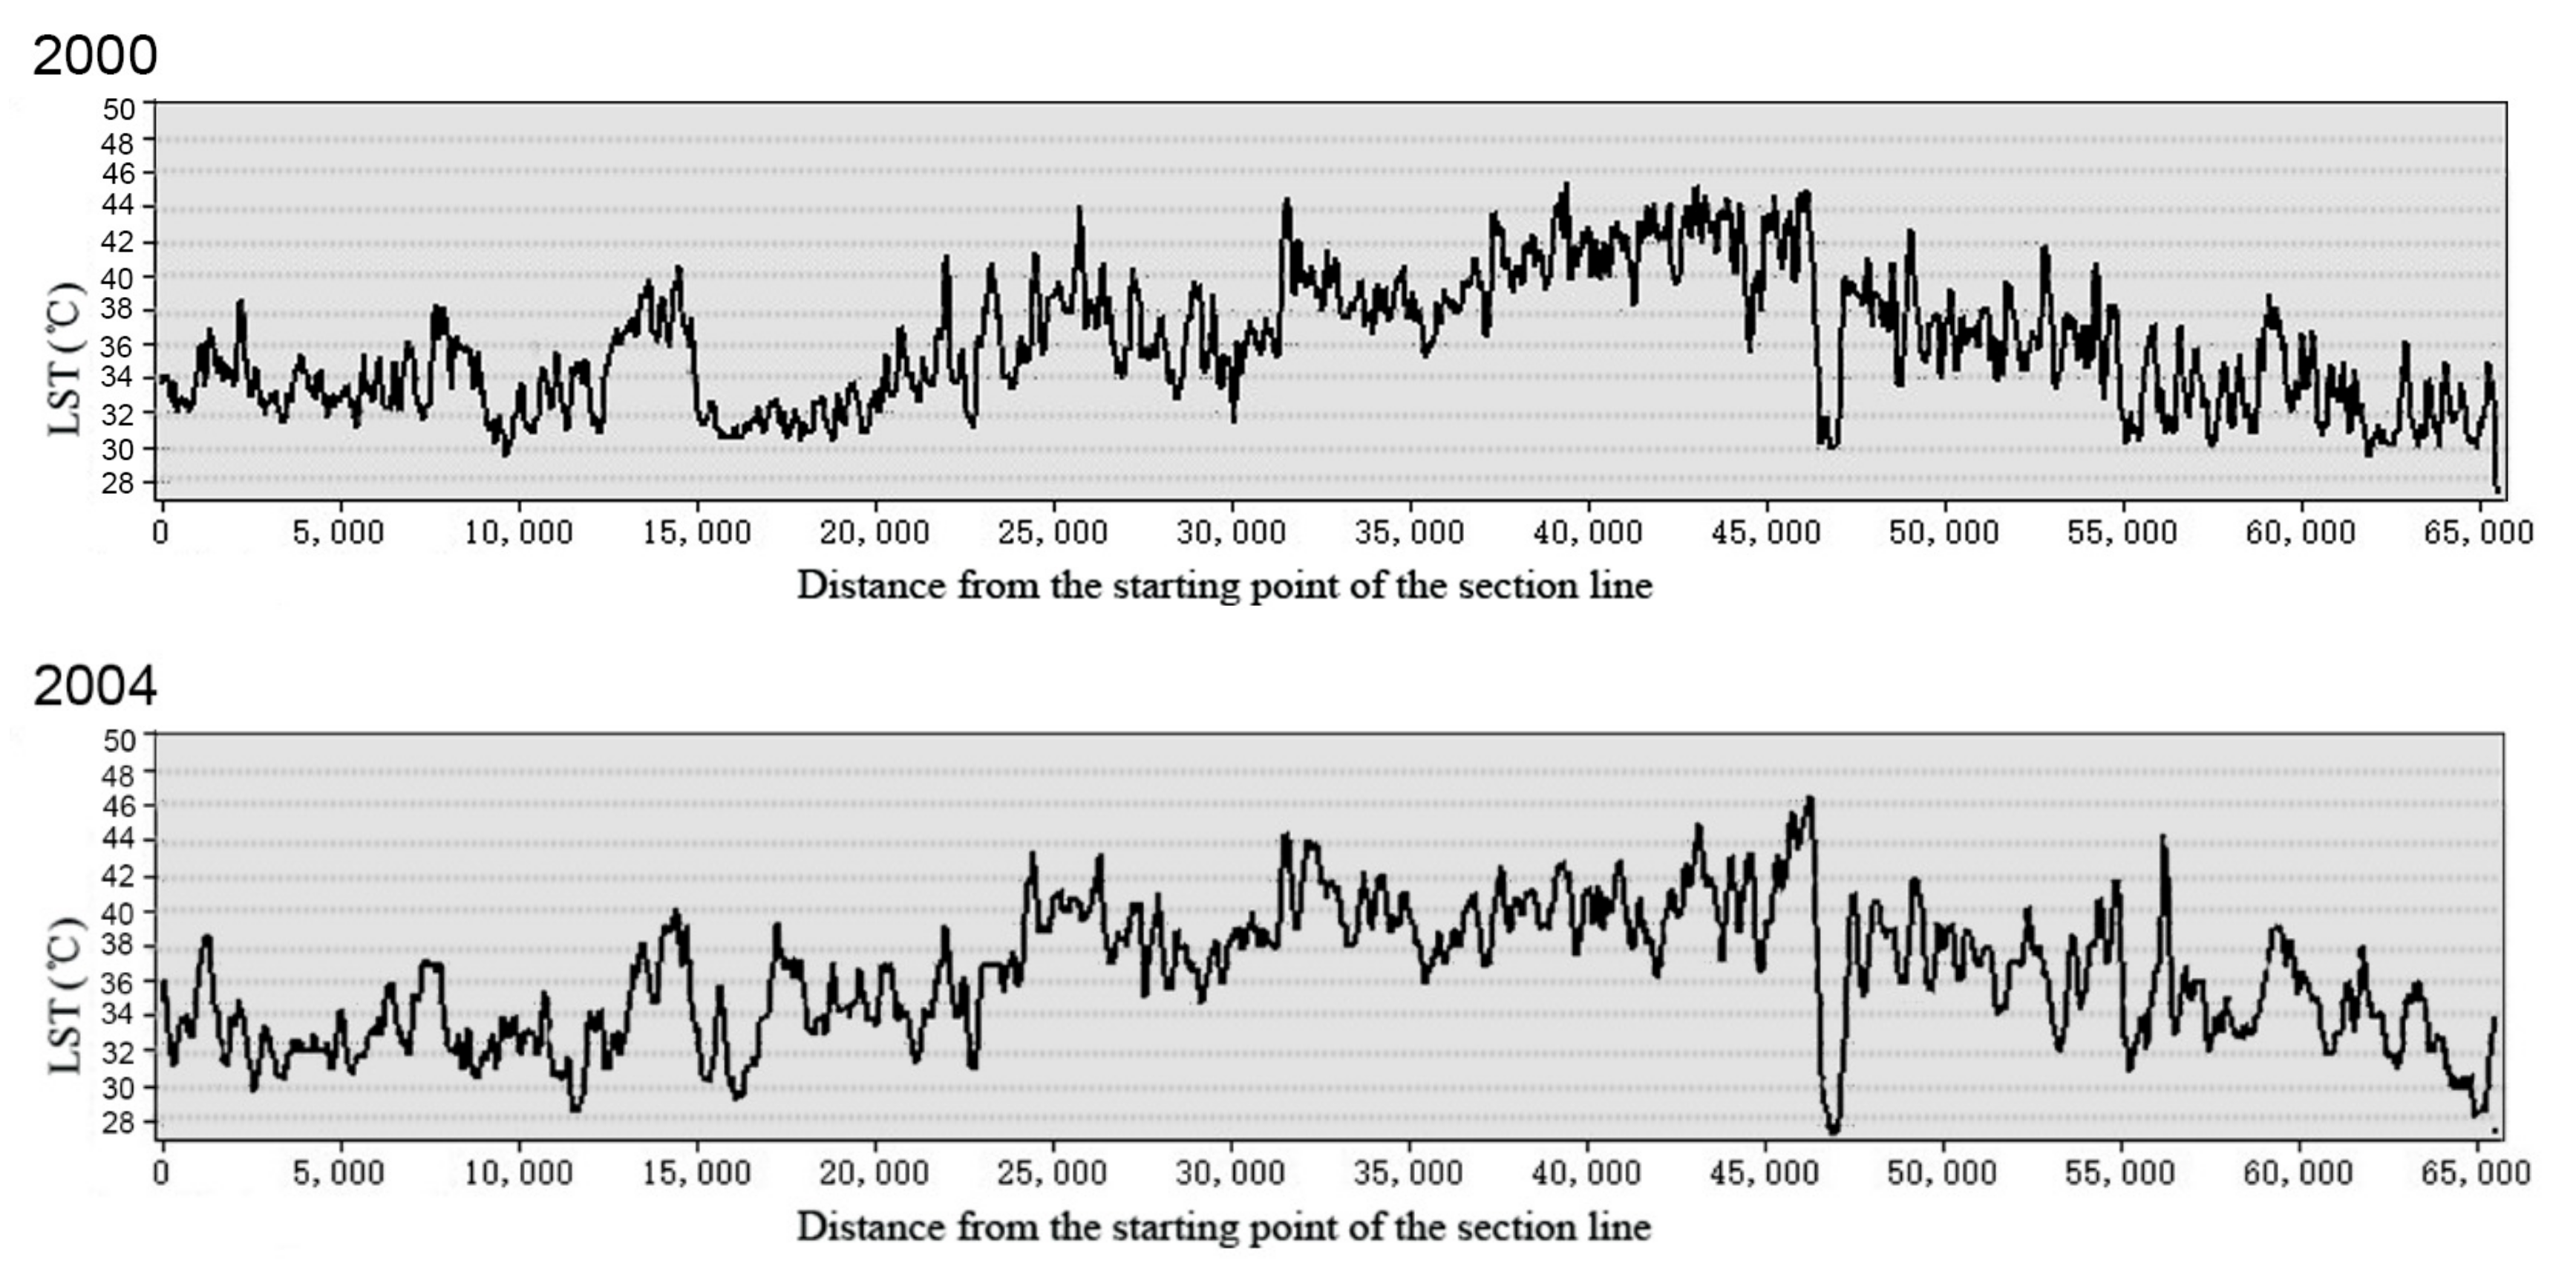
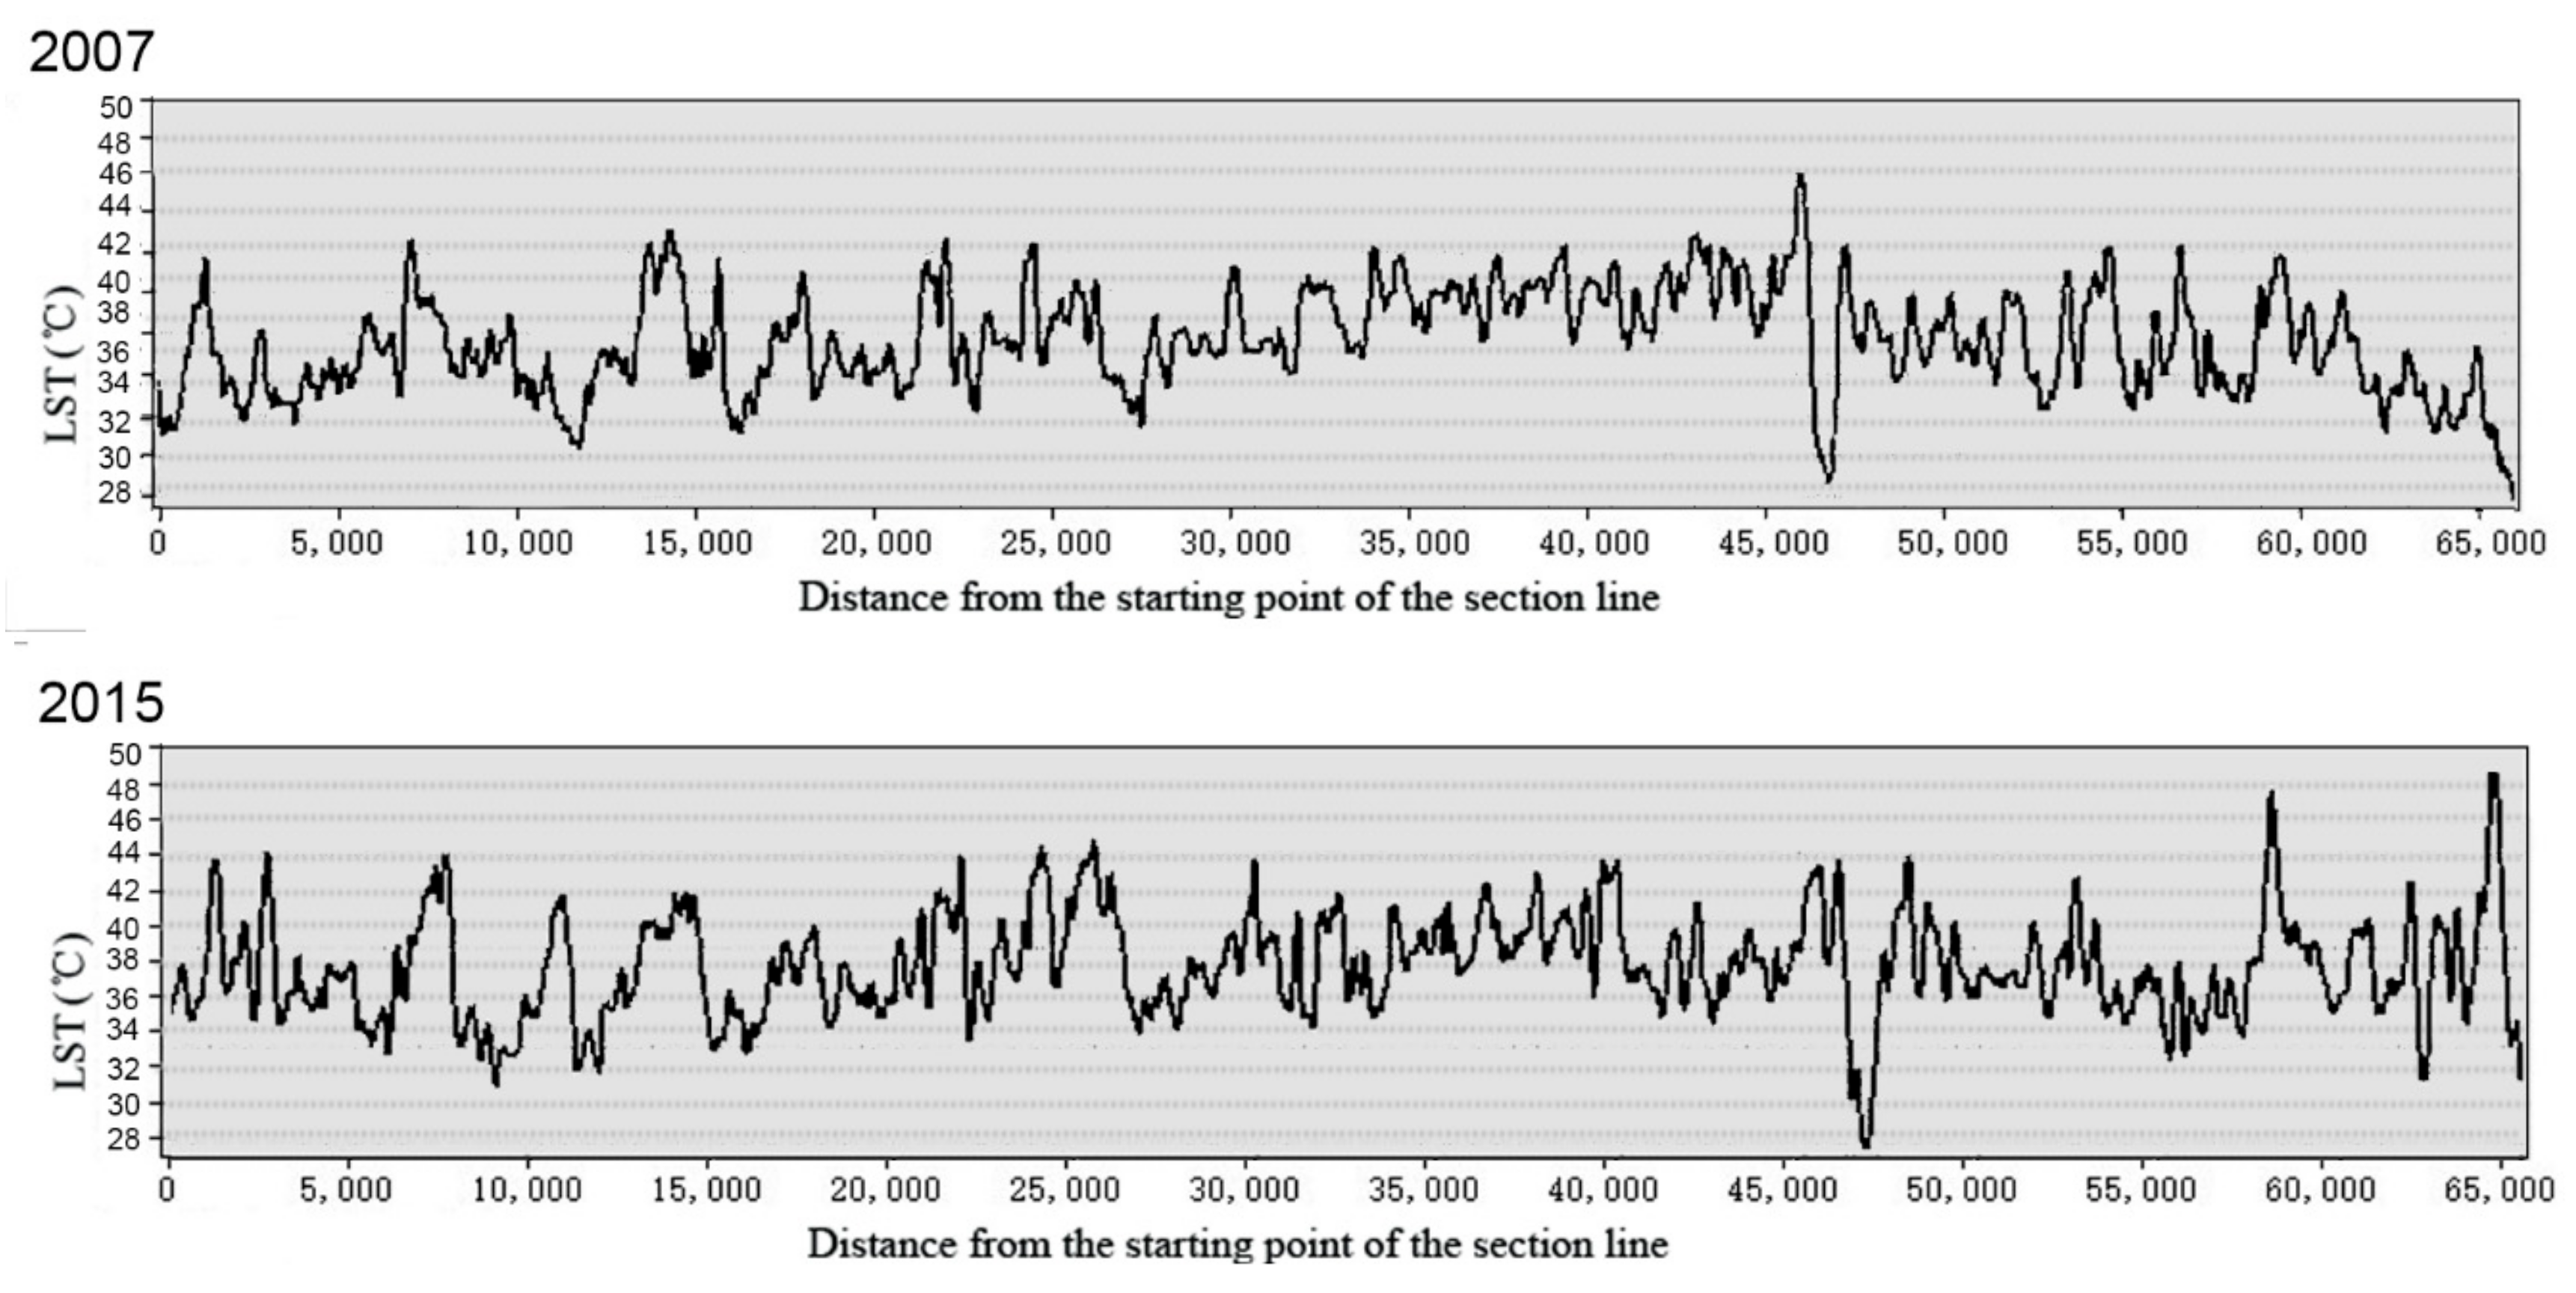
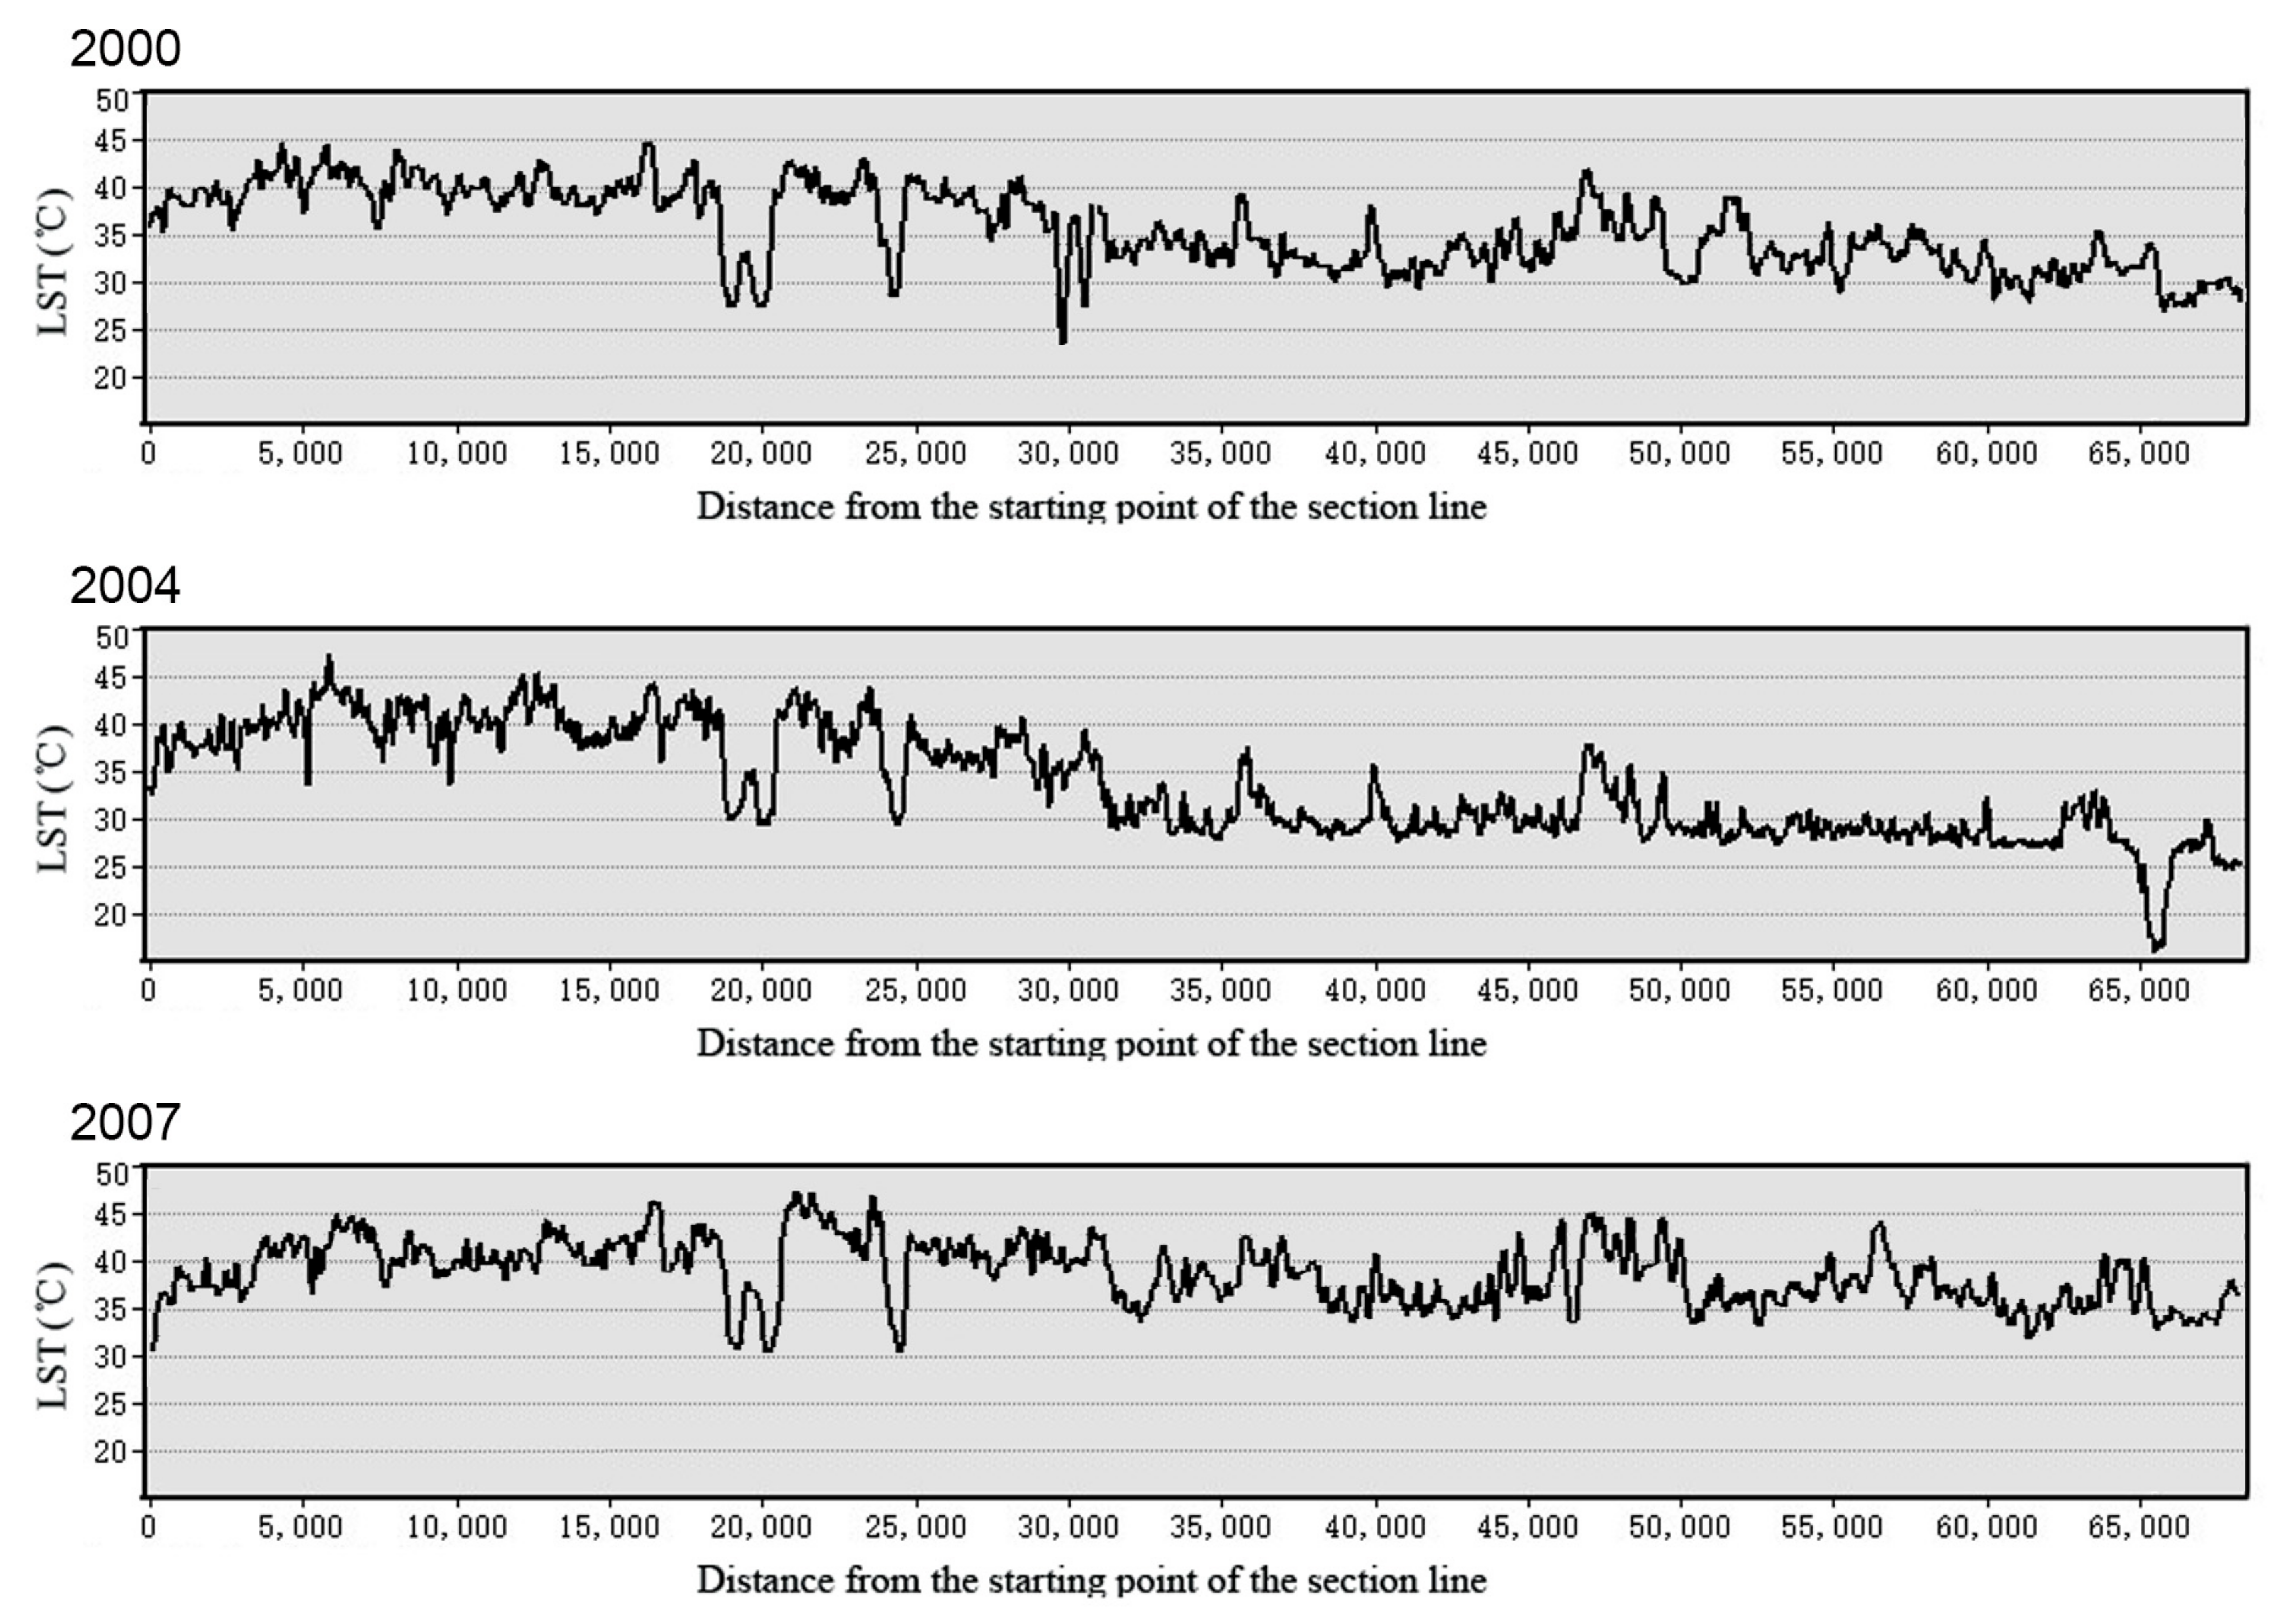
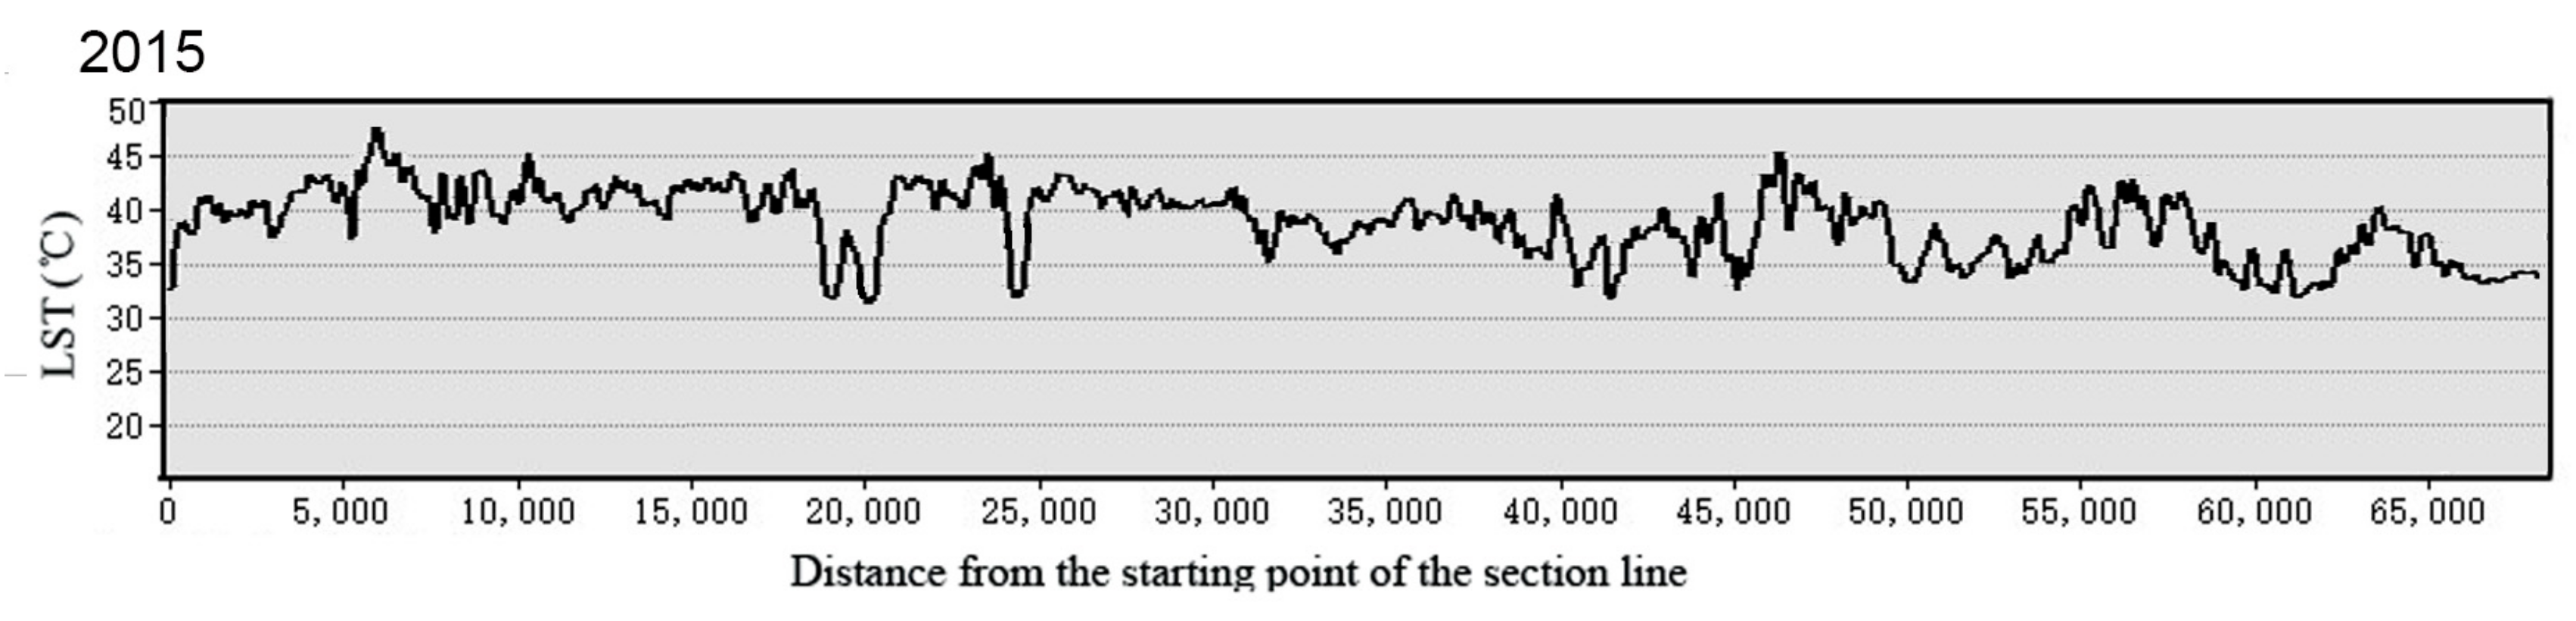
3.1.2. Temporal Distribution Characteristics of Urban Surface UHI
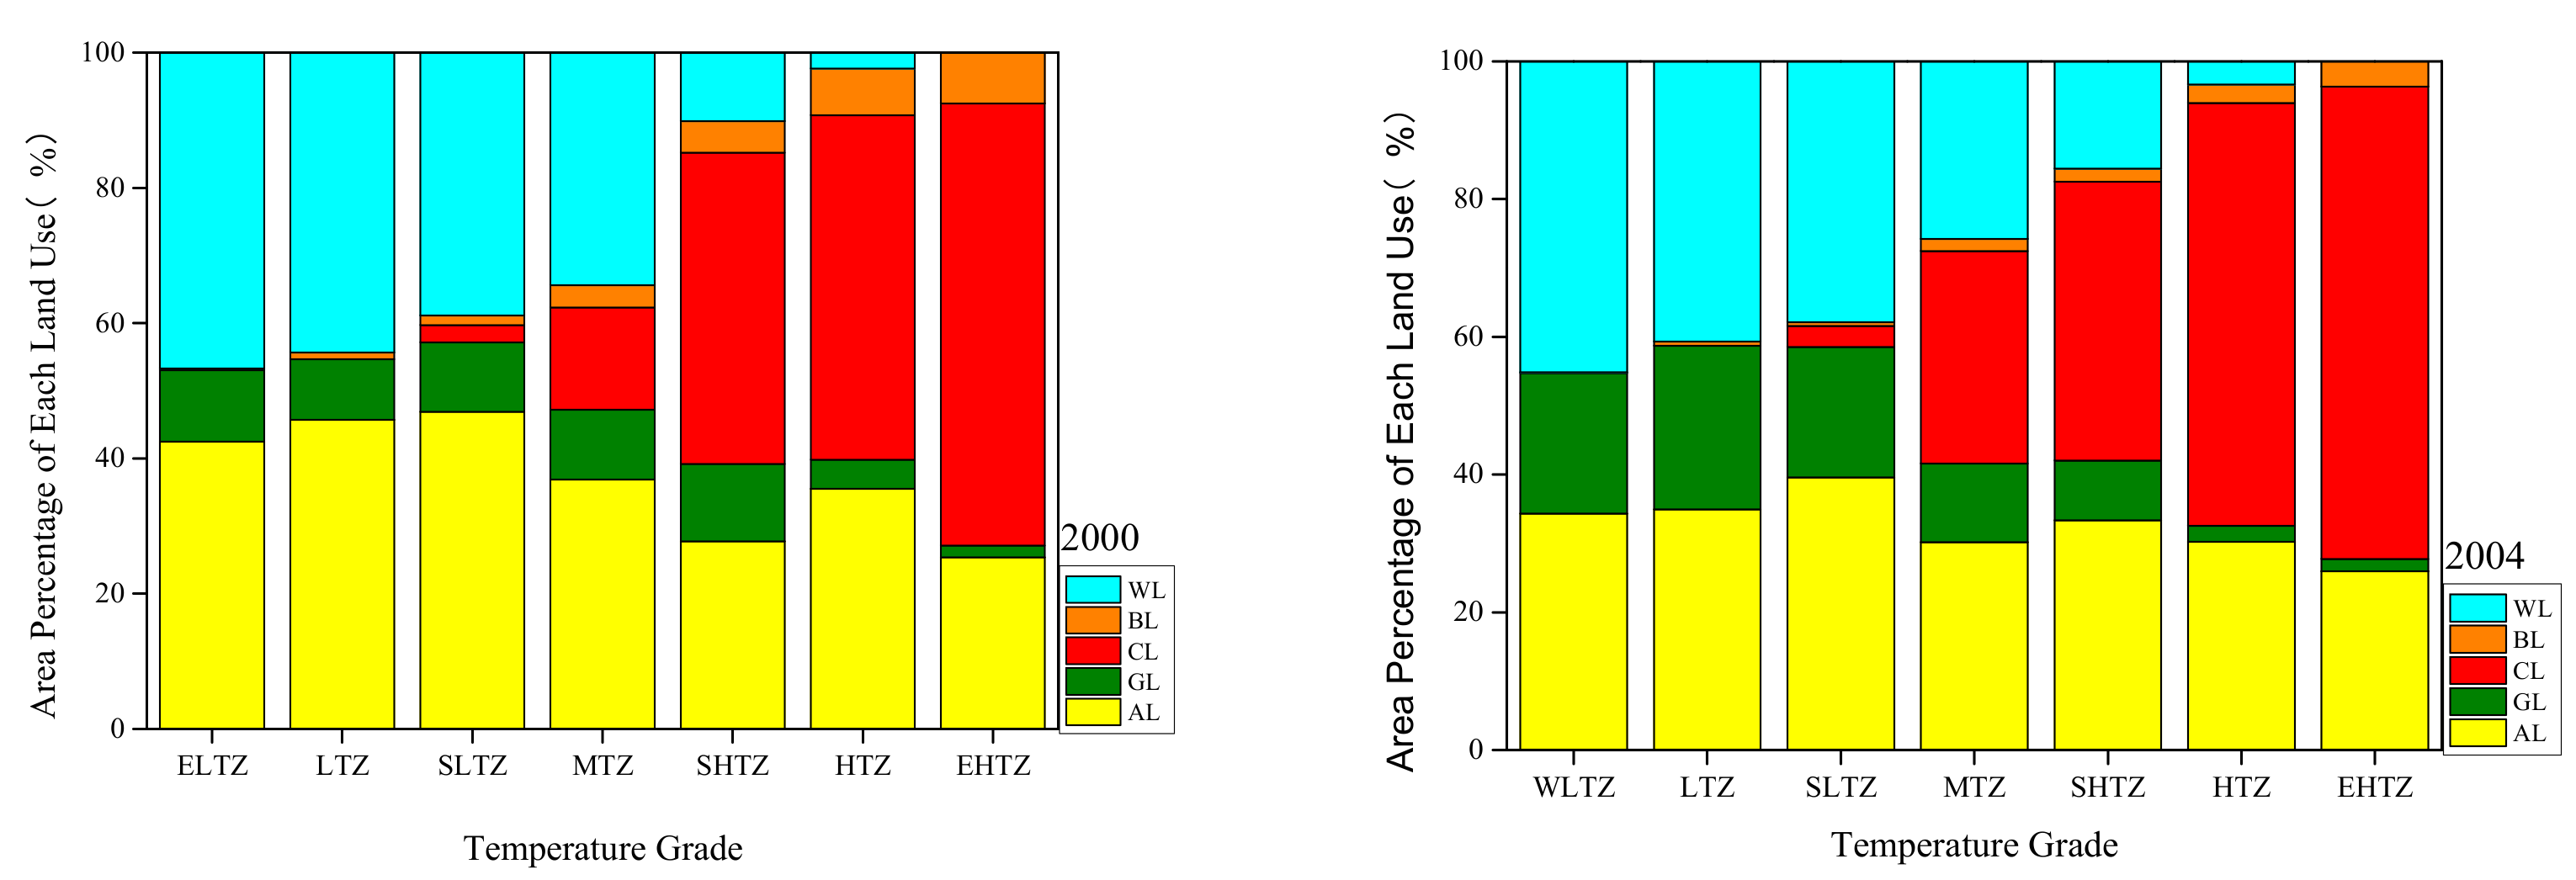
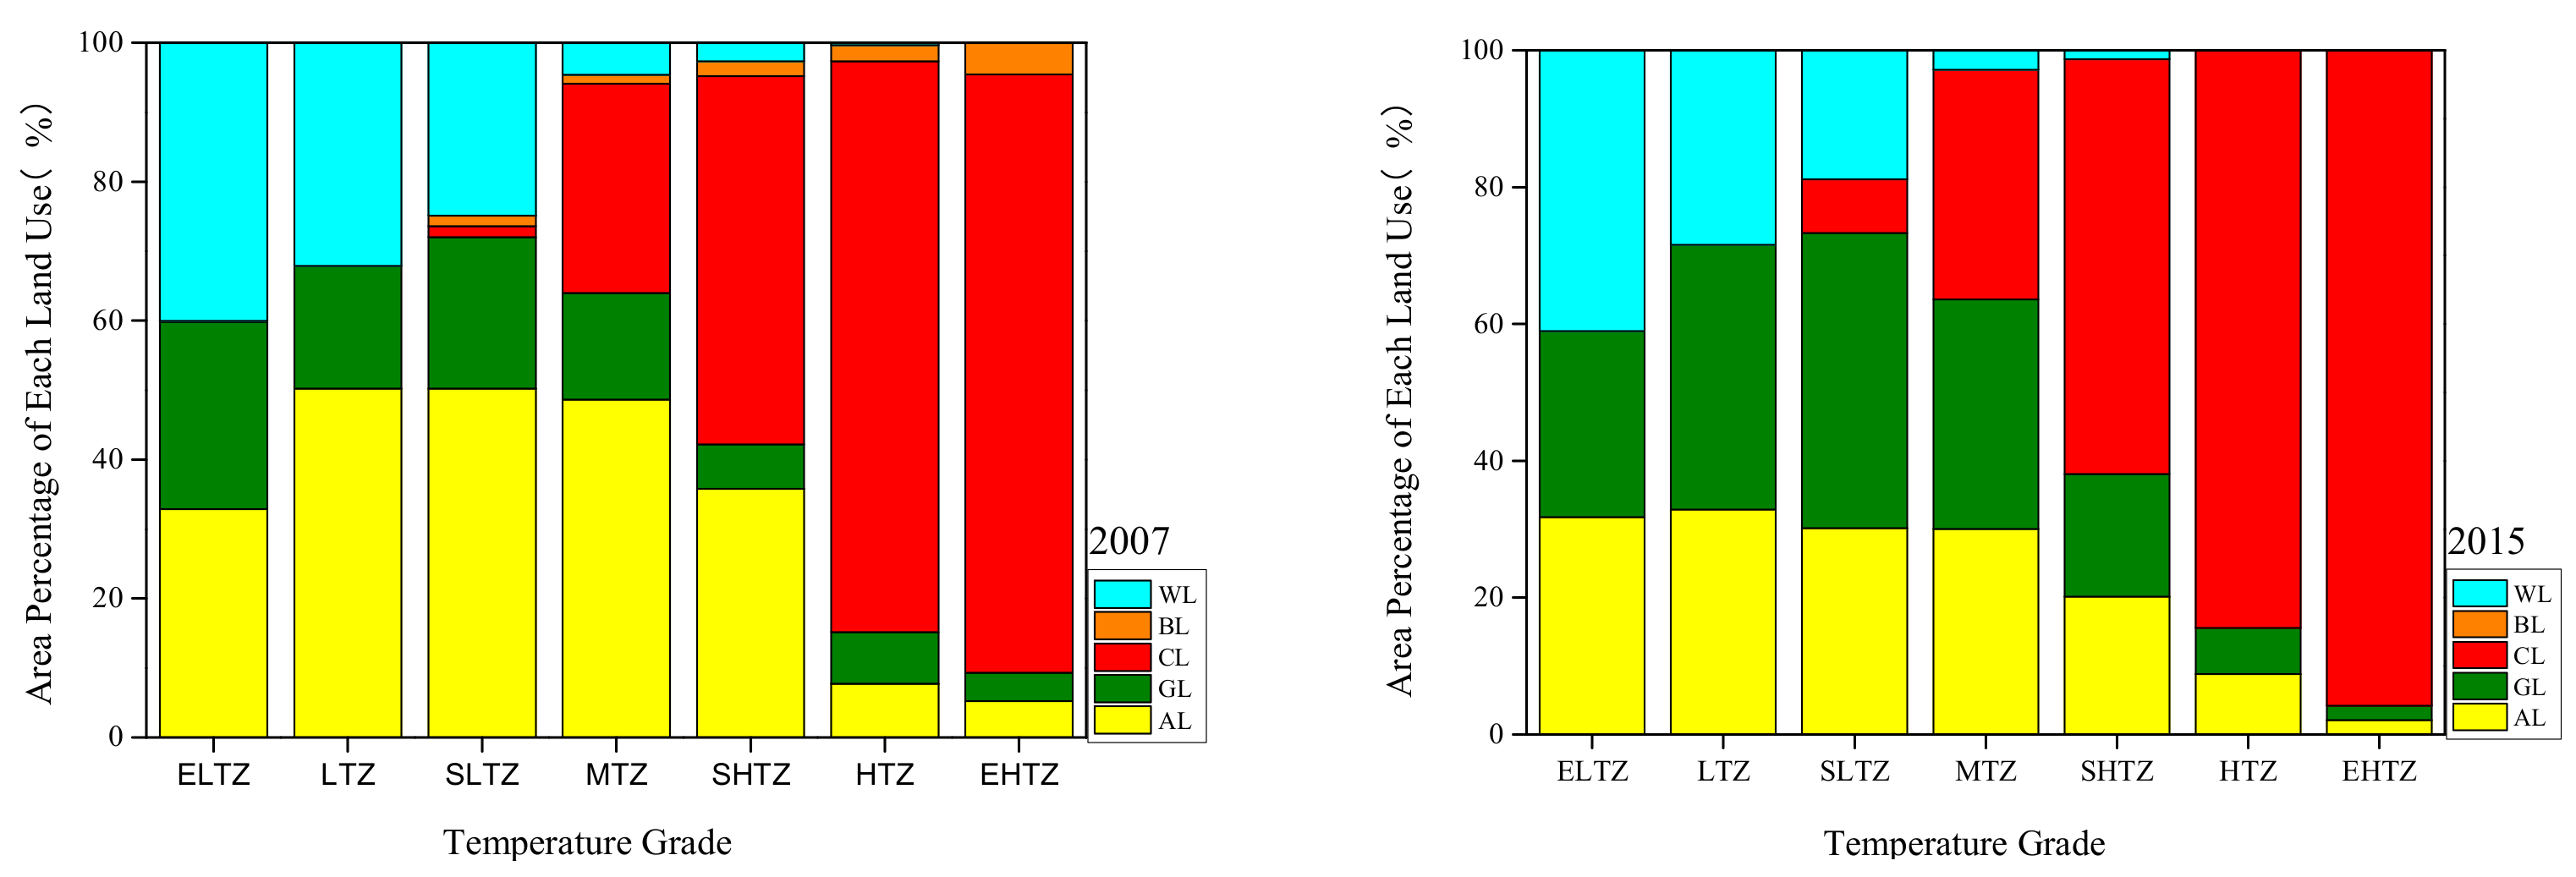
3.2. Spatial and Temporal Pattern of Urban Underlying Surface
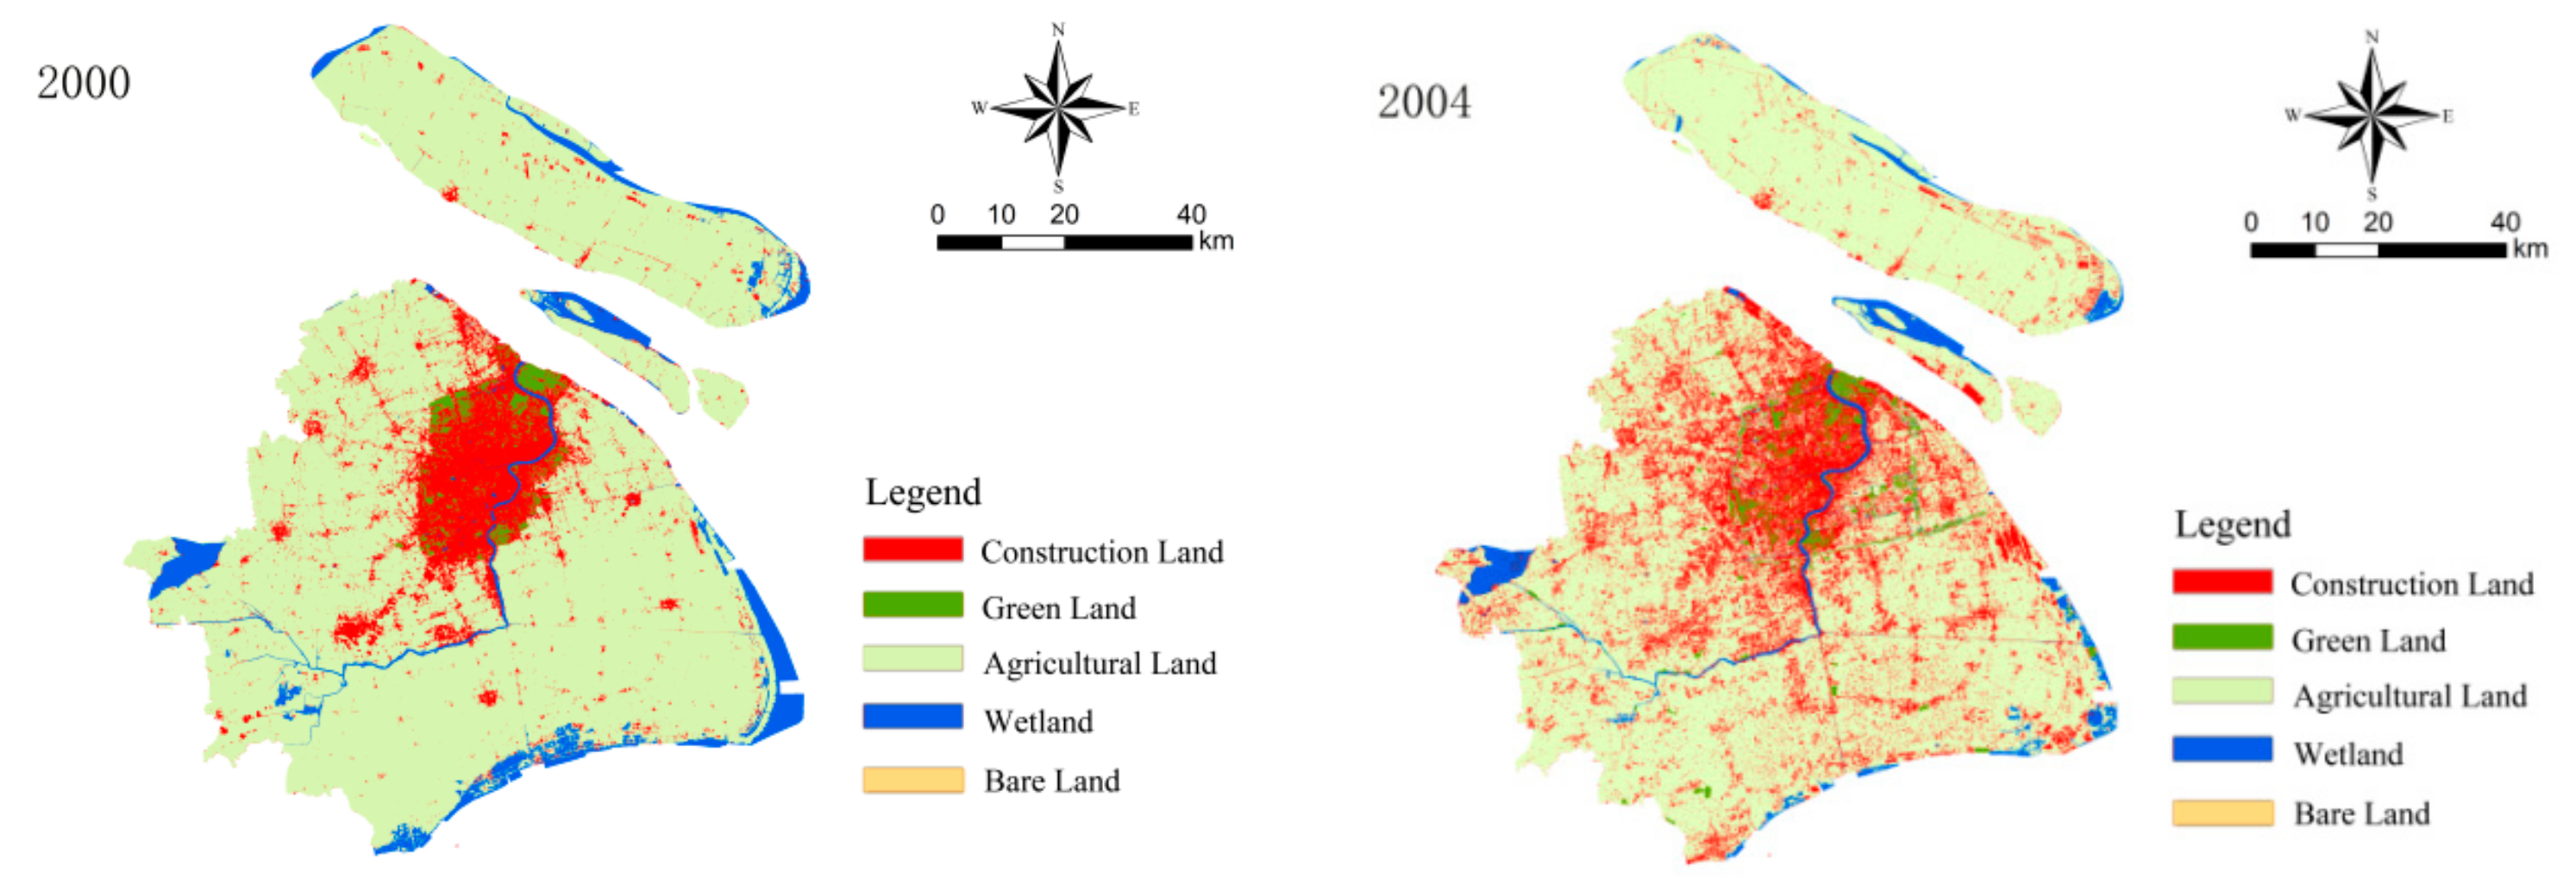
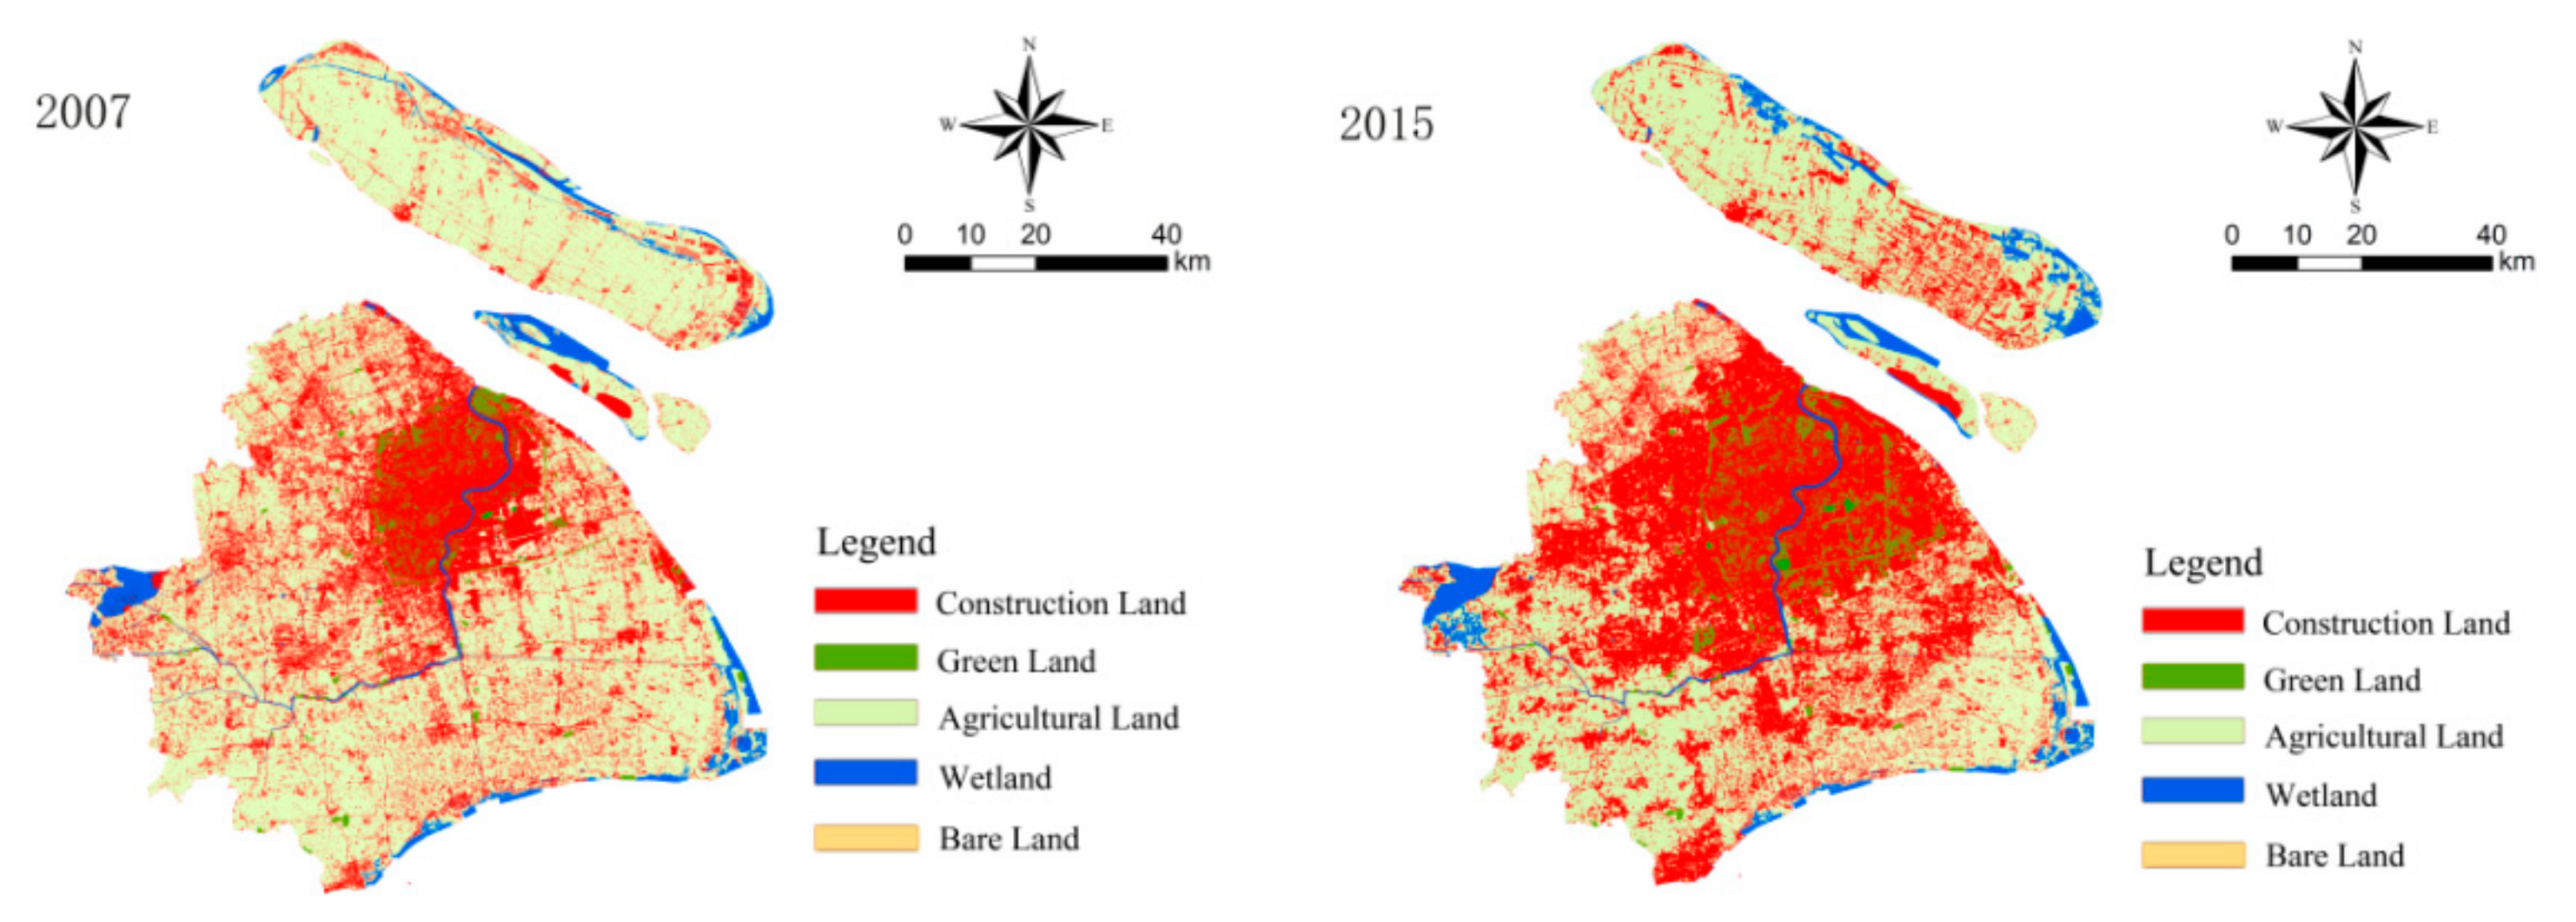
3.2.1. Spatial Distribution Characteristics of Urban Underlying Surface
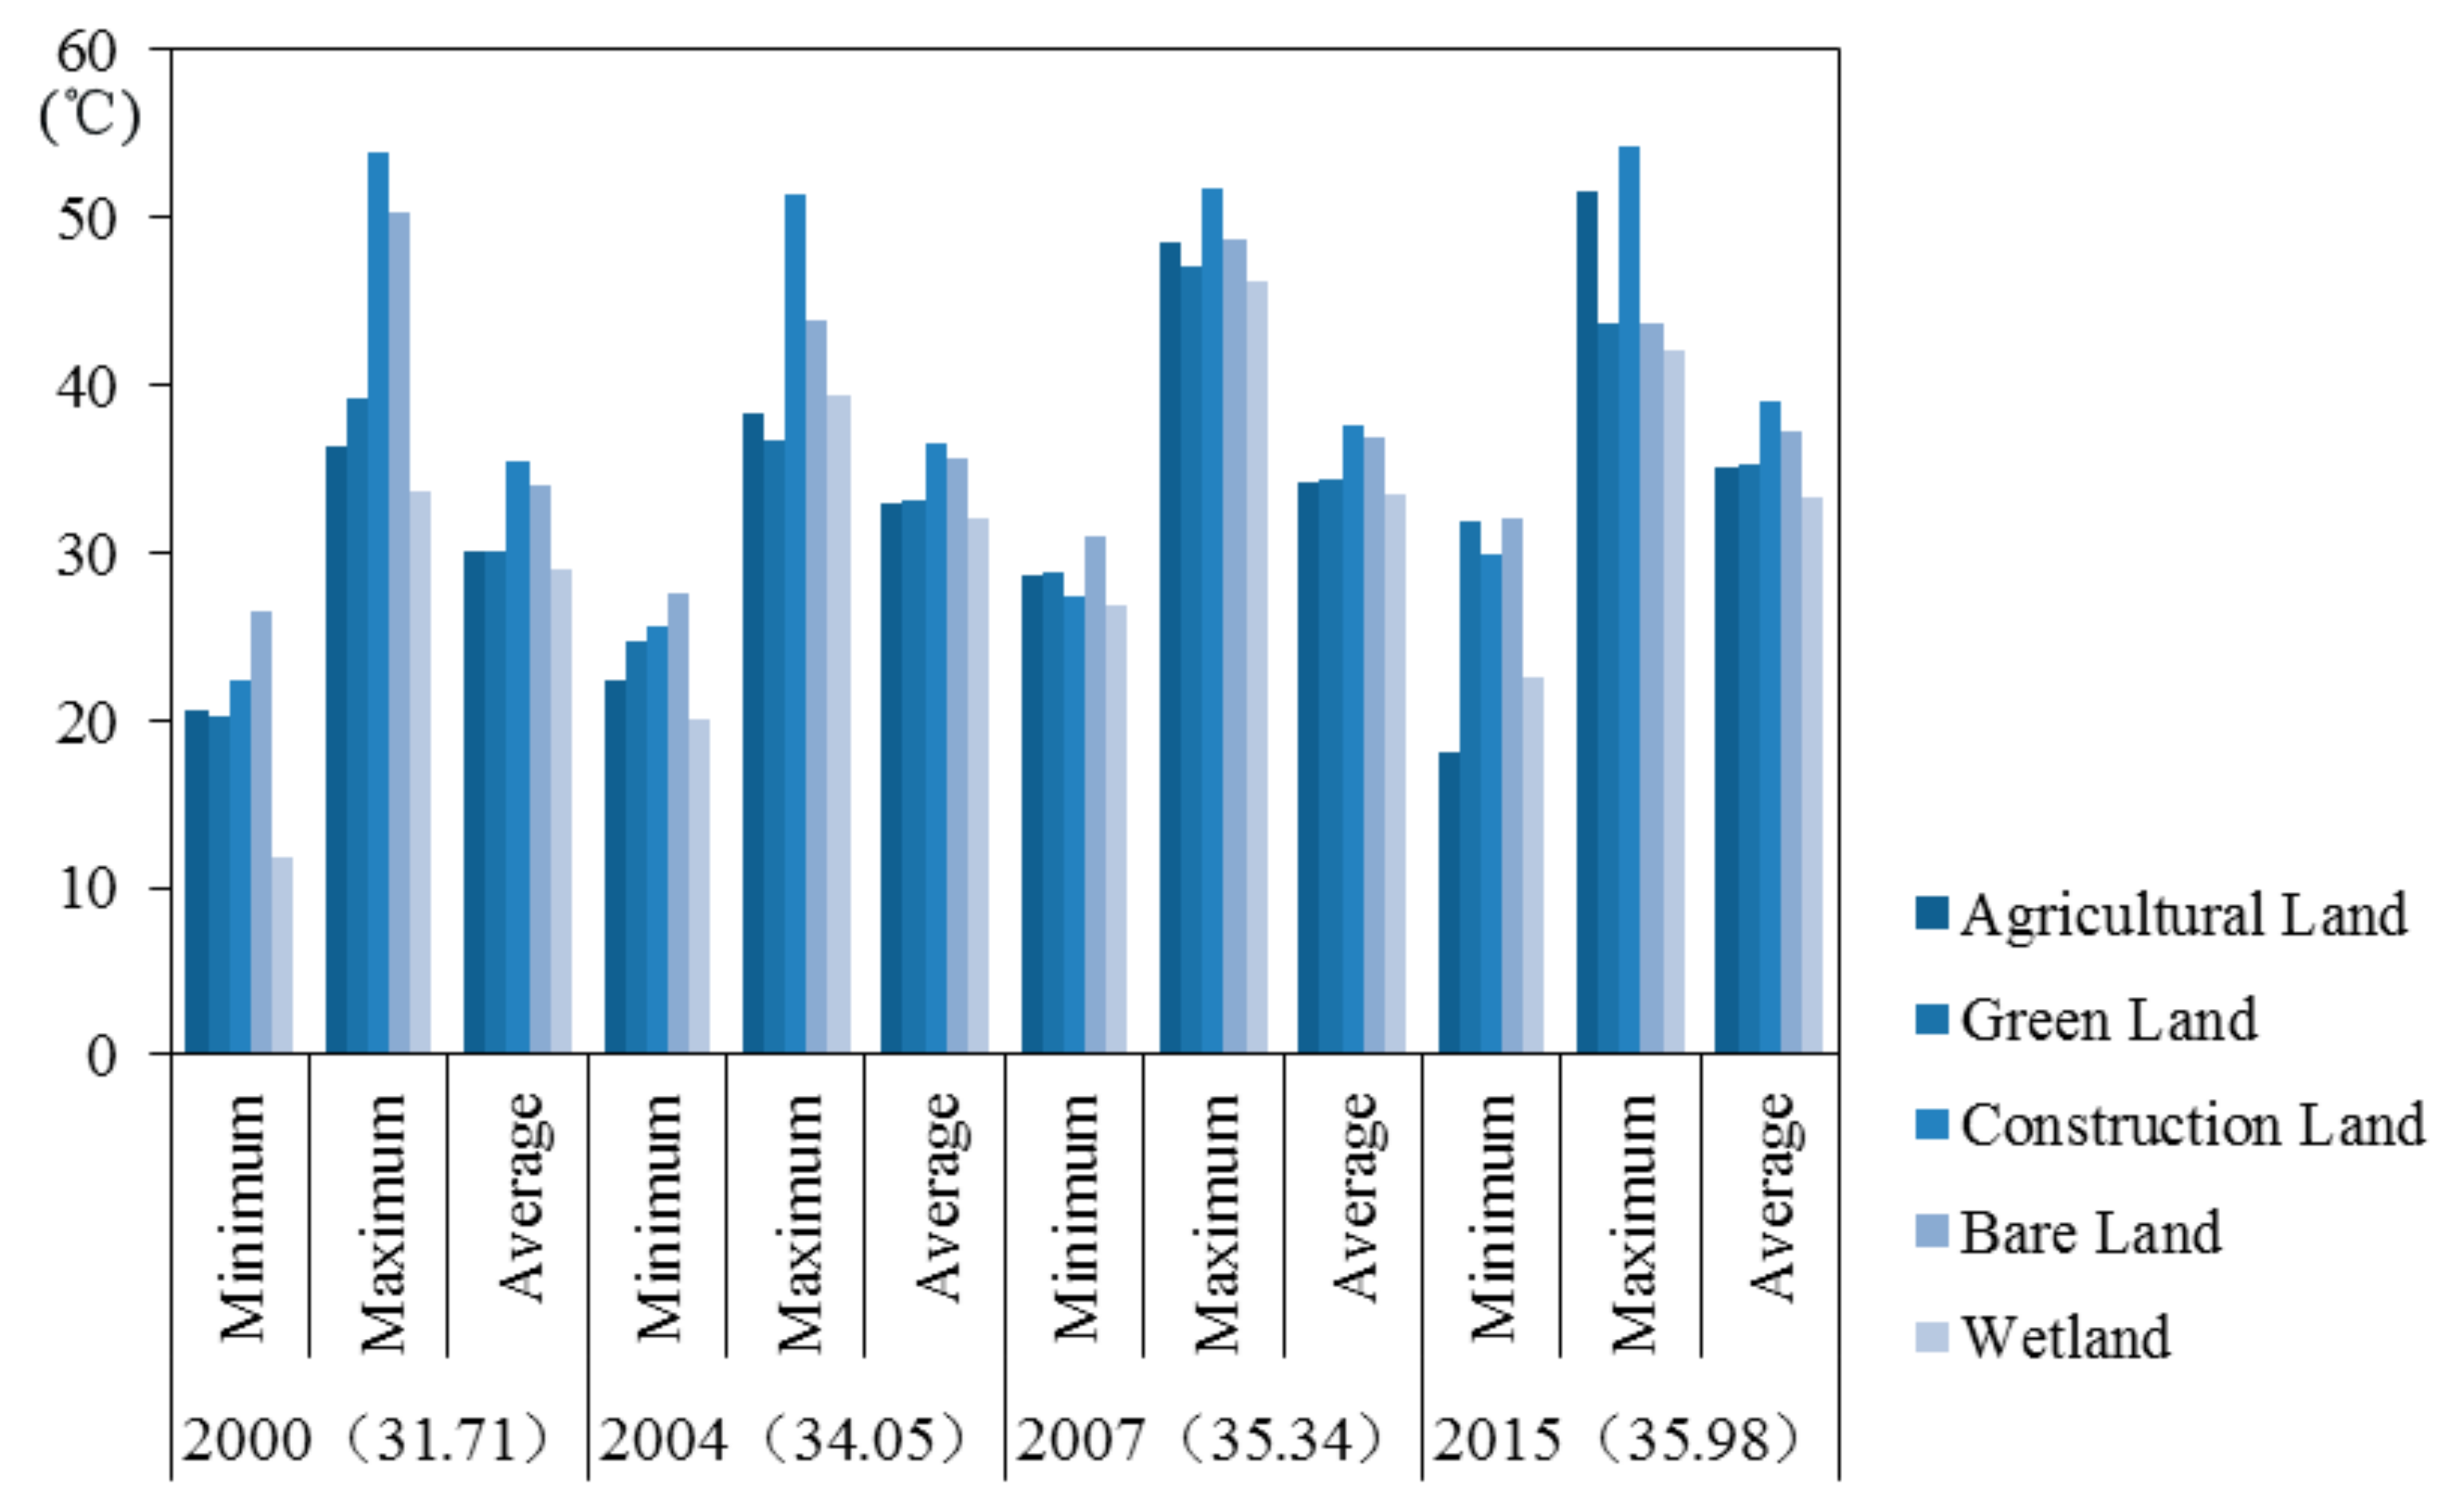
3.2.2. Temporal Distribution Characteristics of Urban Underlying Surface
3.3. Relation between the Dynamics of Urban LST and Underlying Surface
4. Discussion
4.1. The Relationship between Land Use and LST
4.2. The Relationship between LST and the Strategies of Urban Planning
5. Conclusions
Author Contributions
Funding
Acknowledgments
Conflicts of Interest
References
- Lai, L.-W.; Cheng, W.-L. Urban heat island and air pollution—An emerging role for hospital respiratory admissions in an urban area. J. Environ. Heal. 2010, 72, 32–36. [Google Scholar]
- Zhong, S.; Qian, Y.; Zhao, C.; Leung, R.; Wang, H.; Yang, B.; Fan, J.; Yan, H.; Yang, X.-Q.; Liu, N. Urbanization-induced urban heat island and aerosol effects on climate extremes in the Yangtze River Delta region of China. Atmos. Chem. Phys. Discuss. 2017, 17, 5439–5457. [Google Scholar] [CrossRef] [Green Version]
- Fung, W.; Lam, K.; Hung, W.; Pang, S.; Lee, Y. Impact of urban temperature on energy consumption of Hong Kong. Energy 2006, 31, 2623–2637. [Google Scholar] [CrossRef]
- Kikegawa, Y.; Genchi, Y.; Kondo, H.; Hanaki, K. Impacts of city-block-scale countermeasures against urban heat-island phenomena upon a building’s energy-consumption for air-conditioning. Appl. Energy 2006, 83, 649–668. [Google Scholar] [CrossRef]
- Kolokotroni, M.; Giannitsaris, I.; Watkins, R. The effect of the London urban heat island on building summer cooling demand and night ventilation strategies. Sol. Energy 2006, 80, 383–392. [Google Scholar] [CrossRef]
- Santamouris, M.; Cartalis, C.; Synnefa, A.; Kolokotsa, D. On the impact of urban heat island and global warming on the power demand and electricity consumption of buildings—A review. Energy Build. 2015, 98, 119–124. [Google Scholar] [CrossRef]
- Tan, J.; Zheng, Y.; Tang, X.; Guo, C.; Li, L.; Song, G.; Zhen, X.; Yuan, D.; Kalkstein, A.J.; Li, F. The urban heat island and its impact on heat waves and human health in Shanghai. Int. J. Biometeorol. 2010, 54, 75–84. [Google Scholar] [CrossRef]
- Shahmohamadi, P.; Che-Ani, A.; Etessam, I.; Maulud, K.; Tawil, N. Healthy Environment: The Need to Mitigate Urban Heat Island Effects on Human Health. Procedia Eng. 2011, 20, 61–70. [Google Scholar] [CrossRef] [Green Version]
- Gao, L.; Yun, L.; Ren, Y.; Cui, Z.; Bi, H. Spatial and temporal change of landscape Pattern in the hilly-Gully region of loess Plateau. Procedia Environ. Sci. 2011, 8, 103–111. [Google Scholar]
- Huang, J.; Pontius, R.G.; Li, Q.; Zhang, Y. Use of intensity analysis to link patterns with processes of land change from 1986 to 2007 in a coastal watershed of southeast China. Appl. Geogr. 2012, 34, 371–384. [Google Scholar] [CrossRef]
- Kaza, N. The changing urban landscape of the continental United States. Landsc. Urban Plan. 2013, 110, 74–86. [Google Scholar] [CrossRef]
- Renard, F.; Alonso, L.; Fitts, Y.; Hadjiosif, A.; Comby, J. Evaluation of the Effect of Urban Redevelopment on Surface Urban Heat Islands. Remote Sens. 2019, 11, 299. [Google Scholar] [CrossRef] [Green Version]
- Tan, Z.; Lau, K.K.-L.; Ng, E. Urban tree design approaches for mitigating daytime urban heat island effects in a high-density urban environment. Energy Build. 2016, 114, 265–274. [Google Scholar] [CrossRef]
- Wang, C.; Myint, S.W.; Wang, Z.; Song, J. Spatio-Temporal Modeling of the Urban Heat Island in the Phoenix Metropolitan Area: Land Use Change Implications. Remote Sens. 2016, 8, 185. [Google Scholar] [CrossRef] [Green Version]
- Gago, E.; Roldán, J.; Pacheco-Torres, R.; Ordóñez, J. The city and urban heat islands: A review of strategies to mitigate adverse effects. Renew. Sustain. Energy Rev. 2013, 25, 749–758. [Google Scholar] [CrossRef]
- Akbari, H.; Cartalis, C.; Kolokotsa, D.; Muscio, A.; Pisello, A.L.; Rossi, F.; Santamouris, M.; Synnefa, A.; Wong, N.H.; Zinzi, M. Local climate change and urban heat island mitigation techniques–the state of the art. J. Civ. Eng. Manag. 2016, 22, 1–16. [Google Scholar] [CrossRef] [Green Version]
- Bokaie, M.; Zarkesh, M.K.; Arasteh, P.D.; Hosseini, A. Assessment of Urban Heat Island based on the relationship between land surface temperature and Land Use/ Land Cover in Tehran. Sustain. Cities Soc. 2016, 23, 94–104. [Google Scholar] [CrossRef]
- Singh, P.; Kikon, N.; Verma, P. Impact of land use change and urbanization on urban heat island in Lucknow city, Central India. A remote sensing based estimate. Sustain. Cities Soc. 2017, 32, 100–114. [Google Scholar] [CrossRef]
- Dissanayake, D.; Morimoto, T.; Ranagalage, M.; Murayama, Y. Land-Use/Land-Cover Changes and Their Impact on Surface Urban Heat Islands: Case Study of Kandy City, Sri Lanka. Climate 2019, 7, 99. [Google Scholar] [CrossRef] [Green Version]
- Nastran, M.; Kobal, M.; Eler, K. Urban heat islands in relation to green land use in European cities. Urban For. Urban Green. 2019, 37, 33–41. [Google Scholar] [CrossRef] [Green Version]
- Li, J.; Song, C.; Cao, L.; Zhu, F.; Meng, X.; Wu, J. Impacts of landscape structure on surface urban heat islands: A case study of Shanghai, China. Remote Sens. Environ. 2011, 115, 3249–3263. [Google Scholar] [CrossRef]
- Guo, G.; Wu, Z.; Xiao, R.; Chen, Y.; Liu, X.; Zhang, X. Impacts of urban biophysical composition on land surface temperature in urban heat island clusters. Landsc. Urban Plan. 2015, 135, 1–10. [Google Scholar] [CrossRef]
- Kikon, N.; Singh, P.; Singh, S.K.; Vyas, A. Assessment of urban heat islands (UHI) of Noida City, India using multi-temporal satellite data. Sustain. Cities Soc. 2016, 22, 19–28. [Google Scholar] [CrossRef]
- Ramachandra, T.; Uttam, K. Land surface temperature with land cover dynamics: Multi-resolution, spatio-temporal data analysis of Greater Bangalore. Int. J. Geoinformatics 2009, 5, 44. [Google Scholar]
- Wang, Y.; Berardi, U.; Akbari, H. Comparing the effects of urban heat island mitigation strategies for Toronto, Canada. Energy Build. 2016, 114, 2–19. [Google Scholar] [CrossRef]
- Silva, J.S.; Da Silva, R.M.; Santos, C.A.G. Spatiotemporal impact of land use/land cover changes on urban heat islands: A case study of Paço do Lumiar, Brazil. Build. Environ. 2018, 136, 279–292. [Google Scholar] [CrossRef]
- Rao, P.K. Remote sensing of urban "heat islands" from an environmental satellite. Bull. Am. Meteorol. Soc. 1972, 53, 647–648. [Google Scholar]
- Li, X.; Li, W.; Middel, A.; Harlan, S.; Brazel, A.; Turner, B. Remote sensing of the surface urban heat island and land architecture in Phoenix, Arizona: Combined effects of land composition and configuration and cadastral–demographic–economic factors. Remote. Sens. Environ. 2016, 174, 233–243. [Google Scholar] [CrossRef] [Green Version]
- Zhang, K.; Wang, R.; Shen, C.; Da, L. Temporal and spatial characteristics of the urban heat island during rapid urbanization in Shanghai, China. Environ. Monit. Assess. 2010, 169, 101–112. [Google Scholar] [CrossRef]
- Zhang, H.; Qi, Z.-F.; Ye, X.-Y.; Cai, Y.-B.; Ma, W.-C.; Chen, M.-N. Analysis of land use/land cover change, population shift, and their effects on spatiotemporal patterns of urban heat islands in metropolitan Shanghai, China. Appl. Geogr. 2013, 44, 121–133. [Google Scholar] [CrossRef]
- Li, J.-J.; Wang, X.-R.; Wang, X.-J.; Ma, W.-C.; Zhang, H. Remote sensing evaluation of urban heat island and its spatial pattern of the Shanghai metropolitan area, China. Ecol. Complex. 2009, 6, 413–420. [Google Scholar] [CrossRef]
- Zhao, S.; Da, L.; Tang, Z.; Fang, H.; Song, K.; Fang, J. Ecological consequences of rapid urban expansion: Shanghai, China. Front. Ecol. Environ. 2006, 4, 341–346. [Google Scholar] [CrossRef]
- Li, W.; Bai, Y.; Chen, Q.; He, K.; Ji, X.; Han, C. Discrepant impacts of land use and land cover on urban heat islands: A case study of Shanghai, China. Ecol. Indic. 2014, 47, 171–178. [Google Scholar] [CrossRef]
- Zhao, M.; Cai, H.; Qiao, Z.; Xu, X. Influence of urban expansion on the urban heat island effect in Shanghai. Int. J. Geogr. Inf. Sci. 2016, 30, 1–21. [Google Scholar] [CrossRef]
- Ding, F.; Xu, H. Sensitivity analysis of mono-window and single-channel algorithms to the possible errors in parameter estimation. Sci. Surv. Mapp. 2007, 1, 87–90. [Google Scholar]
- Sobrino, J.A.; Jiménez-Muñoz, J.C.; Paolini, L. Land surface temperature retrieval from LANDSAT TM 5. Remote. Sens. Environ. 2004, 90, 434–440. [Google Scholar] [CrossRef]
- Anbazhagan, S.; Paramasivam, C. Statistical correlation between land surface temperature (LST) and vegetation index (NDVI) using multi-temporal landsat TM data. Int. J. Adv. Earth Sci. Eng. 2016, 5, 333–346. [Google Scholar]
- Oke, T.R. The energetic basis of the urban heat island. Q. J. R. Meteorol. Soc. 1982, 108, 1–24. [Google Scholar] [CrossRef]
- Sun, Y.; Zhang, X.; Ren, G.; Zwiers, F.W.; Hu, T. Contribution of urbanization to warming in China. Nat. Clim. Chang. 2016, 6, 706–709. [Google Scholar] [CrossRef]
- Du, H.; Ai, J.; Cai, Y.; Jiang, H.; Liu, P. Combined Effects of the Surface Urban Heat Island with Landscape Composition and Configuration Based on Remote Sensing: A Case Study of Shanghai, China. Sustainability 2019, 11, 2890. [Google Scholar] [CrossRef] [Green Version]
- Taha, H. Urban climates and heat islands: albedo, evapotranspiration, and anthropogenic heat. Energy Build. 1997, 25, 99–103. [Google Scholar] [CrossRef] [Green Version]
- Tan, C.L.; Tan, P.Y.; Wong, N.H.; Takasuna, H.; Kudo, T.; Takemasa, Y.; Lim, C.V.J.; Chua, H.X.V. Impact of soil and water retention characteristics on green roof thermal performance. Energy Build. 2017, 152, 830–842. [Google Scholar] [CrossRef]
- Steeneveld, G.-J.; Koopmans, S.; Heusinkveld, B.; Theeuwes, N. Refreshing the role of open water surfaces on mitigating the maximum urban heat island effect. Landsc. Urban Plan. 2014, 121, 92–96. [Google Scholar] [CrossRef]
- Yin, C.; Yuan, M.; Lu, Y.; Huang, Y.; Liu, Y. Effects of urban form on the urban heat island effect based on spatial regression model. Sci. Total. Environ. 2018, 634, 696–704. [Google Scholar] [CrossRef] [PubMed]
- Mohajerani, A.; Bakaric, J.; Jeffrey-Bailey, T. The urban heat island effect, its causes, and mitigation, with reference to the thermal properties of asphalt concrete. J. Environ. Manag. 2017, 197, 522–538. [Google Scholar] [CrossRef] [PubMed]


| Year | Subway Length | Population |
|---|---|---|
| 2000 | <30 km | 16.09 million |
| 2004 | <100 km | 18.35 million |
| 2007 | 236 km | 20.64 million |
| 2015 | 617 km | 24.15 million |
| Date | Temperature | Wind Speed | Weather |
|---|---|---|---|
| 2000.08.01 | 26–37 | gentle breeze | Sunny |
| 2000.07.31 | 28–35 | gentle breeze | Sunny |
| 2004.07.19 | 27–37 | gentle breeze | Sunny |
| 2004.07.18 | 29–36 | light breeze | Sunny |
| 2007.07.28 | 28–38 | gentle breeze | Sunny |
| 2007.07.27 | 29–37 | gentle breeze | Sunny |
| 2015.08.03 | 28–38 | gentle breeze | Sunny |
| 2015.08.02 | 29–38 | light breeze | Sunny |
| Satellite Sensor | Path/Row | Date |
|---|---|---|
| Landsat-7 ETM+ | 118/38, 118/39 | 2000.08.01 |
| Landsat-5 TM | 118/38, 118/39 | 2004.07.19 |
| Landsat-5 TM | 118/38, 118/39 | 2007.07.28 |
| Landsat-8 OLI/TIRS | 118/38, 118/39 | 2015.08.03 |
| TIRS 1 | TIRS 2 | TM | ETM+ | |
|---|---|---|---|---|
| 774.89 | 480.89 | 607.66 | 666.09 | |
| 1321.08 | 1201.14 | 1260.56 | 1282.7 |
| Temperature Grade | The Temperature Threshold |
|---|---|
| Extremely Low Temperature Zone (ELTZ) | D ≤ x − 2.5s |
| Low Temperature Zone (LTZ) | x − 2.5s < D ≤ x − 1.5s |
| Slightly Low Temperature Zone (SLTZ) | x − 1.5s < D ≤ x − 0.5s |
| Medium Temperature Zone (MTZ) | x − 0.5s < D ≤ x + 0.5s |
| Slightly High Temperature Zone (SHTZ) | x + 0.5s < D ≤ x + 1.5s |
| High Temperature Zone (HTZ) | x + 1.5s < D ≤ x + 2.5s |
| Extremely High Temperature Zone (EHTZ) | D > x + 2.5s |
| Temperature Grade | 2000 | 2004 | 2007 | 2015 | 2000–2004 Annual Change | 2004–2007 Annual Change | 2007–2015 Annual Change |
|---|---|---|---|---|---|---|---|
| ELTZ | 0.20 | 0.16 | 0.72 | 0.59 | −0.04 | 0.56 | −0.13 |
| LTZ | 3.55 | 2.79 | 2.83 | 1.40 | −0.76 | 0.04 | −1.43 |
| SLTZ | 31.64 | 31.17 | 30.73 | 16.14 | −0.47 | −0.04 | −14.59 |
| MTZ | 40.71 | 40.17 | 39.02 | 36.48 | −0.54 | −1.15 | −2.54 |
| SHTZ | 15.34 | 16.26 | 17.41 | 28.81 | 0.92 | 1.15 | 11.40 |
| HTZ | 7.24 | 8.13 | 8.03 | 14.44 | 0.91 | −0.10 | 6.11 |
| EHTZ | 1.32 | 1.34 | 1.26 | 2.14 | 0.02 | −0.08 | 0.88 |
| Year | AL | GL | CL | BL | WL |
|---|---|---|---|---|---|
| 2000 | 37.95 | 7.81 | 25.31 | 3.74 | 25.19 |
| 2004 | 35.15 | 12.00 | 29.14 | 1.68 | 24.03 |
| 2007 | 32.97 | 14.11 | 36.81 | 1.27 | 14.84 |
| 2015 | 21.71 | 24.87 | 40.70 | 0.36 | 12.36 |
© 2020 by the authors. Licensee MDPI, Basel, Switzerland. This article is an open access article distributed under the terms and conditions of the Creative Commons Attribution (CC BY) license (http://creativecommons.org/licenses/by/4.0/).
Share and Cite
Du, H.; Zhou, F.; Li, C.; Cai, W.; Jiang, H.; Cai, Y. Analysis of the Impact of Land Use on Spatiotemporal Patterns of Surface Urban Heat Island in Rapid Urbanization, a Case Study of Shanghai, China. Sustainability 2020, 12, 1171. https://doi.org/10.3390/su12031171
Du H, Zhou F, Li C, Cai W, Jiang H, Cai Y. Analysis of the Impact of Land Use on Spatiotemporal Patterns of Surface Urban Heat Island in Rapid Urbanization, a Case Study of Shanghai, China. Sustainability. 2020; 12(3):1171. https://doi.org/10.3390/su12031171
Chicago/Turabian StyleDu, Hongyu, Fengqi Zhou, Chunlan Li, Wenbo Cai, Hong Jiang, and Yongli Cai. 2020. "Analysis of the Impact of Land Use on Spatiotemporal Patterns of Surface Urban Heat Island in Rapid Urbanization, a Case Study of Shanghai, China" Sustainability 12, no. 3: 1171. https://doi.org/10.3390/su12031171