Towards Eco-Flowable Concrete Production


Abstract
:1. Introduction
2. Experimental Study
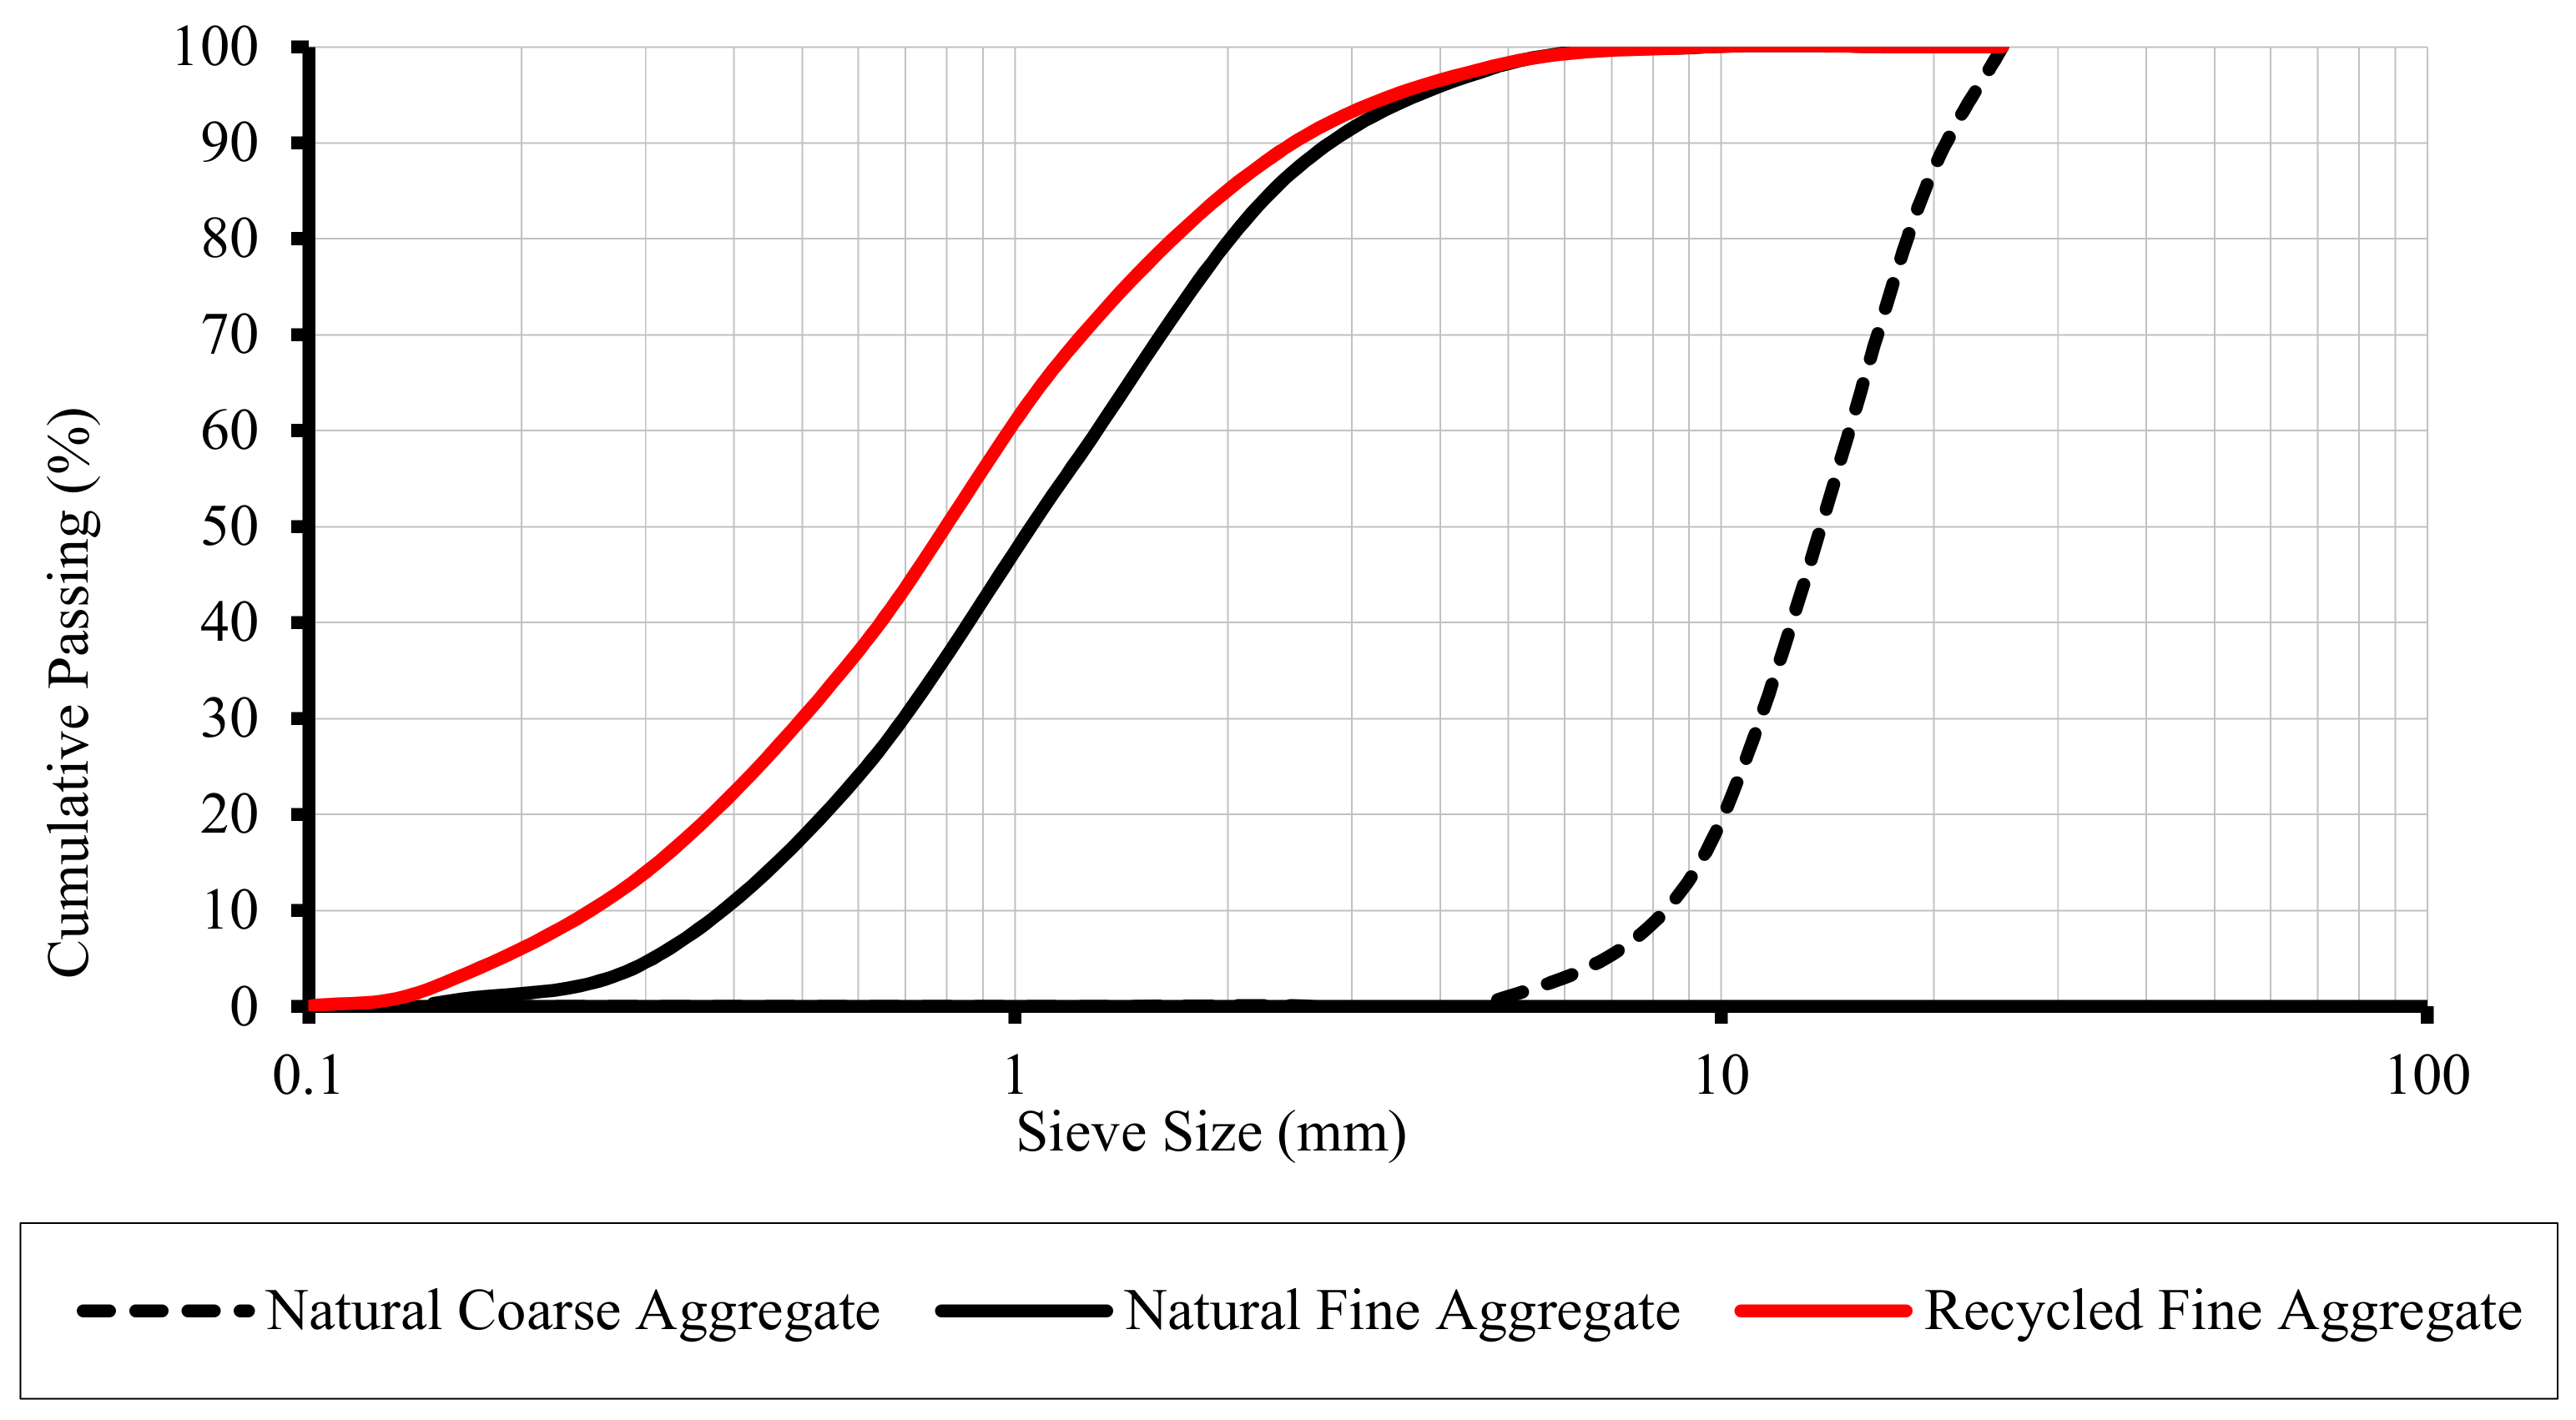
2.1. Materials and Mix Properties
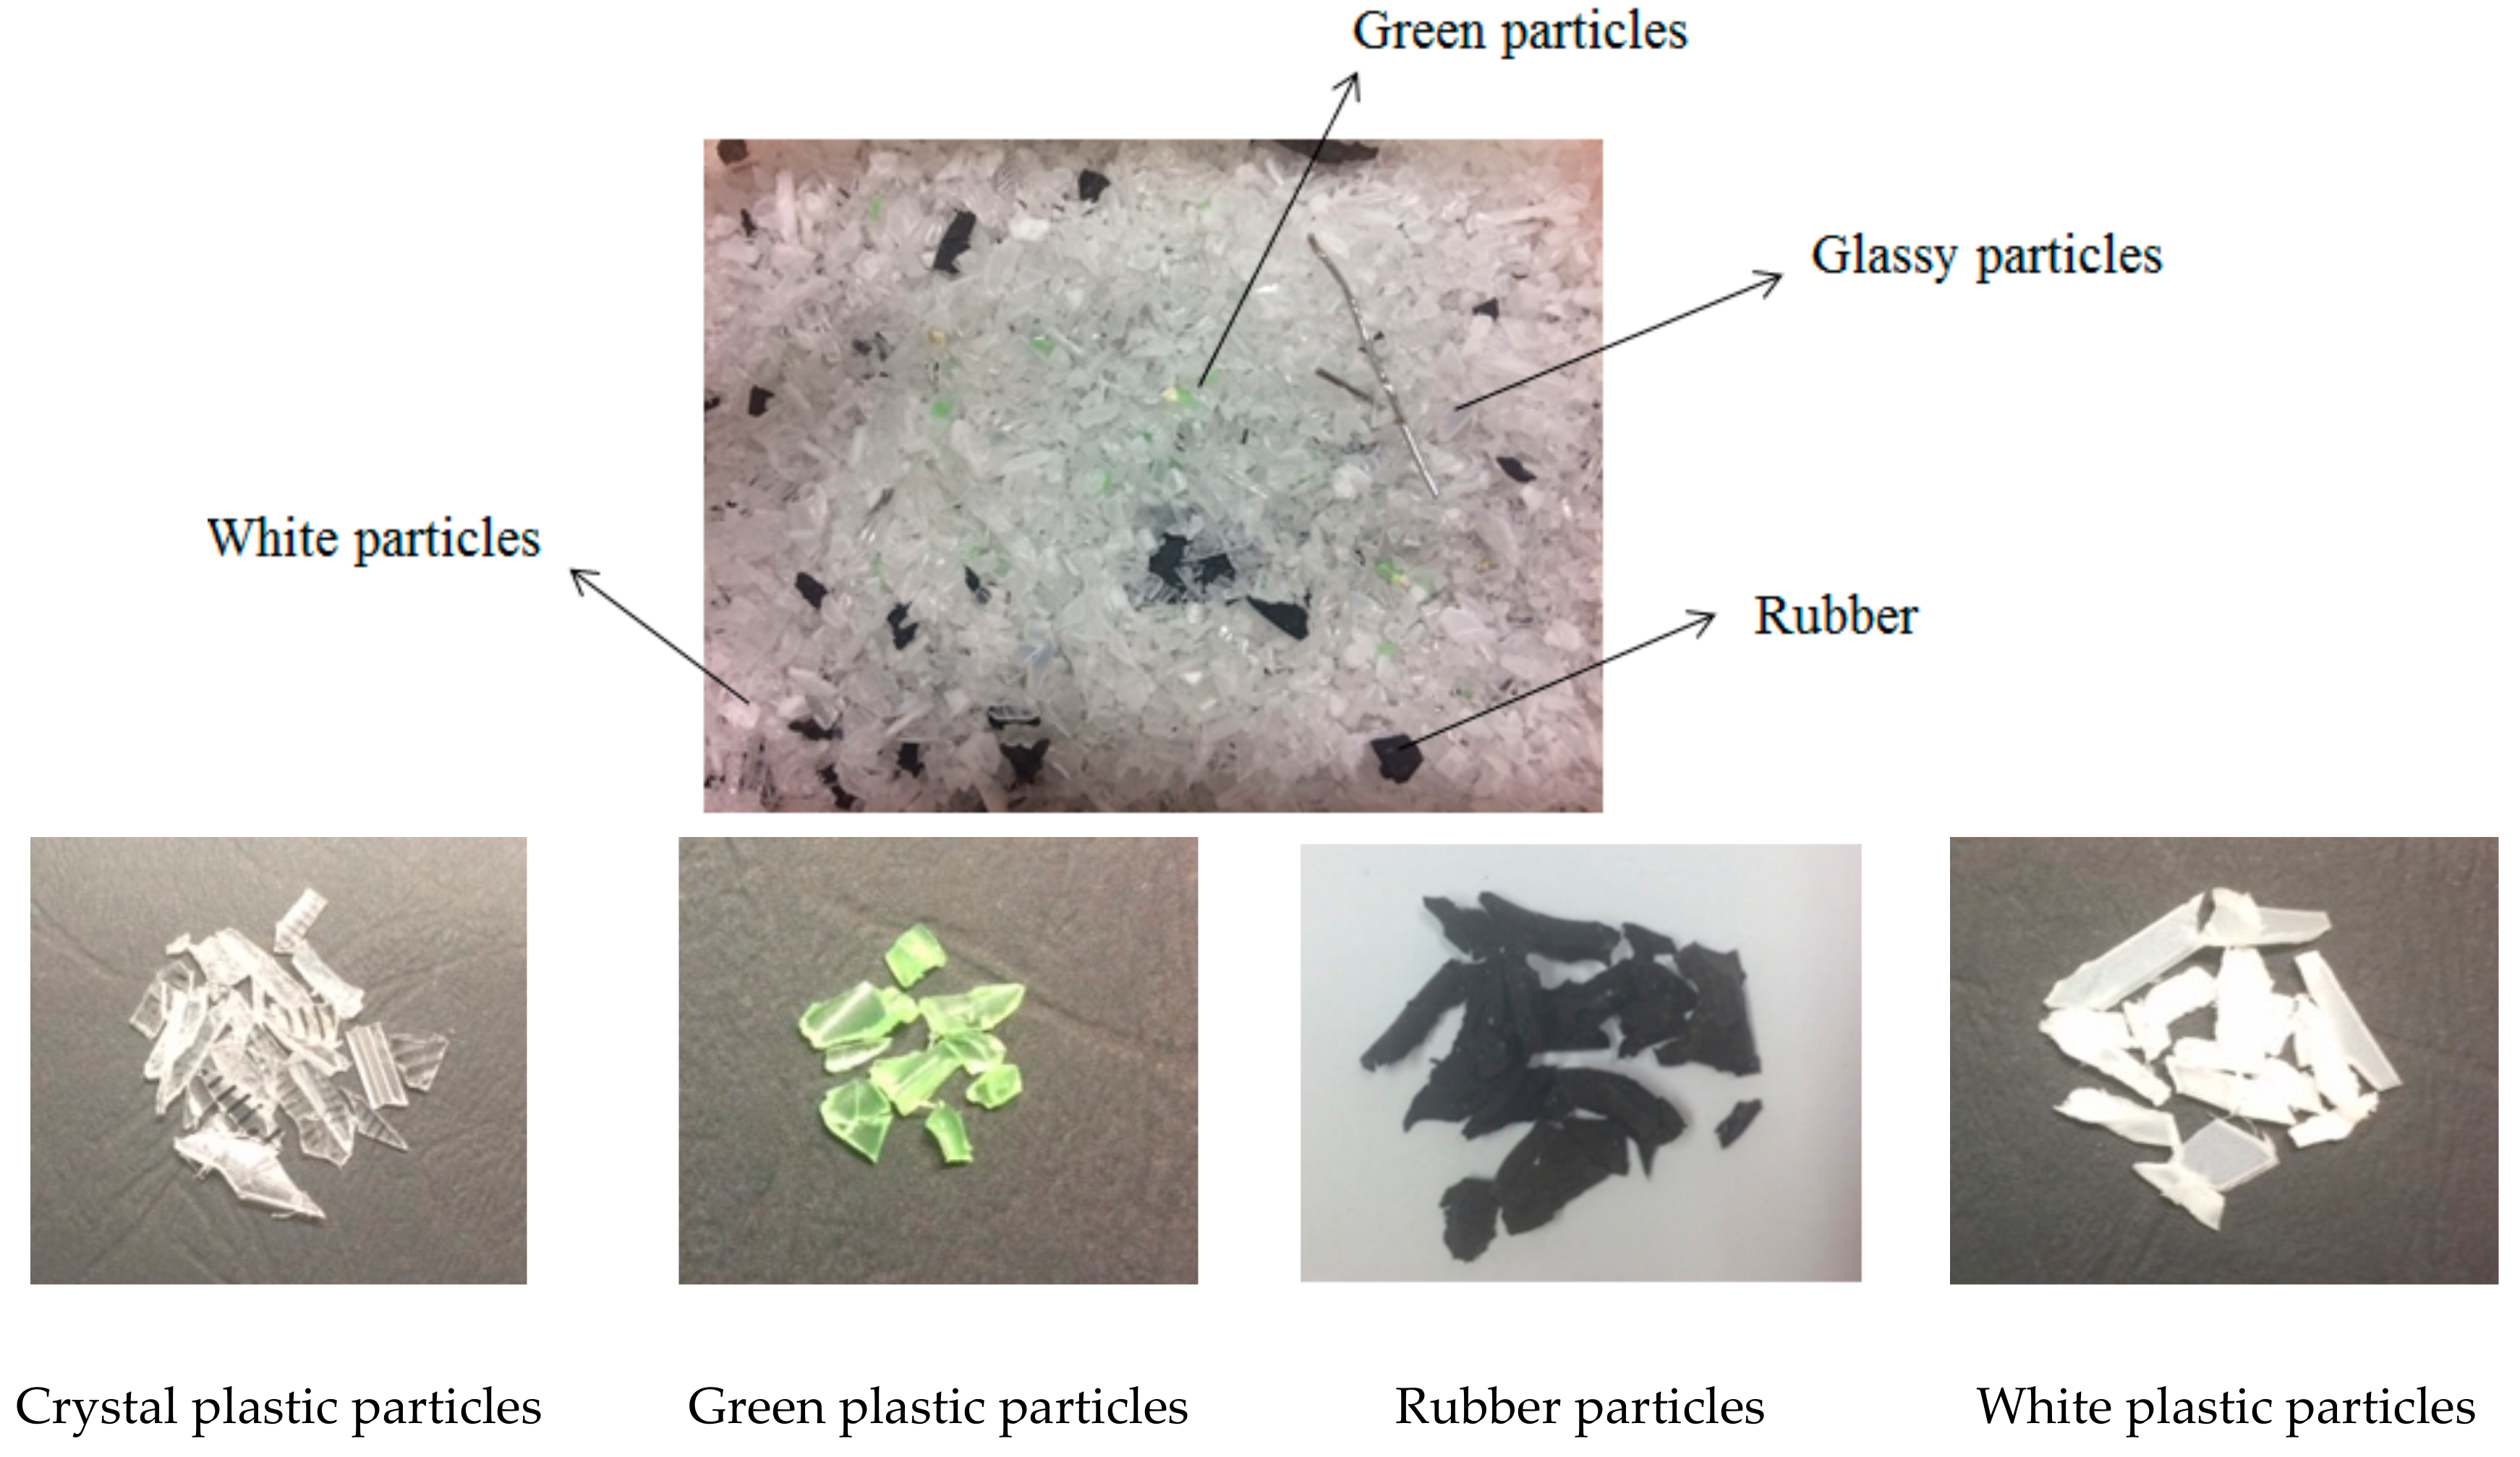
2.2. Preparation of Expired Plastic Syringe Aggregate
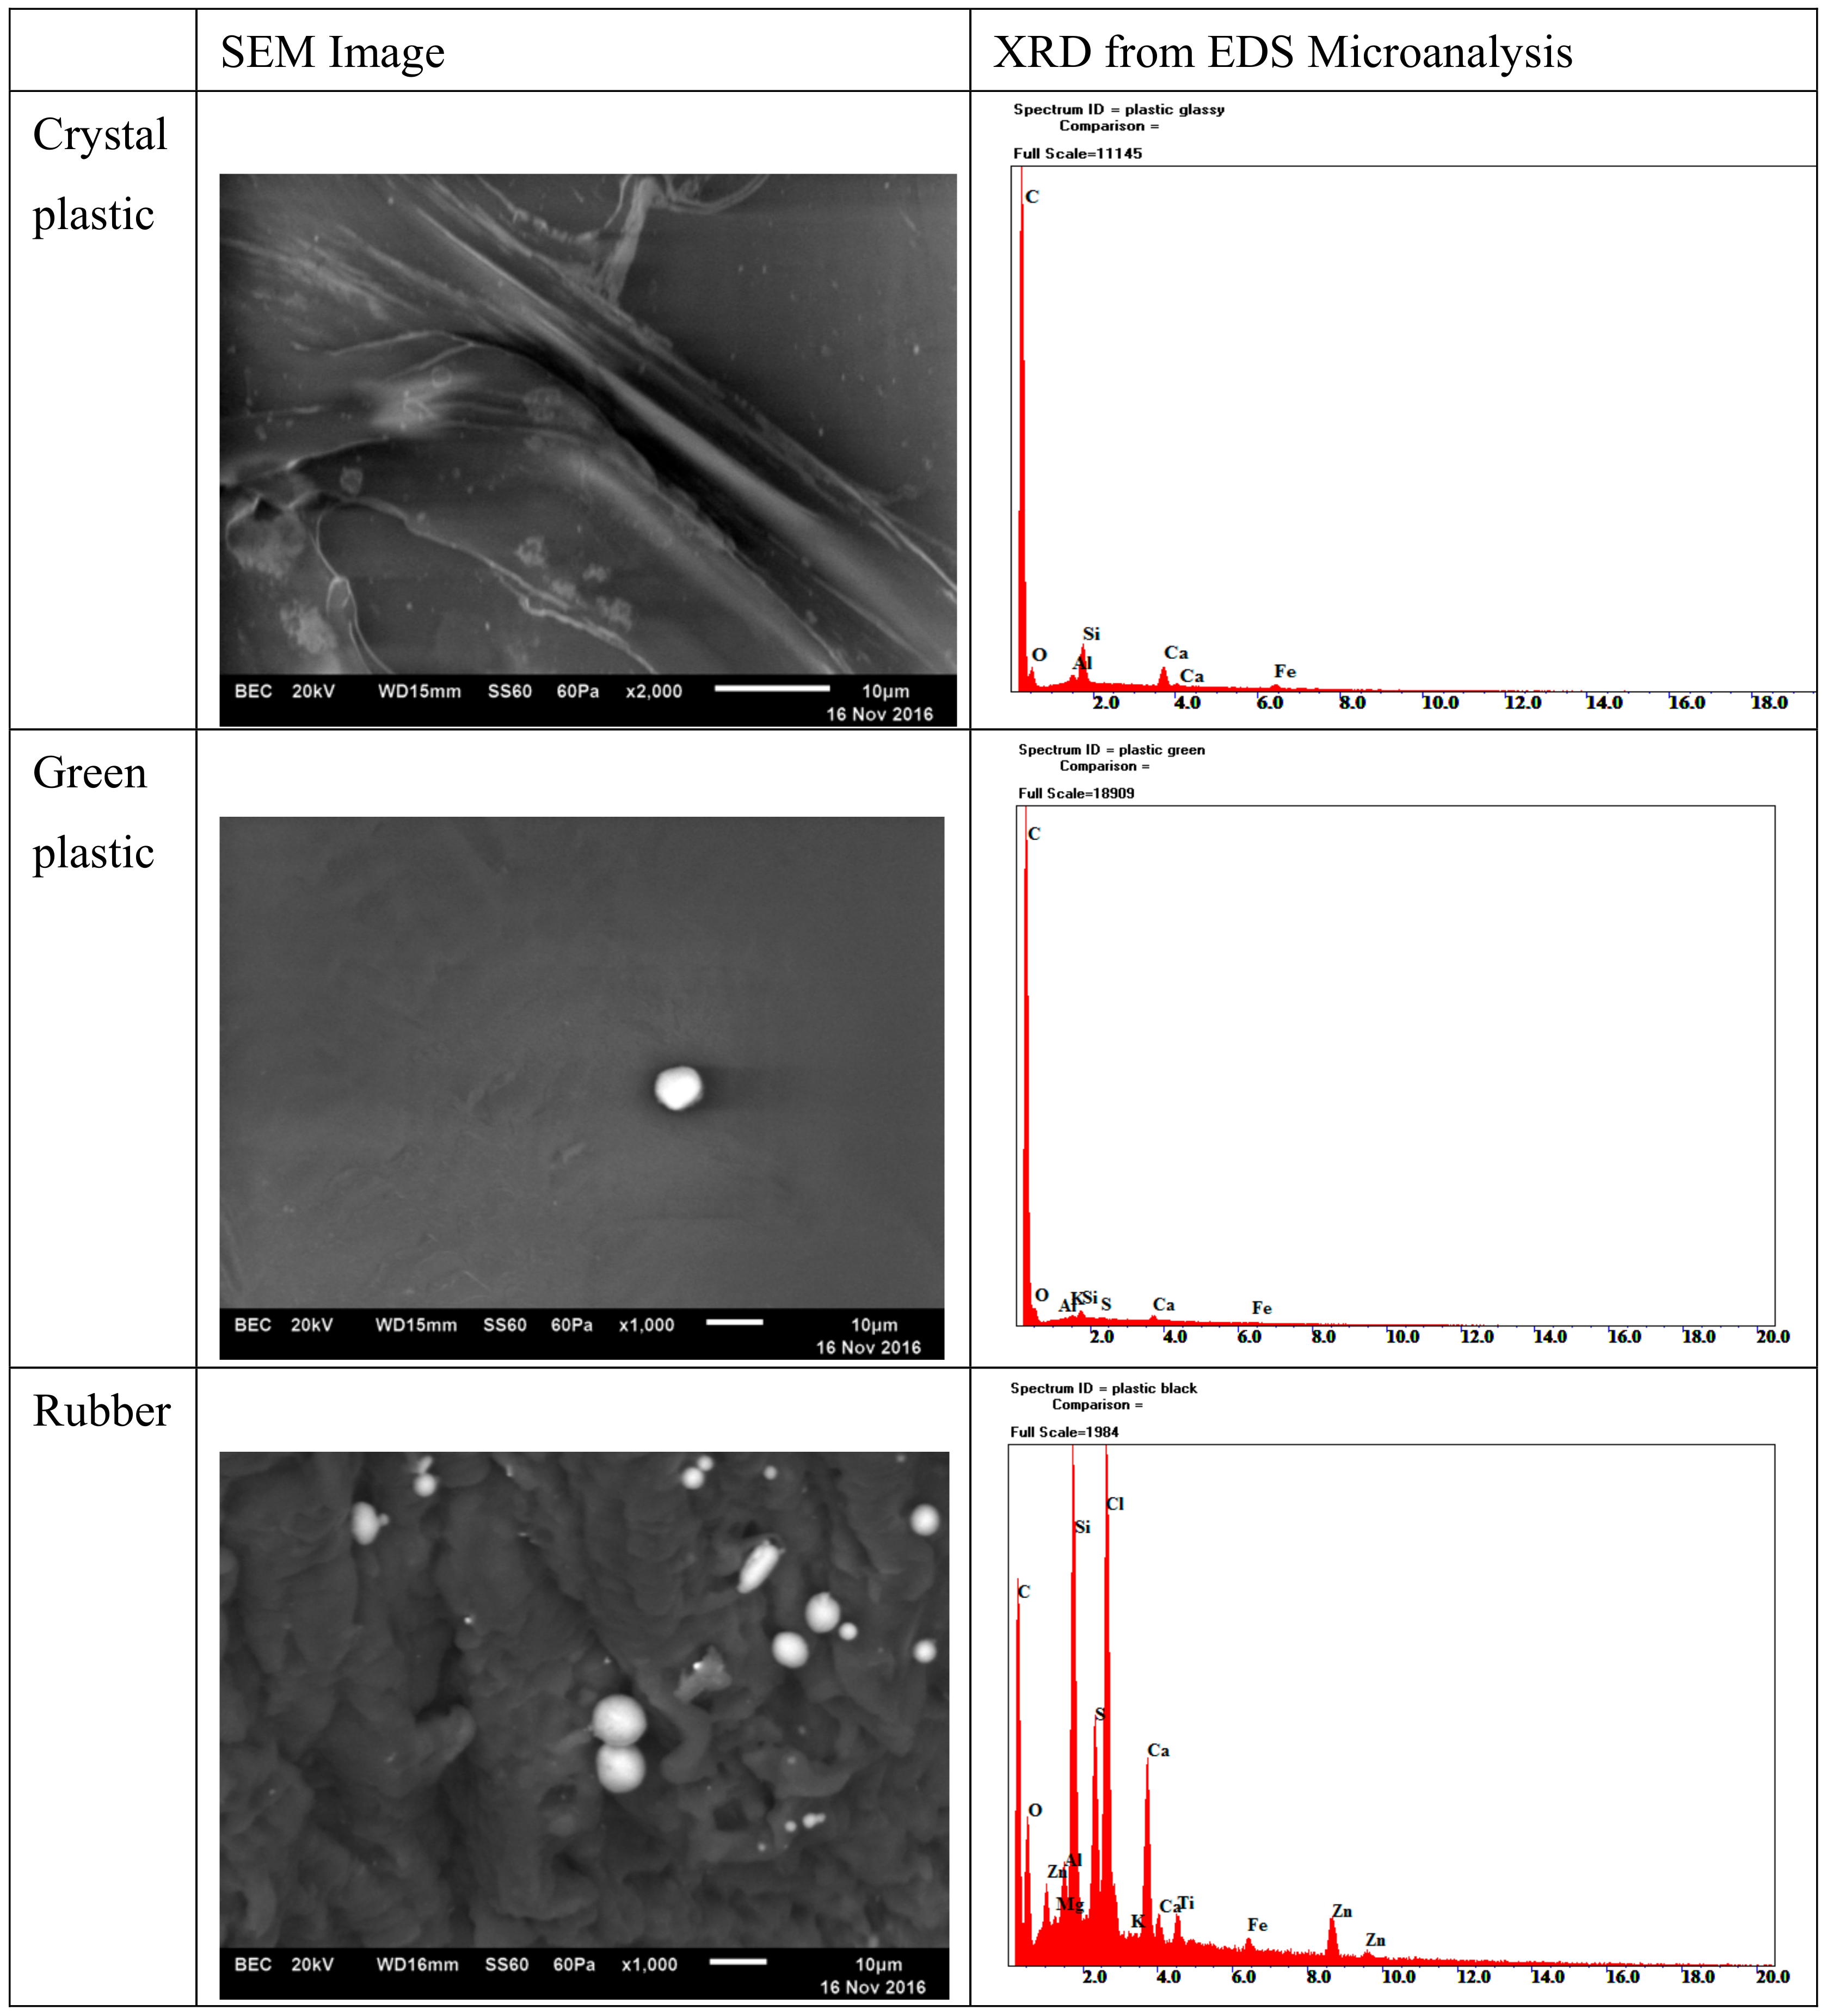
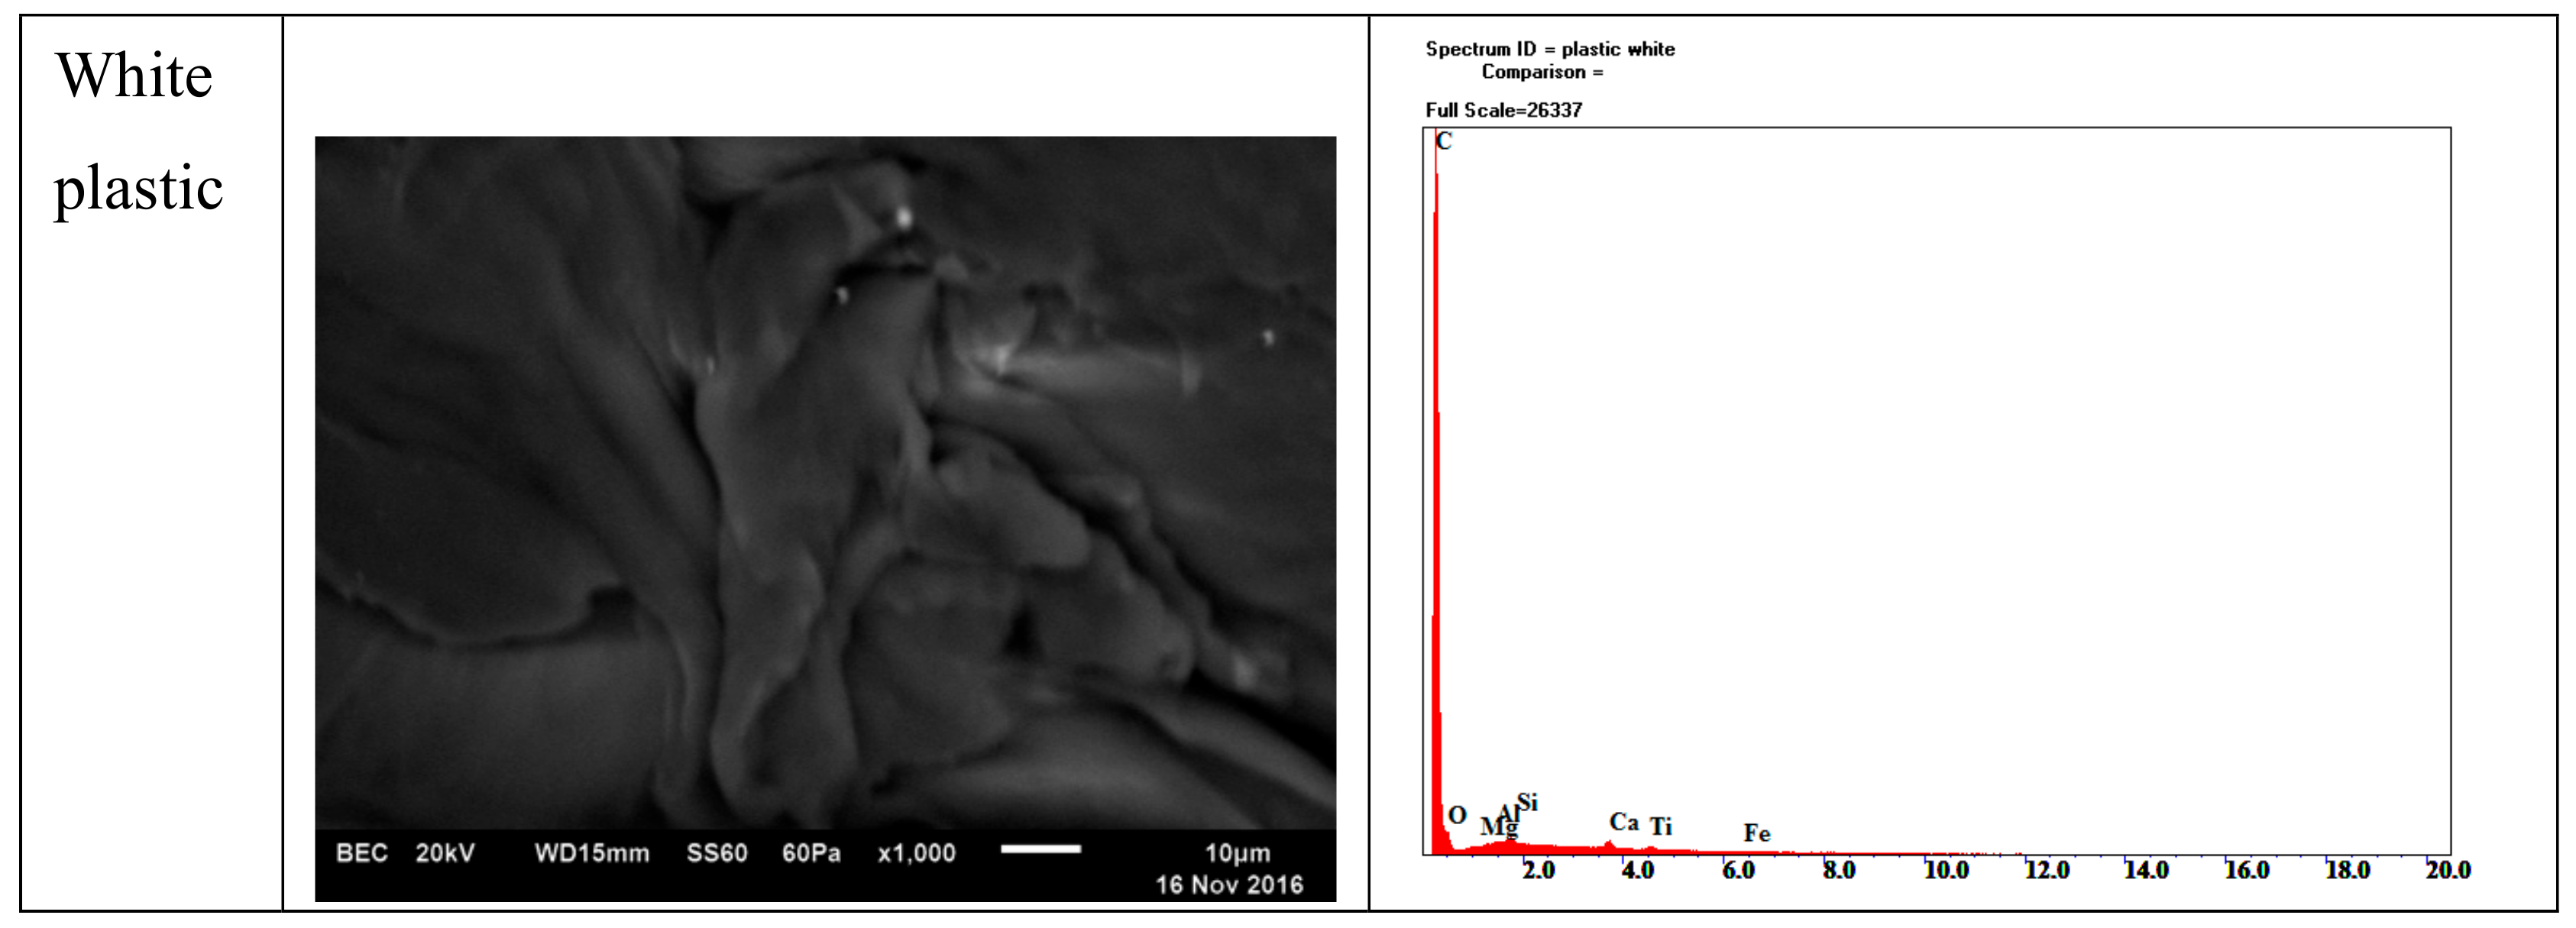
2.3. Microstructural Properties of Waste Plastic Syringe Composites
2.4. Mixture Proportion
2.5. Test Practices
2.5.1. Workability Measurements
2.5.2. Mechanical Tests
3. Experimental Results
3.1. Fresh Properties
3.2. Mechanical Tests
4. Limitations and Future Directions
Role towards Sustainability
5. Conclusions
- -
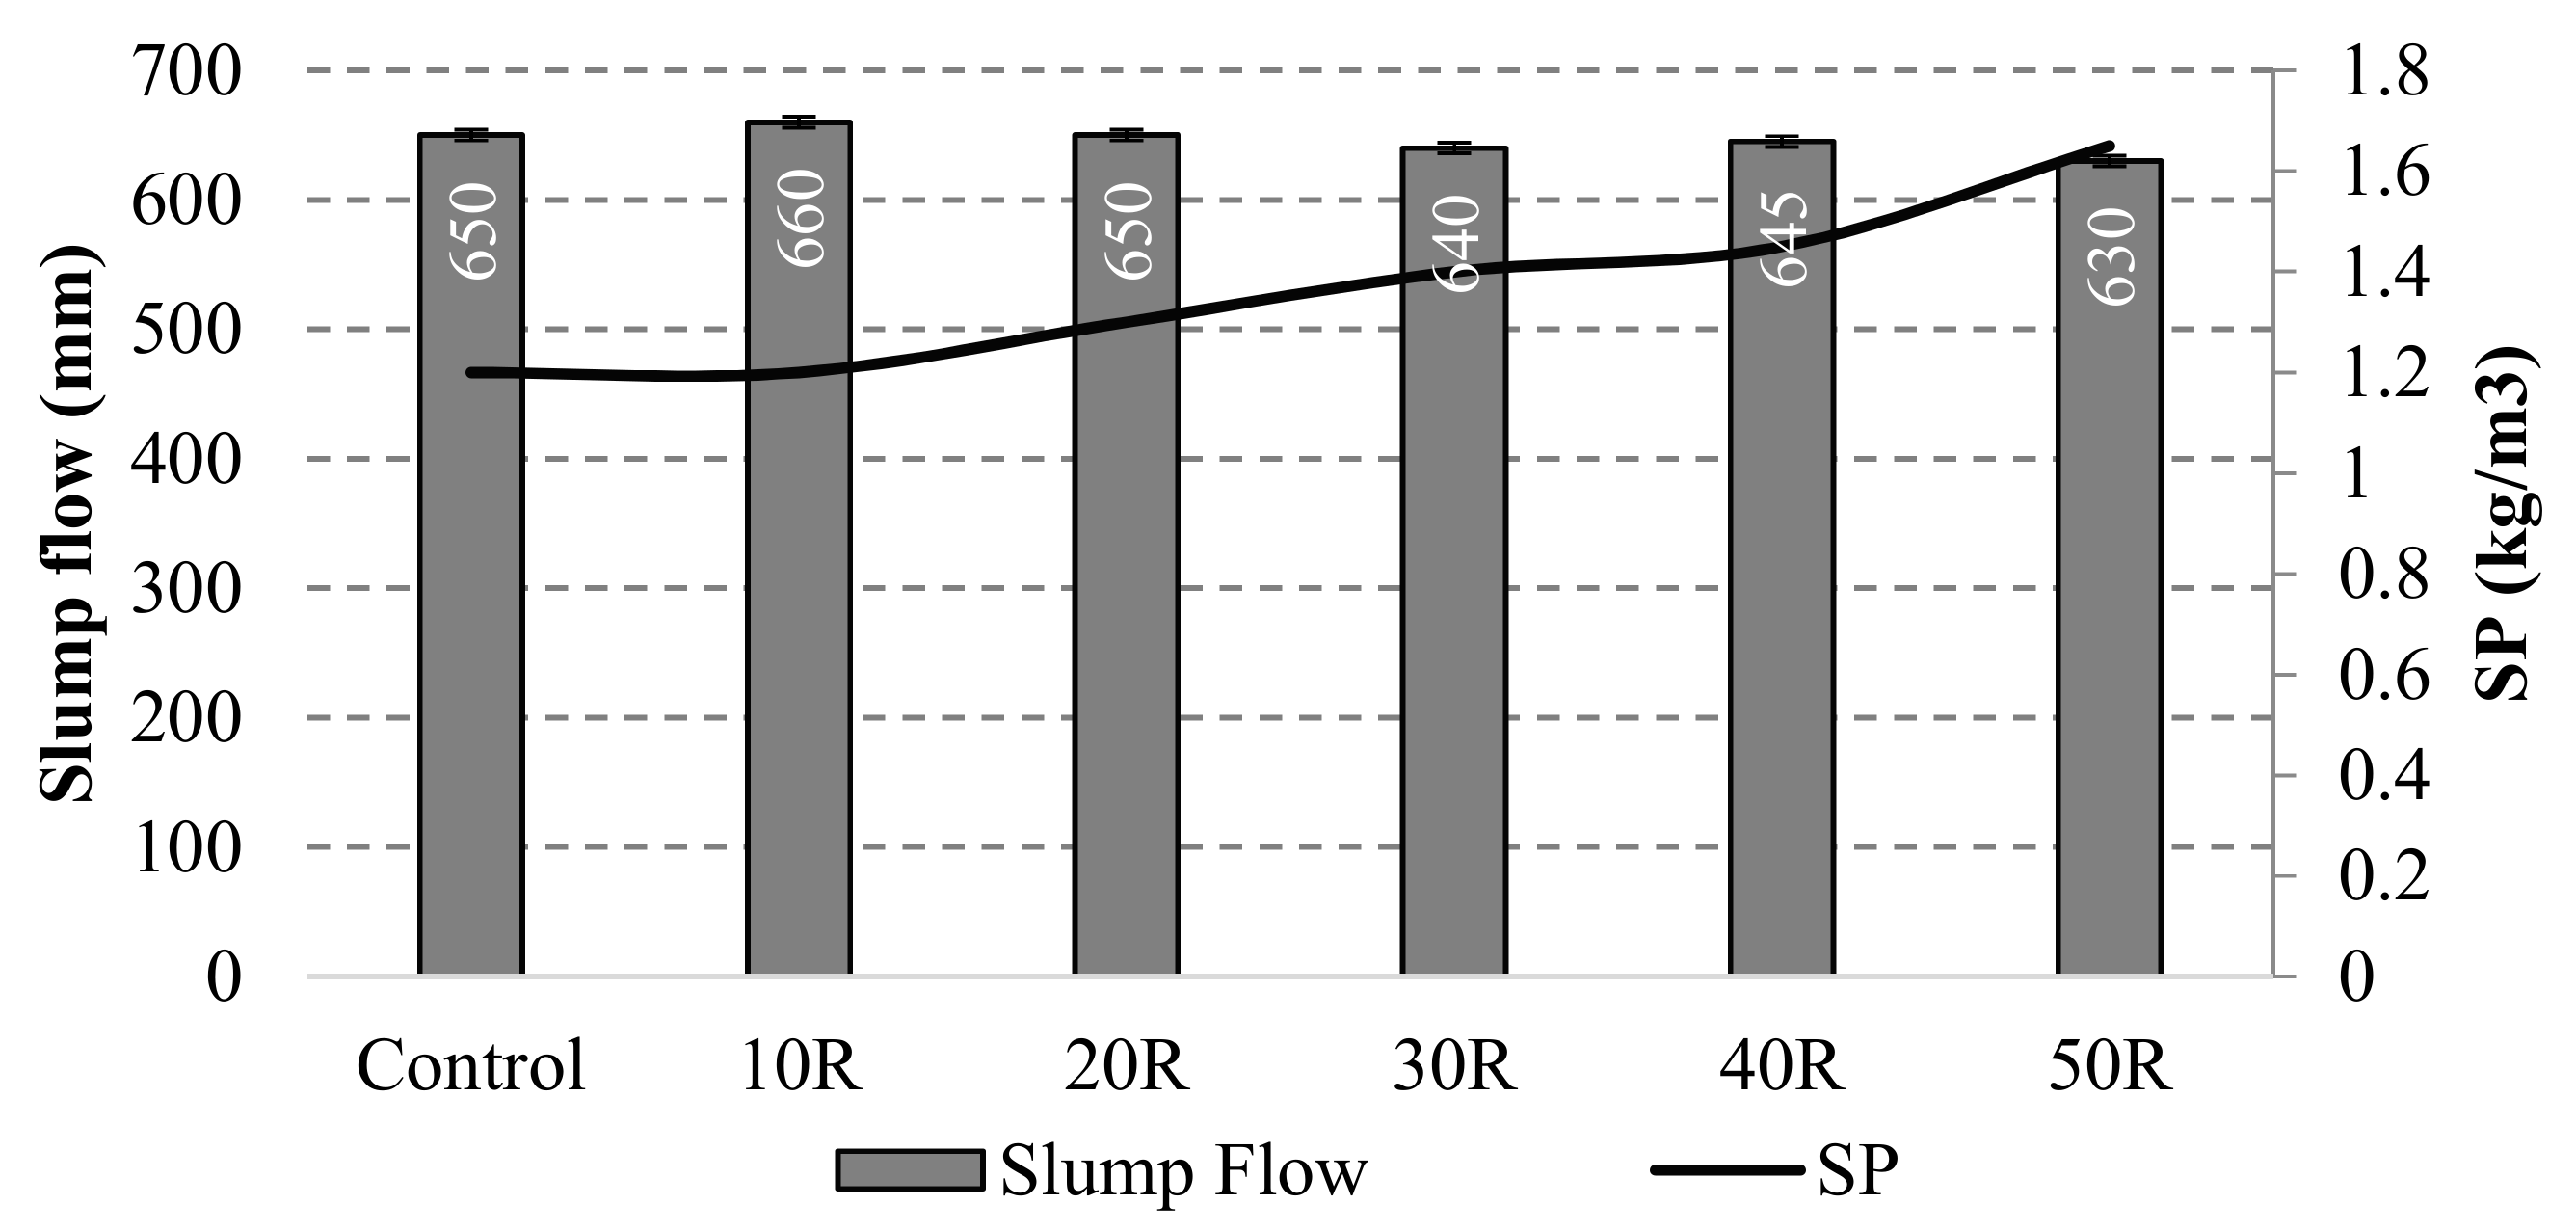
- The amount of water absorption was increased with the incorporation of expired plastic aggregate. Thus, the incorporation of 50% recycled aggregate caused the highest demand for HRWRA due the greater absorption of water on their surface.
- -
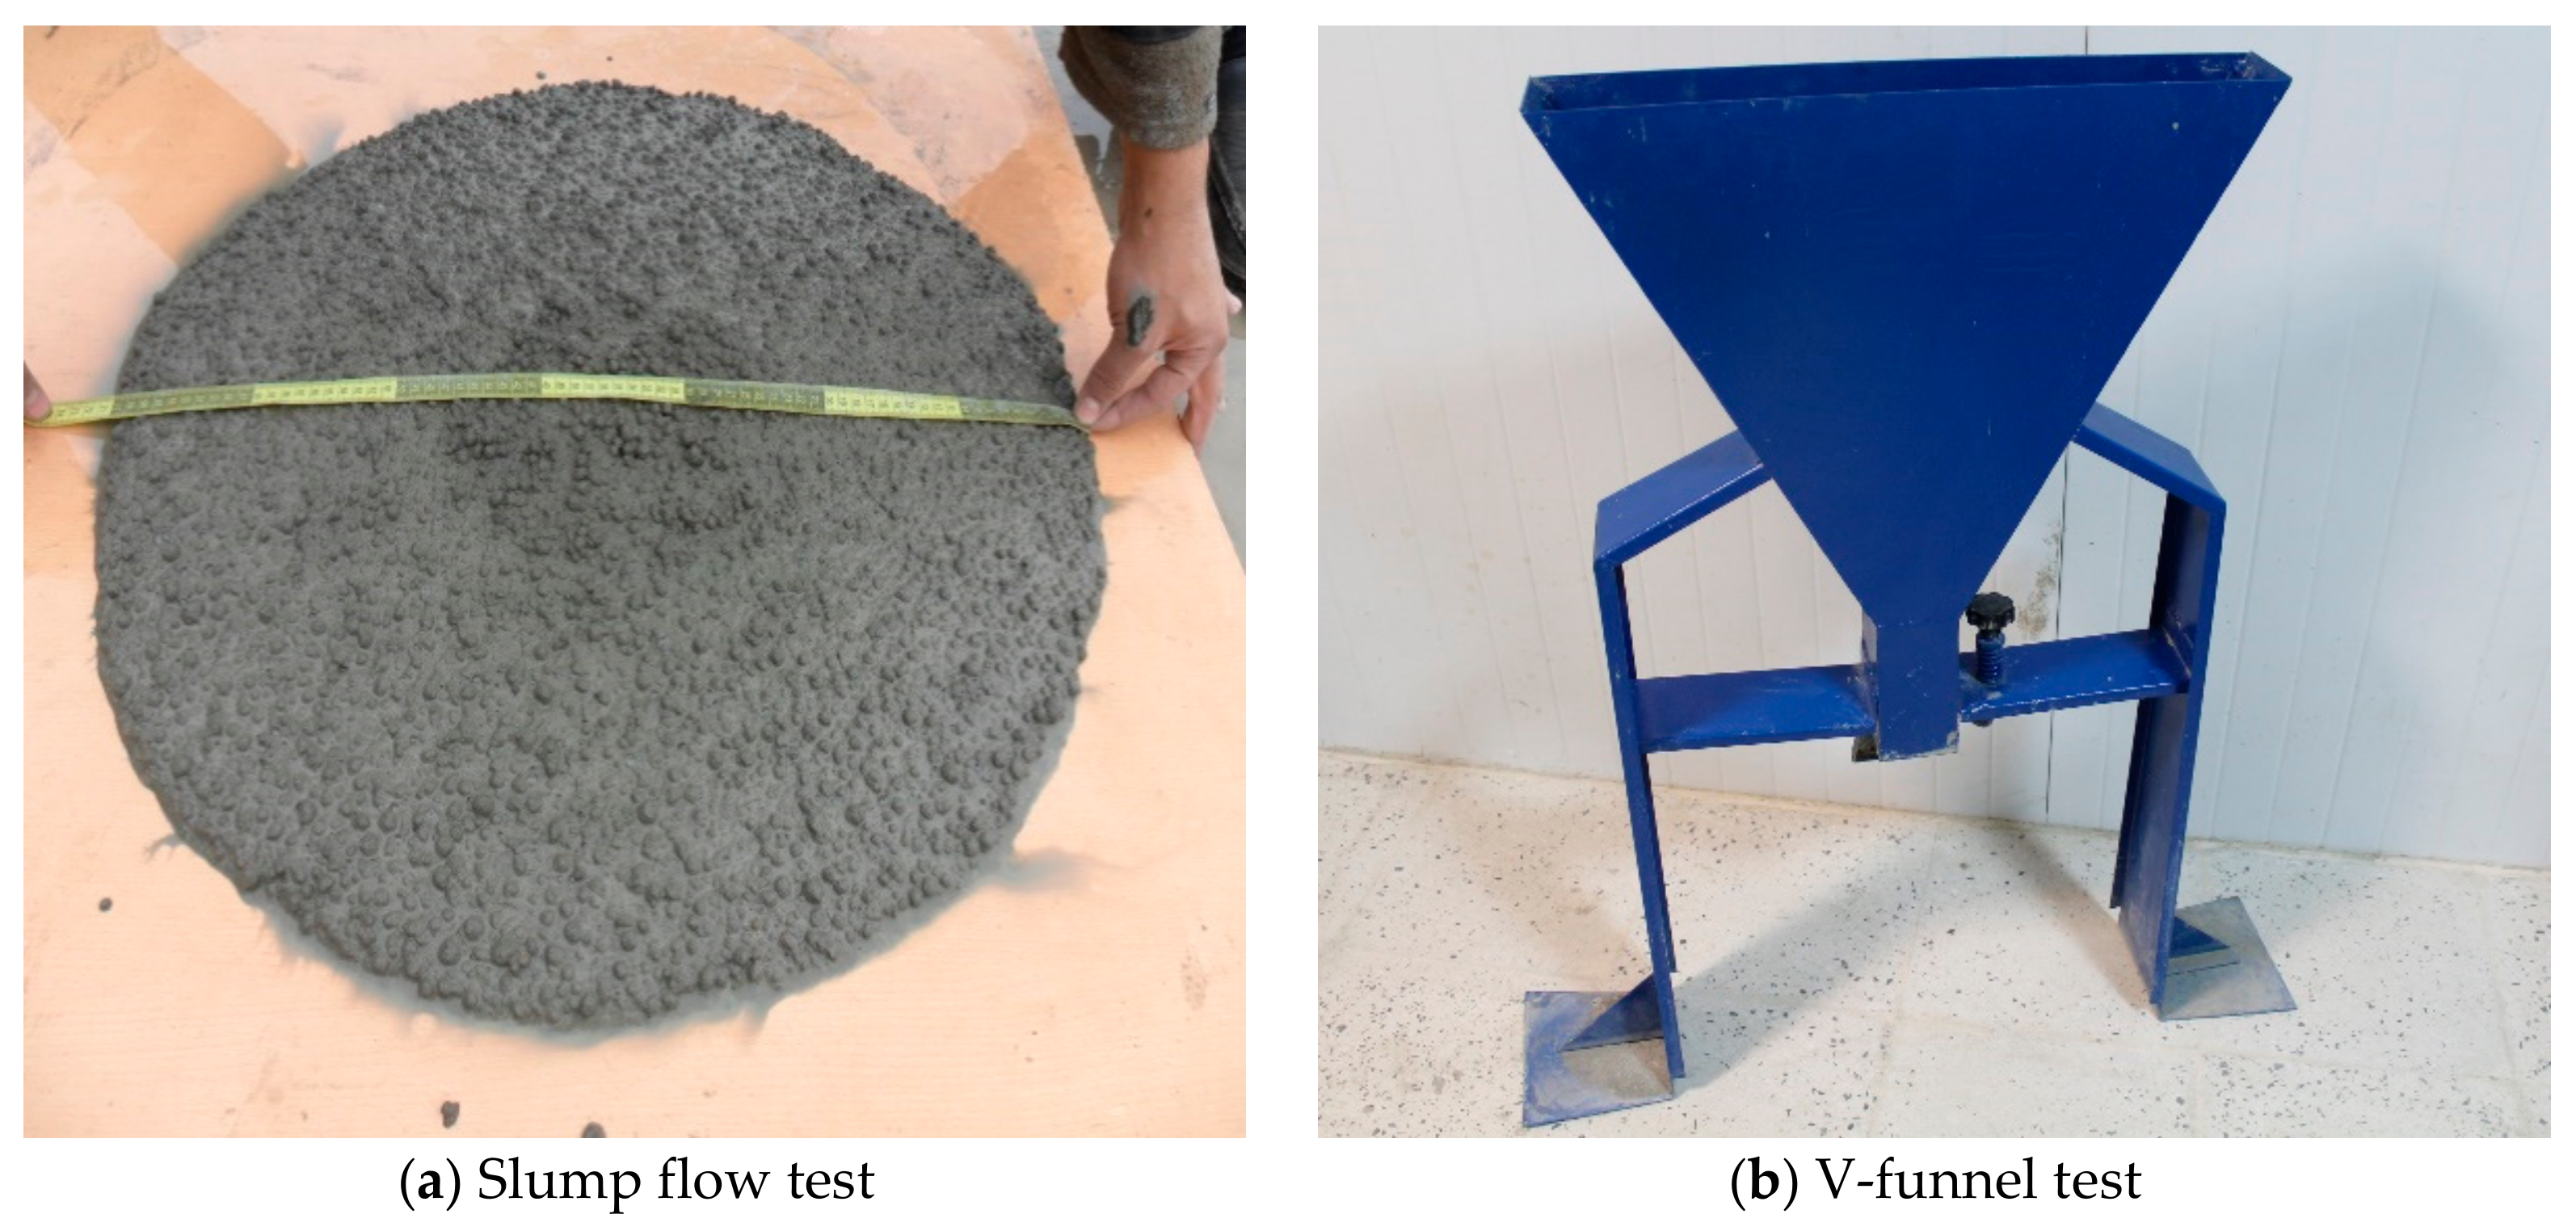
- Using recycled aggregate for up to 20% can improve the workability of fresh flowable concrete. Therefore, the HRWRA percentage increased with an increased amount of waste aggregate to maintain an acceptable slump.
- -
- Using waste aggregates increased the V-funnel results of flowable concrete mixes; thus, the viscosity of the SCC increased. However, using waste aggregates for more than 30% made an inappropriate flowability and made the mixes too viscous to be flowable.
- -
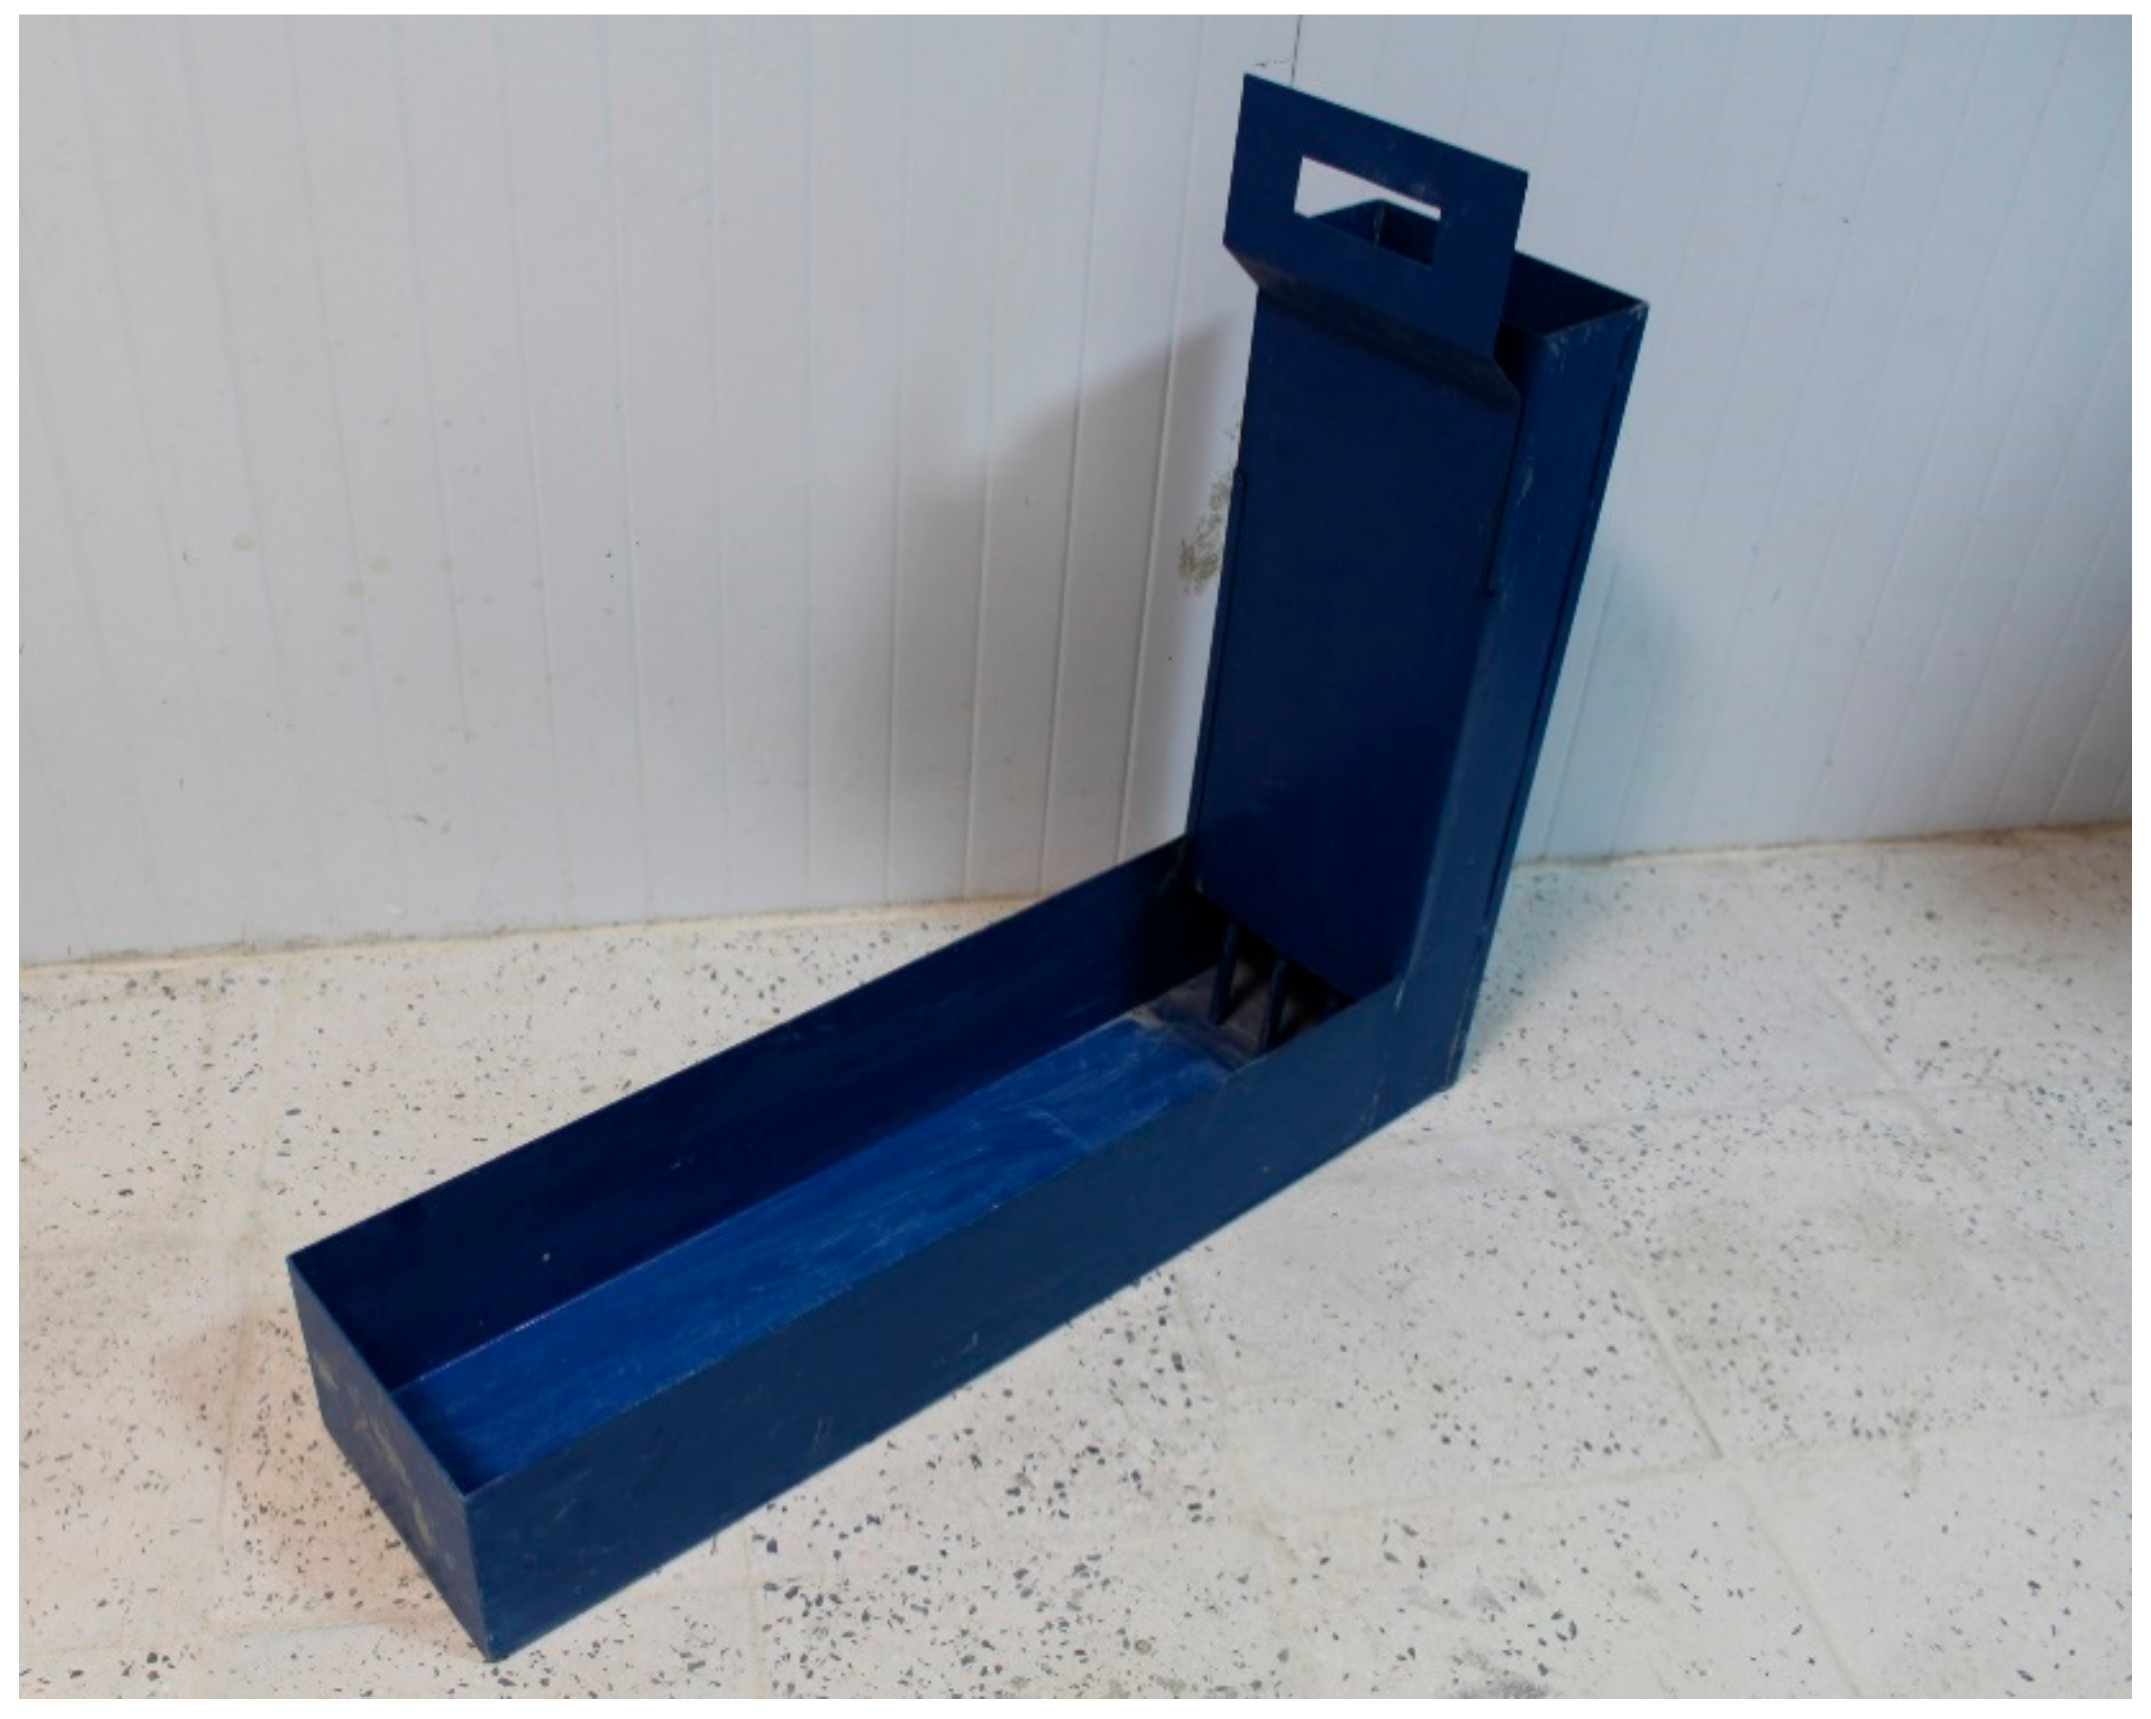
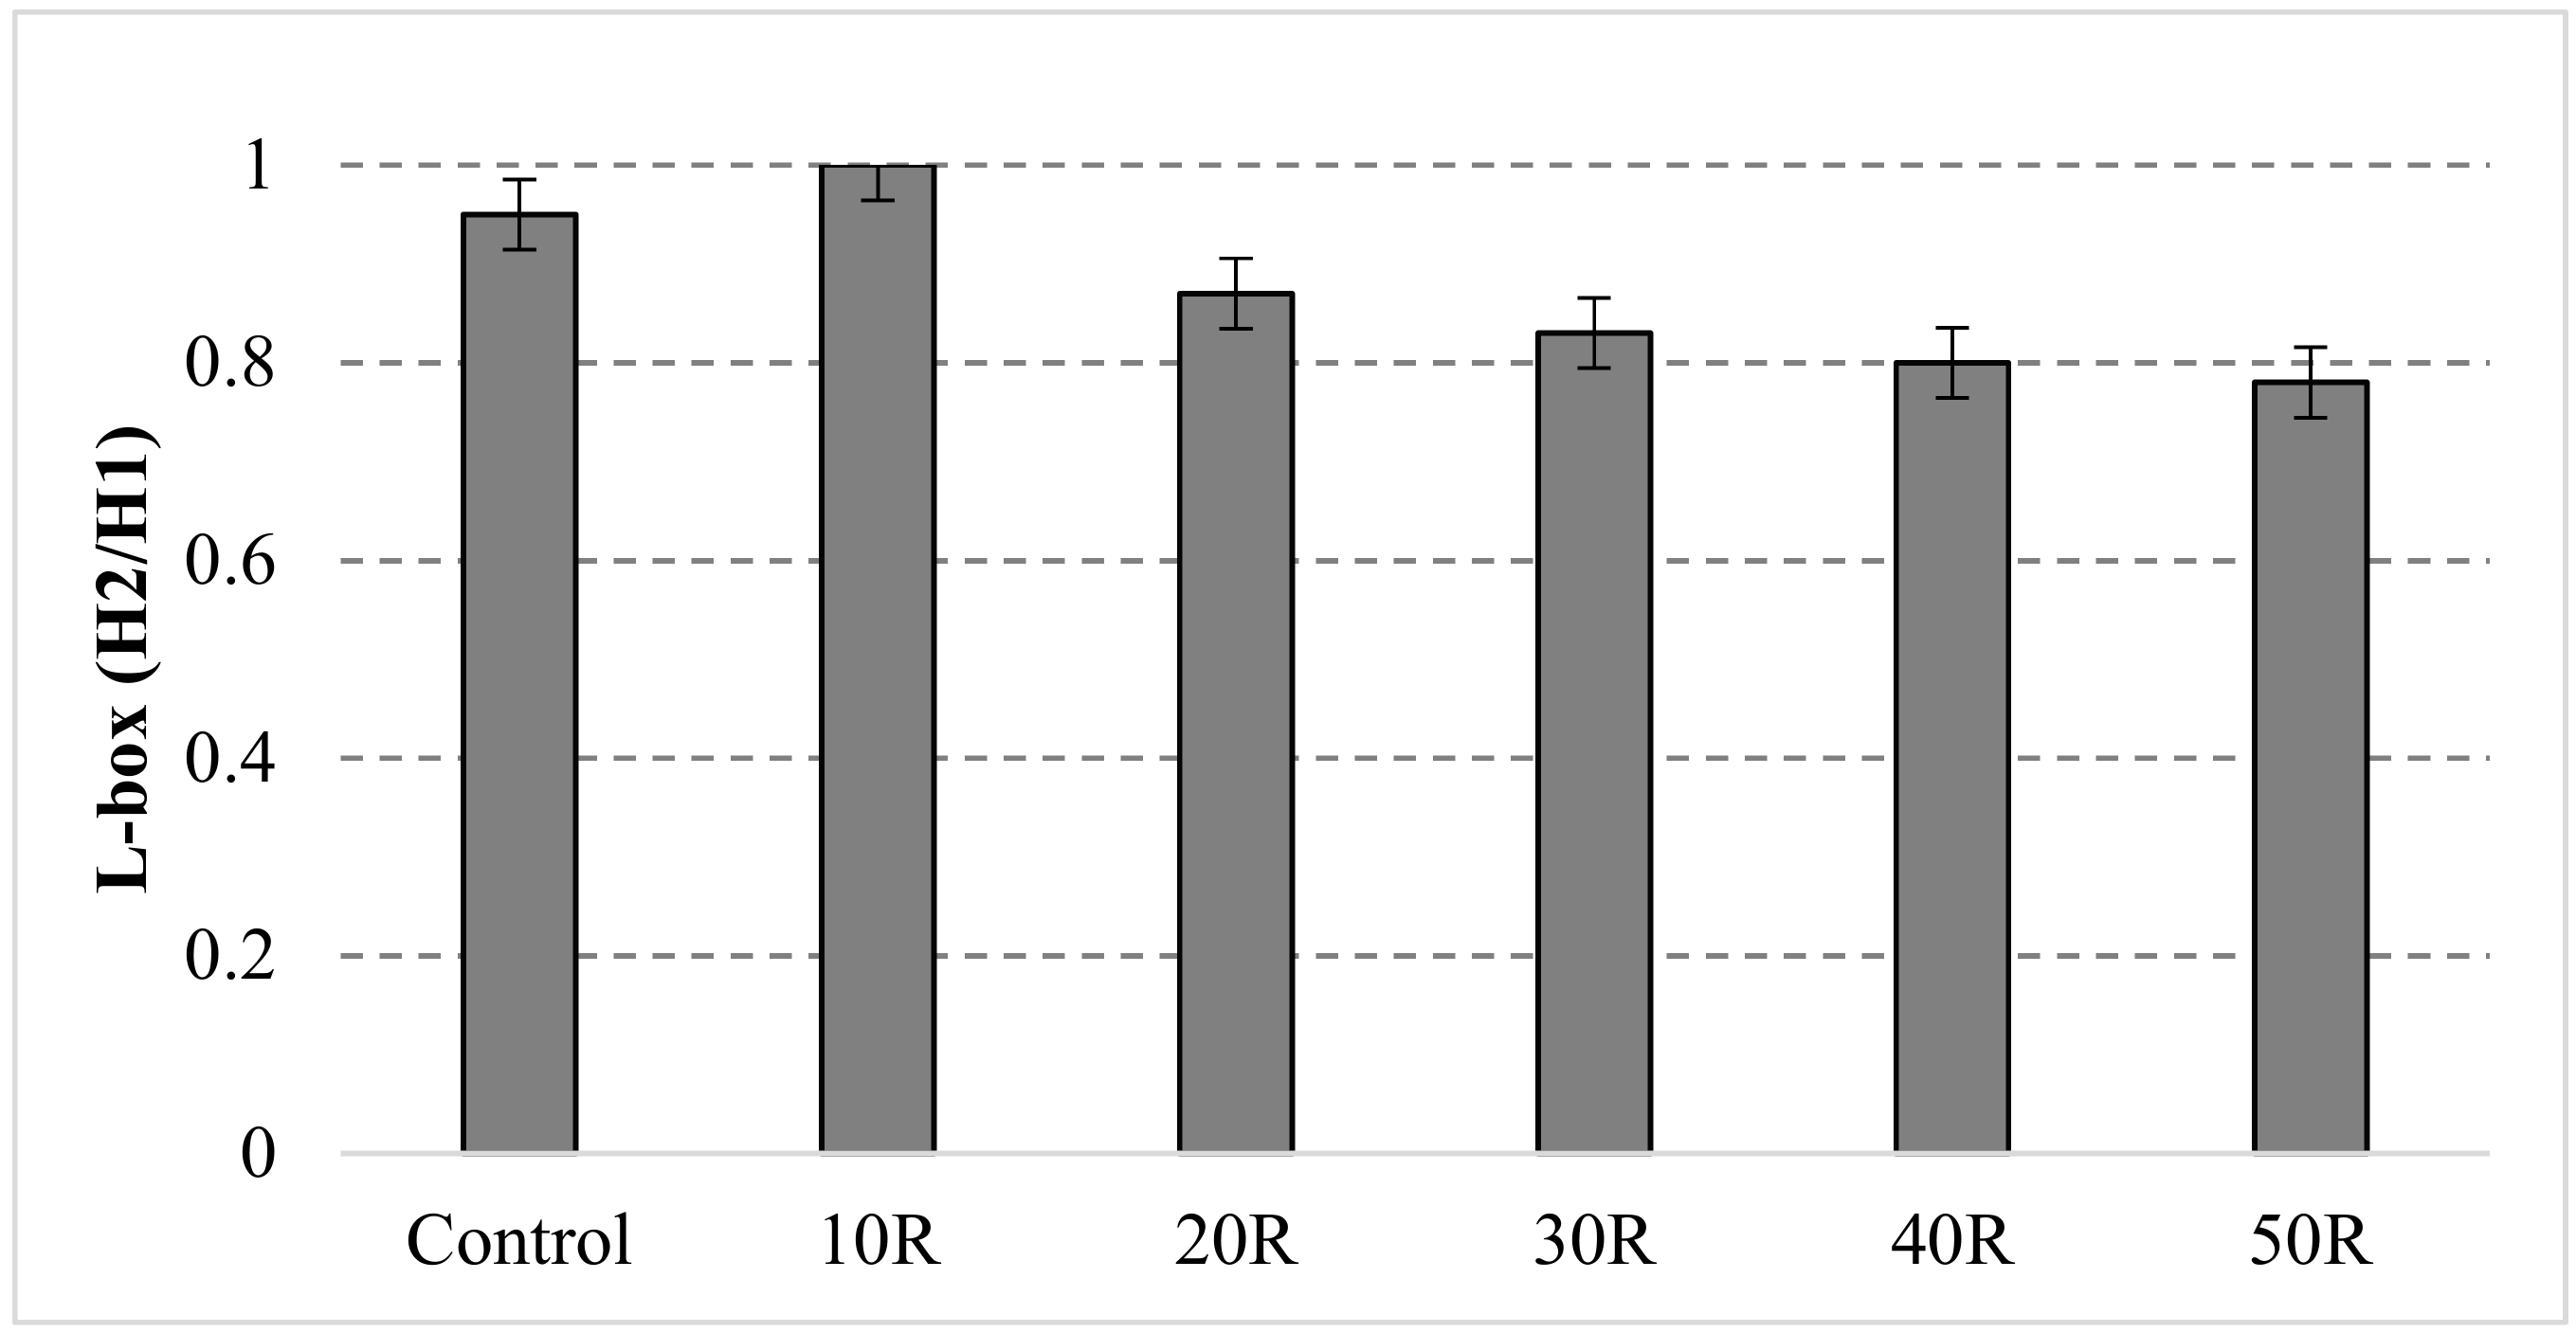
- Addition of waste aggregate at a 30%–50% replacement level decreased the L-box ratio in comparison to that of the control sample. The 10% replacement of waste aggregate was more successful in improving workability.
- -
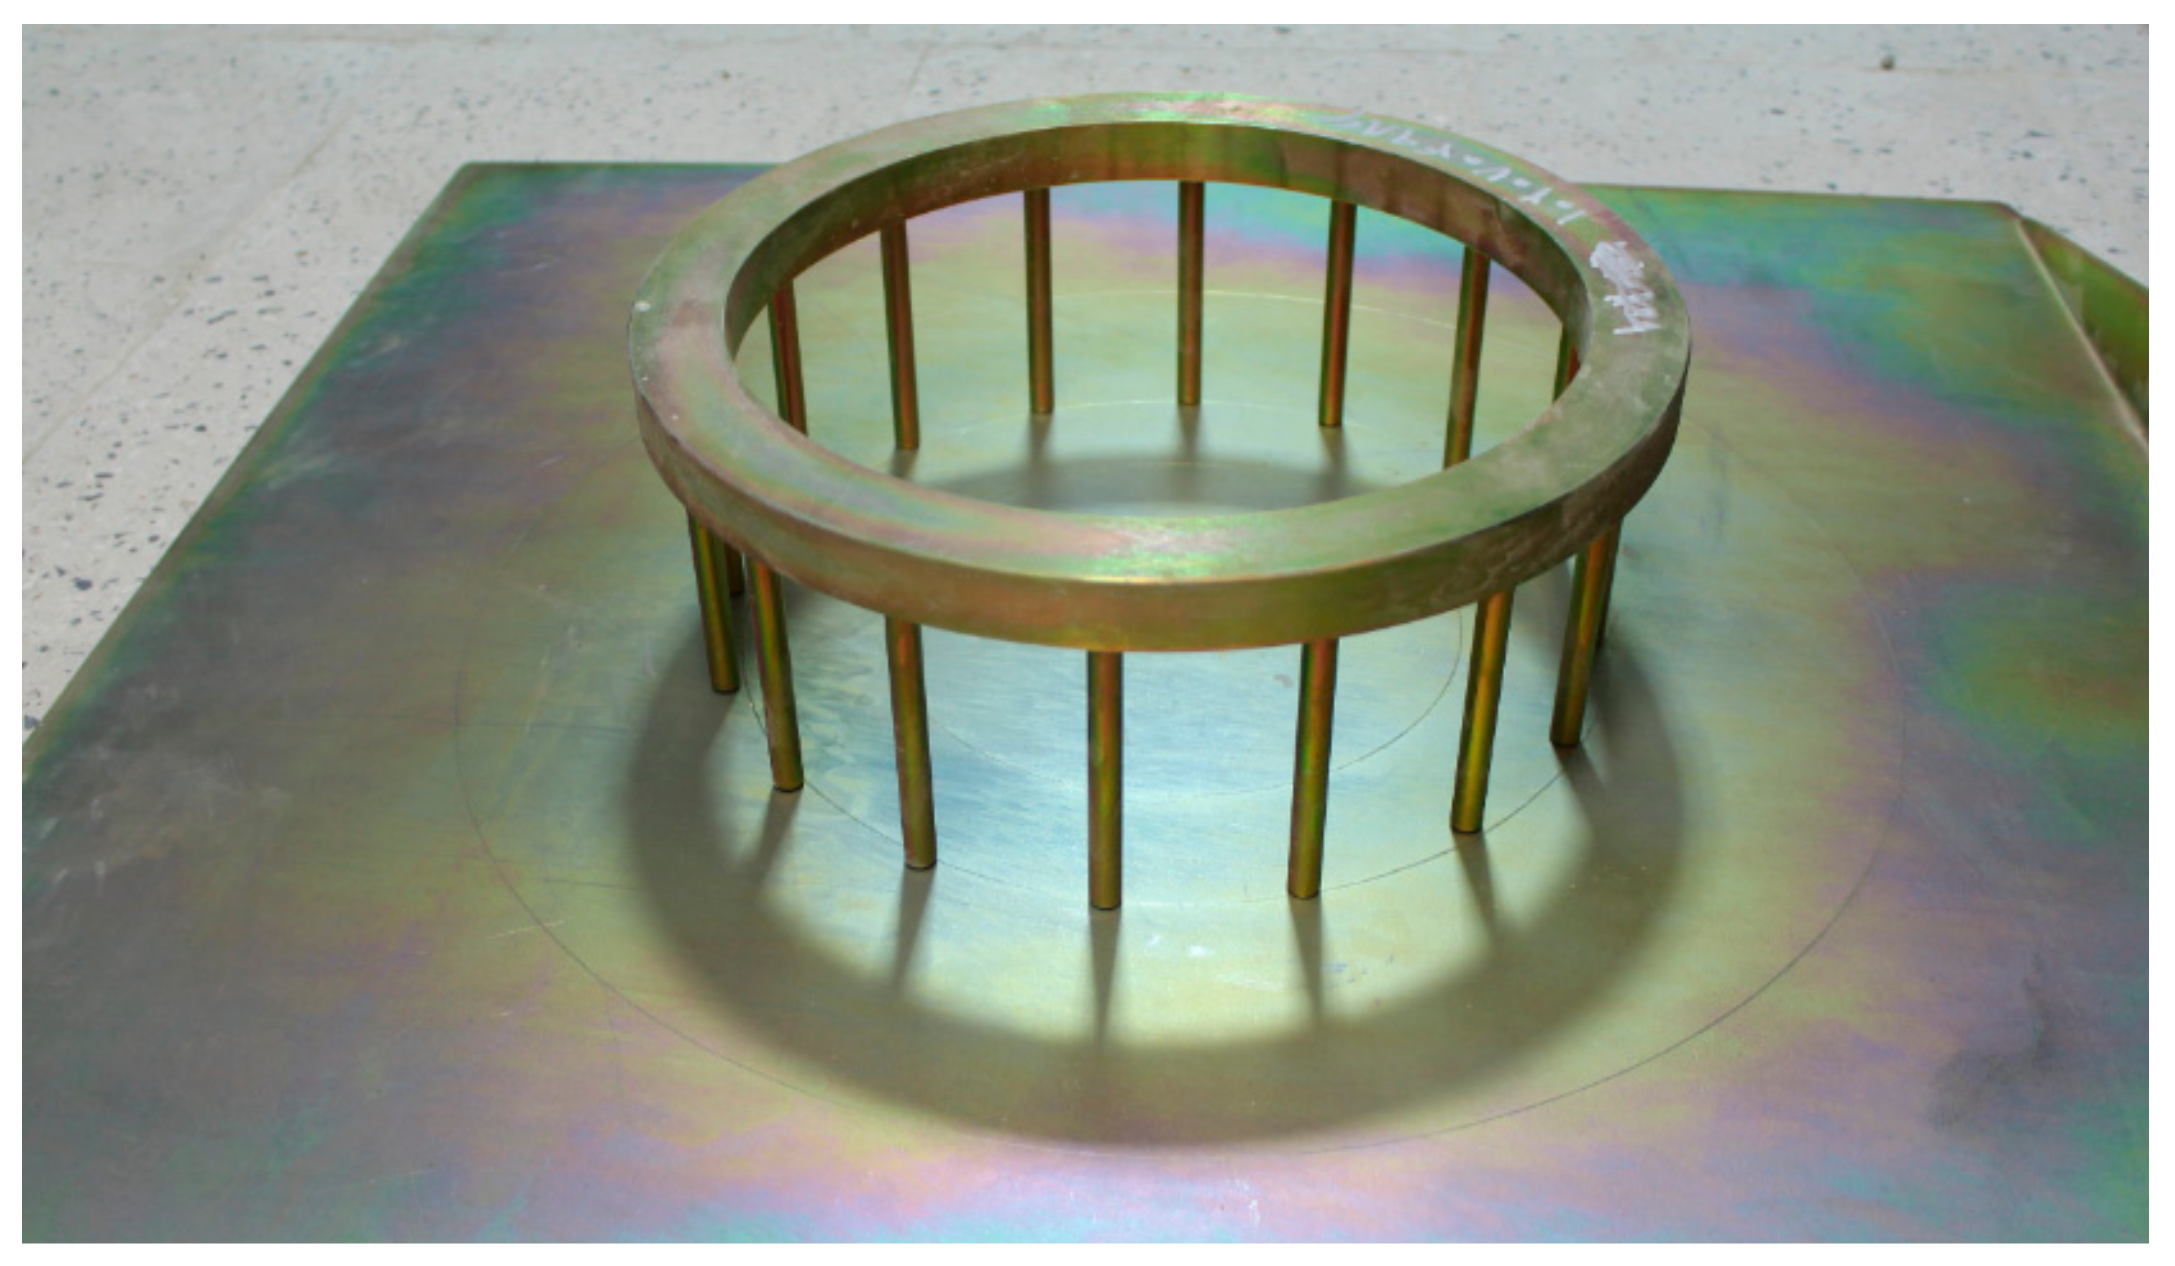
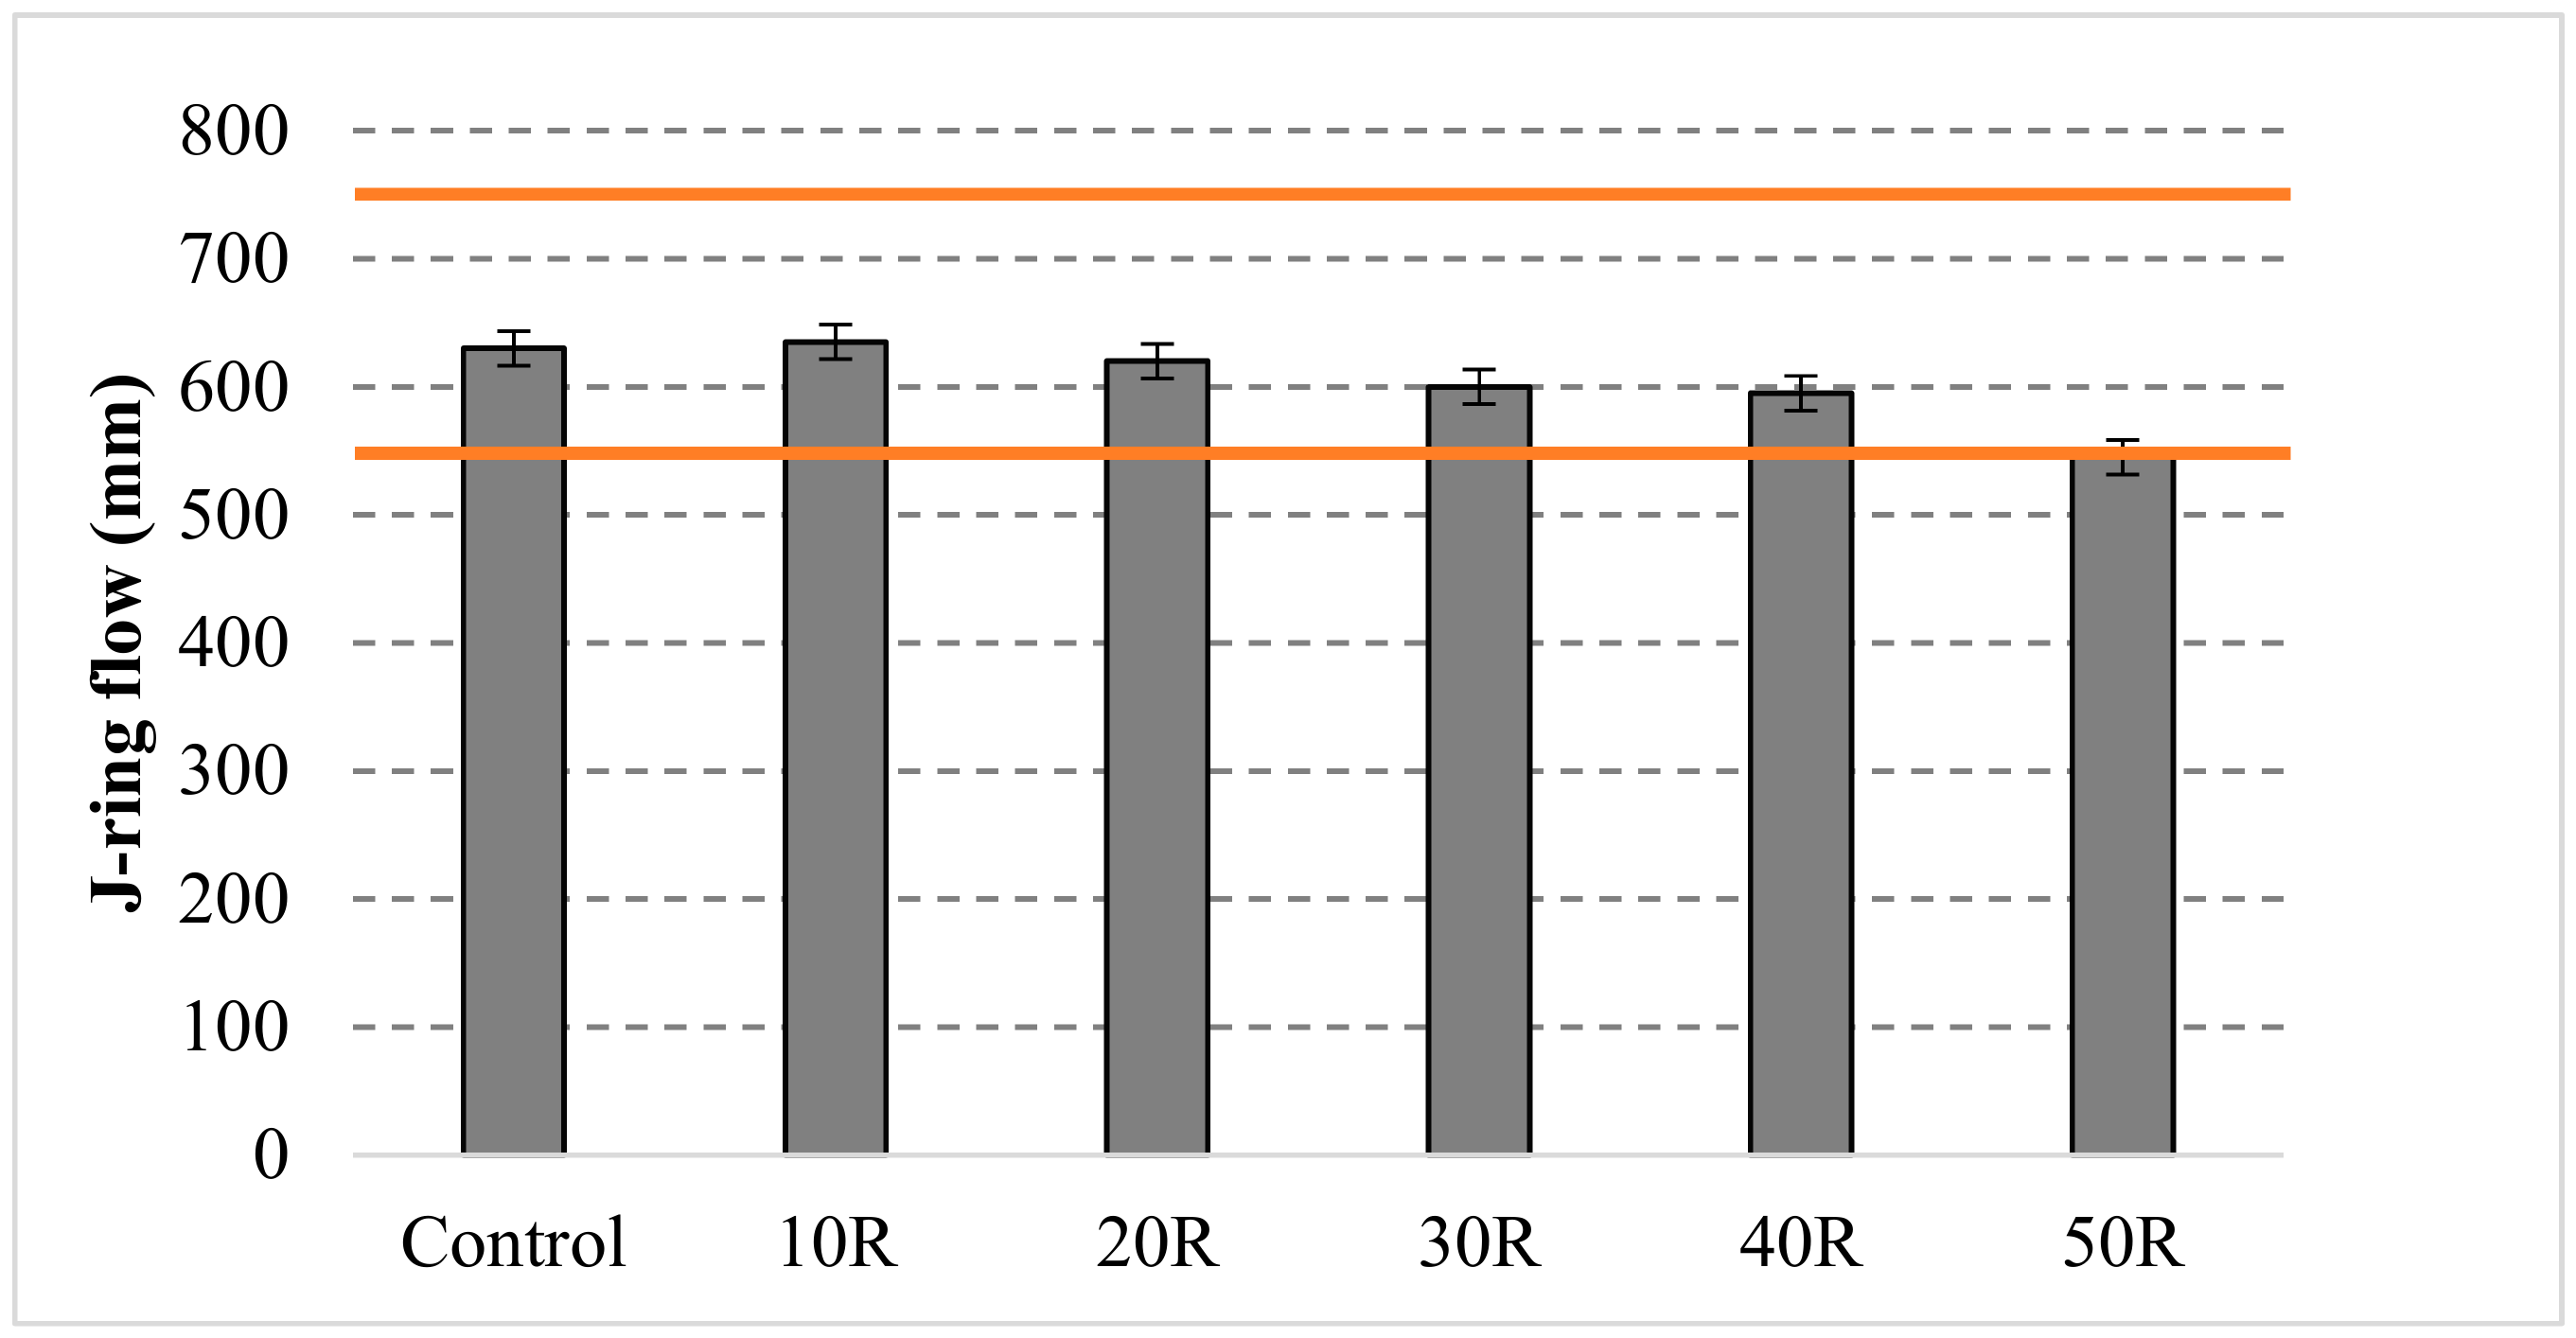
- The results of the J-ring test also confirmed the results obtained by the slump flow, L-box, and V-funnel tests. The correlation coefficients between the slump flow, V-funnel, J-ring, and L-box tests indicate a strong correlation.
- -
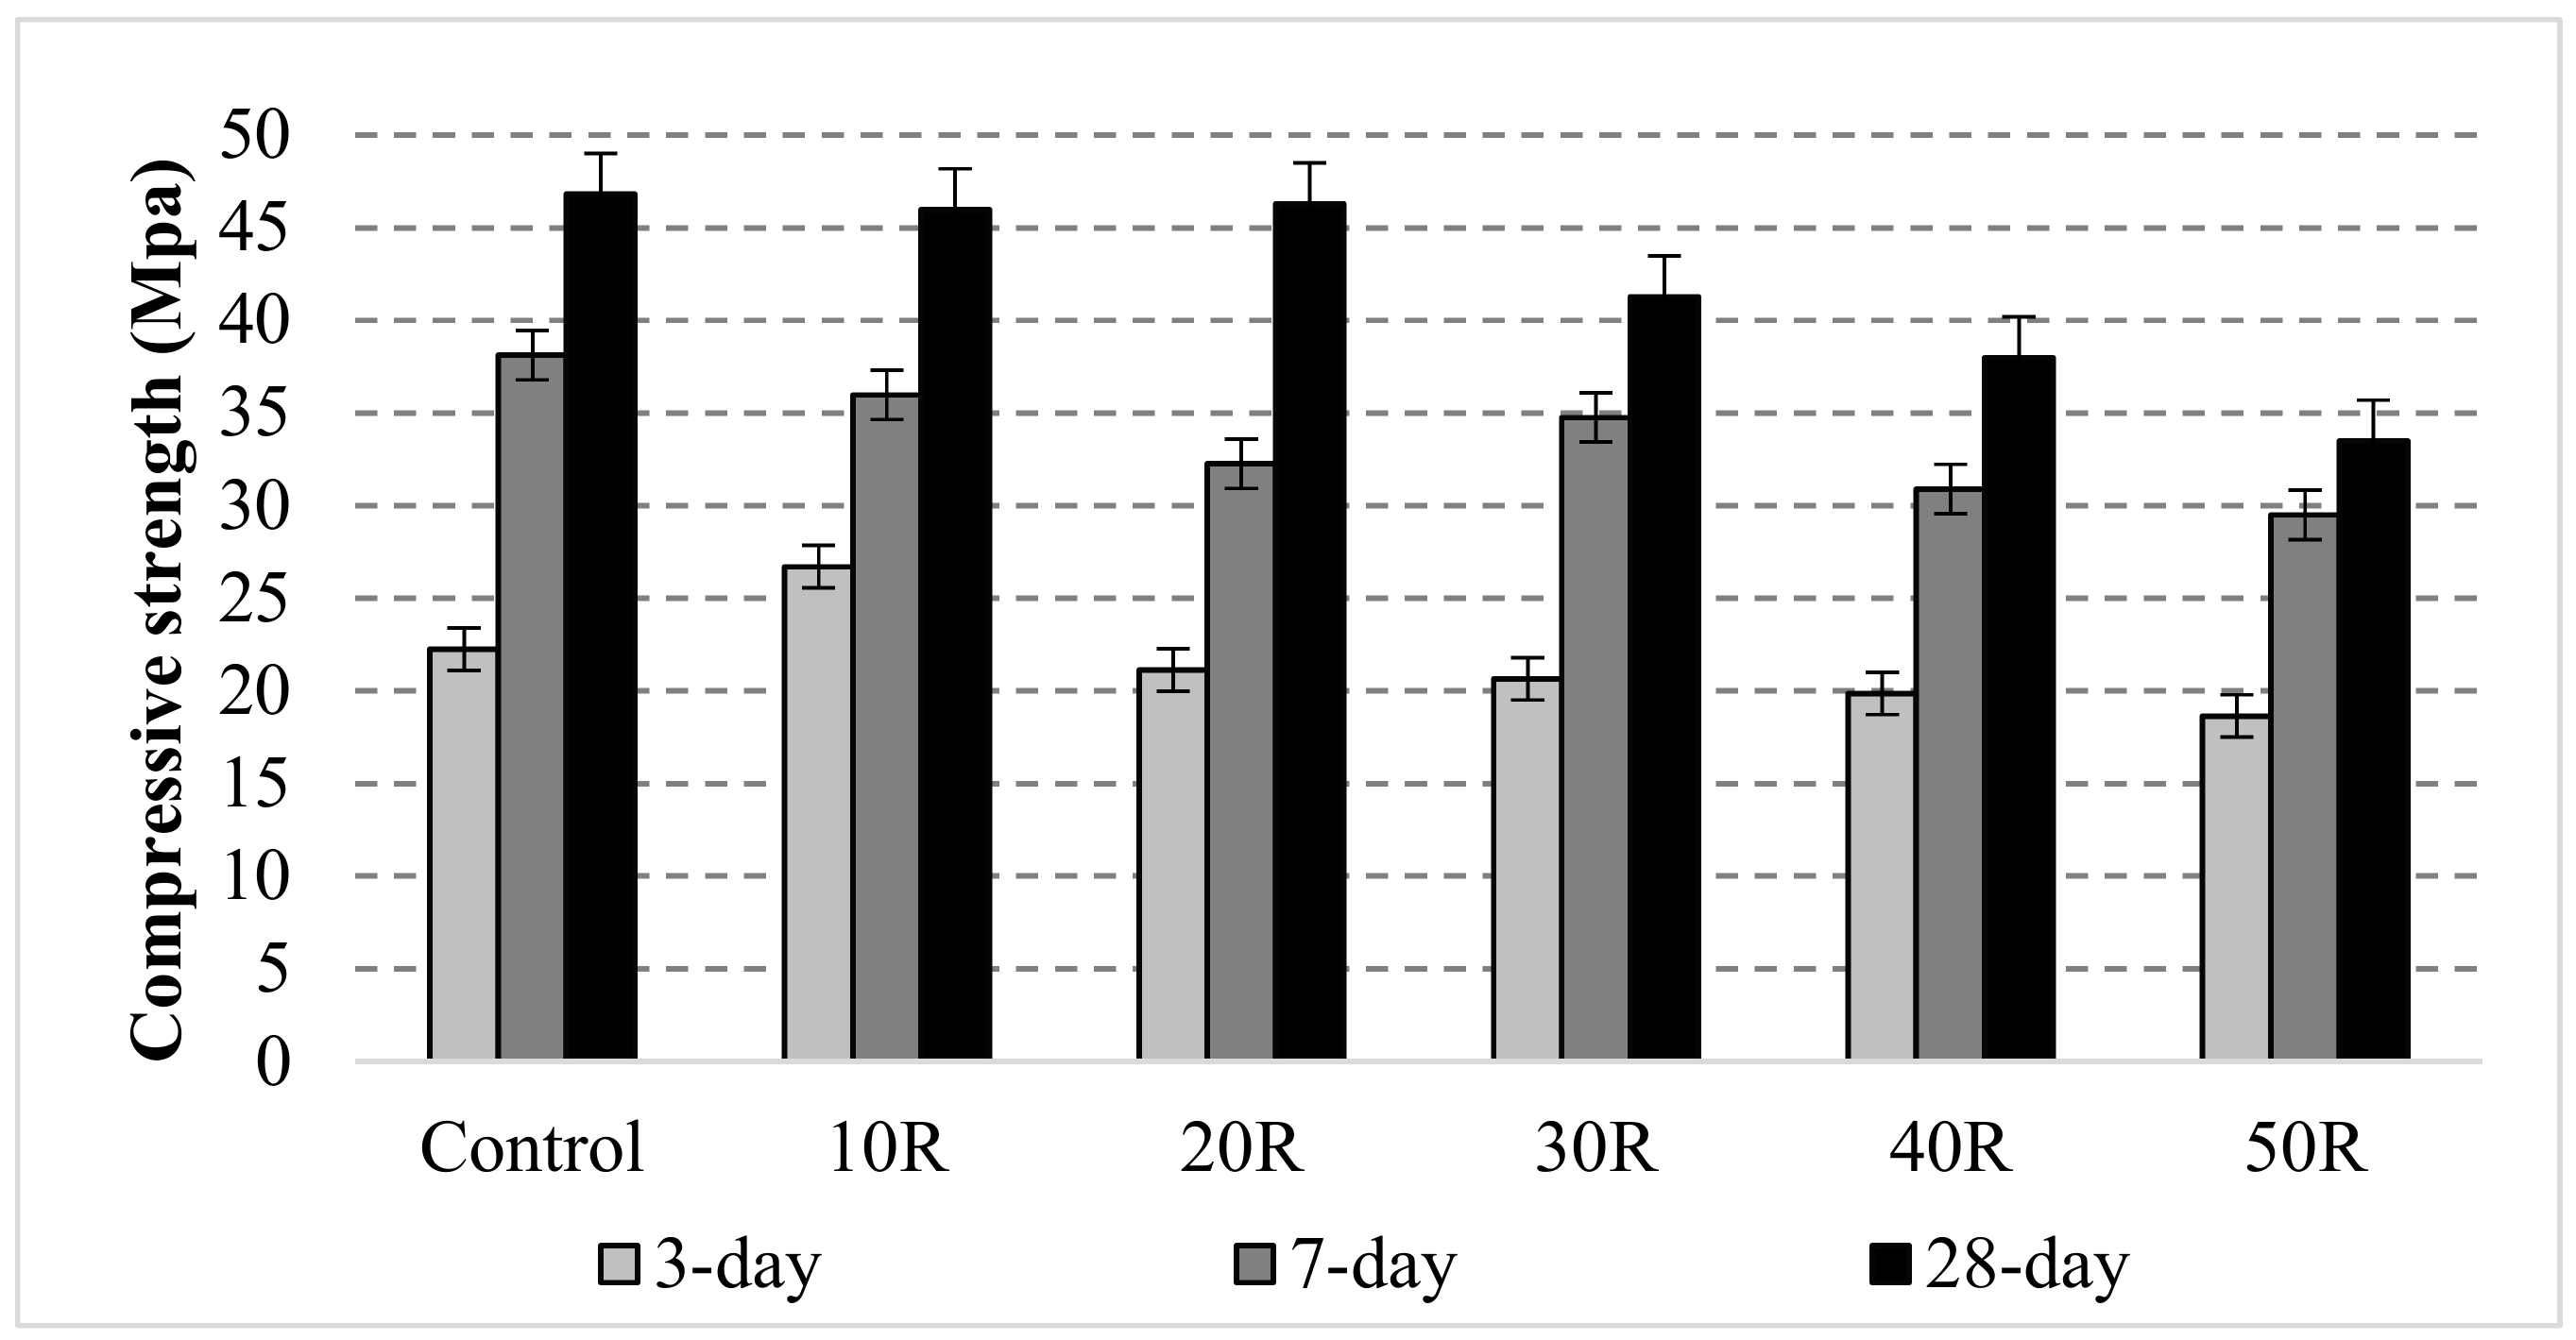
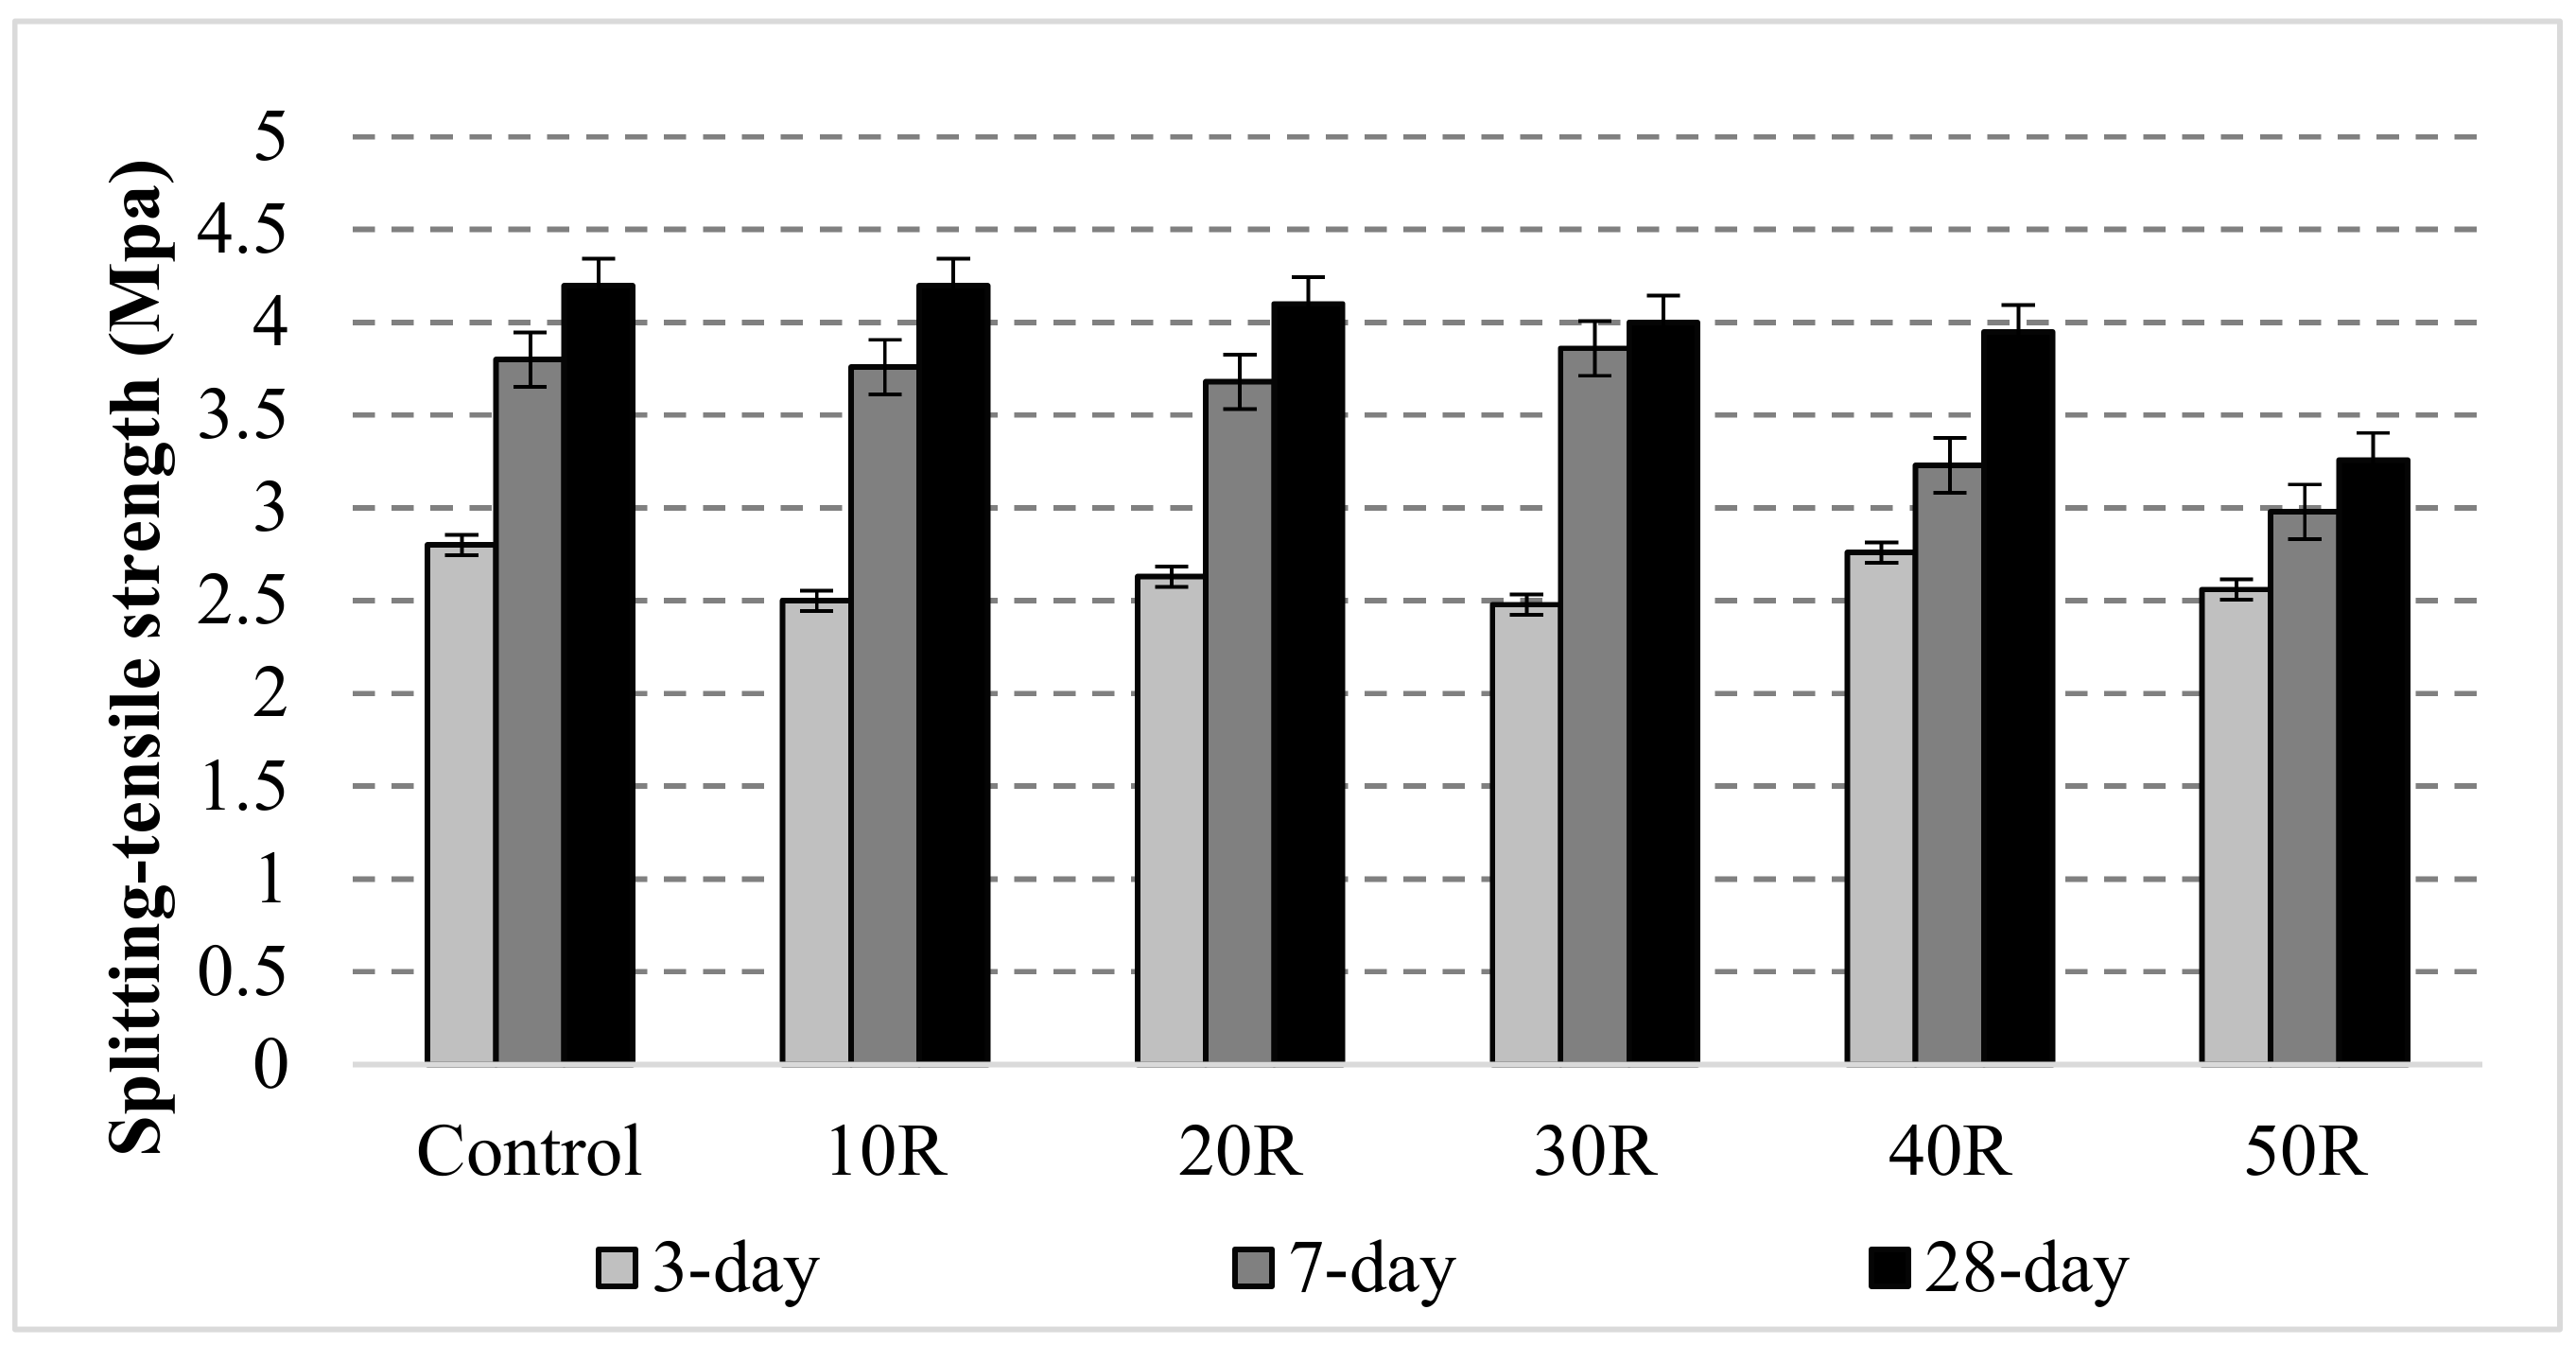
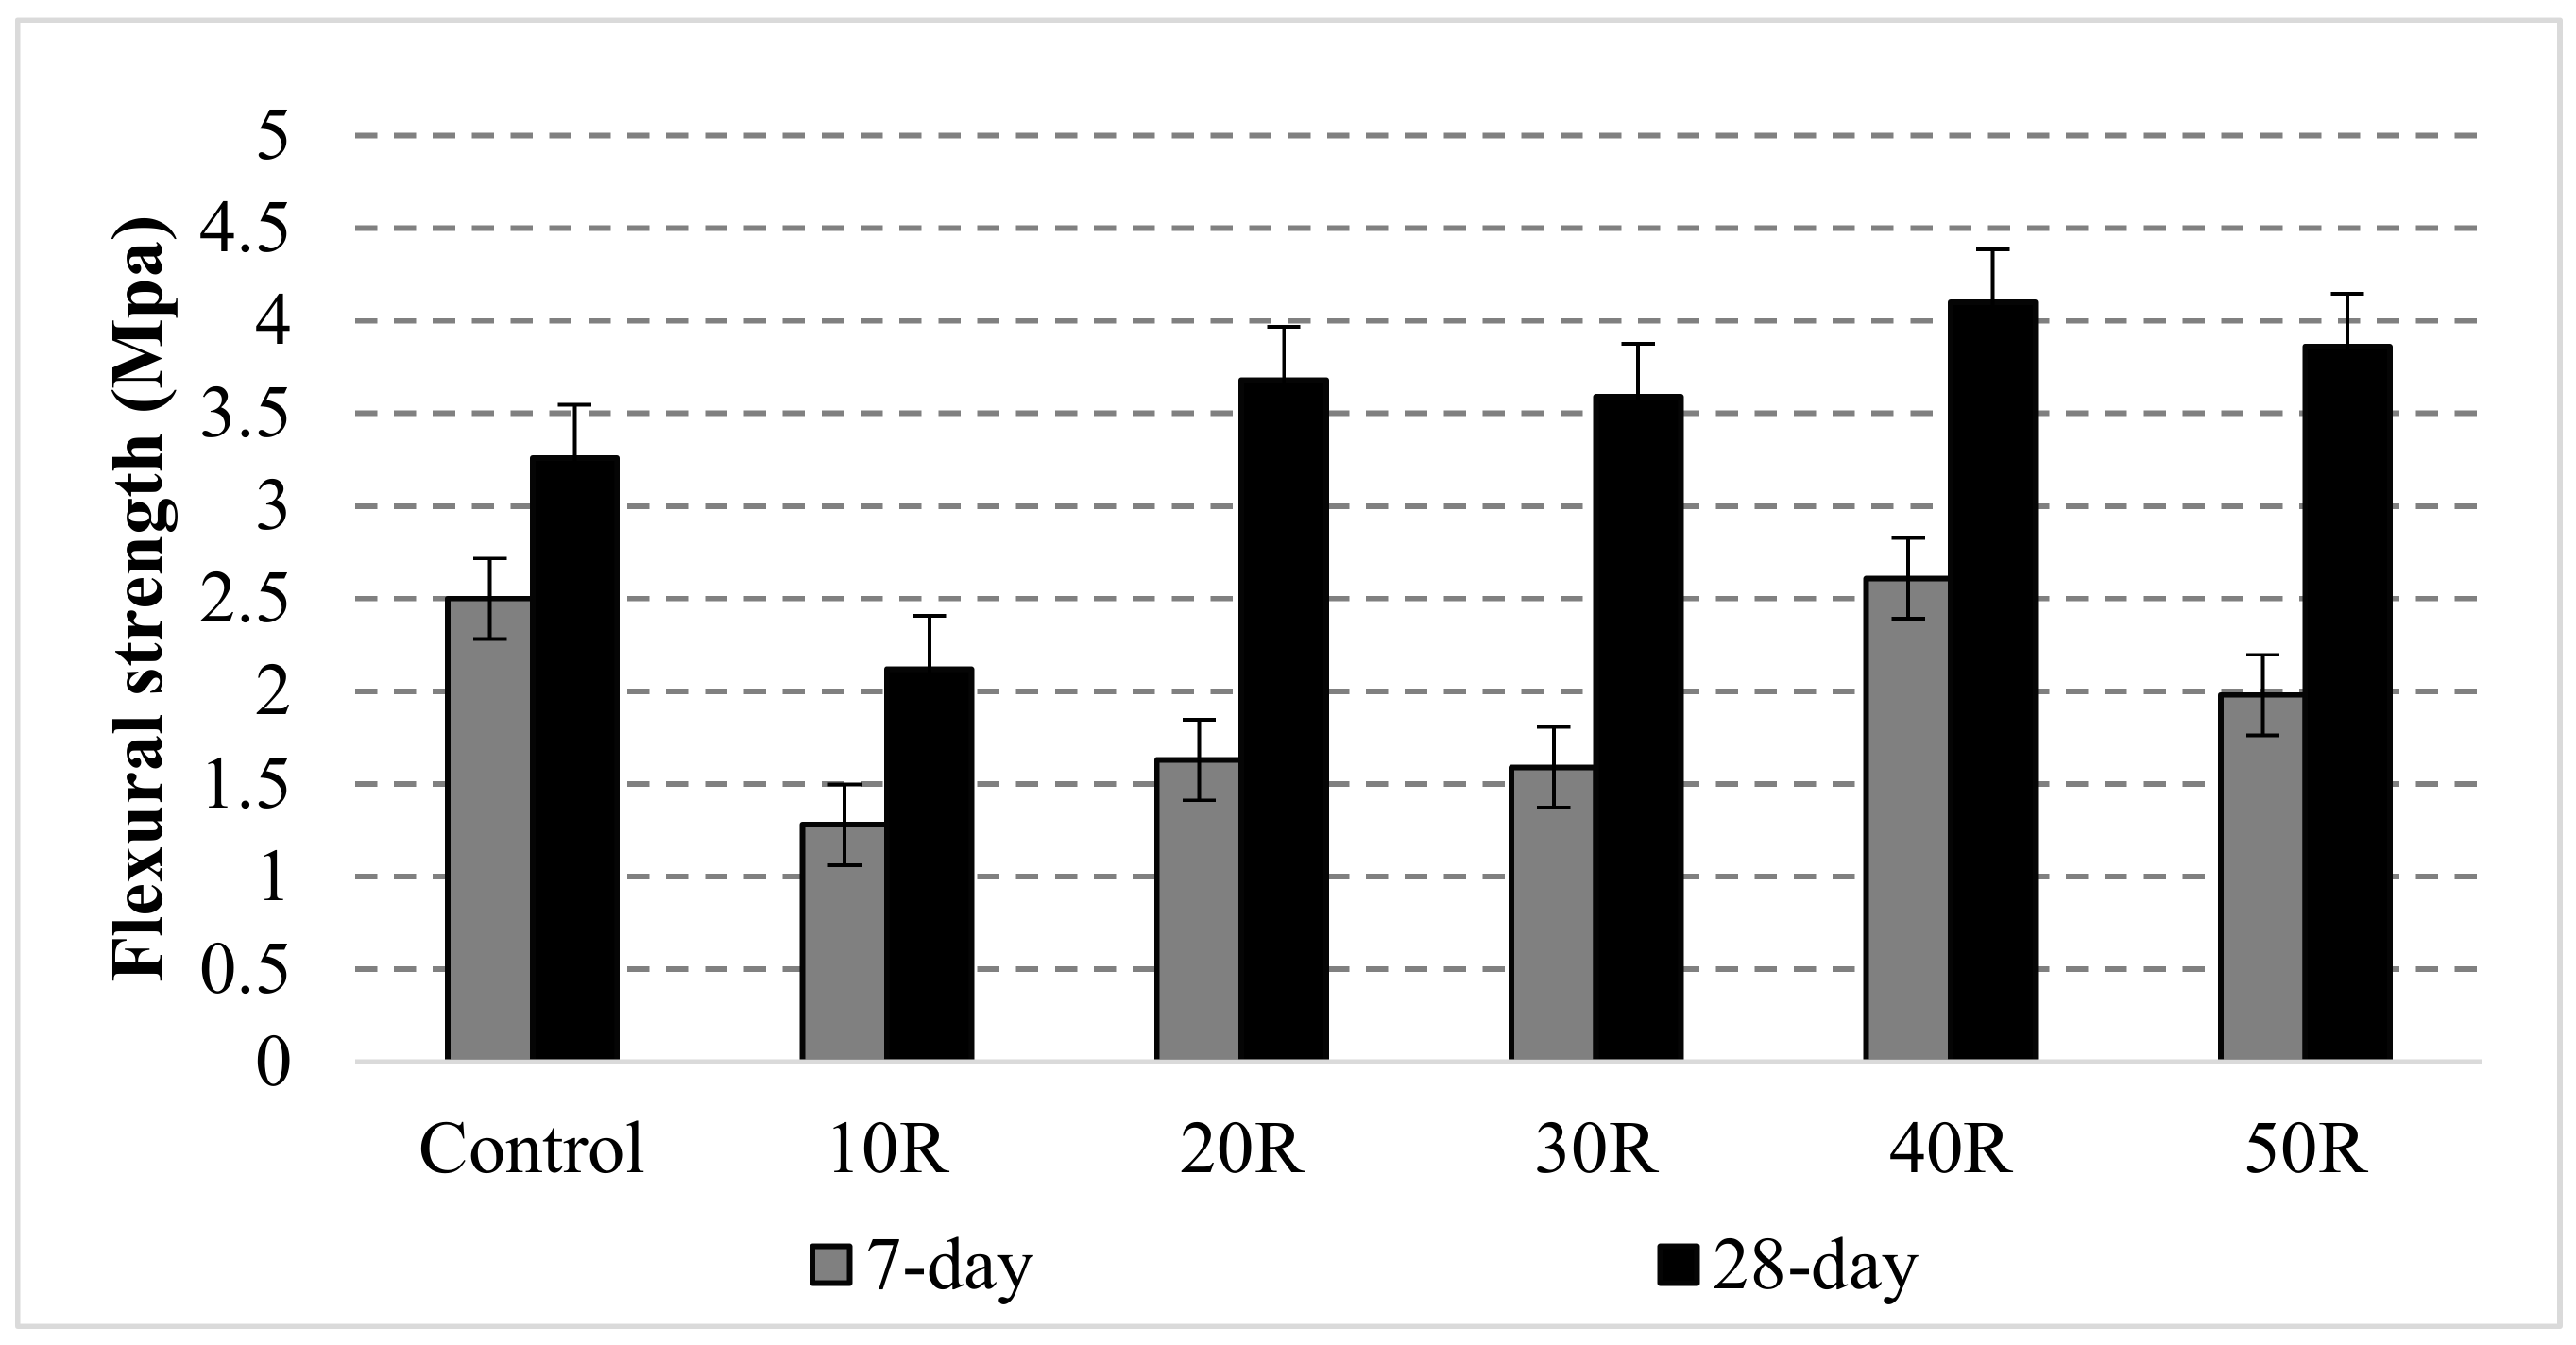
- At the age of seven days, the samples containing recycled aggregates showed a lower compressive strength than that of the control sample. However, at the age of 28 days, using waste aggregates increased the compressive strength of the samples (except 30%–50% replacements). The same trend was seen in the splitting-tensile and flexural tests.
Author Contributions
Funding
Conflicts of Interest
References
- Duque-Acevedo, M.; Belmonte-Ureña, L.J.; Cortés-García, F.J.; Camacho-Ferre, F. Agricultural waste: Review of the evolution, approaches and perspectives on alternative uses. Glob. Ecol. Conserv. 2020, 22, e00902. [Google Scholar] [CrossRef]
- Elmer, J. The Basel Convention: Effect on the Asian secondary lead industry. J. Power Sources 1996, 59, 1–7. [Google Scholar] [CrossRef]
- Akçaözoğlu, S.; Atiş, C.D.; Akçaözoğlu, K. An investigation on the use of shredded waste PET bottles as aggregate in lightweight concrete. Waste Manag. 2010, 30, 285–290. [Google Scholar] [CrossRef] [PubMed]
- Mohammed, A.A.; Mohammed, I.I.; Mohammed, S.A. Some properties of concrete with plastic aggregate derived from shredded PVC sheets. Constr. Build. Mater. 2019, 201, 232–245. [Google Scholar] [CrossRef]
- Hama, S.M.; Hilal, N.N. Fresh properties of self-compacting concrete with plastic waste as partial replacement of sand. Int. J. Sustain. Built Environ. 2017, 6, 299–308. [Google Scholar] [CrossRef]
- Gesoglu, M.; Güneyisi, E.; Hansu, O.; Etli, S.; Alhassan, M. Mechanical and fracture characteristics of self-compacting concretes containing different percentage of plastic waste powder. Constr. Build. Mater. 2017, 140, 562–569. [Google Scholar] [CrossRef]
- Sadrmomtazi, A.; Dolati-Milehsara, S.; Lotfi-Omran, O.; Sadeghi-Nik, A. The combined effects of waste Polyethylene Terephthalate (PET) particles and pozzolanic materials on the properties of self-compacting concrete. J. Clean. Prod. 2016, 112, 2363–2373. [Google Scholar] [CrossRef]
- Pouranian, M.R.; Notani, M.A.; Tabesh, M.T.; Nazeri, B.; Shishehbor, M. Rheological and environmental characteristics of crumb rubber asphalt binders containing non-foaming warm mix asphalt additives. Constr. Build. Mater. 2020, 238, 117707. [Google Scholar] [CrossRef]
- Gonzalez-Sanchez, J.F.; Fernandez-Alvarez, J.M.; Alvarez, J.I.; Navarro-Blasco, I.Í. Solidification/Stabilization of hazardous wastes from the mine La Prieta in Hidalgo del Parral, Chihuahua, México. Available online: https://dadun.unav.edu/bitstream/10171/43879/1/2017-04-06-X%20JICES-Poster-Fidel.pdf (accessed on 12 January 2020).
- Thomas, B.S.; Gupta, R.C. A comprehensive review on the applications of waste tire rubber in cement concrete. Renew. Sustain. Energy Rev. 2016, 54, 1323–1333. [Google Scholar] [CrossRef]
- Gupta, T.; Chaudhary, S.; Sharma, R.K. Assessment of mechanical and durability properties of concrete containing waste rubber tire as fine aggregate. Constr. Build. Mater. 2014, 73, 562–574. [Google Scholar] [CrossRef]
- Asokan, P.; Osmani, M.; Price, A. Assessing the recycling potential of glass fibre reinforced plastic waste in concrete and cement composites. J. Clean. Prod. 2009, 17, 821–829. [Google Scholar] [CrossRef]
- Boadella, I.L.; Gayarre, F.L.; González, J.S.; Gómez-Soberón, J.M.; Pérez, C.L.-C.; López, M.S.; De Brito, J. The influence of granite cutting waste on the properties of ultra-high performance concrete. Materials 2019, 12, 634. [Google Scholar] [CrossRef] [PubMed] [Green Version]
- Kim, J.-H.J.; Park, C.-G.; Lee, S.-W.; Lee, S.-W.; Won, J.-P. Effects of the geometry of recycled PET fiber reinforcement on shrinkage cracking of cement-based composites. Compos. Part B Eng. 2008, 39, 442–450. [Google Scholar] [CrossRef]
- Kou, S.; Lee, G.; Poon, C.; Lai, W. Properties of lightweight aggregate concrete prepared with PVC granules derived from scraped PVC pipes. Waste Manag. 2009, 29, 621–628. [Google Scholar] [CrossRef] [PubMed]
- Gadea, J.; Rodríguez, A.; Campos, P.; Garabito, J.; Calderón, V. Lightweight mortar made with recycled polyurethane foam. Cem. Concr. Compos. 2010, 32, 672–677. [Google Scholar] [CrossRef]
- Lei, Z.; Bahia, H.; Yi-qiu, T.; Ling, C. Effects of refined waste and bio-based oil modifiers on rheological properties of asphalt binders. Constr. Build. Mater. 2017, 148, 504–511. [Google Scholar] [CrossRef]
- Khayat, K.H.; Meng, W. Design and Performance of Stay-in-Place UHPC Prefabricated Panels for Infrastructure Construction; Center for Transportation; Missouri University of Science and Technology: Rolla, MO, USA, 2014. [Google Scholar]
- Labuschagne, J.-C. Formwork Pressures by Self-Compacting Concrete: A Practical Perspective; Stellenbosch University: Stellenbosch, South Africa, 2018. [Google Scholar]
- Salek, S.; Samali, B.; Murphy, T.; Wuhrer, R.; Adam, G. Comparative study between microstructure of a novel durable concrete and normal concrete subjected to harsh environments. In Proceedings of the 9th International Conference on Fracture Mechanics of Concrete and Concrete Structures, San Francisco, CA, USA, 29 May–1 June 2016. [Google Scholar]
- Karakurt, C. Microstructure properties of waste tire rubber composites: An overview. J. Mater. Cycles Waste Manag. 2015, 17, 422–433. [Google Scholar] [CrossRef]
- American Society for Testing and Materials. C192 Standard Practice for Making and Curing Concrete Test Specimens in the Laboratory; ASTM International: West Conshohocken, PA, USA, 2002. [Google Scholar]
- American Society for Testing and Materials. C1611 Standard Test Method for Slump Flow of Self-Consolidating Concrete; ASTM International: West Conshohocken, PA, USA, 2009. [Google Scholar]
- Ardalan, R.B.; Joshaghani, A.; Hooton, R.D. Workability retention and compressive strength of self-compacting concrete incorporating pumice powder and silica fume. Constr. Build. Mater. 2017, 134, 116–122. [Google Scholar] [CrossRef]
- Joshaghani, A. Workability Retention and Mechanical Properties of Self-Compacting Concrete (SCC) with Sugar Cane Bagasse Ash (SCBA) and Rice Husk Ash (RHA); Nova Science Publishers: New York, NY, USA, 2017; pp. 233–258. [Google Scholar]
- Ardalan, R.B.; Emamzadeh, Z.N.; Rasekh, H.; Joshaghani, A.; Samali, B. Physical and mechanical properties of polymer modified self-compacting concrete (SCC) using natural and recycled aggregates. J. Sustain. Cem. Based Mater. 2019. [Google Scholar] [CrossRef]
- Efnarc, S. Guidelines for Self-Compacting Concrete; Efnarc Association House: Farnham, UK, 2002; pp. 1–32. Available online: www.efnarc.org.
- Russell, H.G. ASTM Test Methods for Self-Consolidating Concrete. HPC Bridge Views 2008, 50, 1–11. [Google Scholar]
- Askarian, M.; Fakhretaha Aval, S.; Joshaghani, A. A comprehensive experimental study on the performance of pumice powder in self-compacting concrete (SCC). J. Sustain. Cem. Based Mater. 2018, 7, 340–356. [Google Scholar] [CrossRef]
- ASTM International. Standard Test Method for Flexural Strength of Concrete (Using Simple Beam with Third-Point Loading); Committee C09 on Concrete and Concrete Aggregates: West Conshohocken, PA, USA, 2016. [Google Scholar]
- Norma, A. C496/C496M-11. In Standard Test Method for Splitting Tensile Strength of Cylindrical Concrete Specimens; ASTM International: West Conshohocken, PA, USA, 2004; pp. 469–490. [Google Scholar]
- Al-Hadithi, A.I.; Hilal, N.N. The possibility of enhancing some properties of self-compacting concrete by adding waste plastic fibers. J. Build. Eng. 2016, 8, 20–28. [Google Scholar] [CrossRef]
- Karein, S.M.M.; Joshaghani, A.; Ramezanianpour, A.; Isapour, S.; Karakouzian, M. Effects of the mechanical milling method on transport properties of self-compacting concrete containing perlite powder as a supplementary cementitious material. Constr. Build. Mater. 2018, 172, 677–684. [Google Scholar] [CrossRef]
- Albano, C.; Camacho, N.; Hernandez, M.; Matheus, A.; Gutierrez, A. Influence of content and particle size of waste pet bottles on concrete behavior at different w/c ratios. Waste Manag. 2009, 29, 2707–2716. [Google Scholar] [CrossRef]
- Brameshuber, W.; Uebachs, S. Practical experience with the application of self-compacting concrete in Germany. In Proceedings of the 2nd International Symposium on Self-Compacting Concrete, Tokyo, Japan, 3–5 October 2001; pp. 687–696. [Google Scholar]
- Safiuddin, M.; Salam, M.; Jumaat, M. Effects of recycled concrete aggregate on the fresh properties of self-consolidating concrete. Arch. Civ. Mech. Eng. 2011, 11, 1023–1041. [Google Scholar] [CrossRef] [Green Version]
- Joshaghani, A.; Bhardwaj, R.; Zollinger, D.G.; Mukhopadhyay, A.K. Investigating the Effects of Curing Quality on Key Concrete Pavement Surface Properties. Transp. Res. Rec. 2019. [Google Scholar] [CrossRef]
- Safi, B.; Saidi, M.; Aboutaleb, D.; Maallem, M. The use of plastic waste as fine aggregate in the self-compacting mortars: Effect on physical and mechanical properties. Constr. Build. Mater. 2013, 43, 436–442. [Google Scholar] [CrossRef]
- Ferreira, L.; de Brito, J.; Saikia, N. Influence of curing conditions on the mechanical performance of concrete containing recycled plastic aggregate. Constr. Build. Mater. 2012, 36, 196–204. [Google Scholar] [CrossRef]
- Saikia, N.; De Brito, J. Use of plastic waste as aggregate in cement mortar and concrete preparation: A review. Constr. Build. Mater. 2012, 34, 385–401. [Google Scholar] [CrossRef]
- Rai, B.; Rushad, S.T.; Kr, B.; Duggal, S.K. Study of waste plastic mix concrete with plasticizer. ISRN Civ. Eng. 2012, 2012, 1–5. [Google Scholar] [CrossRef] [Green Version]
- Tabatabaeian, M.; Khaloo, A.; Joshaghani, A.; Hajibandeh, E. Experimental investigation on effects of hybrid fibers on rheological, mechanical, and durability properties of high-strength SCC. Constr. Build. Mater. 2017, 147, 497–509. [Google Scholar] [CrossRef]
- Jafari, K.; Tabatabaeian, M.; Joshaghani, A.; Ozbakkaloglu, T. Optimizing the mixture design of polymer concrete: An experimental investigation. Constr. Build. Mater. 2018, 167, 185–196. [Google Scholar] [CrossRef]


| Chemical Properties | (wt. %) |
|---|---|
| SiO2 | 20.03 |
| Al2O3 | 5.53 |
| Fe2O3 | 3.63 |
| CaO | 62.25 |
| MgO | 3.42 |
| SO3 | 2.23 |
| K2O | 0.73 |
| Na2O | 0.3 |
| Specific gravity (kg/m3) | 3150 |
| Specific surface area (m2/kg) | 290 |
| Properties | Coarse Aggregate | Fine Aggregate | Plastic Waste |
|---|---|---|---|
| Specific Gravity | 2.82 | 2.67 | 0.97 |
| Water Absorption (%) | 1.95 | 2.51 | 0.1 |
| Maximum Size (mm) | 12.5 | 4.75 | 4.75 |
| Name | Cement | Water | CA | FA | SP | RA |
|---|---|---|---|---|---|---|
| Control | 500 | 180 | 486 | 1139 | 1.2 | 0 |
| 10R | 500 | 180 | 486 | 1025 | 1.2 | 114 |
| 20R | 500 | 180 | 486 | 911.2 | 1.3 | 227.8 |
| 30R | 500 | 180 | 486 | 797.3 | 1.2 | 341.7 |
| 40R | 500 | 180 | 486 | 683.4 | 1.2 | 455.6 |
| 50R | 500 | 180 | 486 | 569.5 | 1 | 569.5 |
| Test Method | Unit | Property | Minimum Range | Maximum Range |
|---|---|---|---|---|
| Slump flow | mm | Filling ability | 650 | 850 |
| T500 slump flow | s | Filling ability | 2 | 5 |
| J-ring | mm | Passing ability | 550 | 750 |
| V-funnel | s | Filling ability | 6 | 12 |
| L-Box | (H2/H1) | Passing ability | 0.8 | 1.0 |
| Slump Flow | J-Ring | V-funnel | T500 | L-Box | |
| Slump Flow | 1 | - | - | - | - |
| J-Ring | 0.935 | 1 | - | - | - |
| V-funnel | −0.942 | −0.982 | 1 | - | - |
| T500 | −0.765 | −0.931 | 0.906 | 1 | - |
| L-Box | 0.8761 | 0.848 | −0.923 | −0.745 | 1 |
| Mixture ID | Waste Replacement (%) | Compressive Strength | Splitting-Tensile Strength | Flexural Strength | |||
|---|---|---|---|---|---|---|---|
| Std Dev. | Sig. * | Std Dev. | Sig. | Std Dev. | Sig. | ||
| Control | 0 | 1.19 | - | 0.56 | - | 0.38 | - |
| 10R | 10 | 0.92 | 1.000 | 0.42 | 1.000 | 0.26 | 0.013 |
| 20R | 20 | 1.20 | 1.000 | 0.26 | 1.000 | 0.14 | 1.000 |
| 30R | 30 | 1.12 | 0.292 | 0.49 | 0.968 | 0.17 | 1.000 |
| 40R | 40 | 0.78 | 0.081 | 0.18 | 0.477 | 0.10 | 0.877 |
| 50R | 50 | 1.51 | 0.002 | 0.41 | 0.032 | 0.08 | 0.995 |
© 2020 by the authors. Licensee MDPI, Basel, Switzerland. This article is an open access article distributed under the terms and conditions of the Creative Commons Attribution (CC BY) license (http://creativecommons.org/licenses/by/4.0/).
Share and Cite
Rashidi, M.; Joshaghani, A.; Ghodrat, M. Towards Eco-Flowable Concrete Production. Sustainability 2020, 12, 1208. https://doi.org/10.3390/su12031208
Rashidi M, Joshaghani A, Ghodrat M. Towards Eco-Flowable Concrete Production. Sustainability. 2020; 12(3):1208. https://doi.org/10.3390/su12031208
Chicago/Turabian StyleRashidi, Maria, Alireza Joshaghani, and Maryam Ghodrat. 2020. "Towards Eco-Flowable Concrete Production" Sustainability 12, no. 3: 1208. https://doi.org/10.3390/su12031208
APA StyleRashidi, M., Joshaghani, A., & Ghodrat, M. (2020). Towards Eco-Flowable Concrete Production. Sustainability, 12(3), 1208. https://doi.org/10.3390/su12031208