Article

Examining the Relationship between Urban Land Expansion and Economic Linkage Using Coupling Analysis: A Case Study of the Yangtze River Economic Belt, China

1
School of Public Administration, Zhejiang University of Finance & Economics, Hangzhou 310018, China
2
School of Economics, Zhejiang Gongshang University, Hangzhou 310018, China
3
School of Geographic and Oceanographic Sciences, Nanjing University, Nanjing 210046, China
*
Author to whom correspondence should be addressed.
Sustainability 2020, 12(3), 1227; https://doi.org/10.3390/su12031227
Submission received: 25 October 2019 / Revised: 4 February 2020 / Accepted: 6 February 2020 / Published: 8 February 2020

Abstract

:
Urban land expansion (ULE) has caused negative effects as a result of urbanization and industrialization in China in the past few decades. Strengthening economic linkage and the cooperation among regions has great implications for effectively controlling disorderly ULE and achieving sustainable and intensive land use. Previous research has rarely investigated the relationship between ULE and economic linkage. Therefore, this study analyzes the spatial patterns of ULE and economic linkage in the Yangtze River Economic Belt (YREB) of China via social network analysis and a gravity model. Moreover, the spatial relationship and coupling level between ULE and economic linkage are investigated by building a bivariate spatial autocorrelation model and a coupling coordination degree model, respectively. The results indicate that the YREB experienced rapid ULE, and the area increased from 4.24 × 10⁴ km2 in 1990 to 7.89 × 10⁴ km2 in 2015. The cities that experience rapid ULE have gradually transferred from the east to the west of the YREB. In addition, the economic linkage in eastern cities is evidently higher than that of western cities. Our bivariate spatial model further proves that there are strong negative spatial correlation characteristics between ULE and economic linkage. This indicates that the higher the economic linkage, the lower the speed of ULE. Moreover, the coupling coordination between ULE and economic linkage show that the overall coupling stage changed from an antagonistic stage to a running-in stage. However, the coupling coordination in the YREB presented significant spatial heterogeneity, and most cities in urban agglomeration had a relationship between ULE and economic linkage that was barely balanced, slightly unbalanced, or seriously unbalanced. By considering the limitations and obstacles of current initiatives, suggestions and policy implications for sustainable land use at large regional scales are suggested.

1. Introduction

With the advancement of urbanization and globalization, problems caused by urban population explosions, such as urban expansion, ecological environment destruction, and disordered competition among regions, have become increasingly prominent [1,2,3]. During the decades of reform and opening-up policies that began in 1978, China experienced rapid urbanization and industrialization, which resulted in urban land expansion (ULE). However, urban land expansion is a double-edged sword. On the one hand, it guaranteed the land demand of economic growth, and on the other hand, it caused massive losses of cultivated land, rural labor migration, ecological problems, and the unbalanced development of urban–rural regions [4,5,6,7]. Therefore, the way to ensure the coordinated and coupled development between urban land expansion and economic growth is of great significance to protect the ecological environment, optimize land space patterns, and conduct coordinated regional development in China.
The supply of and demand for construction land has great heterogeneity in cities with different economic development levels, and ULE shows spatiotemporal variations in different regions [8,9]. For example, the factors of population density rather than economic factors have had a great impact on ULE in megacities in China, while industry development and urban population growth stimulated ULE in northeast China [10]. Therefore, improving the level of regional coordination and promoting regional integration has become an effective way to optimize land resource allocation and improve the efficiency of construction land usage. Urban land expansion is not only a consequence of economic development, but also a strategy for local governments to simulate and govern urban economy. However, the central government in China has issued regulations to control the growth of urban land. The outline of the 13th five-year plan for the land resources of China proposes implementing dual control measures on the total amount and usage intensity of construction land. During the 13th five-year plan period, the total amount of new construction land will be controlled at 2.17 × 10⁵ ha, and the construction land area per unit gross domestic product (GDP) will be reduced by 20%. In light of these restrictions, most cities in China are faced with a dilemma regarding the demand for and control of construction land. Therefore, to promote sustainable land use, studying the coupling relationship between the expansion of urban land and regional economic linkage is conducive to improving efficiency and restricting the expansion of urban land.
ULE is closely related to human activities, and there is a complex interaction between them [11]. Some scholars have focused on exploring the driving forces of ULE from different aspects of economic activities and have analyzed the influences on ULE from implementing land-use plans [12], fiscal revenue or land finance [13,14], economic transitions [15], population density [10], rapid development infrastructures, and intensive industrial parks [16]. In addition, some studies have argued that regional urban land expansion could impact regional carbon storage. Models have been used to simulate urban land expansion, considering the factors of intra-urban social segregation and the potential for densification within already urban land areas when their present density allows it [17,18,19]. Moreover, some externalities and features of the dynamic evolution of economic activities have an impact on ULE. A few studies have paid attention to how the determinations of agglomeration capacity and spatial agglomeration levels of economic development affect ULE [20]. As an important product of agglomeration, spatial proximity has been considered in the context of the spatial characteristics of urban expansion [21]. However, these previous studies mainly concentrated on the driving effects of economic activities on the ULE and ignored the dynamic relationship(s) between ULE and economic activities.
Previous studies have used other theories to explore the relationship between built-up land expansion and economic development, such as the decoupling theory [22], spatial interaction analysis [23], niche theory [24], and Kuznets curve [25]. Previous scholars generally believed that the spatial heterogeneity of the space scale and geographical elements have a great influence on the changes in the relationship between construction land expansion and economic development. However, the existing research on the expansion of construction land and economic development at the large regional level of the river basin scale involved little analysis. This study tried to explore the relationship between ULE and economic linkage on the premise of considering the spatial proximity effect in China’s Yangtze River Economic Belt on the regional scale. With the increase of economic linkage between the urban agglomeration in the middle and lower reaches of the Yangtze River Economic Belt (YREB), as well as the increasing improvements in regional economic integration, the regional spatial proximity and spillover effects have become significant. Thus, it is necessary to further study whether the relationship between ULE and economic linkage is affected by the economic development of neighboring regions.
This study selected a prefecture-level city of the YREB as the research object, and the aims of this study were as follows: (1) Characterize the spatial pattern of ULE and economic linkage; (2) assess the degree of economic linkage and the spatial relationship between ULE and economic linkage; and (3) analyze the coupling and coordination evolution relationship between the ULE and economic linkage. These are significant for providing practical guidance for the sustainable development and utilization of construction land in the YREB.

2. Materials and Methods
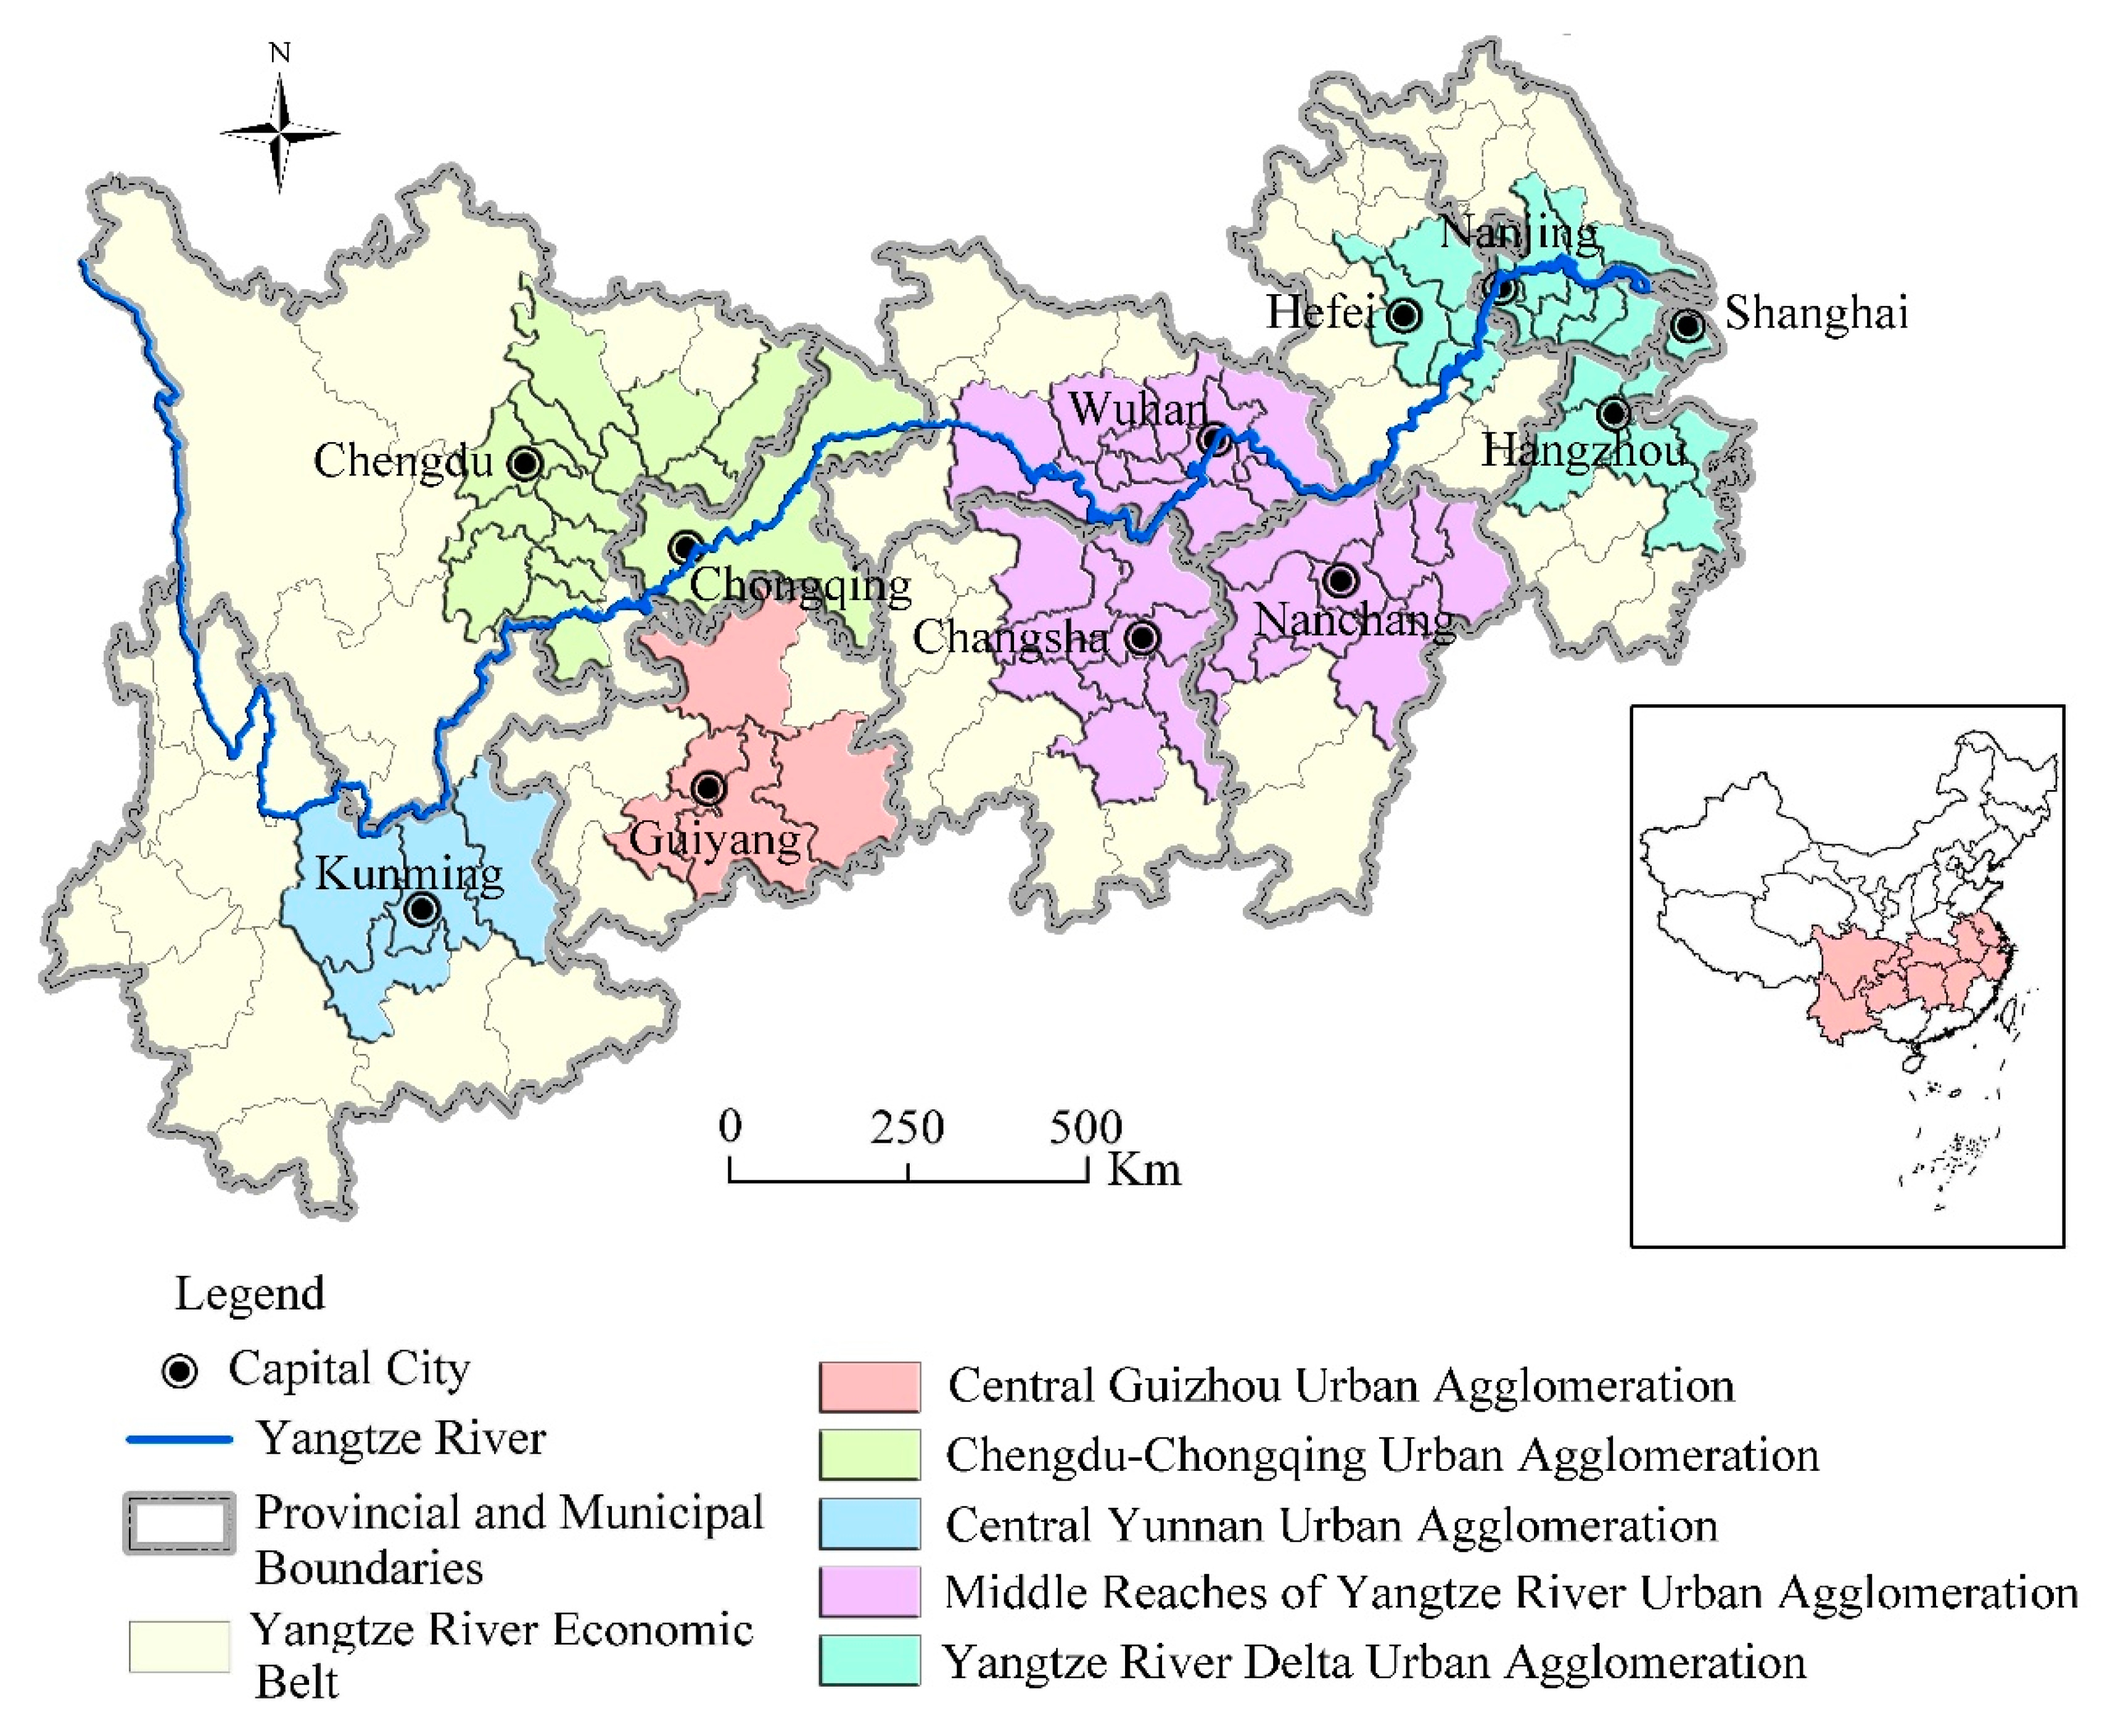
2.1. Study Area

The YREB covers nine provinces, including Zhejiang, Jiangsu, Anhui, Hubei, Jiangxi, Hunan, Sichuan, Yunan, Guizhou, and two municipalities, including Shanghai and Chongqing (Figure 1). This area involves 21.4% of China’s total land area and supports 584 million people. The YREB contains five urban agglomerations and consists of 247 prefectural cities, with an average urbanization rate of 53% (in 2015). The dense population, rapid urbanization, and extensive economic activities contributed to 43.2% of China’s GDP in 2016. Together with the Eastern Economic Belt, they constitute an important “T” pattern for China’s land development and economic construction [26]. The rapid growth in population and economic development in the YREB over the past 30 years has occurred at the cost of the deterioration of ecosystems and the environment [27]. With the implementation of national strategies for balanced regional development, the level of intensive land use in the YREB has gradually decreased from east to west, and there are great differences among different cities in the provinces [28]. In this study, we used a prefecture city as a research unit to examine the spatial relationship(s) between economic linkage and ULE in the YREB.

2.2. Data Source and Data Pre-Processing
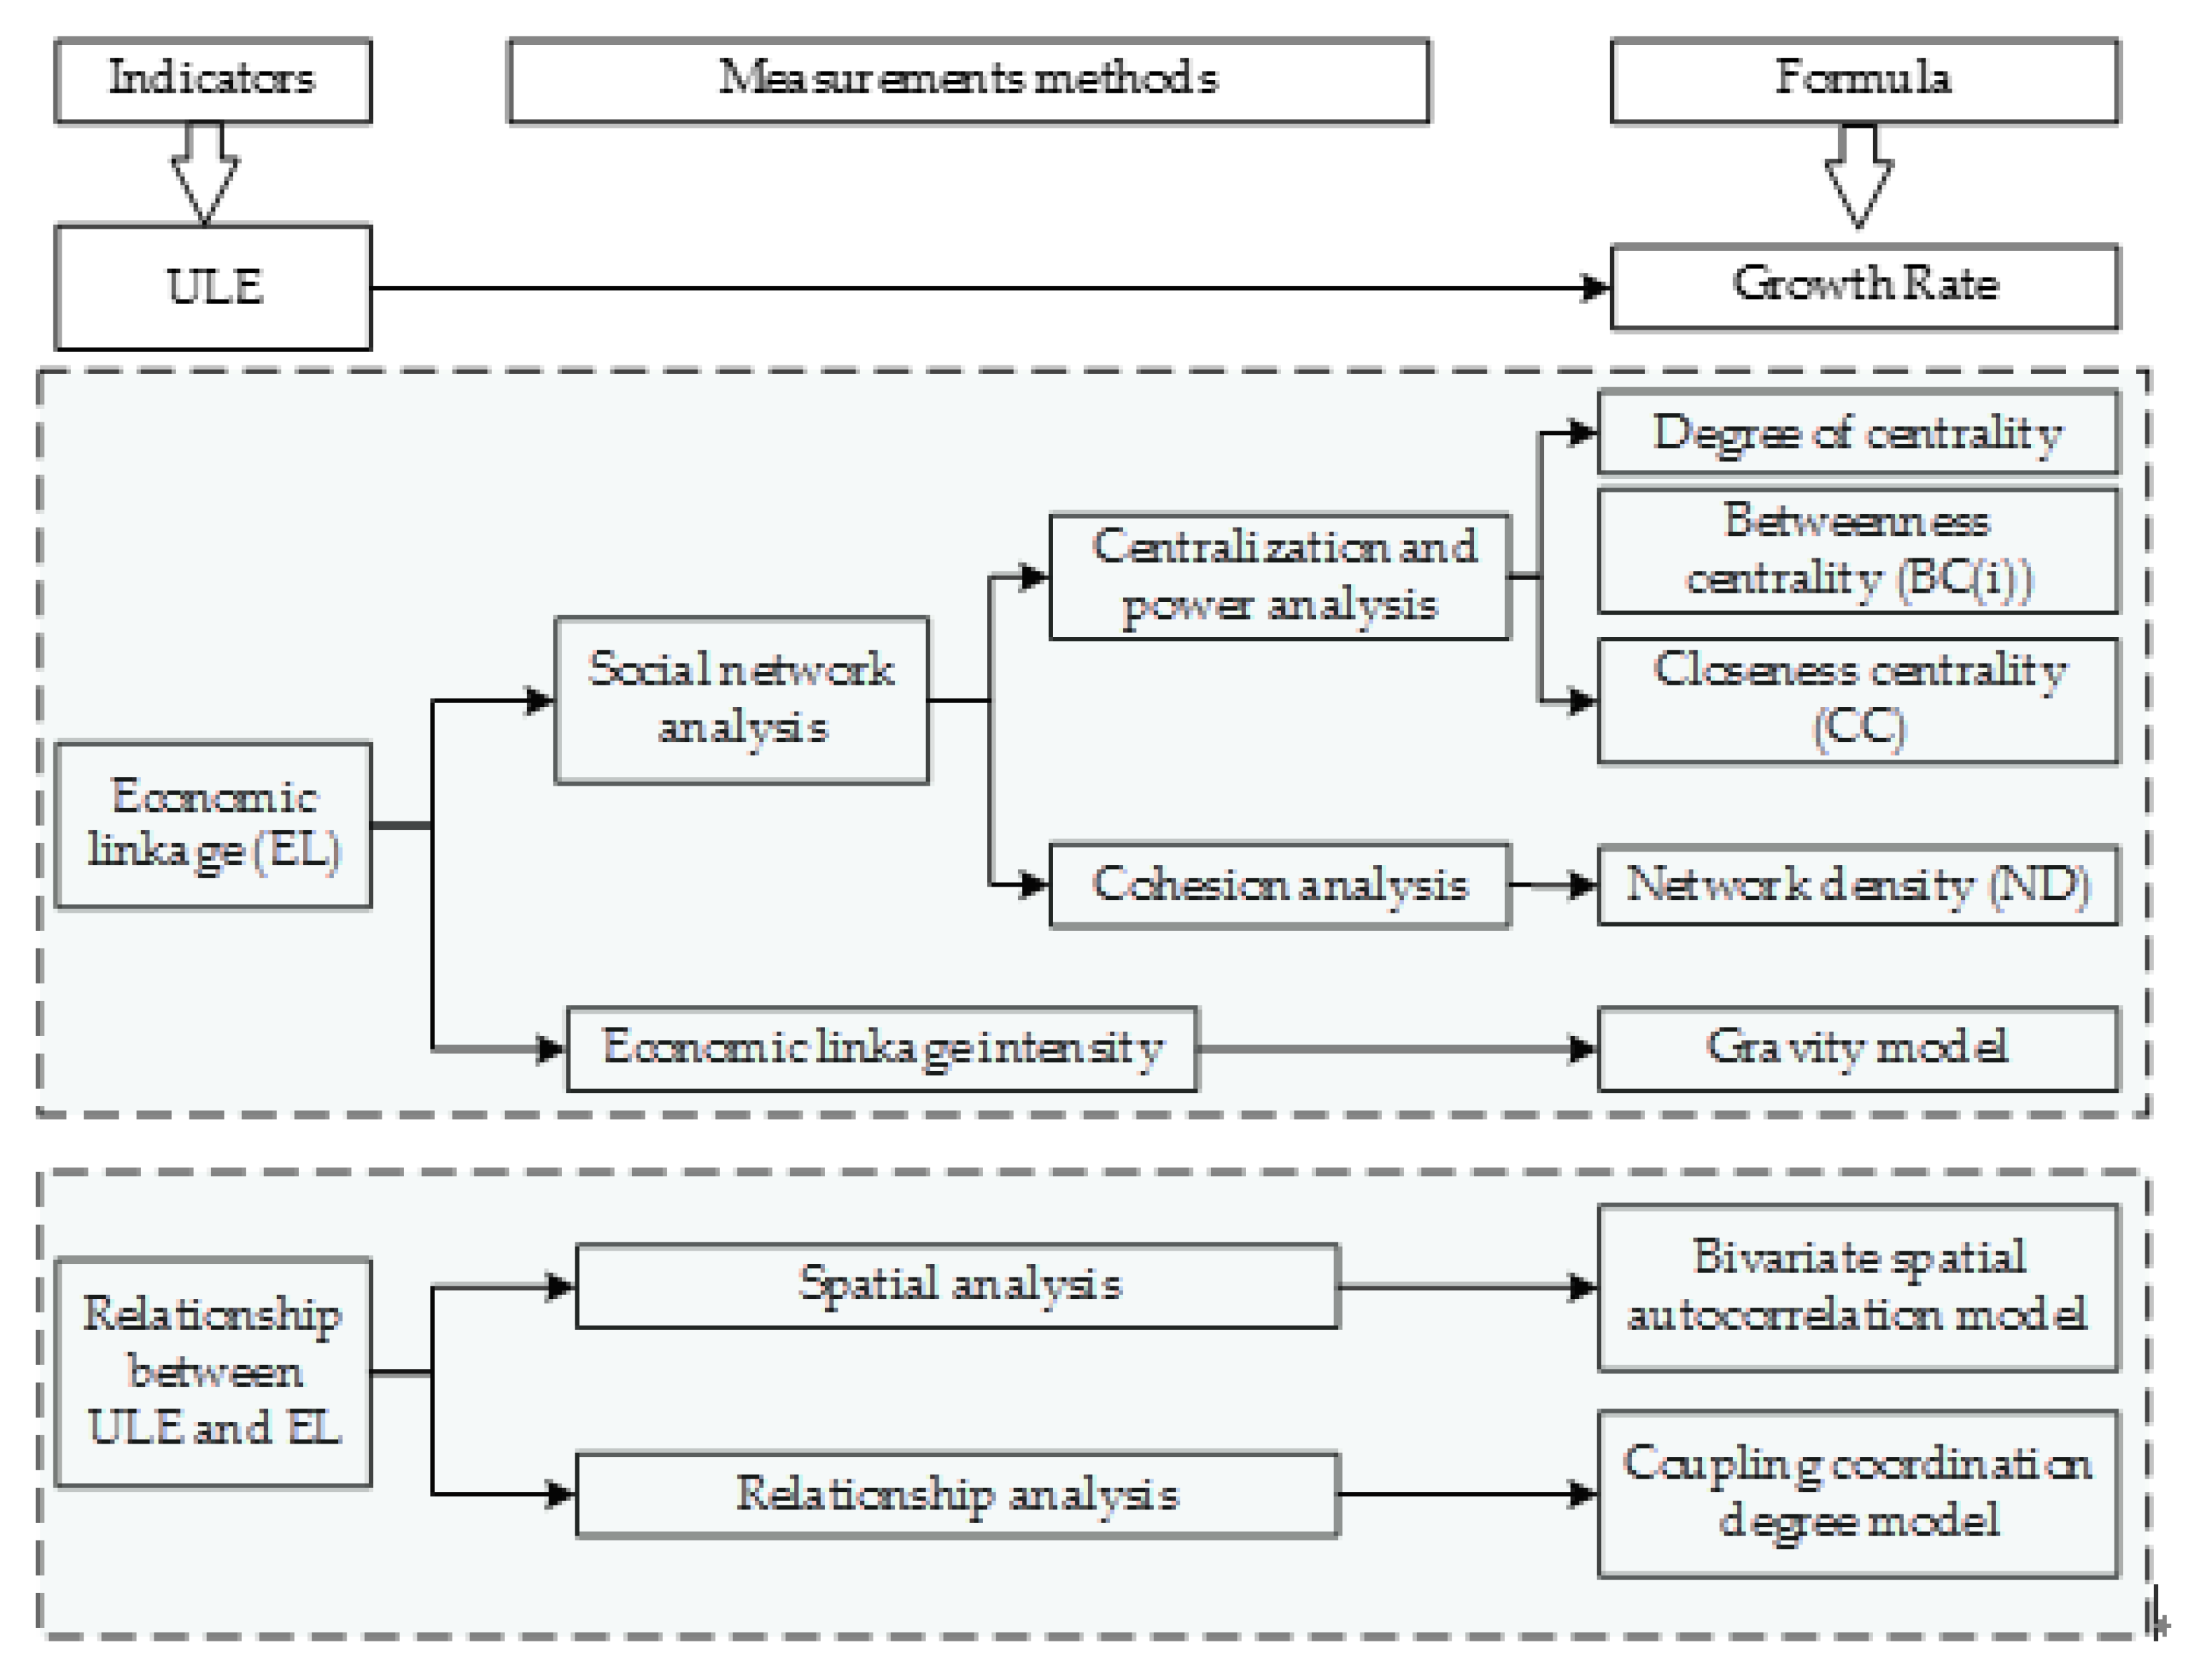
The social and economic data were collected from the statistical yearbooks of each province from 1991 to 2016, the Reform and Opening up 30 Years Statistical Yearbook, China’s Urban Statistical Yearbook, and China’s Regional Economic Development Yearbook.
The remote sensing image data in this study were collected from a land-use/land-change database established by the Chinese Academy of Sciences in the late 1980s. The comprehensive evaluation accuracy of the first-grade classification of land use reached 94.3%; the comprehensive accuracy of the second-grade classification reached 91.2% and met the mapping accuracy of 1:100,000 scale data. The 30 m grid data used in this study were obtained from a grid transformation based on the 1:100,000 scale data. The data types of land use included six primary classifications: cultivated land, woodland, grassland, water area, construction land, and unused land. Cultivated land included paddy fields and non-irrigated farmland; woodland included organic forest, shrubbery, and woodland; grassland refers to three coverage types of high, medium, and low; water area included natural and artificial rivers, fishery reservoirs, lakes, tidal flats, and shallows; construction land included urban residential land, urban land, rural residential land, and other built-up land; and unused land included sand, saline, marshes, barren lands, and others. Based on the remote sensing land data from 1990 to 2015, the provincial classification area was summarized through graphical cutting and an area adjustment calculation, and the construction land area of each province and each prefecture-level city were, respectively, calculated. Transportation network data were collected from the Road Traffic Atlas of China (1990, 2005, 2015), and were digitized using ArcGIS, version 10.0.

2.3. Methods

Our study used many indicators and methods to measure the ULE and economic linkage intensity, and, at the same time, the related formulas and relationships between these models were listed in a flow chart (Figure 2). The details of all of these methods are presented in the following sections.

2.3.1. The Indexes for Evaluation of Urban Land Expansion (ULE) and Economic Linkage

ULE is measured by the changes in urban land areas, including the growth rate (GT) of land-use change for every land-use type [29]. The growth rates can be calculated as follows:
GT   = A t     A t     1 A t     1 T   ×   100 %
Here, the growth rate (GT) represents the urban land-change rate (percent); A t and A t     1 are the areas of urban land at the beginning and end of a period, respectively; and T is the time interval (years).

2.3.2. Evaluation of the Economic Linkage

To evaluate economic linkage, a gravity model and a social network analysis (SNA) model were combined to synthetically reflect the intensity of economic linkage. We modified the traditional gravity model to measure the intensity of the economic linkage of each city in the YREB, and then calculated the degree of economic linkage in the network using the SNA techniques from the “UCINET” software.
(1) Modified gravity model
A gravity model (in a variety of forms) has been widely used in many fields based on spatial interaction effects, such as trade flows between countries, regional border effects, and labor and residential accessibility [30,31,32]. In geographical science, a gravity model is often used to explain distance decay effects [33], where the interaction strength between two urban regions decreases as the geographical distance between them increases, as shown in Equation (2).
F i j   =   G ( M i M j D i j )
In the above, F i j and D i j denote the interaction and distance from i to j between two places, respectively ;   M i and M j represent the economic masses of places i and j, respectively; and G is a constant.
The economic mass, M i , j , of place i or j is an important index for the gravity model. In this expression, M i , j can be measured by principal component analysis, and we selected a compressive index system considering the availability of data and the actual situation in the study area, as well as other reference studies (Table 1) [30,34].
Generally, the distance is measured by physical spatial distance (e.g., the Euclidean distance or the Manhattan distance) [35,36]. In this study, we used time distance to replace the physical distance because transportation networks reconstruct spatial patterns and reduce the spatial distance by improving accessibility. The “time distance” in our research refers to the commuting time cost from place i to place j. We classified the study area into land, road, and water areas because different landscape types have different traffic speeds that influence the commuting time. The speeds of different types of transport were defined in our previous study to measure the spatial effects of urban land-use efficiency [37]. We created a commuting time cost for the YREB based on the same revision methods.
(2) Social network analysis (SNA) techniques
SNA techniques consider the connections (ties) among individuals, units, or organizations, and are increasingly used within management research, knowledge flows, and so on as a means of understanding the complex and interactive relationships and patterns between and within organizations [38,39,40]. Moreover, SNA techniques provide indexes for centralization and power analysis (degree, betweenness, closeness centralization) and cohesion analysis (network density). The specified formulas are as follows.
The degree of centrality C D ( i ) measures the city’s influence on the network:
C D ( i )   =   i   =   1 n E i j
Here, C D ( i ) represents the degree of centrality of city i, E i j represents the economic linkage between i and j, and n represents the total number of cities within the network.
Betweenness centrality, BC(i), measures the city’s capacity to intermediate economic linkage among various network cities and reflects the role of communication and connection among cities. The formula is as follows:
BC ( i )   =   j n k n g j k ( i ) g j k
In the above, g j k represents the number of shortcut paths between city j and k, and g j k ( i ) g j k represents the probability that city i is on the shortcut between cites j and k.
The closeness centrality (CC) represents the average distance of a city from all of the other cities. The formula is as follows:
CC ( i )   =   [ j   =   1 n d ( i , j ) ] 1 ,   d ( i , j )   =   min ( x i h + + x h j )
Here, h refers to intermediary cities on the paths between city i and j.
The network density (ND) indicates the intensity of the efficiency of the network connections between cities; the closer the connection between each city, the greater the network density value. It is determined from the following equation:
ND   =   L n ( n     1 ) / 2
In this equation, L represents the number of connections that are established in the network, and n represents the total number of network members.
(3) Bivariate spatial autocorrelation model
This study uses the bivariate Moran’s I statistics as indexes of spatial autocorrelation to test the spatial autocorrelation between ULE and economic linkage. There are two types of Moran’s I statistics: global and local [41]. The global Moran’s I is a measurement describing the overall spatial relationship across all geographic units for the entire study area. It can be calculated from the following formula:
I e u   =   N i   =   1 N j i N W i j x i e y j u ( N     1 ) i   =   1 N j i N W i j
In Equation (7), I e u is the bivariate global spatial correlation index, N is the total number of geographic units, W i j is the spatial weight matrix, x i e is the standardization of the economic linkage in city i, and y j u is the standardization of the ULE in city j. The values of the global Moran’s I range are from –1 to 1. If Moran’s I > 0, there is a positive correlation between the economic linkage and ULE. The larger this value is, the stronger the correlation will be. Inversely, if Moran’s I < 0, a negative spatial correlation exists.
The spatial correlation may differ locally within the study area, and measurements of global spatial autocorrelation do not reflect the local spatial correlations within geographic units because their computation ignores the existence of spatial heterogeneity. We therefore used Anselin’s local indicators of spatial association (LISA) to explore the spatial heterogeneity within the study area. The bivariate local spatial autocorrelation formula is:
I i   =   Z i j   =   1 n w i j Z j
Here, Z i and Z j are the standardized values of the geographical attribute values of the spatial units i and j, respectively; Z i is the standardized value of the variance of the independent variable; Z i is the standardized value of the variance of the dependent variable; and W ij is the spatial weight matrix. The corresponding standards were used in this study.   w ij z j is the space lag vector of the dependent variable of the spatial unit j .
(4) Coupling coordination degree model
This study introduces the concept of coupling in physics to calculate the coupling degree of the economic linkage intensity of ULE in the YREB [42]. Coupling describes the phenomenon by which two or more systems influence each other via interactive mechanisms. The more linkage among systems, the larger the correlation degree [43]. To reflect the synergies among systems, this study constructed a coupling coordination degree model to evaluate the coordinated degree of the economic linkage intensity of ULE. The coupling coordination degree model is given by the following formulas:
R   =   C × T
C   =   { L ( x ) G i ( y ) [ L ( x )   +   G i ( y ) 2 ] 2 } 1 2
In the above, R represents the degree of coupling coordination, and R [ 0 , 1 ] ; C denotes the degree of coupling between the economic linkage intensity and ULE; and L ( x ) and G i ( y ) represent the standardized values of the growth rate of the construction land area and the average annual growth rate of the economic linkage strength, respectively. The degree of coupling between economic linkage intensity and ULE can be divided into three stages, which can be further divided into four subclasses stages. Table 2 describes the comprehensive index of the development stage of coupling. [44].
T   =   α L ( x )   +   β G i ( y )
Here, T represents the overall levels of economic linkage intensity and ULE. The coefficients α and β reflect the contributions of ULE and economic linkage intensity, respectively. As strengthening of the economic linkage will improve the rational allocation of land resources and optimize the spatial patterns of land, the values of coefficients α and β were set as 0.6 and 0.4, respectively.

3. Results

3.1. Spatial and Temporal Characteristics of the Urban Land Expansion (ULE) in the Yangtze River Economic Belt (YREB)

The historical changes of urban land areas in the YREB from 1990 to 2015 were calculated through land remote sensing data (△A km2), and the growth rate (GT) of urban land was determined in accordance with the corresponding prefecture-level administrative unit. Because the development of YREB has gone through several stages from budding to rapid development from 1978 to 2015, the growth of urban land areas also has periodic characteristics. In particular, the Chinese central government has proposed a series of development strategies since 2005, including the rise of the central region and the integration of the Yangtze River Delta. Therefore, we present the features of ULE in 2005. Subsequently, the change of construction land area was classified into five categories by the ArcGIS natural breakpoint method, and the cities with a growth rate of construction land area over 50% were selected to be mapped (Figure 3 and Figure 4).
The changes in the urban land area of the YREB in the last 25 years show a general trend of growth. The urban land area increased by 86% from 1990 to 2015, and the area increased from 4.24 × 10⁴ km2 in 1990 to 7.89 × 10⁴ km2 in 2015. Moreover, the changes in the urban land area show evident spatial and temporal differences. From 1990 to 2005, the cities with the fastest changes in urban land area were Suzhou, Shanghai, and Ningbo (Category I). There are 11 cities in Category II, most of which are located in the eastern Yangtze River Delta (YRD), with the exception of Chengdu and Chongqing. The Category III cities conglomerated in the eastern region, and partly in the central region. In contrast, the Category IV cities significantly increased in most of the YREB (Figure 3).
During the period between 2005 and 2015, the urban land area of all cities increased, but the number of cities in Category I decreased to only two; Shanghai and Suzhou. The Category II cities located in the eastern YREB were transformed into Category III cities. As compared with 1990–2005, the growth of the urban land area is divided by the line of “Shiyan–Enshi–Tongren–Duyun.” The cities east of the line are mainly Category III and Category IV, whereas those west of the line are mainly Category V cities, including those in northwestern Sichuan and western Yunnan (Figure 4). The spatial distribution of urban land growth is closely related to the development strategy of the YREB. Since 1990, the cities of the YRD have experienced the most rapid development, becoming leaders of the industrial belt of the Yangtze River Basin. Since 2006, development and construction in the YREB have both developed rapidly. The national strategies of “Rising of Central China” and the “Great Western Development” have intensified urban land growth.
The growth rate of urban land area in the YREB has generally accelerated, and the spatial distribution of the GT shows the shift of agglomeration dispersing to all cities (Figure 3 and Figure 4). From 1990 to 2005, the GT of the urban land area exceeded 50%, and accounted for 23% of all cities in the YREB. In particular, the GT of partly-eastern cities such as Ningbo, Suzhou, and Jinhua exceeded 100% (Table 3). However, during the period between 2005 and 2015, the GT of the urban land area of all cities in the YREB increased, and cities with more than 50% of GT accounted for 60% of the YREB. In particular, the number of cities with more than 100% increased to 31, a threefold increase over the period from 1990 to 2005. From Table 3, the GT of 20 cities exceeded 150%, especially Shaotong city, where the GT was as high as 550%. The remaining cities with GT values above 150% partly belong to the cities of Sichuan, Yunnan, and Guizhou, as well as Lushui and Chongqing. In general, the urban land of the YREB is expanding, but the expansion speed of the eastern region has slowed, and the expansion speeds of the Central and Western YREB are surging.

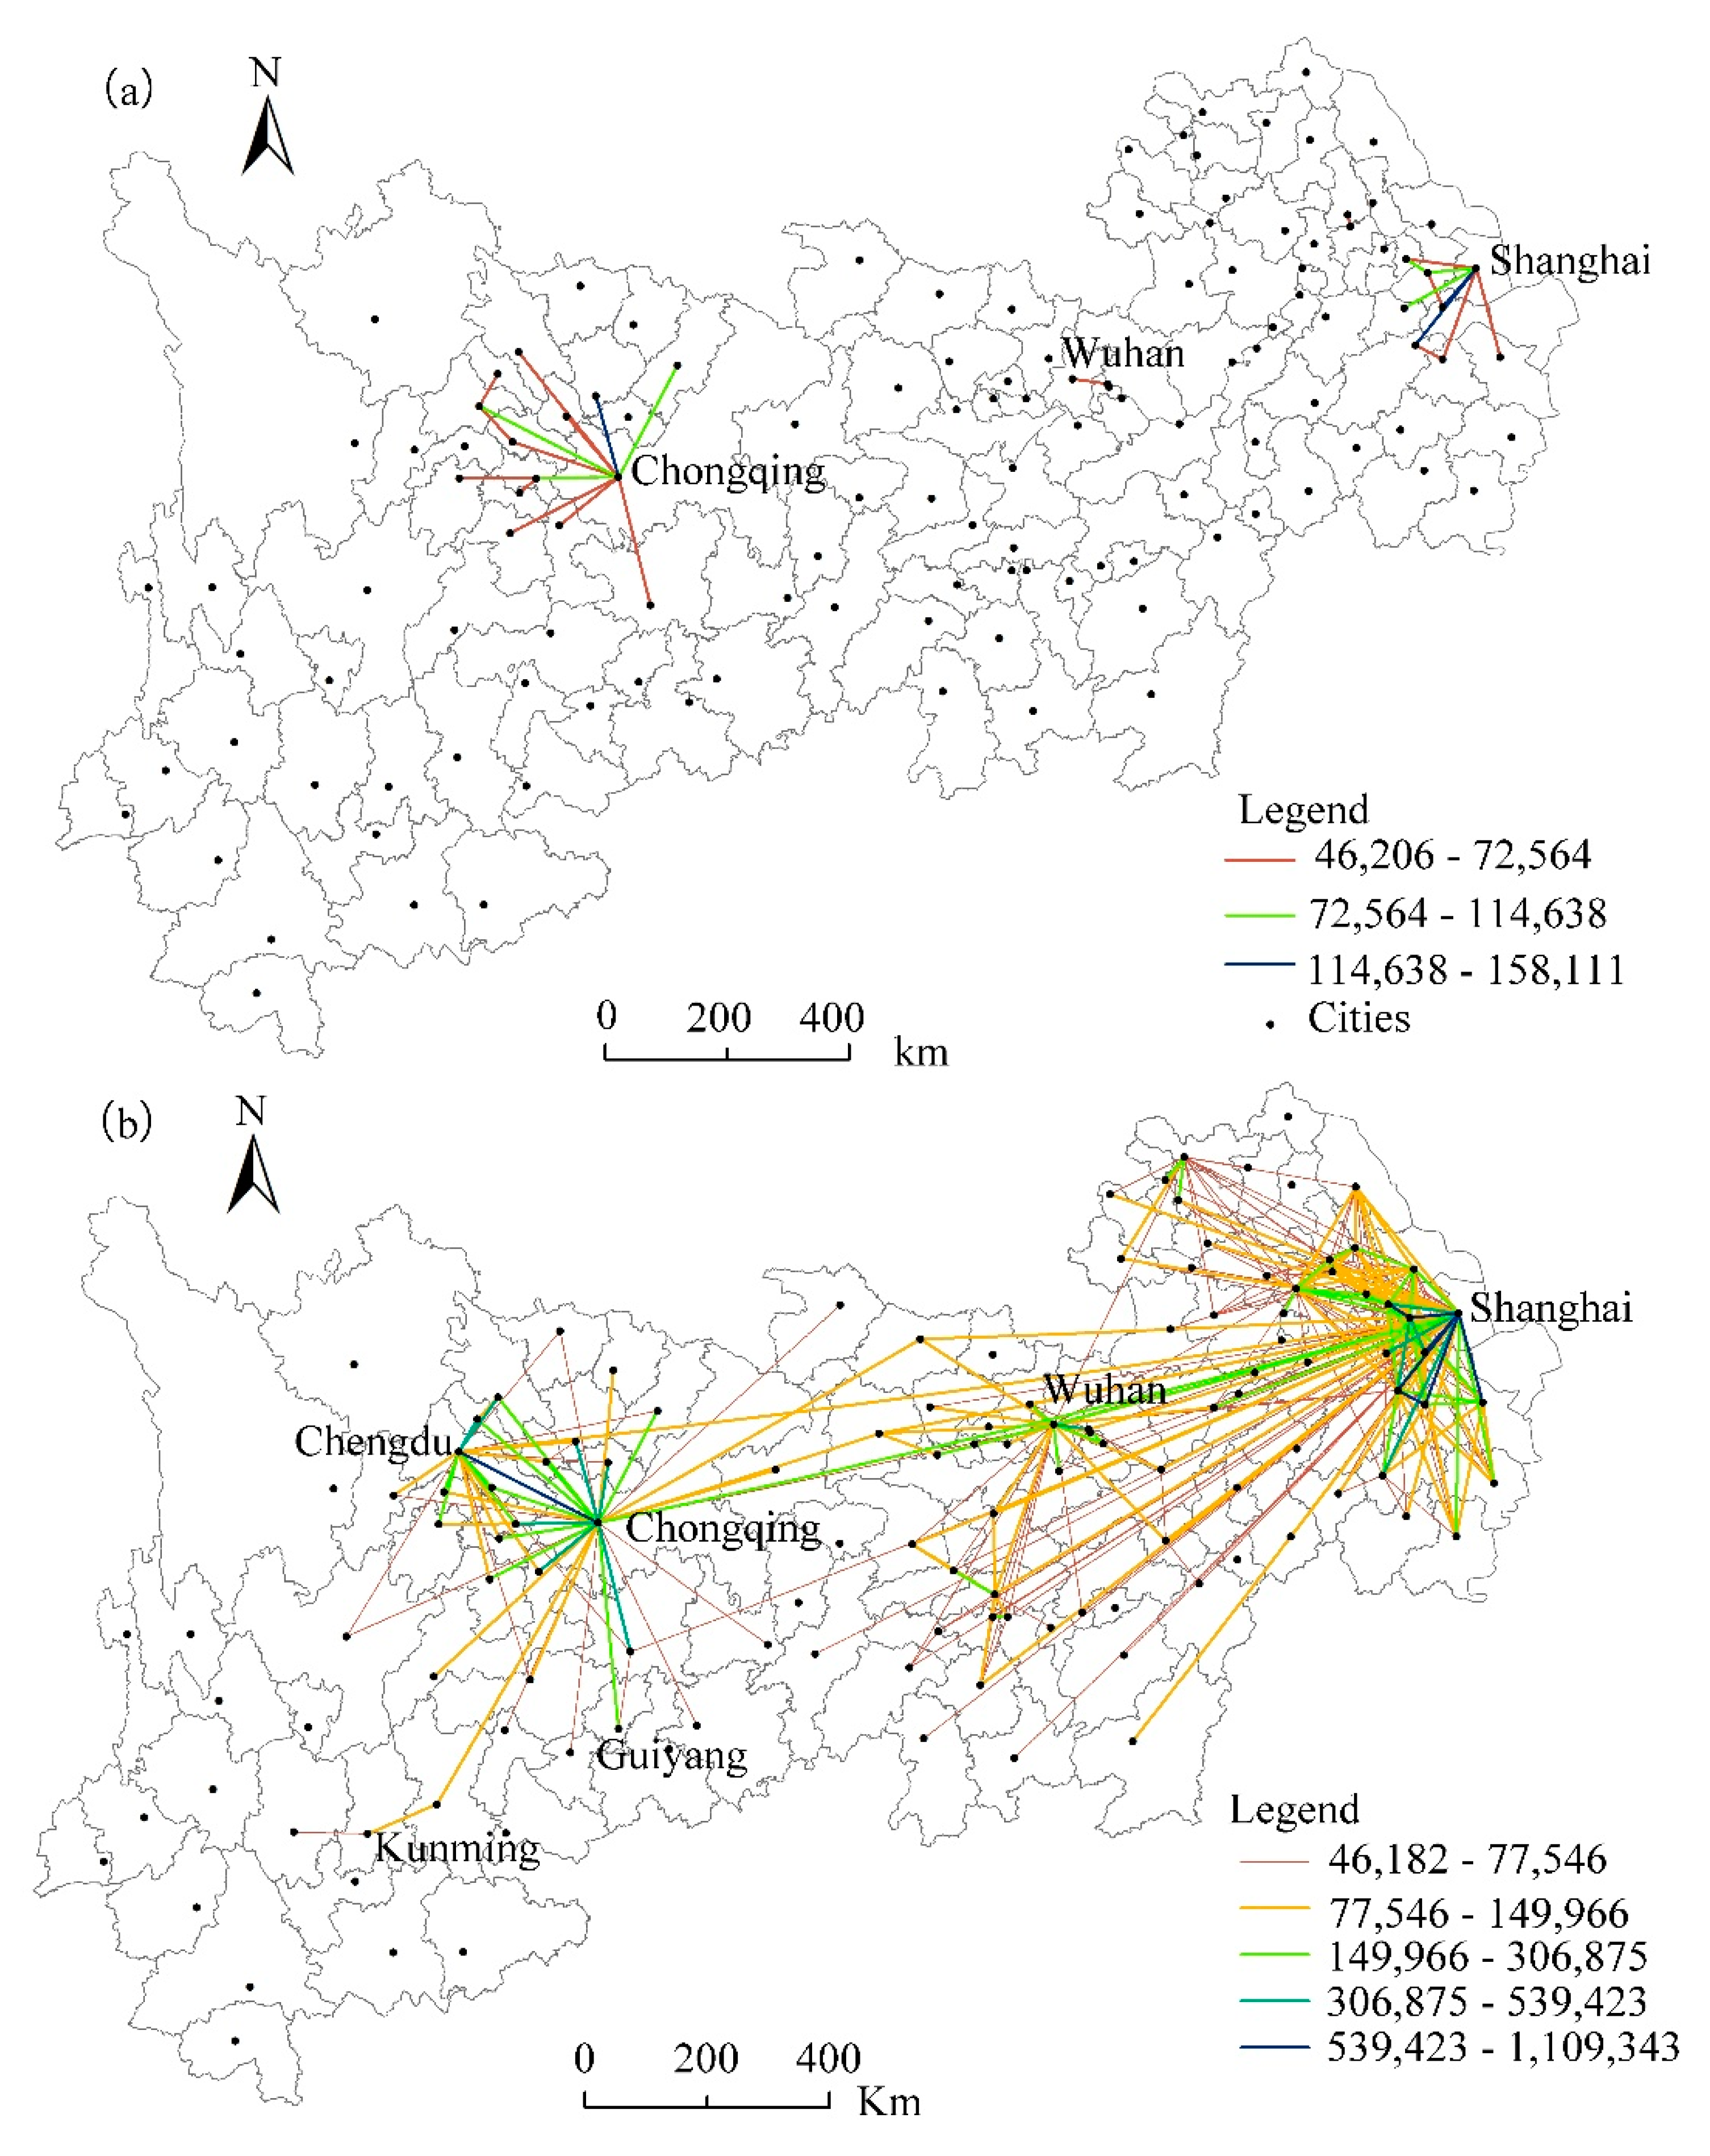
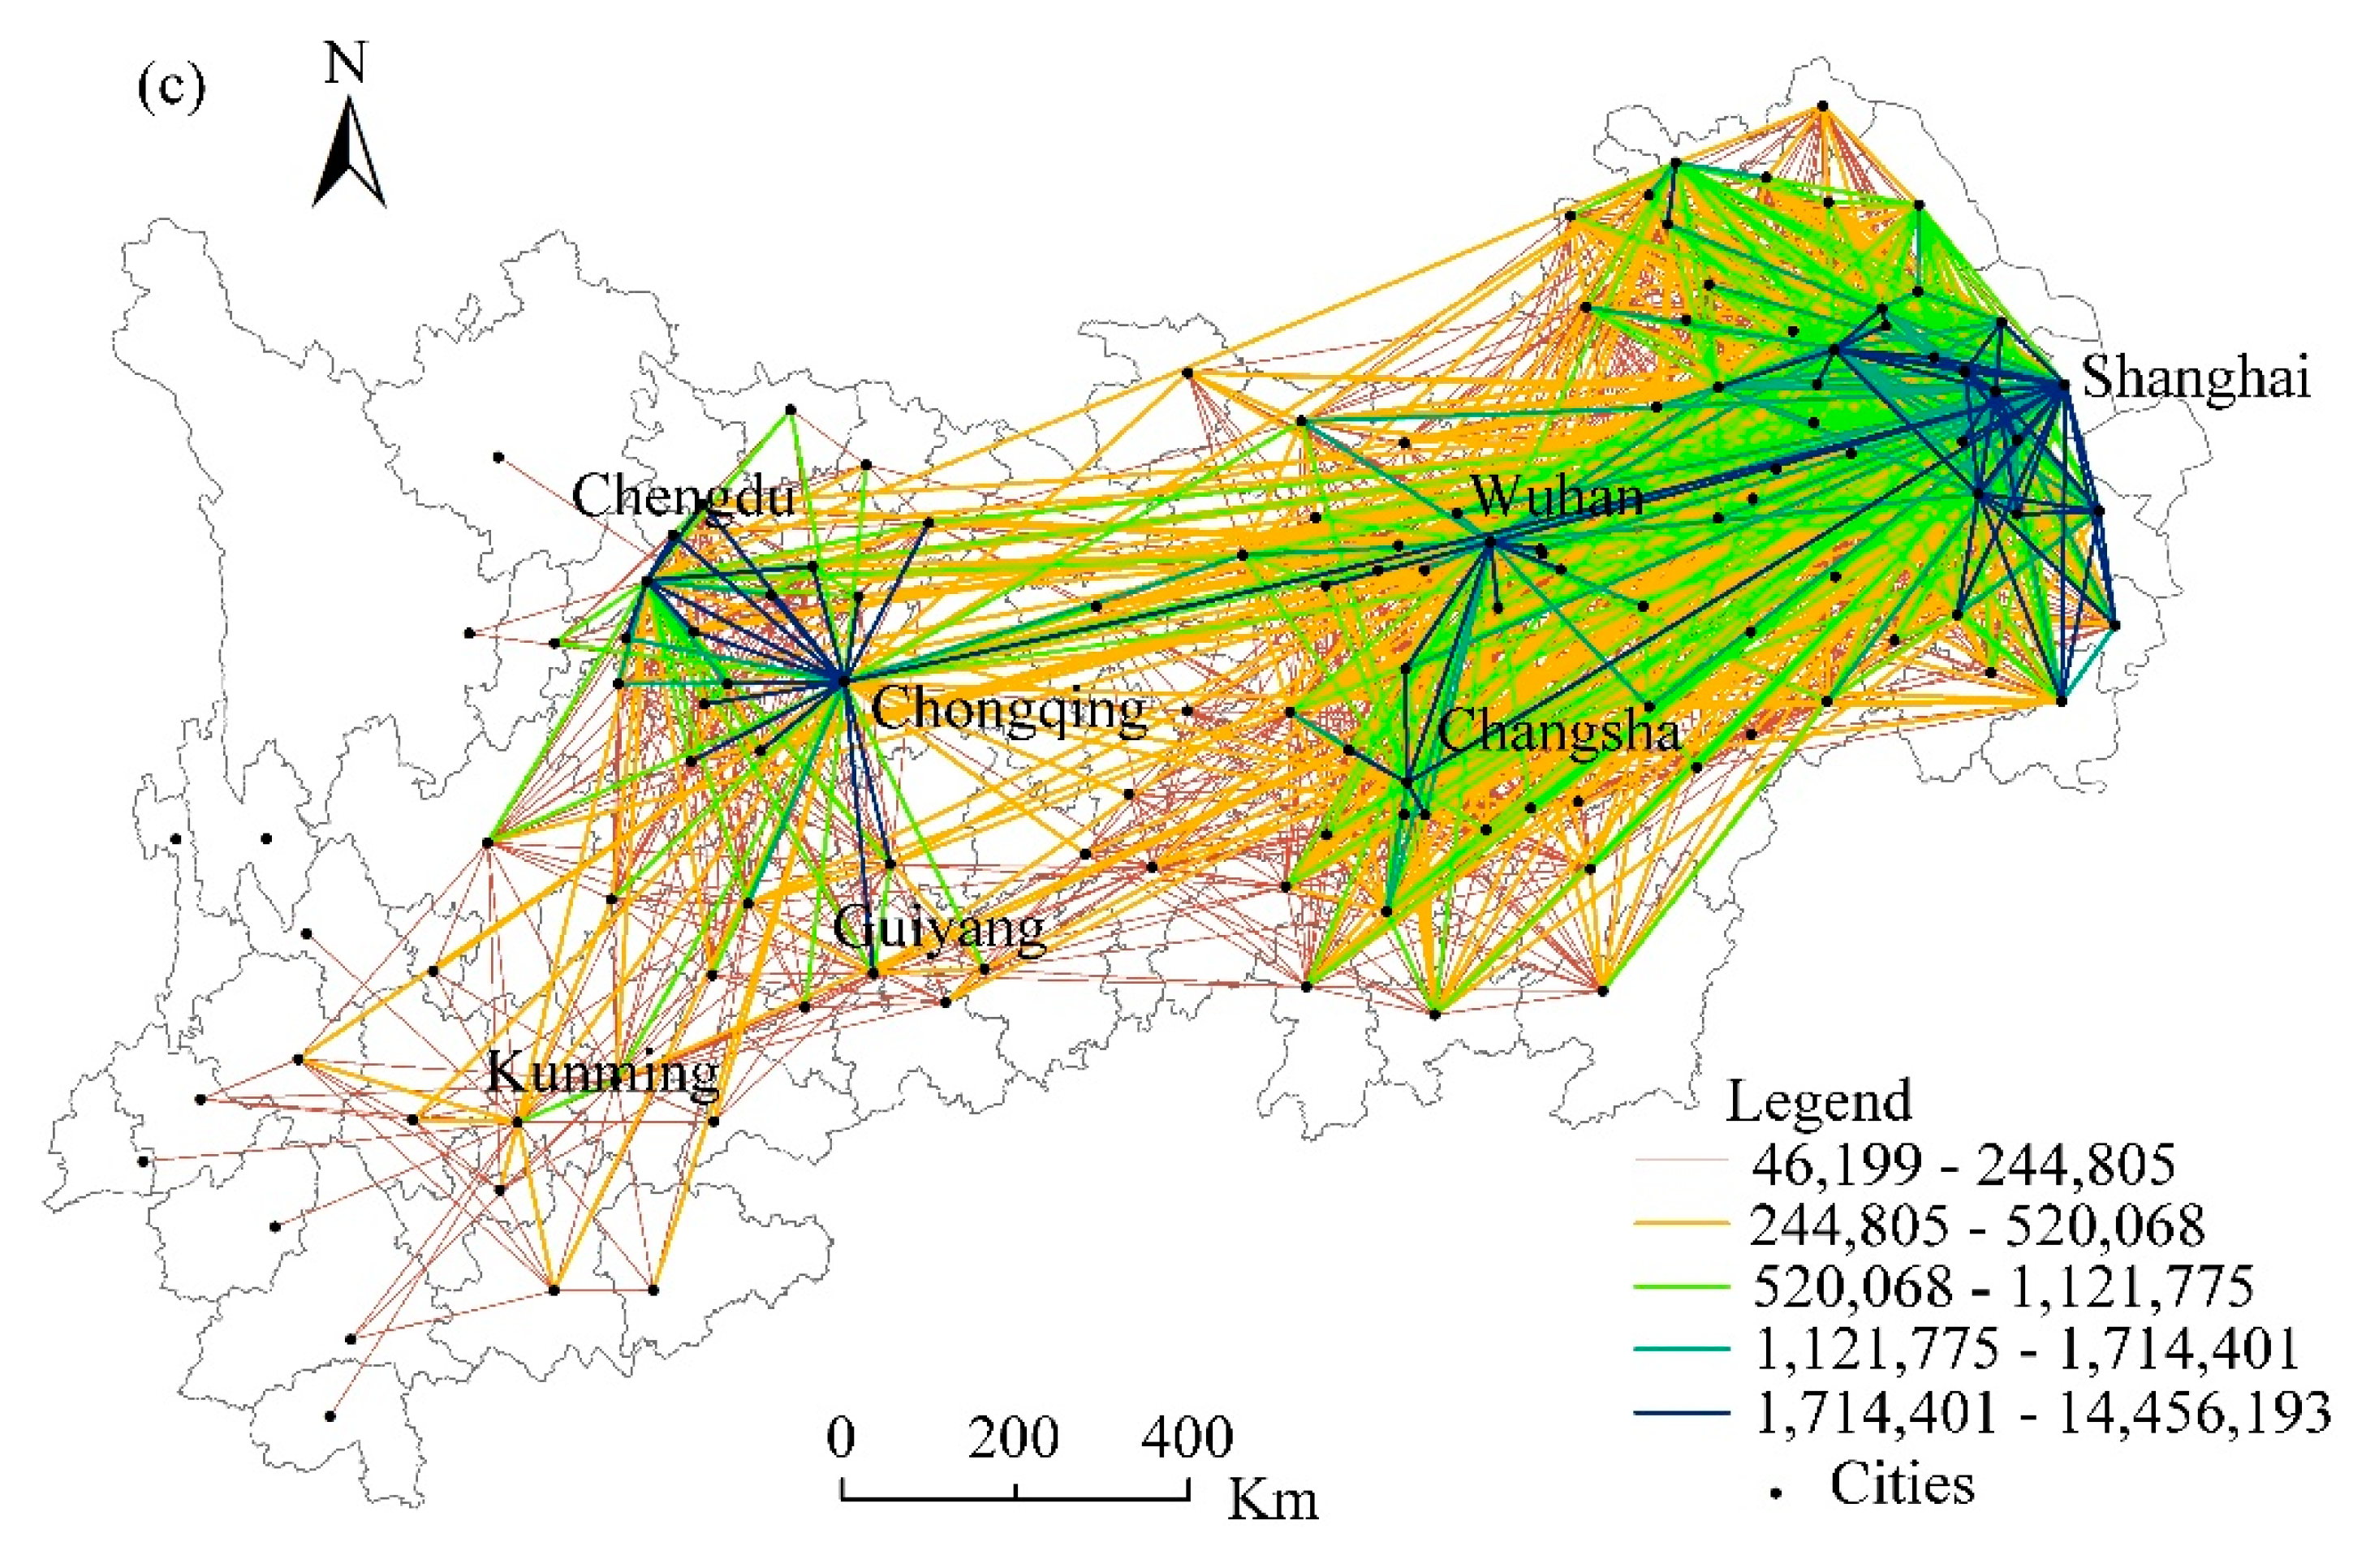
3.2. Characteristics of Economic Linkage in the YREB between 1990–2015

We calculated the economic linkage of the YREB on the basis of the gravity model by calculating the traffic accessibility for cities in the YREB in 1990, 2005, and 2015. Generally, the regional economic linkage in the YREB was significantly strengthened from 1990 to 2015. The overall economic linkage showed that the grid is becoming increasingly denser, indicating that a pattern of spatial integration of economic linkage is forming in the YREB.
The average value of the contacted strength of all nodes in the economic linkage network of the YREB was approximately 46,000 from 1990 to 2015, which was used as the minimum value, i.e., to retain effective links larger than this value, so as to analyze the overall network connection capacity of the YREB (Figure 5). In 1990, there were 26 economic linkage lines (ELLs) above the average value (46,000); 17 ELLs were between 46,000 and 72,000, 6 ELLs were between 72,000 and 114,000, and only 3 ELLs were greater than 114,000. In 2005, there were 298 ELLs over 46,000, of which 133 ELLs were between 46,000 and 77,000, 83 ELLs were between 77,000 and 149,000, 74 ELLs were between 140,000 and 500,000, and 8 ELLs were over 500,000. In 2015, there were 3817 ELLs over 46,000, and the total number of economic ties increased significantly. There were 2924 ELLs between the values of 46,000 and 240,000, 748 ELLs between the values of 240,000 and 1.12 million, and 145 ELLs over the value of 1.12 million. As compared with 1990, it was found that the total amount and frequency of economic linkage between the nodes of the YREB had significantly increased by 2015.
To investigate the network features of the economic linkage in the YREB, an SNA model was used to measure the network density and network centrality, based on the average values of economic linkage strength from 1990 to 2015 (Table 4). In 1990, the density of the economic linkage network was 0.002, and the average degree of centrality of each node was 0.418. In 2005, the network density increased to 0.035, and the average degree of centrality of the nodes increased to 5.217. In 2015, the network density was 6.318, and the average degree of centrality of the nodes increased to 51.366.
As compared with 1990, the closeness centrality of each node city is increasing, indicating that the centrality of each node city in the overall network of the YREB has improved with the increase of the economic linkage intensity in the YREB. The value of the betweenness centrality declined between 2005 and 2015, which is consistent with the results of the increasing values of other centralities. This indicates that the status of each node city as an intermediary point has changed, and that the role of the central connection in the region has been strengthened.
The economic linkage of the node cities in the YREB has gradually increased during the past 20 years, reflecting the integration trend of regional economic development in the YREB. Especially after 2005, the economic linkage has accelerated. After the national development strategy of the YREB was revived, it effectively promoted the process of economic integration in the YREB.

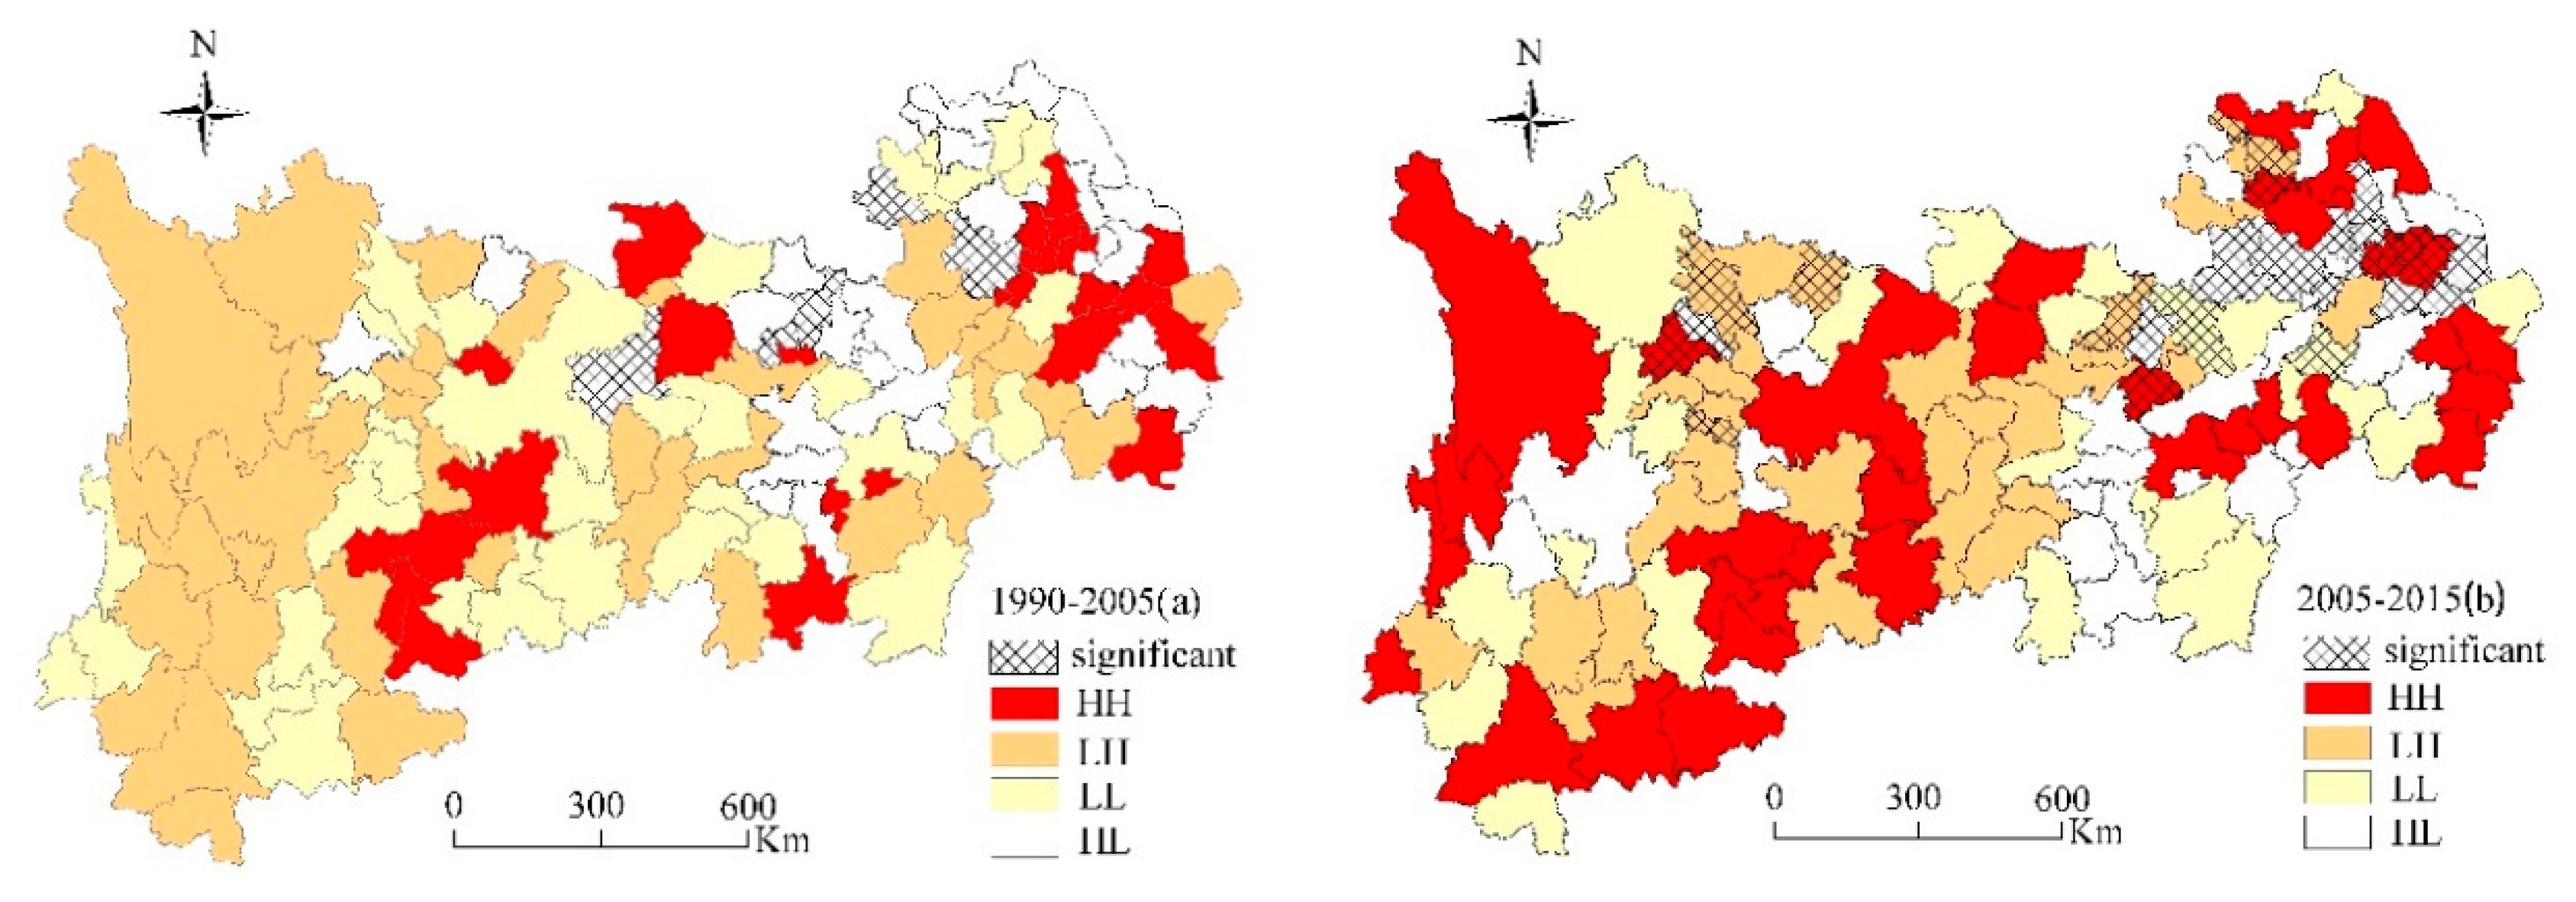
3.3. Analysis of the Bivariate Spatial Autocorrelation between ULE and the Economic Linkage in the YREB

In this section, we analyzed the spatial relationships between the ULE and economic linkage in different periods of the YREB, using the bivariate spatial autocorrelation model. The global bivariate spatial correlation analysis was established by using variables representing the average annual growth rate of urban land in two periods, and the average annual growth rate of the economic linkage strength of each prefecture-level city.
The results show that the global bivariate autocorrelation coefficients of the average annual change rate of urban land and the average annual growth rate of the economic linkage intensity were –0.058 and –0.03, respectively. Moreover, a significance test at a 1% level was passed during both periods, indicating that there existed strong negative spatial correlation characteristics between the average annual growth rate of urban land and the growth rate of economic linkage intensity (Table 5).
To visualize the local spatial correlation, we drew a bivariate LISA agglomeration map. The bivariate LISA agglomeration map illustrates the relationship between the annual average growth rate of the regional urban land and the annual growth rate of the economic linkage intensity at the neighboring locations at a certain significance level. The four quadrants show the four types of local spatial autocorrelation. Quadrant I, which is called the “high–high” (HH) type, indicates high growth of urban land values surrounded by high economic linkage intensity values, and Quadrant III “low-low”(LL) type indicates low growth of urban land values surrounded by low economic linkage intensity values. Quadrant II, i.e., the “low–high” (LH) type, shows low growth of urban land values surrounded by high economic linkage intensity values, and Quadrant IV, which is the “high–low” (HL) type, indicates high growth of urban land values surrounded by low economic linkage intensity values.
From the LISA map in Figure 6a, we found that the high-ULE and high-economic linkage intensity (HH) regions were mainly distributed in the YRD and Qianzhong urban agglomerations, but most of the cities in this region were not significant during the period between 1990 and 2005, except for Shiyan, Yichang, and Hangzhou. This indicates that intensification of economic linkage can lead to high ULE. Low-urban expansion and low-economic linkage (LL) regions were scattered and distributed throughout the entire YREB, and only a few cities were significant. The low-urban land growth and high-economic linkage intensity (LH) regions were mainly distributed near the YRD and, apart from the urban agglomeration cities, in the central YREB. This indicates that high-economic linkage intensity is beneficial to decrease urban land growth. Conversely, the high-urban land growth and low-economic linkage intensity (HL) regions were mainly concentrated in the western regions of the YREB and were not significant.
As observed from Figure 6b, in the period between 2005 and 2015, the HH regions increased and were mainly distributed in the YRD and the central and western urban agglomerations in the YREB. This indicates that the improvement of the economic linkage between eastern regions and western regions in the YREB resulted in the rapid growth of urban land. The LL regions decreased and were scattered and distributed in the entire YREB region, and most of the cities in these regions were not significant. The LH regions expanded and were mainly distributed in the Changzhou–Zhuzhou–Xiangtan urban agglomeration, the YRD, and Wuhan, as well as in a few western cities; the value in the YRD region was significant. This indicates that the improvement of economic linkage greatly decreased the ULE in the YRD. However, the HL regions were mainly distributed around the central Yunnan urban agglomeration, Central Guizhou urban agglomeration, and the Chengdu–Chongqing urban agglomeration, and only a few cities’ values were significant. This illustrates that, despite the low intensity of economic linkage in the western regions of the YREB, the ULE was rapid during the period between 2005 and 2015.
In a word, the growth of urban land in the eastern regions of YREB, for example, the YRD, has decreased with the increase of economic linkage intensity. The ULE has increased rapidly in the western cities of the YREB, where the economic linkage intensity is low. Notably, the strategy of balancing regional development in the YREB, such as in the rising central region and in the great development of the western region, has enhanced ULE, but has not evidently improved the economic linkage intensity. Improving the regional economic integration is advantageous to the intensive utilization of land.

3.4. Coupling Coordination Analysis between ULE and Economic Linkage in the YREB

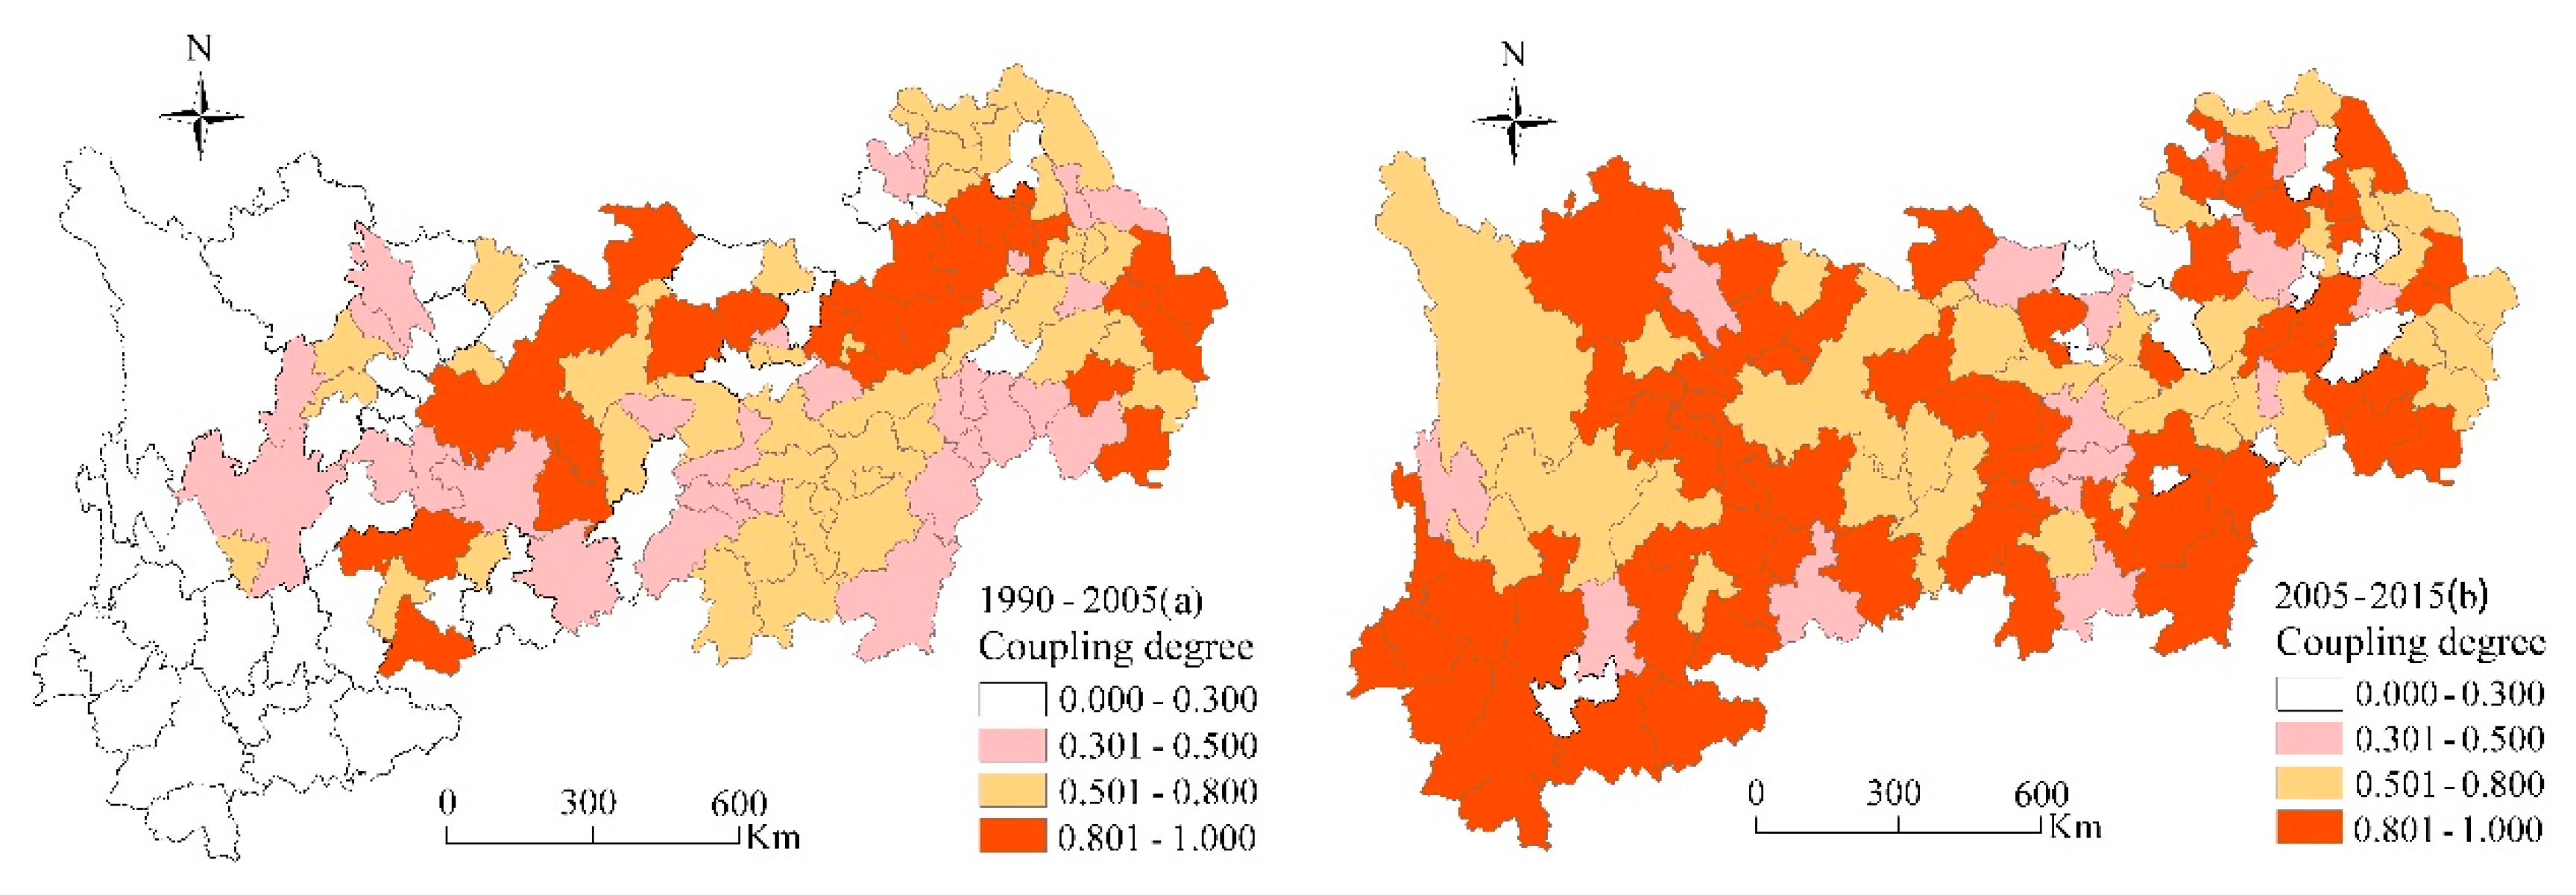
3.4.1. Analysis of Coupling Degree

Table 6 illustrates that the mean values of the decoupling degree between ULE and the economic linkage in the YREB from 1990 to 2005 and 2005 to 2015 were 0.497 and 0.713, respectively, and that the overall coupling stage changed from the antagonistic stage to the running-in stage. A number of cities where the coupling was in different stages existed during these two periods. From 1990 to 2005, there were 38 cities in the low coupling stage, accounting for 29% of the total number of cities. There were 43 and 21 cities in the running-in stage and coupling stage, respectively, accounting for 33% and 16% of the total number of cities, respectively. The cities in the antagonistic stage accounted for 22% of the total number of cities. However, more than 50% of the cities were in the running-in stage during the period between 2005 and 2015. This indicates that the relationship between ULE and economic linkage was getting closer.
Figure 7 shows the spatial patterns of the coupling degree between ULE and economic linkage during the period between 1990 and 2015. During the period between 1990 and 2005, the regions belonging to the running-in and coupling stages were mainly distributed in the eastern YREB, and only a few were located in the western YREB. The latter were especially concentrated in the middle reaches of the Yangtze River urban agglomeration and, in some cities, in the YRD. However, other regions, such as western Zhejiang, southeast Jiangxi, western Hunan, and the Chengdu–Chongqing urban agglomeration belonged to the low coupling stage or antagonistic stage. In the period between 2005 and 2015, the spatial distribution range of the running-in and coupling stages evidently expanded and were mainly distributed in the central and western YREB. In particular, the cities in the running-in and coupling stages were distributed in the Chengdu–Chongqing urban agglomeration, the central Yunnan urban agglomeration, and the central Guizhou urban agglomeration. Moreover, the spatial distribution of contiguousness was intensified. The urban spatial distribution of the stage of antagonism and separation was sharply narrowed and was scattered in the eastern YREB.
In short, the dependence between ULE and economic linkage in the YREB is increasing, especially in the central and western regions. With the development of regional economic integration in the YREB, the inter-regional economic linkage will be further strengthened, which will inevitably promote a development boom for construction land. As such, it is necessary to strengthen the control of construction land in the central and western regions.

3.4.2. Types of Coupling Coordination

Most of the cities of the YREB transferred to the coupling stage during the period between 2005 and 2015. The cities in urban agglomerations accounted for more than 50% of the total YREB and had a higher economic linkage intensity than other cities. Therefore, we further analyzed the details of the coupling and coordination types between the ULE and economic linkage at five urban agglomeration levels in the YREB (Table 7).
In the YRD urban agglomeration, the coupling and coordination degrees of half of the cities increased. The degree of coupling in Shanghai, Jiaxing, and Zhenjiang can be classified as “superiorly balanced development of ULE and economic linkage intensity (I-C)”, in accordance with the development stage classifications set out in Table 7. This indicates that the urban land has grown, and that the economic linkage intensity has also increased. However, the coupling degree can be classed as “barely balanced development with lagging economic linkage intensity (II-B)” in other cities such as Suzhou and Nanjing. This finding demonstrates that these processes were coupled, but were not coordinated. Evidently, the increase in economic linkage intensity was lagging behind the expansion of urban land in these cities. The degree of coupling of the rest of the cities in the YRD were classed as “slightly unbalanced development with hindered economic linkage intensity (III-B)” and “seriously unbalanced development with hindered economic linkage intensity (IV-B)”. The economic linkage continued to lag in comparison to that of the ULE in these cities, suggesting that governments should pay attention to improving the development of economic linkage by implementing strategies for economic integration.
In the middle reaches of urban agglomeration, the degree of coupling was classified as “slightly/seriously unbalanced development with hindered economic linkage intensity (III-B)/(IV-B)”. This indicates that the economic linkage of these cities was lagging behind the ULE. Even though a few cities have a coordinated process for ULE and economic linkage, the increase of economic linkage was also behind that of the ULE. Similarly, in the Chengdu–Chongqing urban agglomeration, the main types of degrees of coupling were “barely balanced development with lagging economic linkage intensity (II-B)” and “barely balanced development of ULE and economic linkage intensity (II-C)”. In the central Guizhou urban agglomeration and central Yunnan urban agglomeration, the type of degree of coupling was complex, and mainly presented unbalanced development with hindered economic linkage intensity.
As the largest and most important economic development belt of regional coordinated development in China, YREB’s ecological priority development strategy requires sustainability in resource development. The results of this study reveal that the YREB’s regional coordinated development is characterized by a rapid development of transport infrastructure, and various regional integration measurements found significant ULE. During the period between 2005 and 2015, the ULE and economic linkage were coupled, but not coordinated. The increases of economic linkage were lagging behind those of ULE, and the regional balanced development strategy did not optimize the allocation of territory resources. The results also indicate that the economic linkage between the urban agglomerations in the upper and middle and lower reaches of the YREB were not tight, and that the homogenization of each urban agglomeration led to the overexploitation of built-up land.

4. Discussion

Land-use changes and urban sprawl are strongly linked to urban structures and socioeconomic functions [45]. Meanwhile, urban land expansion is a key issue of urban planning and urban geography that has attracted the attention of many decision-makers, urban planners, and scholars [46]. However, previous studies have focused on these processes from the perspective of place-specific factors associated with socioeconomic, political, and cultural factors that impact decisions on the use of land. Our study considers the potential impact of the interaction that resulted from improvement of transportation accessibility between cities on the ULE in the YREB in China. Moreover, the coupling coordination analysis between ULE and economic linkage in the YREB was used in our study, which is important to guide scientific development of land-use change by the dynamic flow of factors in the process of urban–regional integrated development.

4.1. The Implications of Coupling Coordination to Sustainable Urban Land Use in the YREB

Since 1990, the YREB has experienced rapid urbanization development, especially in the YRD urban agglomeration, where urban expansion has dramatically increased. However, the economic development in the YREB represents unbalanced patterns among the urban agglomerations in the upper, middle, and lower reaches. Our study found that with the increase of transportation accessibility among cities in the YREB, the economic linkage intensity in cities of urban agglomeration in the lower reaches of the YREB was higher than that in the middle and upper reaches (Figure 5). This probably resulted in unbalanced economic development and use of land resources. To narrow this unbalanced gap, balanced regional development strategies, such as “West development” or “Raising central region”, have been implemented to promote regional integration and sustainable use of resources. These regional integration strategies will promote the rapid flow of labor, capital, knowledge, and other factors, which will have a potential impact on the use and distribution of land resources. Our results also found that the gradual increase in the speed of expansion of urban land was a response to the increase in economic linkage (Figure 3, Figure 4 and Figure 5). In the context of regional integration, the coupling model developed in this research allows for examination of the relationship between ULE and economic linkage in the YREB. Such an empirical study can provide scientific guidance for future intensive urban land use and improvement of economic linkage, so as to achieve more sustainable development.
This study contributes to the literature and suggests theoretical and policy implications. In that regard, the environmental Kuznets curve (EKC) hypothesis can be expected to identify an inverted U-shape between the processes of land-use transition and economic growth [47,48]. On this basis, a decoupling theory can be developed to explore the economic growth and expansion of construction land. Meanwhile, the niche theory was used to explain the interaction mechanism of different land-use scales and niche stages. This theory distinguishes the level of the relationship between urban expansion and economic development. However, the EKC theory, coupling theory, and niche theory only focus on the local pressure of economic growth on the expansion of urban land, neglecting the influence of potential economic linkage among cities on ULE. Because the decoupling theory and niche theory are based on the Kuznets curve, which reflects the relationship between environment and economy development, our study was not conducted to verify compliance with the EKC. We explored the potential impact of spatial spillovers in the coupling relationship between ULE and economic linkage, and investigated those cities that can reduce the growth rate of urban land due to spatial agglomeration. Moreover, Chinese urban growth is driven by the combination of urban spillover and local urban sprawl, and neighborhood land-use conditions also affect the expansion of urban land [49,50]. To address this gap, our study developed a coupling coordination degree model, which can describe how the ULE and economic linkage influence each other through various interactions. As found in our study, the dynamic coupling relationship between ULE and economic linkage has intensified in the context of regional integration and has an evident spatial autocorrelation (Figure 6).
Moreover, the indicators in this study could improve sustainable development, i.e., between urban land and economic development. Policy-makers should therefore pay great attention to improving regional integration and coordination development, which can effectively increase the possibility of increasing the speed of ULE in the long term. Maintaining a zero growth or very slow growth of built-up land under the premise of not affecting the level of economic development is challenging for government decision-makers. Land-use changes and urban land expansion have transformed Chinese cities, with a direct impact on both spatial structures and socioeconomic functions [51,52]. Thus, it is important to explore the sustainable urban form to intensify urban land use. Notably, the compact city model, new urbanism, smart growth, and transit-oriented development have been developed in cities around the world [53]. All of these models not only focus on city growth control and mixed land use, but also on urban densification [54,55,56]. However, although most Chinese cities have high population densities, the potential applicability of a sustainable and compact solution to expanding cities remains questionable. As we found in our study, different coupling type cities have different potential possibilities of spatial patterns to promote urban land intensification (Table 7). Furthermore, the policy of cross-regional built-up land quota trading is also important for controlling ULE and promoting regional coordinated development. Our study results show that cities with high economic linkage intensity have a slow growth of ULE; therefore, these cities are more conducive to establishing a built-up land quota transaction.

4.2. Uncertainties and Future Study

Although the coupling coordination degree model in our study has great potential for future studies on the environment and its relationship with human activities, limitations and uncertainties also exist. First, we only consider the influence of land traffic accessibility on the regional economic linkage intensity owing to data limitations, but water transport also plays an important role in regional economic linkage in the YREB, e.g., the path known as the “golden waterway”. This may cause our results for regional economic linkage intensity to be lower than the actual levels. Second, the dynamic interactions between ULE and economic linkage and the coupling coordination have been investigated, but the specific impact mechanisms of economic linkage on ULE have not been explored, and they will be further studied in the future.

5. Conclusions

Rapid urbanization and economic development have resulted in dramatic ULE in China, affecting sustainable land use and attracting the attention of the Chinese government. The cross-regional built-up land quota transition has become an important policy for achieving the aim of decreasing built-up land growth. Regional economic linkage has strengthened the process of intensive land use. Even though studies have examined the dynamic drivers of ULE, there is a relative lack of coupling research on the relationship between ULE and economic linkage. This study analyzed the degree of coupling coordination between ULE and economic linkage in the YREB, within an actual case study. The key findings are as follows.
First, there was a continuous increasing trend of built-up land and economic linkage in the YREB from 1990 to 2015. The area of built-up land increased by 86% between 1990 and 2015. In terms of spatial distribution, the growth of the built-up land area in the YREB shows dynamic features, and the spatial distribution of the high-growth areas moved from the east to the central and western regions. At the same time, the network of the economic linkage intensity became increasingly dense. In 2015, the network density was six times that of 1990. Moreover, the economic linkage intensity in the central and eastern regions was higher than that in the western regions. This result indicates that the ULE is related to the improvement of economic linkage in the YREB from 1990 to 2015, but the dynamic trend of the spatial distribution is different.
Second, the growth of urban land area is negatively correlated with the increase of economic linkage intensity, and the spatial heterogeneity is prominent. Some cities in the central and western regions have formed a pattern of high growth of construction land and high strength of economic linkage. Even though the number regions showing low growth of urban land and high strength of economic linkage compared to that of regions showing high growth of urban land and low strength of economic linkage regions remained basically unchanged, the significance of the LH regions increased. For example, parts of cities in the YRD formed spatial patterns of low growth of urban land and high increase of economic linkage intensity. These findings suggest that it is necessary to improve the economic linkage among cities in the YREB and to enforce intensive utility measures for urban land development to promote sustainable urbanization and thereby develop a green economy.
Third, the coupling degree between ULE and economic linkage intensity began to strengthen over time, and the coupling degree values were not high. Moreover, the speed of ULE was faster than that of the increase of economic linkage. During the period between 1990 and 2015, the cities with the coupling type of low coupling and antagonistic stages decreased, whereas most cities were in the running-in and coupling stages. This indicates that there was a high dependence between ULE and the increase of economic linkage in the YREB. From 2005 to 2015, the cities with the running-in and coupling stages were concentrated in the Chengdu–Chongqing urban agglomeration, the central Yunnan urban agglomeration, and the central Guizhou urban agglomeration. However, the spatial range of cities with the low coupling stage or antagonistic stage sharply shrank and was scattered in the eastern region of the YREB. This result reveals that the ULE in the western region has intensified with the improvement of economic linkage between the eastern region and the western and middle regions. These findings suggest that regional integration and regional cooperation can strengthen the spillover effects of some elements, such as technology and innovation, to improve the efficiency of urban land use. At the same time, an interregional trading mechanism of urban land quotas should be established to reduce urban land resource development and to optimize the allocation of regional land resources.

Author Contributions

Conceptualization, C.W. and X.H.; Data curation, B.C. And C.W.; Investigation, B.C.; Methodology, B.C.; Formal analysis, C.W.; Funding acquisition, C.W.; Project administration, X.H., and X.Y.; Supervision, X.H.; Writing – original draft, B.C.; Writing – review & editing, X.Y. All authors have read and agreed to the published version of the manuscript.

Funding

This study was funded by the Ministry of Education, Humanities, and Social Science Fund of China (19YJCZH186), and the National Natural Science Foundation of China (41901210), and the Natural Science Foundation of Zhejiang province (LQ18D010006), and the National General Cultivation Foundation of Zhejiang Gongshang University (XJP-28), and the General Foundation of National Social Science (19BSH057).

Acknowledgments

Many thanks for the valuable comments from reviewers.

Conflicts of Interest

The authors declare no conflict of interest.

References

  1. Nguyen, L.H.; Nghiem, S.V.; Henebry, G.M. Expansion of major urban areas in the US Great Plains from 2000 to 2009 using satellite scatterometer data. Remote Sens. Environ. 2018, 204, 524–533. [Google Scholar] [CrossRef]
  2. Irwin, E.G.; Bockstael, N.E. The evolution of urban sprawl: Evidence of spatial heterogeneity and increasing land fragmentation. Proc. Natl. Acad. Sci. USA 2007, 104, 20672–20677. [Google Scholar] [CrossRef] [PubMed] [Green Version]
  3. Seto, K.C.; Golden, J.S.; Alberti, M.; Turner, B.L. Sustainability in an urbanizing planet. Proc. Natl. Acad. Sci. USA 2017, 114, 8935–8938. [Google Scholar] [CrossRef] [PubMed] [Green Version]
  4. Chuai, X.; Huang, X.; Lu, Q.; Zhang, M.; Zhao, R.; Lu, J. Spatiotemporal Changes of Built-Up Land Expansion and Carbon Emissions Caused by the Chinese Construction Industry. Environ. Sci. Technol. 2015, 49, 13021–13030. [Google Scholar] [CrossRef]
  5. Yang, Y.; Liu, Y.; Li, Y.; Du, G. Quantifying spatio-temporal patterns of urban expansion in Beijing during 1985–2013 with rural-urban development transformation. Land Use Policy 2018, 74, 220–230. [Google Scholar] [CrossRef]
  6. Long, H.; Ge, D.; Zhang, Y.; Tu, S.; Qu, Y.; Ma, L. Changing man-land interrelations in China’s farming area under urbanization and its implications for food security. J. Environ. Manag. 2018, 209, 440–451. [Google Scholar] [CrossRef]
  7. Zhou, Y.; Guo, L.; Liu, Y. Land consolidation boosting poverty alleviation in China: Theory Practice. Land Use Policy. 2019, 82, 339–348. [Google Scholar] [CrossRef]
  8. Liu, Y.; Song, W.; Deng, X. Understanding the spatiotemporal variation of urban land expansion in oasis cities by integrating remote sensing and multi-dimensional DPSIR-based indicators. Ecol. Indic. 2019, 96, 23–37. [Google Scholar] [CrossRef]
  9. Long, Y.; Zhai, W.; Shen, Y.; Ye, X. Understanding uneven urban expansion with natural cities using open data. Landsc. Urban Plan. 2018, 177, 281–293. [Google Scholar] [CrossRef] [Green Version]
  10. Xu, Q.; Zheng, X.; Zhang, C. Quantitative Analysis of the Determinants Influencing Urban Expansion: A Case Study in Beijing, China. Sustainability 2018, 10, 1630. [Google Scholar] [CrossRef] [Green Version]
  11. Yue, W.; Fan, P.; Wei, Y.D.; Qi, J. Economic development, urban expansion, and sustainable development in Shanghai. Stoch. Environ. Res. Risk Assess. 2012, 28, 783–799. [Google Scholar] [CrossRef]
  12. Wu, Y.; Dong, S.; Huang, H.; Zhai, J.; Li, Y.; Huang, D. Quantifying urban land expansion dynamics through improved land management institution model: Application in Ningxia-Inner Mongolia, China. Land Use Policy 2018, 78, 386–396. [Google Scholar] [CrossRef]
  13. Liu, Y.; Fan, P.; Yue, W.; Song, Y. Impacts of land finance on urban sprawl in China: The case of Chongqing. Land Use Policy 2018, 72, 420–432. [Google Scholar] [CrossRef]
  14. Shu, C.; Xie, H.; Jiang, J.; Chen, Q. Is Urban Land Development Driven by Economic Development or Fiscal Revenue Stimuli in China? Land Use Policy 2018, 77, 107–115. [Google Scholar] [CrossRef]
  15. Li, H.; Wei, Y.D.; Zhou, Y. Spatiotemporal analysis of land development in transitional China. Habitat Int. 2017, 67, 79–95. [Google Scholar] [CrossRef]
  16. Wu, K.; Zhang, H. Land use dynamics, built-up land expansion patterns, and driving forces analysis of the fast-growing Hangzhou metropolitan area, eastern China (1978–2008). Appl. Geogr. 2012, 34, 137–145. [Google Scholar] [CrossRef]
  17. He, C.; Zhang, D.; Huang, Q.; Zhao, Y. Assessing the potential impacts of urban expansion on regional carbon storage by linking the LUSD-urban and InVEST models. Environ. Model. Softw. 2016, 75, 44–58. [Google Scholar] [CrossRef]
  18. Mustafa, A.; Heppenstall, A.; Omrani, H.; Saadi, I.; Cools, M.; Teller, J. Modelling built-up expansion and densification with multinomial logistic regression, cellular automata and genetic algorithm. Comput. Environ. Urban Syst. 2018, 67, 147–156. [Google Scholar] [CrossRef] [Green Version]
  19. Vermeiren, K.; Vanmaercke, M.; Beckers, J.; Van Rompaey, A. ASSURE: A model for the simulation of urban expansion and intra-urban social segregation. Int. J. Geogr. Inf. Sci. 2016, 30, 2377–2400. [Google Scholar] [CrossRef]
  20. Zhao, X.; Zhang, M.; Li, Y.; Huang, X.; Wang, B.; Zhang, L. Urban residential land expansion and agglomeration in China: a spatial analysis approach. Environ. Dev. Sustain. 2019, 87, 1–19. [Google Scholar] [CrossRef]
  21. Jiao, L.; Liu, J.; Xu, G.; Dong, T.; Gu, Y.; Zhang, B.; Liu, Y.; Liu, X. Proximity Expansion Index: An improved approach to characterize evolution process of urban expansion. Comput. Environ. Urban Syst. 2018, 70, 102–112. [Google Scholar] [CrossRef]
  22. Zhong, T.Y.; Huang, X.J.; Wang, B.Y. On the degrees of decoupling and re-coupling of economic growth and expansion of construction land in China from 2002 to 2007. J. Nat. Resour. 2010, 25, 18–31. [Google Scholar]
  23. Braimoh, A.K.; Onishi, T. Spatial determinants of urban land use change in Lagos, Nigeria. Land Use Policy 2007, 24, 502–515. [Google Scholar] [CrossRef]
  24. Guo, R.; Qian, H.; Zhang, L.; Li, M. Development in the different niche of urban: A case study of Guangdong province. J. Nat. Resour. 2016, 31, 800–811. [Google Scholar]
  25. Sheng, Y.; Liu, Q.; Ou, M.; Er, L. The Kuznets curve relationship between urban land expansion and economic development across 13 municipalities in Jiangsu. Resour. Sci. 2014, 36, 296–302. [Google Scholar]
  26. Luo, Q.; Luo, L.; Zhou, Q.; Song, Y.; Luo, Y. Does China’s Yangtze River Economic Belt policy impact on local ecosystem services? Sci. Total Environ. 2019, 676, 231–241. [Google Scholar] [CrossRef]
  27. Xu, X.; Yang, G.; Tan, Y.; Liu, J.; Hu, H.; Liu, J. Ecosystem services trade-offs and determinants in China’s Yangtze River Economic Belt from 2000 to 2015. Sci. Total Environ. 2018, 634, 1601–1614. [Google Scholar] [CrossRef]
  28. Cheng, X.; Shao, H.; Li, Y.; Shen, C.; Liang, P. Urban Land Intensive Use Evaluation Study Based on Nighttime Light—A Case Study of the Yangtze River Economic Belt. Sustainability 2019, 11, 675. [Google Scholar] [CrossRef] [Green Version]
  29. Gao, J.; Wei, Y.D.; Chen, W.; Chen, J. Economic transition and urban land expansion in Provincial China. Habitat Int. 2014, 44, 461–473. [Google Scholar] [CrossRef]
  30. Morris, S.; Jain, P. Determinants of OFDI: An Empirical Analysis of OECD Source Countries using Gravity model. Indian Econ. Rev. 2015, 50, 243–271. [Google Scholar]
  31. Persyn, D.; Torfs, W. A gravity equation for commuting with an application to estimating regional border effects in Belgium. J. Econ. Geogr. 2015, 16, 155–175. [Google Scholar] [CrossRef] [Green Version]
  32. Alonso, M.P.; Beamonte, M.A.; Gargallo, P.; Salvador, M.J. Labour and residential accessibility: a Bayesian analysis based on Poisson gravity models with spatial effects. J. Geogr. Syst. 2014, 16, 409–439. [Google Scholar] [CrossRef]
  33. Chen, Y. The diatance-decay function of geographical gravity model: power law or exponential law? Chaosolitons Fractals 2015, 77, 174–189. [Google Scholar] [CrossRef] [Green Version]
  34. Yin, J.; Soliman, A.; Yin, D.; Wang, S. Depicting urban boundaries from a mobility network of spatial interactions: a case study of Great Britain woth geo-located twitter data. Int. J. Geogr. Inf. Sci. 2017, 31, 1293–1313. [Google Scholar] [CrossRef] [Green Version]
  35. Ye, X.; Wu, L. Analyzing the dynamics of homicide patterns in Chicago: ESDA and spatial panel approaches. Appl. Geogr. 2011, 31, 800–807. [Google Scholar] [CrossRef]
  36. Rybarczyk, G.; Wu, C. Bicycle facility planning using GIS and multi-criteria decision analysis. Appl. Geogr. 2010, 30, 282–293. [Google Scholar] [CrossRef]
  37. Wu, C.; Wei, Y.D.; Huang, X.; Chen, B. Economic transition, spatial development and urban land use efficiency in the Yangtze River Delta, China. Habitat Int. 2017, 63, 67–78. [Google Scholar] [CrossRef]
  38. Monaghan, S.; Lavelle, J.; Gunnigle, P. Mapping networks: Exploring the utility of social network analysis in management research and practice. J. Bus. Res. 2017, 76, 136–144. [Google Scholar] [CrossRef]
  39. Leon, R.D.; Rodríguez-Rodríguez, R.; Gómez-Gasquet, P.; Mula, J. Social network analysis: A tool for evaluating and predicting future knowledge flows from an insurance organization. Technol. Forecast. Soc. Chang. 2017, 114, 103–118. [Google Scholar] [CrossRef]
  40. Zheng, X.; Le, Y.; Chan, A.P.; Hu, Y.; Li, Y. Review of the application of social network analysis (SNA) in construction project management research. Int. J. Proj. Manag. 2016, 34, 1214–1225. [Google Scholar] [CrossRef]
  41. Moran, P.A.P. The Interpretation of Statistical Maps. J. R. Stat. Soc. Ser. B (Methodol.) 1948, 10, 243–251. [Google Scholar] [CrossRef]
  42. Sun, Y.; Cui, Y. Evaluating the coordinated development of economic, social and environmental benefits of urban public transportation infrastructure: Case study of four Chinese autonomous municipalities. Transp. Policy 2018, 66, 116–126. [Google Scholar] [CrossRef]
  43. Wang, R.; Cheng, J.; Zhu, Y.; Lu, P. Evaluation on the coupling coordination of resources and environment carrying capacity in Chinese mining economic zones. Resour. Policy 2017, 53, 20–25. [Google Scholar] [CrossRef]
  44. He, J.; Wang, S.; Liu, Y.; Ma, H.; Liu, Q. Examining the relationship between urbanization and the eco-environment using a coupling analysis: case study of Shanghai, China. Ecol. Indic. 2017, 77, 185–193. [Google Scholar] [CrossRef]
  45. Salvati, L.; Zambon, I.; Chelli, F.M.; Serra, P. Do spatial patterns of urbanization and land consumption reflect different socioeconomic contexts in Europe? Sci. Total Environ. 2018, 625, 722–730. [Google Scholar] [CrossRef]
  46. Zheng, Q.; Wang, K.; Huang, L.; Zheng, Q.; Abubakar, G.A. Monitoring the Different Types of Urban Construction Land Expansion (UCLE) in China’s Port City: A Case Study of Ningbo’s Central City. Sustainability 2017, 9, 2374. [Google Scholar] [CrossRef] [Green Version]
  47. Barbier, E.B.; Burgess, J.C.; Grainger, A. The forest transition: Towards a more comprehensive theoretical framework. Land Use Policy 2010, 27, 98–107. [Google Scholar] [CrossRef]
  48. Li, Y.; Chen, C.; Wang, Y.; Liu, Y. Urban-rural transformation and farmland conversion in China: The application of the environmental Kuznets Curve. J. Rural. Stud. 2014, 36, 311–317. [Google Scholar] [CrossRef]
  49. Yaping, W.; Min, Z. Urban spill over vs. local urban sprawl: Entangling land-use regulations in the urban growth of China’s megacities. Land Use Policy 2009, 26, 1031–1045. [Google Scholar] [CrossRef]
  50. Luo, J.; Wei, Y.D. Modeling spatial variations of urban growth patterns in Chinese cities: The case of Nanjing. Landsc. Urban Plan. 2009, 91, 51–64. [Google Scholar] [CrossRef]
  51. Lan, F.; Da, H.; Wen, H.; Wang, Y. Spatial Structure Evolution of Urban Agglomerations and Its Driving Factors in Mainland China: From the Monocentric to the Polycentric Dimension. Sustainability 2019, 11, 610. [Google Scholar] [CrossRef] [Green Version]
  52. Li, H.; Peng, J.; Yanxu, L.; Yi’Na, H. Urbanization impact on landscape patterns in Beijing City, China: A spatial heterogeneity perspective. Ecol. Indic. 2017, 82, 50–60. [Google Scholar] [CrossRef]
  53. Chiu, R.H. Urban sustainability and the urban forms of China’s leading Mega cities: Beijing, Shanghai, and Guangzhou. Urban. Policy Res. 2015, 30, 359–383. [Google Scholar] [CrossRef]
  54. Artmann, M.; Inostroza, L.; Fan, P. Urban sprawl, compact urban development and green cities. How much do we know, how much do we agree? Ecol. Indic. 2019, 96, 3–9. [Google Scholar] [CrossRef]
  55. Chen, H.; Jia, B.; Lau, S. Sustainable urban form for Chinese compact cities: Challenges of a rapid urbanized economy. Habitat Int. 2008, 32, 28–40. [Google Scholar] [CrossRef]
  56. Hedblom, M.; Andersson, E.; Borgström, S. Flexible land-use and undefined governance: From threats to potentials in peri-urban landscape planning. Land Use Policy 2017, 63, 523–527. [Google Scholar] [CrossRef]
Figure 1. Location of Yangtze River Economic Belt (YREB).
Sustainability 12 01227 g001
Figure 2. Flow chart of methods.
Sustainability 12 01227 g002
Figure 3. Change of Urban Construction Land Area and Spatial Distribution of Its Growth Rate in the YREB from 1990 to 2005.
Sustainability 12 01227 g003
Figure 4. Change of Urban Land Area and Spatial Distribution of Its Growth Rate in the YREB from 2005 to 2015.
Sustainability 12 01227 g004
Figure 5. The results of strength of economic linkage in YREB from 1990 to 2015. (a), (b) and (c) show the results of the economic linkage intensity in 1990, 2005, and 2015, respectively. The different colored lines represent different values of the economic linkage intensity.
Sustainability 12 01227 g005aSustainability 12 01227 g005b
Figure 6. The Local Indicators of Spatial Association (LISA) Clustering map of Growth Rates of Urban Land Use and Economic linkage intensity. HH, high–high; LH, low–high; LL, low–low; HL, high–low.
Sustainability 12 01227 g006
Figure 7. The spatial pattern of the coupling degree between the ULE and economic linkage.
Sustainability 12 01227 g007
Table 1. Comprehensive index for economic mass of each cities.
IndexCalculationAbbreviation (Code)
Gross domestic production--GDP (X1)
Per capita gross domestic productionGDP/total populationGDPpc (X2)
Total population--POP (X3)
Rate of secondary industryOutput value of secondary industry/GDP(X4)
Rate of tertiary industryOutput value of tertiary industry(X5)
Per capita fixed asset investmentFixed asset investment/GDPFAI (X6)
Per capita fiscal revenueFiscal revenue/GDPFR (X7)
Total retail sales of social consumer goods--RSSCG (X8)
Proportion of non-agricultural populationNon-agricultural population/POPNAP (X9)
Total population of employees--EP (X10)
Per capita disposable income of urban residents--DIUR (X11)
Table 2. Comprehensive index of the development stage of coupling between ULE and economic linkage.
Primary Classes Secondary ClassesTypes
Balanced development
(acceptable interval)
0.7 < R < 1.0
(I)
Superior balanced developmentG(y)–L(x) > 0.1
(I-A)
Superiorly balanced development with lagging urban land expansion
L(x)–G(y) > 0.1
(I-B)
Superiorly balanced development with lagging economic linkage intensity
0 < L(x)–G(y) < 0.1
(I-C)
Superiorly balanced development of urban land expansion and economic linkage intensity
Transitional development
(transitional interval)
0.5 < R < 0.7
(II)
Barely balanced developmentG(y)–L(x) > 0.1
(II-A)
Barely balanced development with lagging urban land expansion
L(x)–G(y) > 0.1
(II-B)
Barely balanced development with lagging economic linkage intensity
0< L(x)–G(y) < 0.1
(II-C)
Barely balanced development of urban land expansion and economic linkage
Unbalanced development
(unacceptable interval)
0.3 < R < 0.5
(III)
Slightly unbalanced developmentG(y)–L(x) > 0.1
(III-A)
Slightly unbalanced development with hindered urban land expansion
L(x)–G(y) > 0.1
(III-B)
Slightly unbalanced development with hindered economic linkage intensity
0 < L(x)–G(y) < 0.1
(III-C)
Slightly unbalanced development of urban land expansion and economic linkage intensity
0 < R < 0.3
(IV)
Seriously unbalanced developmentG(y)–L(x) > 0.1
(IV-A)
Seriously unbalanced development with hindered urban land expansion
L(x)–G(y) > 0.1
(IV-B)
Seriously unbalanced development with hindered economic linkage intensity
0 < L(x)–G(y) < 0.1
(IV-C)
Seriously unbalanced development of urban land expansion and economic linkage intensity
Table 3. The Growth Rate of Construction land in the YREB from 1990 to 2005 (Unit: %).
1990–20052005–2015
Prefecture-Level CityGTPrefecture-Level CityGTPrefecture-Level CityGT
Ningbo 161.32Shaotong595.07Enshi232.06
Suzhou 149.94Shennongjia Forestry District543.66Suizhou223.60
Jinhua147.10Bijie446.32Xianggelila197.84
Quzhou141.53Xingyi365.14Anshun192.17
Taizhou137.49Shiyan318.37Chongqing185.07
Shaoxing116.86 Lushui 301.37Liupanshui179.34
Wuxi114.16Tongren285.75Lishui166.95
Suining113.63Wenshan285.47Guangan153.92
Lishui102.53Duyun244.79Maerkang153.57
Wenzhou100.74Zunyi237.76Kaili150.28
Table 4. The analysis of the central characteristics of economic linkage networks in the YREB.
Network DensityDegree CentralityCloseness CentralityBetweenness Centrality
19900.0020.4180.8570.019
20050.0355.2174.1770.621
20156.31851.36629.0380.361
Table 5. The results of bivariate global autocorrelation coefficients between ULE and economic linkage intensity in different periods.
PeriodLand CategoryMoran’s Ip-ValueZ-Value Standard Deviation
1990–2005Urban land−0.0580.018–2.1380.027
2005–2015Urban land–0.030.151–1.0350.029
Table 6. The coupling degree between ULE and the economic linkage.
PeriodsMean Value of Coupling DegreeLow CouplingAntagonistic StageRunning-in StageCoupling Stage
1990–20050.49738 (29%)28 (22%)43 (33%)21 (16%)
2005–20150.71315 (12%)16 (12%)31 (24%)68 (52%)
Table 7. Coupling and coordination types between ULE and economic linkage during the period between 2005 and 2015.
YRD Urban AgglomerationRCoupling Coordination LevelMiddle Reaches Urban AgglomerationRCoupling Coordination Level
Shanghai0.77(I-C)Changde0.71(I-C)
Jiaxing0.75(I-C)Yichun0.75(I-C)
Zhenjiang0.77(I-C)Xianning0.57(II-B)
Suzhou0.53(II-B)Zhuzhou0.69(II-B)
Nanjing0.50(II-B)Hengyang0.62(II-B)
Ningbo0.52(II-B)Fuzhou0.60(II-B)
Yangzhou0.63(II-B)Yichang0.55(II-B)
Nantong0.52(II-B)Shangrao0.61(II-B)
Taizhou0.58(II-B)Jiujiang0.52(II-B)
Chuzhou0.56(II-C)Jingmen0.61(II-C)
Shaoxing0.49(III-B)Huangshi0.55(II-C)
Hefei0.37(III-B)Yiyang0.68(II-C)
Taizhou0.45(III-B)Loudi0.65(II-C)
Huzhou0.32(III-B)Qianjiang0.63(II-C)
Wuxi0.24(IV-B)E’zhou0.66(II-C)
Changzhou0.21(IV-B)Wuhan0.49(III-B)
Hangzhou0.27(IV-B)Changsha0.45(III-B)
Huainan0.02(IV-B)Xiaogan0.35(III-B)
Wuhu0.01(IV-B)Nanchang0.46(III-B)
Maanshan0.01(IV-B)Yueyang0.41(III-B)
Chengdu-Chongqingurban agglomerationRCoupling Coordination LevelPingxiang0.44(III-B)
Guang’an0.70(I-B)Xiangtan0.35(III-B)
Dazhou0.70(I-B)Jingzhou0.48(III-B)
Luzhou0.71(I-B)Yingtan0.22(IV-B)
Chengdu0.60(II-A)Xinyu0.24(IV-B)
Nanchong0.65(II-B)Huanggang0.05(IV-B)
Leshan0.59(II-B)Xiantao0.13(IV-B)
Chongqing0.66(II-B)Tianmen0.01(IV-B)
Yibing0.69(II-C)Central Yunan urban agglomerationRCoupling Coordination Level
Suining0.66(II-C)Chuxiong0.67(II-C)
Neijiang0.66(II-C)Qujing0.65(II-C)
Meishan0.67(II-C)Kunming0.31(III-B)
Ziyang0.64(II-C)Yuxi0.01(IV-C)
Zigong0.68(II-C)Central Guizhou urban agglomerationRCoupling Coordination Level
Shaoyang0.66(II-C)An’shun0.70(I-C)
Mianyang0.35(III-B)Zunyi0.73(I-C)
Qiandong0.66(II-B)
Guiyang0.65(II-B)
Qian’nan0.32(III-B)

