1. Introduction
Nowadays, the use of modern tools and methods in the diagnosis of social problems and issues is not an optional activity, but rather functions as part of legal requirements defined in the legislative order and in standards of social policy activities. The identification of the key social problems of a city (municipality) is important for the proper design of the entire social ecosystem and for the development of remedial programs and strategies. The diagnosis of social phenomena and problems as well as security threats is not only a desideratum of social policy, but is also closely related to fields such as the concept of smart cities, universal design, strengthening social participation, and the desideratum of designing modern social services [
1].
In order to determine problems related to disorganization, an inventory of phenomena is used that demonstrates how many inhabitants experience a given problem and in which areas, as well as how the latter changes over a given period. Showing the essence of problems from the perspective of quantitative and qualitative data defines the portrait of a local community and the surrounding infrastructure, namely in terms of strengths and weaknesses. Activities consisting of improving the ways a given community functions are related to several stages—from collecting (inventorying) social risks and problems to generating a strategy for solving them in a participatory dimension. When creating a strategy, it is important to remember the coordination of important sectors that are jointly responsible for the existence of citizens, e.g., local government organizations, state authorities, and third-sector organizations. The possibility of the integral creation of an image of society and of the problems affecting it, as well as the preparation, planning, and evaluation of corrective actions, are made possible by building maps of social problems and phenomena [
2] (pp. 270–273).
The main aim of this study (I) was to present and analyze the operation of innovative strategies for mapping problems, social phenomena, and security threats in accordance with a model based on the development of cooperation between institutions and the strengthening of mechanisms of participation: the inclusion of the social environment in the activities conducted. For that purpose, an example of solutions currently applied in the Silesian Voivodeship was used. Importantly, two out of four solutions presented (the “National Police Security Map” and the “Interactive Map of Problems and Resources of Local Communities”) are innovative in nature and, in practical terms, have no equivalents in other countries. For this reason, in the opinion of the authors, they should be included in the international scientific discourse. Thus, the article emphasizes the technical and organizational aspects of the solutions, with a clear outline of the historical context, which is the substantive foundation of modern methods of mapping social problems and phenomena. The aim of the article (II) is also to analyze the functionality and effectiveness of the solutions adopted from the point of view of users and recipients in the context of shaping and evaluating active social and security policies. Attention was also paid to (aim III) locating and describing barriers as well as legal, organizational, and technical conditions hindering the implementation and development of interactive maps as social policy tools. In the final part of the article, there is a comparison of both tools and an analysis of their strengths and weaknesses. As was pointed out, two of the most important solutions described in the article are innovative in nature, and they are relatively new: the “National Police Security Map” has been operating since 2016, and the “Interactive Map of Problems and Resources of Local Communities” has been tested since 2014. The solutions in question have attracted attention in the national scientific discourse. This attention has mainly focused on general characteristics of functional tools [
3,
4], articles indicating the importance of the proposed solutions from the point of view of the needs of modern society [
5,
6], and analyses of the operation of innovative maps in the context of mechanisms of social policy [
4] and security policy [
6] in action. The studies mentioned have been national or sectoral in scope; however, due to the high functionality of the described tools, the issue of map use should be included in the international scientific discourse.
Fundamental to the description of criminal activities in a spatial context are certain environmental factors, such as the physical layout of an area, proximity to various services, and land use mixes, all of which are likely to influence criminal behavior. It is common knowledge that certain areas are more prone to higher concentrations of crime. Labeled “hot spots”, such areas are often the targets of increased manpower from law enforcement agencies in an effort to reduce crime. The identification of hot spots is helpful because most police departments are understaffed. As such, the ability to prioritize intervention through a geographic lens is appealing [
7,
8] (p. 11).
In the initial stages of applying the method of mapping social problems in sociological research, comparisons were analyzed on a macroscale through the study of socially unfavorable phenomena in a given province or in the context of entire countries. In order to prepare these comparisons, statistical data were used that grouped different types of crime in accordance with the code approach, i.e., as classified in court proceedings.
In 1829, Adriano Balbi and André M. Guerry produced maps showing the relationship between educational level and violent and property crime in France [
9]. This map is often regarded as the first example of crime mapping [
10] (p. 5). Following this, Joseph Fletcher (in 1849) and Henry Mayhew (in 1861) produced maps that showed rates of male incarceration and county crime, respectively [
11] (p. 6). In the early 20th century, Clifford Shaw and Henry McKay mapped thousands of incidents of juvenile delinquency and analyzed the relationships between delinquency and various social conditions [
12,
13]. Examples of important crime mapping cases are shown in
Table 1.
The benefits of mapping social problems have also been noted in the UK, where a trend has developed of taking into account other data (apart from judicial data) and comparing them within districts, smaller areas, or even neighboring communities. In the first half of the 19th century, many studies using this technique were carried out in the UK, which resulted in the publication of extensive reports on crime and its variation across individual counties. Those studies mainly used statistical data or crime rates calculated in relation to the 10,000 inhabitants of a given area. Some of the research took into account the possibility of establishing a common denominator in the form of map planes of the examined districts, which significantly improved the readability of the results presented (research by F.G.P. Neison, S. Redgrave, and John Glyde) [
19] (p. 430). Between 1861 and 1862, four volumes of “London Labour and the London Poor”, by Henry Mayhew, were published. That publication is considered to be classic literature on the subject, as it contained maps showing the distribution of crime in England and Wales as well as a comparison to the United Kingdom. Similar to this was a study on the characterization of social pathologies in the conditions of a large city (London), which was published in 17 volumes between 1892 and 1902 by Charles Booth, where the author first exposed the technique of maps of social problems on a huge scale.
A key contribution to the development of methods of mapping the problems and resources of local communities was made by researchers taking an ecological approach to problems (including crime) in American cities, who were associated mainly with the Department of Sociology at the University of Chicago. At this point, it is worth recalling the contribution of Jane Adams, whose work related to the famous Hull House study has now become a classic of the genre. The development of that research method dates back to the 1920s and 1930s and is associated with the University of Chicago Sociology School, with work by Robert Park and Ernst Burgess, among others. Its representatives used a wide range of research methods and techniques in their scientific exploration of their surrounding reality, which allowed them to obtain quantitative and qualitative data on the stage of organization and disorganization of urban space, while taking into account the multifaceted etiology of the phenomena in question as well as their effects. The result of activities undertaken by researchers (Clifford R. Shaw, Henry McKay, James F. Short, Jr., and Vivien M. Palmer) was the creation of numerous monographs defining the problems of living in the city, including homelessness, family disorganization, the formation and duration of social institutions, adult and youth crime, suicides and mental illnesses, ethnic and racial conflicts, strikes, collective actions and riots, violence, and the organization of nightlife services and entertainment in a large human community [
19] (p.432). What should be particularly strongly emphasized when recalling the contribution of this school is the tendency to combine the quantitative and qualitative approaches, which is one of the cornerstones of modern tools for mapping social problems and phenomena. On the basis of the scientific output and achievements of the representatives of the Chicago school, the following types of maps were developed and are still used to this day [
20] (p.41):
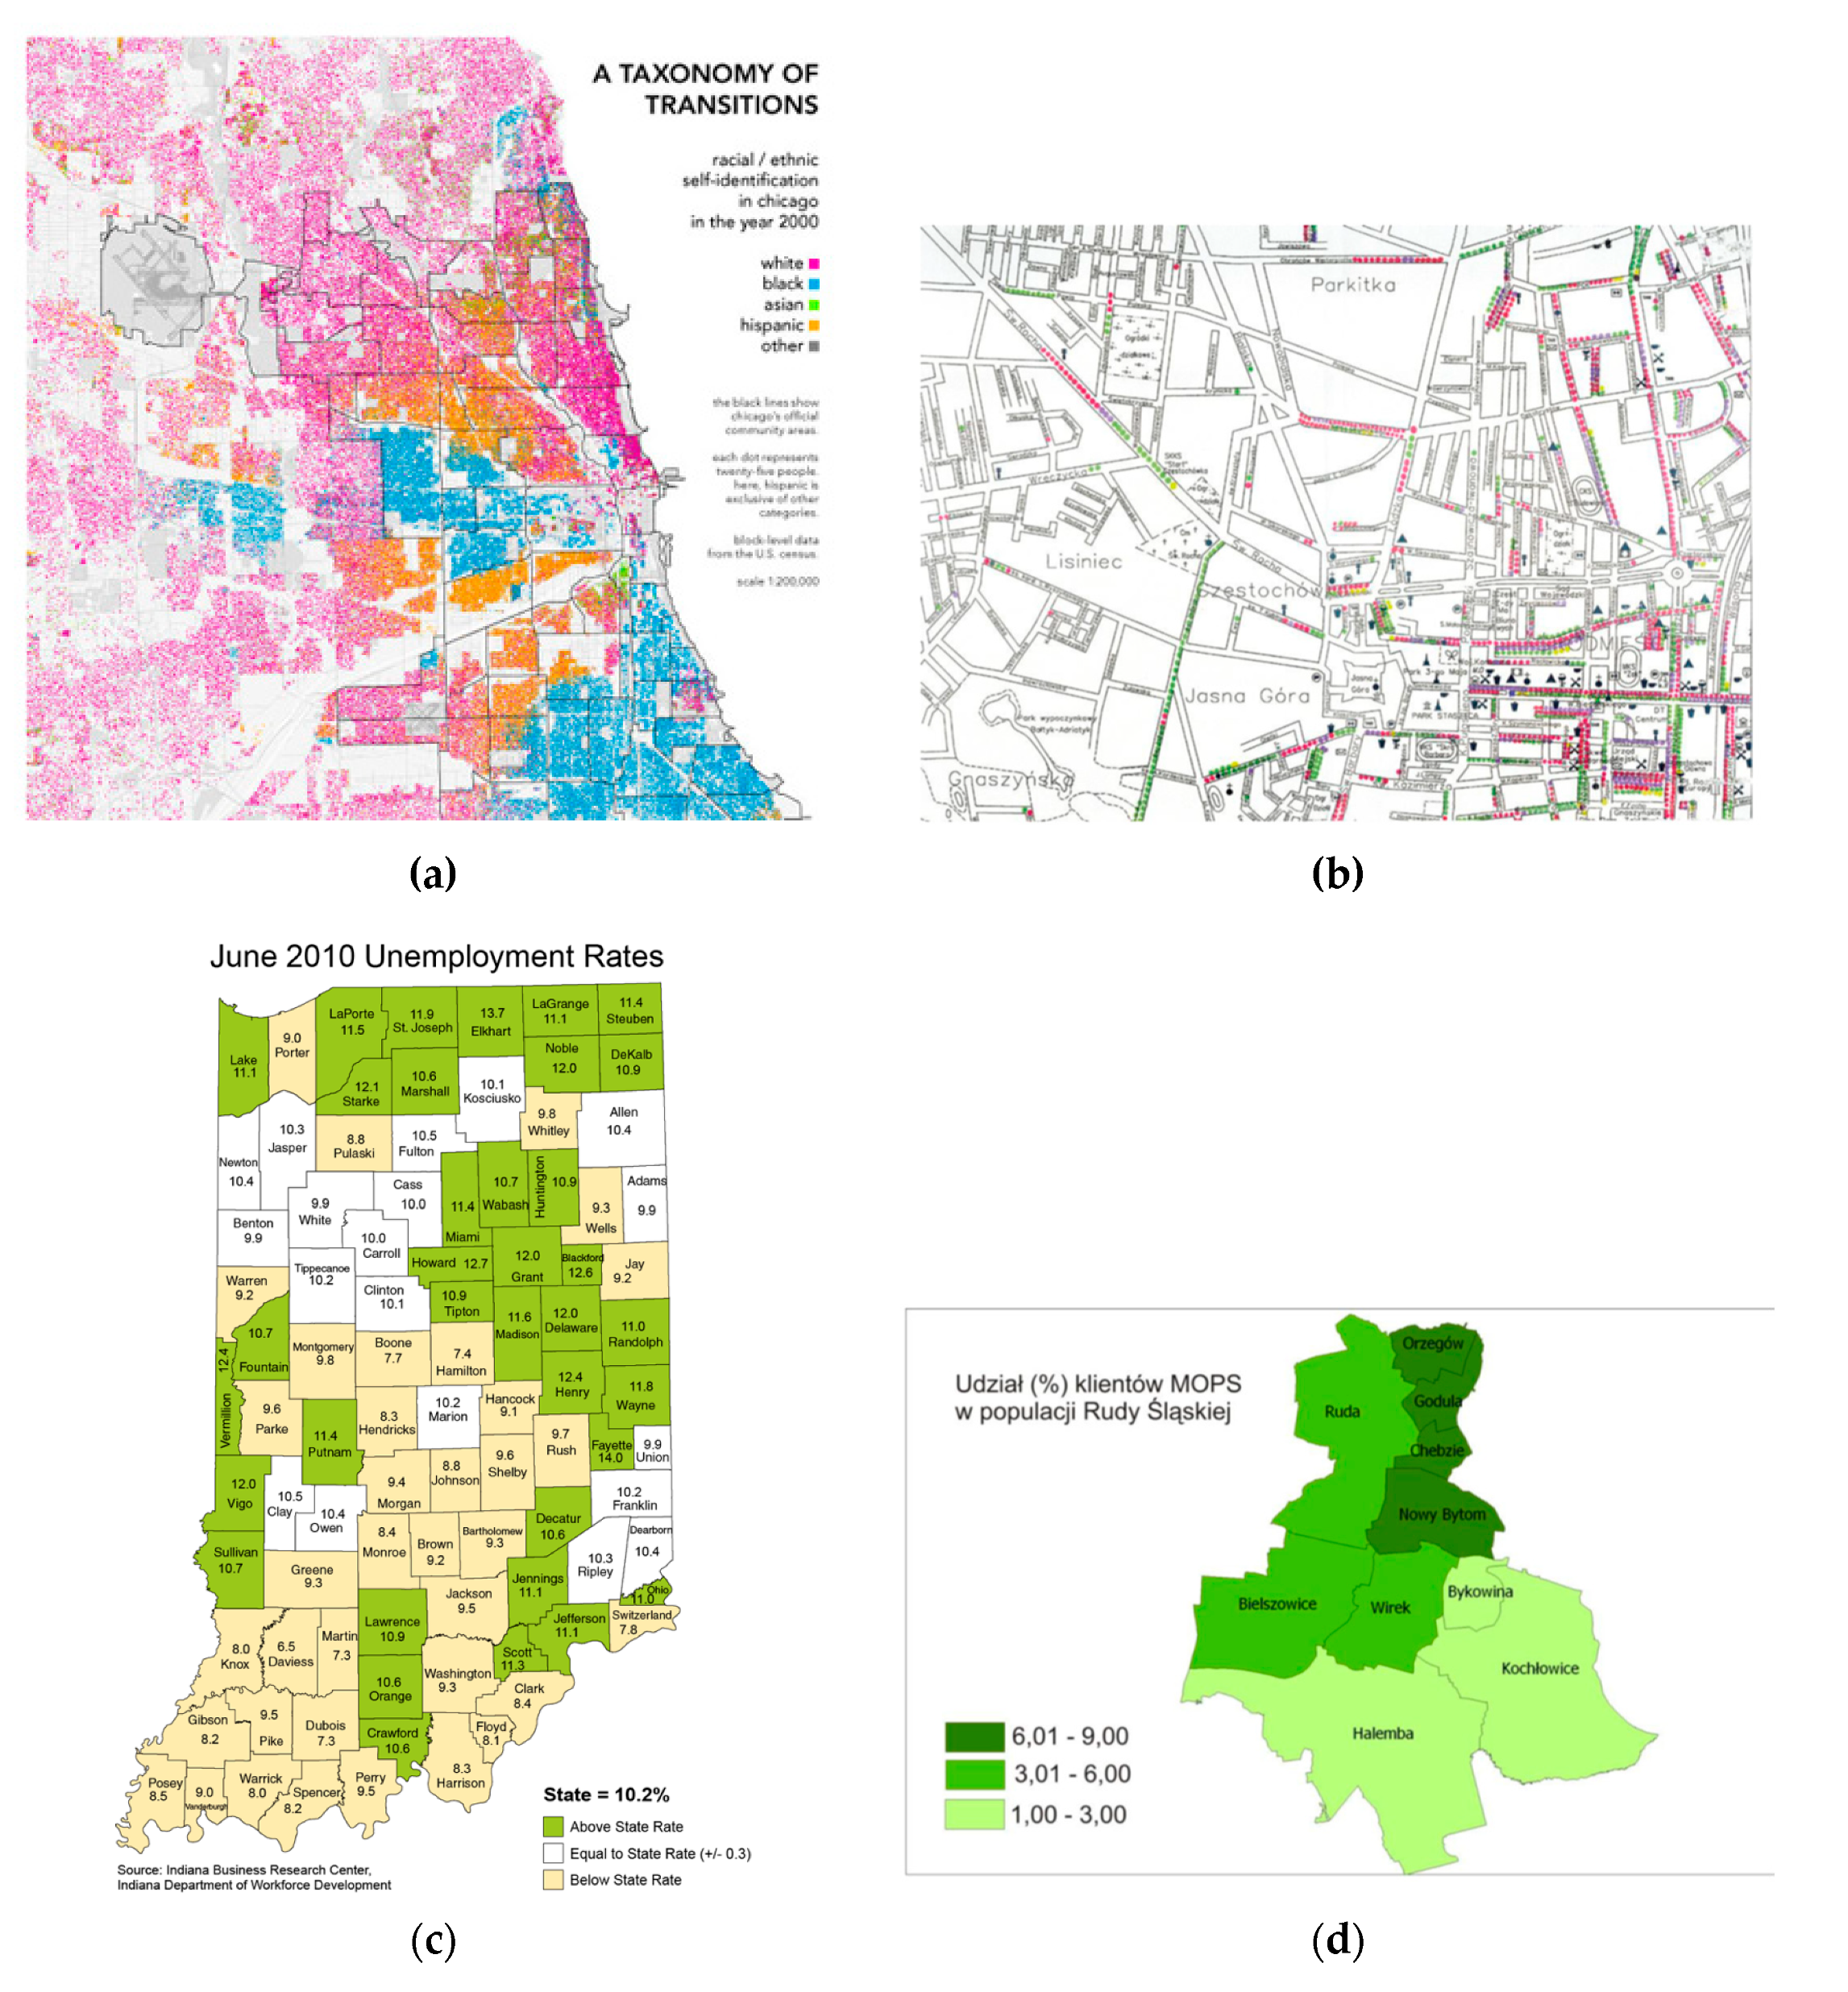
Dot maps: their structure is based on the physical marking of each case of a given phenomenon on a city plan, according to the availability of institutional data (e.g., unemployment, misdemeanors, the criminality of adult/youth residents, and the locations of residences of social welfare clients: (see
Figure 1a,b). The preparation of dot maps is made possible thanks to institutional diagnoses, and the maps classify spatial data, thus making it possible to locate a given phenomenon and learn its distribution;
Rate maps: these show the ratio of the number of inhabitants affected by a specific social phenomenon or problem to the total population (see
Figure 1c,d). This type of map makes it possible to identify facts that are useful from the point of view of both cognitive and social practice. Their significant advantage in the context of contemporary research is the full anonymization of data, which is impossible to achieve in the case of dot maps;
Zone maps are related to defining a central concentration point (marked as concentric zone I), outside of which further zones appear. This method, which is used in social sciences, is based on the fact that the radius of each zone increases by one mile beyond area II. The ratios obtained are calculated for one square mile and then averaged and presented;
Radial maps: these are structured around a radial (unambiguously directed) change in a phenomenon, beginning with the city center as the starting point.
Nowadays, due to a combination of research methods and technical possibilities in visualizing interactive maps, this division is becoming less important. Technically speaking, however (division by type and medium of presentation), wall maps and handy, miniaturized versions thereof can be distinguished, as can electronic maps, both interactively and passively. Although passive electronic maps may be viewed using digital devices, the way the data are presented there is traditional (static). Therefore, they do not provide the possibility of filtering information according to a selected substantive criterion. Interactive electronic maps provide the full possibilities offered by GIS solutions.
In Poland, the first attempt to create a map of threats was locally, in Warsaw in 2003. The “Warsaw Security Map” was created using police statistics and meetings with the inhabitants of the capital city (a total of 350 meetings were attended by representatives of the city authorities as well as the police and city guard). The tool was designed to give residents the opportunity to report dangerous places and events online (excluding those requiring immediate intervention). In 2005, work on the project was suspended. In 2010, again in Warsaw, the City Guard made a map available to residents that showed selected threats in which they intervened (robberies, fights, and thefts) [
21]. Similar local attempts to meet the expectations of residents have also appeared in other smaller cities. However, they were not comprehensive and did not meet the condition of interactivity.
As has been shown, crime mapping has long been an integral and important part of the process known today as crime analysis. The New York City Police Department has traced the use of maps back to at least 1900. The traditional crime map was a jumbo-sized presentation of jurisdictions with pins stuck in it [
22] (p. 1). Traditional maps were useful because they made it possible to show where crimes occurred, but they also had some serious limitations, such as the following:
As they were updated, the prior crime patterns were lost (it was impossible to follow tendencies);
They were static and could not be manipulated or queried;
They were difficult to read when several types of crime were mixed together on one particular map;
They occupied a lot of space (wall maps); and
They had space limitations (walls had a limited size).
In the early 1990s, when computer processing speed increased, desktop mapping became commonplace and fast. For crime mapping, this meant that more individuals than ever before had the opportunity to produce computer maps. The first use of computerized crime mapping in applied crime analysis most likely occurred in the mid-1960s in St. Louis [
23]. Thus began a long process of evolution from mere crime mapping to crime forecasting [
24].
A geographic information system (GIS), thanks to the use of geography and computer-generated maps as an interface for integrating and accessing massive amounts of location-based information, allows police to plan effectively for emergency response situations, determine mitigation priorities, analyze historical events, and predict future events. It helps identify potential suspects to increase investigators’ suspect base when no leads are evident. GIS also plays an important role in crime mapping and analysis [
25,
26,
27,
28]. Quick access and the quick processing of information displayed in a spatial and visual medium allow service providers (especially police) to allocate resources quickly and effectively. This is why police forces were the first criminal justice agencies to take a real interest in GIS, and they remain the main supporters of crime mapping to this day [
29,
30,
31]. GIS is used by police departments all over the world to provide mapping solutions for crime analysis, criminal tracking, traffic safety, community policing, intranet/internet mapping, and other tasks [
23]. Despite early problems with implementation [
32], it was possible to expand the range of agencies that used computer mapping packages to map the instance of crime. Geospatial technology is now playing a crucial role in strengthening law enforcement and is being widely adopted by police organizations across the globe. Working with crime maps based on GIS has become an important part of the tasks performed by police officers [
33] (p. 7) [
34]. It is a global trend nowadays, which includes countries with different levels of development and subject to diverse threats [
35,
36,
37,
38,
39].
1.1. Example 1: New York City
CompStat (COMPare STATistics) was a pioneering method first deployed in New York in the early 1990s that helped substantially reduce crime. Using the power of GIS to provide real-time insight and situational awareness has changed policing in New York. In 1993, before the New York Police Department (NYPD) adopted CompStat, there were around 2000 homicides in the city. By 2015, the number of such cases had decreased to 352. CompStat relies on real-time information sharing, the rapid deployment of resources, the preparation of effective strategies. and consistent feedback and follow-up. It uses GIS as a common operational platform to draw real-time attention to emerging crime trends [
40].
The NYC Crime Map allows for the visualization of a selected type of crime in a selected period (by default, it is the last completed month of the current year), expressed in figures and percentages and in three formats: a precinct map, a crime location map, and a heat map. An event is located to give the exact street and house number (see
Figure 2).
1.2. Example 2: Chicago
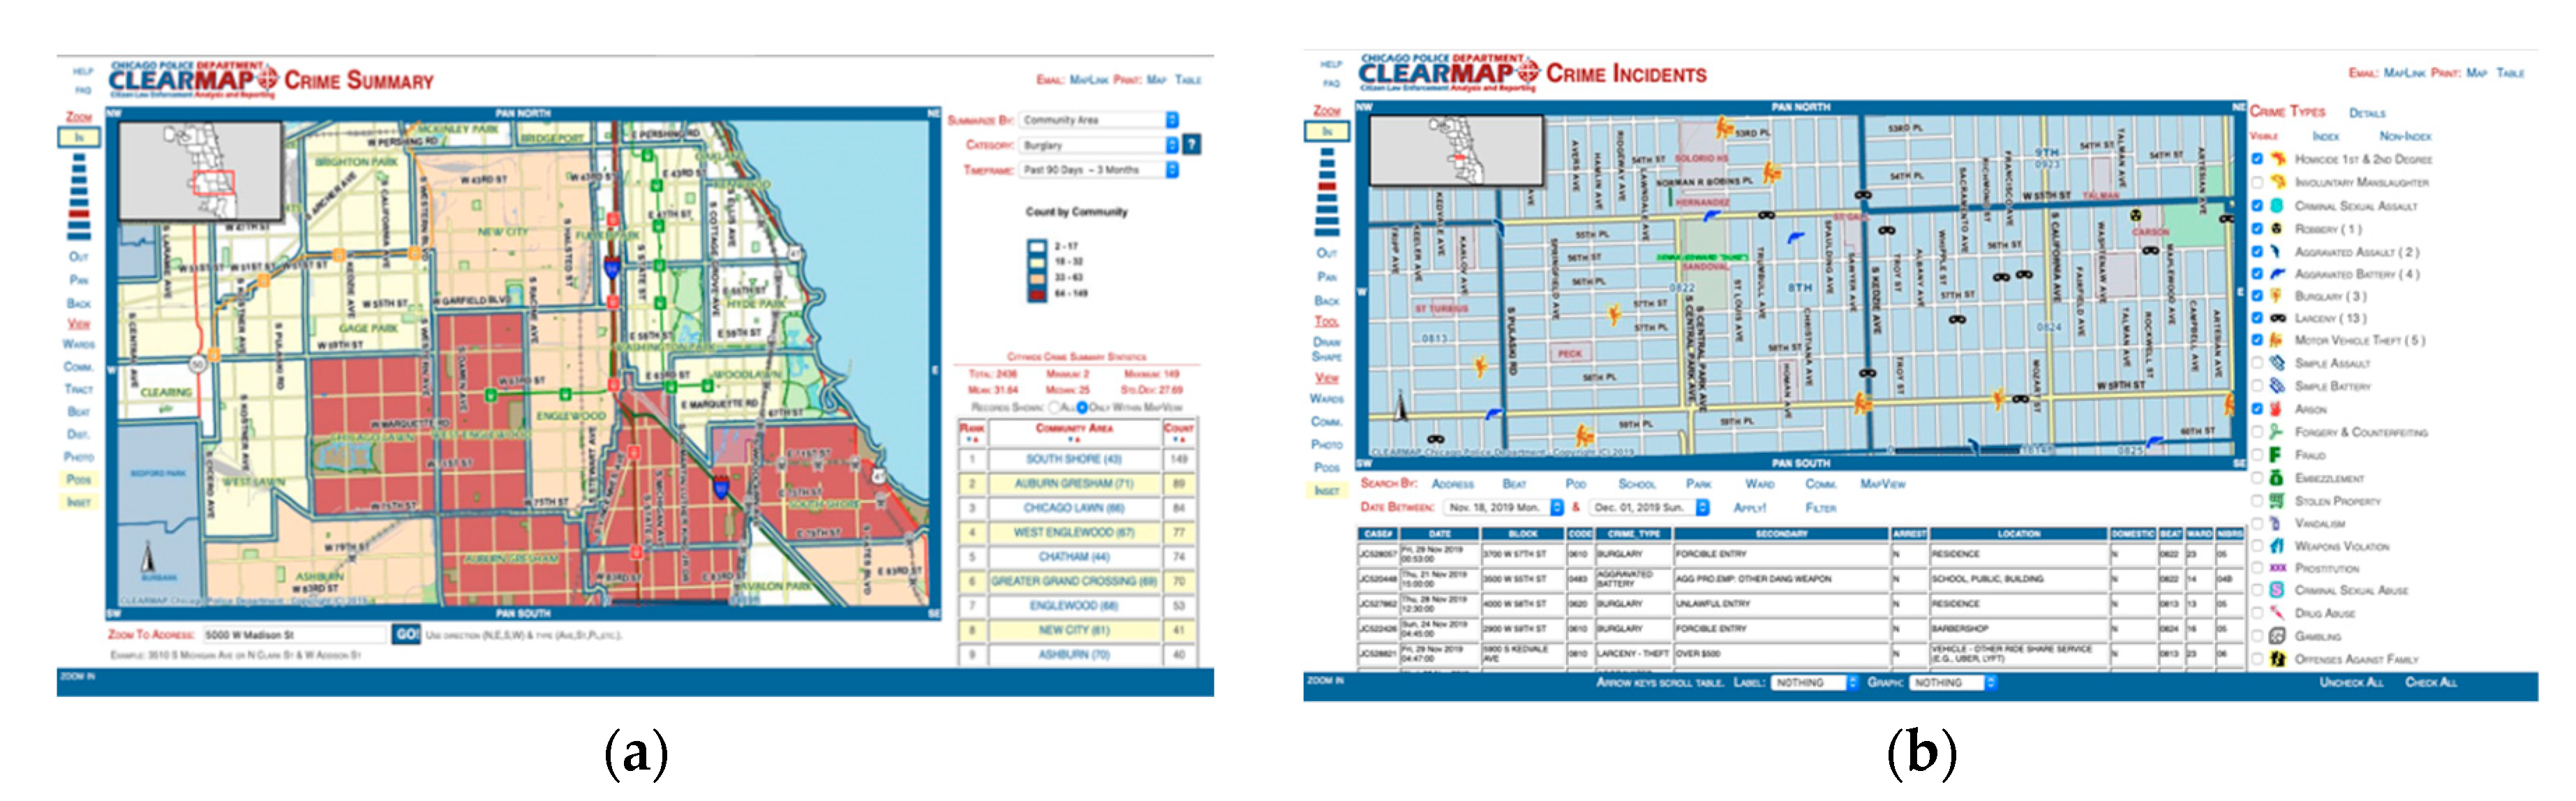
Powered by ESRI, the “Chicago Police Clear Map” developed by the Chicago Police Department (CPD) is a web application intended to provide residents of the City of Chicago with a tool to assist them in problem-solving and combatting crime and disorder in their neighborhoods. It is based on the Citizen Law Enforcement Analysis and Reporting (CLEAR) system developed by the department for use by its police officers.
One can summarize the crime counts by police beat, police district, ward, community area, and census tract. The crime data have been grouped into logical crime categories, which are visualized graphically on the map to facilitate their identification. Dropping down a given category allows one to reach the description of a specific event. These categories are used to display the data and provide the summary counts. There are four choices of timeframe: 90, 180, 270, and 365 days. The data are current up to the previous day. The data are dynamic, but the counts shown on this site should not be considered official CPD statistics. The legend has four ranges denoted by four colors on the map. The ranges are determined using the nested means method, meaning that for each crime category, timeframe, and geographical location, the ranges are calculated dynamically using the current data. This means that the ranges will change over time even when viewing the same geographical location, crime category, and timeframe because the data are dynamic. The statistics provided include the total, the minimum value, the maximum value, the mean (average), the median (the midpoint of the data), and the standard deviation (a measure of variation away from the mean) [
41] (see
Figure 3).
1.3. Example 3: United Kingdom
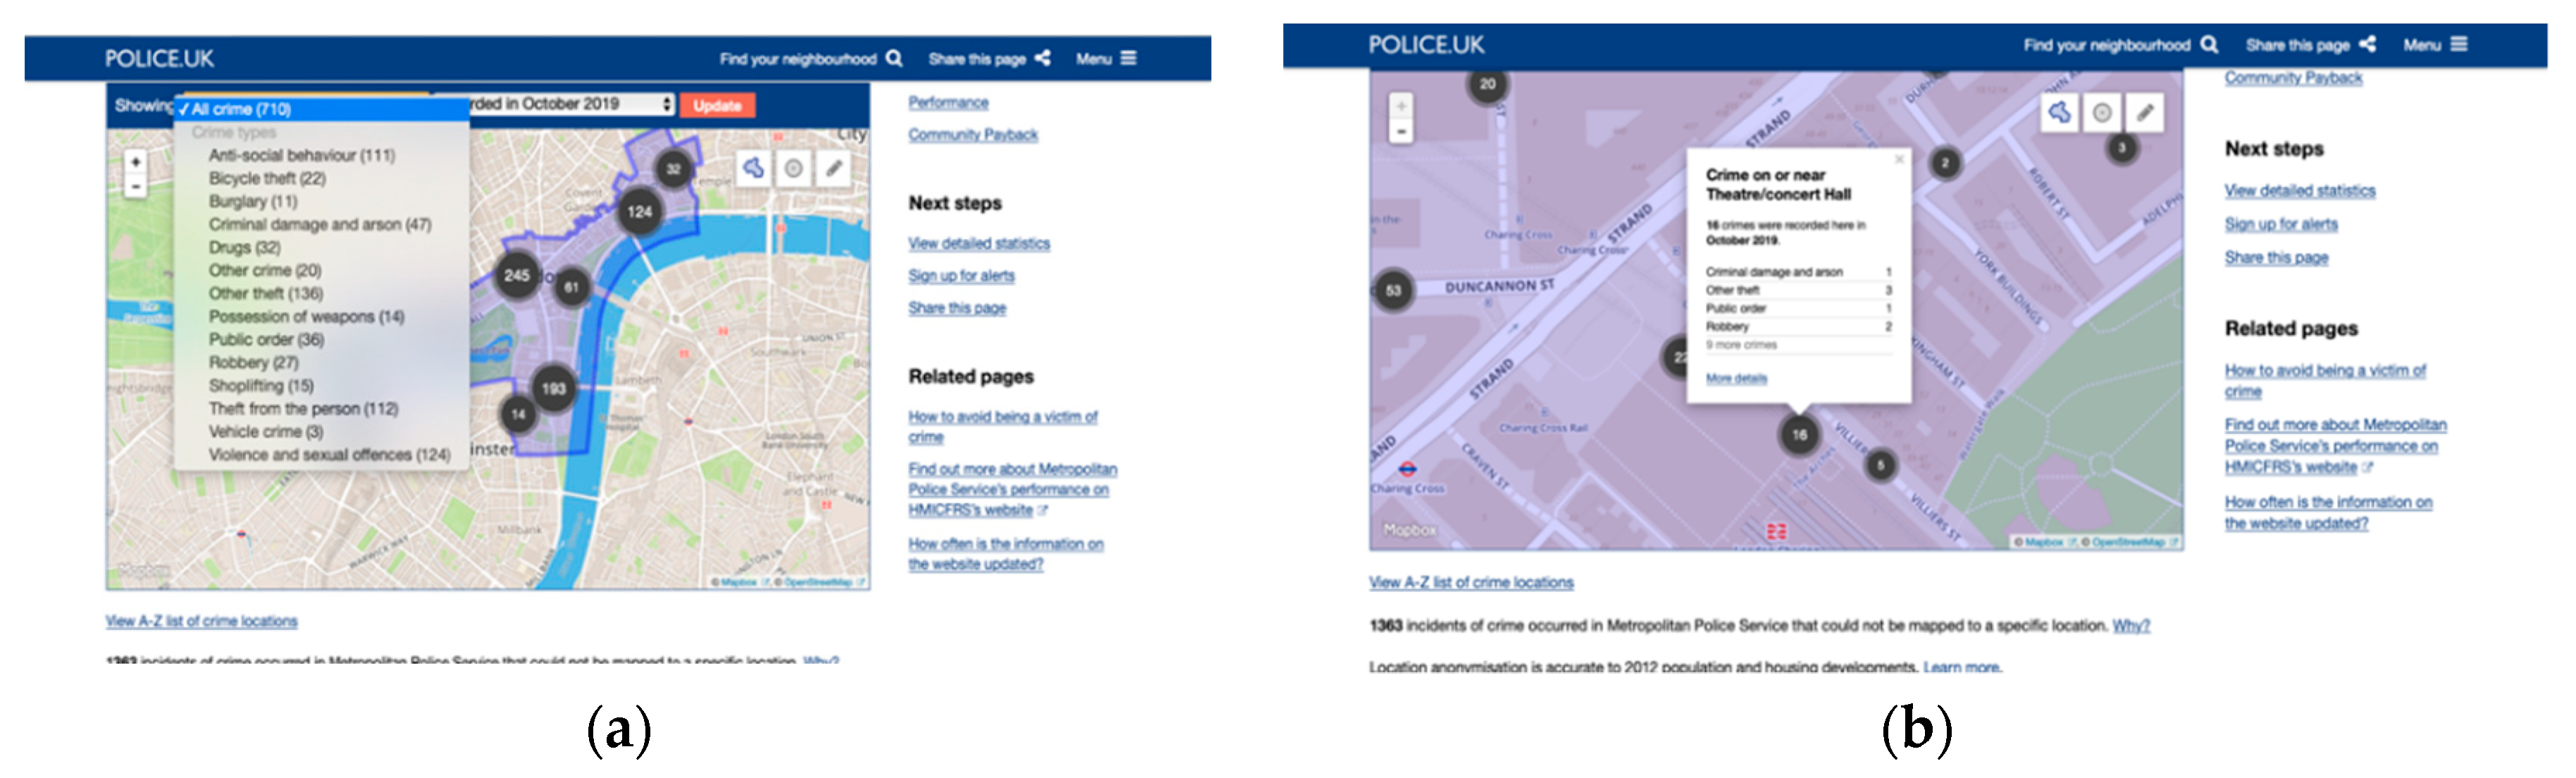
The United Kingdom Police national crime-mapping website began to publish crime data in the early 21st century, but it was only in its second decade that the mapping became as accurate as that of the US. From its very onset, the project was carried out over the entire country, which had no precedent in the history of crime mapping: maps usually cover individual metropolises and are run by different units and on different systems.
The maps give street-by-street results for six types of offense, including burglary, robbery, vehicle crime, violence, and antisocial behavior. Sexual offences are included in “other crime” to avoid revealing the location of victims. The data can be broken down by neighborhood or narrowed down to the individual street level, revealing the shifting patterns of local crime hotspots over time [
42] (see
Figure 4).
The assumptions and historical references presented above clearly indicate that the maps developed are primarily a visualization tool for collecting information about the spatial distribution of problems, phenomena, and resources. Nevertheless, visualization should be treated as one of the elements of a wider process: the cognitive analysis of spatial data. In essence, this aims to recognize the correctness of spatial datasets and find in them information that is important from the point of view of the subject under consideration, namely the planning and evaluation of social policy activities.
There has been a significant change in the approach to maps and the use of their actual and potential possibilities. Traditionally used as a visualization tool, maps—as a form of information transfer—have been (and still are) used to present certain issues to a narrow group of authors and make them available to a wider audience, e.g., local communities or representatives of social policy institutions. Nowadays, hardware and software capabilities (GIS) make it possible to use maps in the very process of data analysis (their development has become much faster and easier if one has the appropriate software and properly aggregated statistical data). However, the interactivity and mobility of new technologies makes it possible to develop a formula for using maps and to use them not only for processing and visualization, but also directly in the participatory dimension of information, data, and event acquisition and processing. This possibility opens up the completely new prospect of making maps available to users as a platform for active cooperation in the area of public security and selected aspects of social policies (even shaping them).
2. Materials and Methods
The development of information and communication technologies has significantly influenced the context of functioning and activity models of social policy institutions, thus creating the need to conduct diagnoses and make their results public in accordance with new standards. In these circumstances, it has become necessary to develop and design services and related models of management, availability, and presentation that are able to meet the ever-changing expectations of contemporary citizens, who are perceived not as recipients but rather as coparticipants in the processes.
Due to the assumed descriptive and monographic character of this study, the method of secondary data analysis was used. A critical analysis of the internal documentation of the described projects and tools was performed. The text is based on substantive data contained in strategic documents of social policy institutions, reports, and accounts, some of which are nonpublic documents due to, e.g., strict conditions of personal data protection and confidential data protection. The following sources were used: accounts and reports from evaluation studies of the described tools; lists of institutions using the described tools; statistical summaries and internal evaluation reports of institutions that are jointly responsible for the implementation of maps of social problems as well as the “National Map of Security Threats” and the “Interactive Map of Problems and Resources of Local Communities”; and selected legal acts. Moreover, an analysis of the operation of the described tools (interactive maps) and their functionality, usefulness, and impact on social policy—from the point of view of users and recipients—was made. A significant part of the source material obtained came from free interviews with the authors and coordinators of the activities described. In summary, the article was prepared using a desk research technique, which consisted of an analysis of already existing information originating from various sources such as accounts, analytical reports, and statistical data compilations (as well as their mutual verification and merging). The historical solutions referred to in the introduction constitute an important backdrop, matrixing the contemporary context and shape of the described contemporary solutions; therefore, they should be given special attention. Due to the aims of this article and the nature of this case study—introducing the described solutions into the international scientific discourse—the adopted strategy of combining secondary data analysis with an analysis of the operation of the described tools constituted a methodologically justified approach; however, the discussed solutions (interactive maps) require further evaluation and research, which will be discussed in the closing section.
The Silesian Voivodeship is located in the southern part of Poland and covers an area of 12,333 km2, which is 3.9% of the area of Poland. It is characterized by the highest population density in Poland—372 people/km2—especially in the areas around the centrally located Metropolitan Association of Upper Silesia and the Dąbrowa Basin, where there are as many as 1000 people per km2 in some places. On 30 June 2014, the Silesian Voivodeship had 4,593,358 inhabitants, which constituted nearly 12% of the population of the entire country, making it the second most populous region in Poland. Silesia has the largest number of cities of over 100,000 inhabitants in Poland. Most poviats (districts) are strongly urbanized: they do not have agricultural functions and are often used as “bedrooms” or recreation areas for the inhabitants of large cities.
The economic development of the region is primarily related to the mining industry (hard coal), the steel industry, and the important role of rail transport. The cities of the region are heavily biased in economic terms (monofunctionality). After the political and economic breakthrough of the 1990s, the region was subject to far-reaching economic degradation, which translated into numerous problems and unfavorable social phenomena (unemployment, poverty, and the social degradation of urban districts and environments). Nowadays, there is economic development in the region, which is intensive but disproportionate in geographical and social terms. The development of the conurbation and the successful economic transformation (e.g., Katowice, Gliwice, and Tychy) that are generating social development are accompanied by stagnation and significantly slower dynamics of development in the provincial units, which is exacerbated by possibilities for the exploitation of natural resources, the logistical possibilities of locating new plants, possibilities related to restructuring, and a lack of access to transport and road infrastructure. Although the Silesian Voivodeship has the smallest range of social welfare beneficiaries according to the data of the Central Statistical Office, amounting to 3.8% (in 2017, the average share of beneficiaries in the total population of Poland was 5.7%), such a measurement (in the field of sociocultural and economic revitalization) still constitutes a significant challenge in terms of social policy in virtually all territorial units of the Silesian Voivodeship, including those that are currently undergoing intensive development. This is due to a number of reasons, such as the fact that there are still socially degraded areas (cumulative poverty and grouped environments of social welfare clients). Problems and unfavorable social phenomena closely correlate with cases of breaking the law, keeping with returns to scale in terms of the most urbanized conurbation in Poland. Silesian Police data for 2018 indicate the initiation of almost 95,000 preparatory proceedings in connection with crimes, which translates to a little more than 2000 proceedings per every 100,000 inhabitants of the province.
The province is characterized by a significant share of national minorities. According to census data, there are 20,000 Germans living in the province (which constitutes 0.43% of the total population of the Silesian Voivodeship) and less numerous representatives from other nationalities, as well as Czech and Moravian minorities. Many people who claim to belong to the Silesian nationality or to the Silesian ethnic group also live there. In the 2011 census, there were 318,000 people (about 7% of the total population of the Silesian Voivodeship) who declared Silesian nationality only and 382,000 declarations of double identification (including 370,000 of Silesian-Polish identification) [
43].
3. Results
3.1. Maps of Social Problems
The professional identification of social problems and phenomena, their inventory, and a spatial analysis of their distribution constitute integral elements of the social planning process, preparation, realization, and evaluation of a social policy strategy on the level of a commune, especially an urban one. An important role is played by strategies for solving social problems, including social assistance programs, counteracting unemployment, preventing and treating alcoholism, counteracting domestic and other types of violence, and other strategies, the main goal of which is to integrate people, groups, and families from a special risk group.
Assumptions developed by the Chicago school are valid to this day and constitute a substantive foundation for modern systems of mapping and inventorying threats, problems, and the resources of local communities. Nowadays, the development of maps of social problems containing information about the spatial distribution of the disorganization of social phenomena is an element of the process of building development strategies and strategies for solving social problems. With the help of maps, it is possible not only to measure the size of social phenomena and problems, but also to compare them (contrasting the time and space frames) and moreover to realistically confront the patterns of analyzed phenomena and behaviors. The next step in the diagnosis is to carry out a comparative analysis of maps of various social phenomena and problems and to select the most endangered areas of the city in which they should be addressed in the future after completing the diagnosis, specific remedial and preventive programs, and actions. Maps of social problems—as one of the methods of shaping specific social policy in a given area—should primarily serve to shape living conditions and interpersonal relations. Most authors dealing with social policy stress that these activities include the following:
Equalizing living and working conditions by satisfying the needs of people of different ages;
Granting equal access to the exercise of civil rights;
Bridging social gaps; and
Protecting against life’s risks.
3.1.1. Traditional Maps of Social Problems
In Poland, the statutory obligation to develop and implement communal strategies for solving social problems lies with local government social welfare centers. In some municipalities of the Silesian Voivodeship, a traditional (wall or atlas) map of social problems was used as part of the diagnosis process in the years 2000–2018. In those institutions where the map method was used, in the vast majority of cases this was on a one-off basis for the purpose of implementing a specific project involving the drafting of strategic documents and planning activities. The map method was used in as many as 12 communes of the voivodeship [
20] (p.45). In these analyses, apart from the analysis of statistical data, traditional maps of social problems (walls, atlases: see
Figure 5) were used to illustrate the spatial distribution of social pathology phenomena in old residential districts. With few exceptions (Siemianowice Śląskie, Dąbrowa Górnicza, and Częstochowa), maps of social problems
in senso (dot maps, radial maps, and percentage maps) were not included in the spectrum of systematically applied methods of diagnosis and the presentation of social phenomena.
These maps were used on an ad hoc and individual basis and almost exclusively by municipal social welfare centers (in municipalities with poviat (district) rights), which in essence have greater human and financial potential. Only in a few institutions (six centers in the voivodship) was a map-based diagnosis carried out cyclically and at regular intervals. The catalogue of social phenomena and problems represented on the maps included, above all, the categories included in the “Act on Social Assistance”, matrixing the areas of activities of institutionalized social assistance: places of residence of the elderly, long-term unemployment, families experiencing violence, disabled people, addicts, etc.
Among the most frequently mentioned reasons for the lack of continuation or abandonment of diagnosis by means of traditional maps of social problems, the following were pointed out in particular: the time required, the high costs connected with the preparation of maps, the rapid obsolescence of data, and the dangers connected with the disclosure of sensitive confidential data. There are centers where diagnoses are conducted and where maps are still utilized, e.g., when planning and evaluating a strategy for solving social problems in city revitalization programs or when developing other strategic documents in the field of social policy. The benefits of the application of social problem maps include the possibility of suggestive presentation and easy access to information, the possibility of tracking the occurrence and intensification of the problem over time, the readability and transparency of data, the possibility of implementing programs for counteracting and solving social problems among the inhabitants of specific areas of a city, and the possibility of monitoring and evaluating the changes taking place in a given area of a city after the implementation of appropriate programs (as indicated by the managers of institutions using such maps).
At this point, one should pay attention to a significant legal and organizational limitation. Dot maps (which have been used extensively over the past decade) showing phenomena such as disability, long-term illness, and domestic violence not only cannot be made public, but their use also requires data anonymization methods guaranteeing that a given problem cannot be identified and linked to a specific environment, such as a given family. Anonymization, in turn, contradicts the essence of dot maps, the main feature of which is precisely the visualization of the spatial distribution of specific social phenomena and problems. On the other hand, since May 2018, i.e., since the adjustment of the Polish law to Regulation (EU) 2016/679 of the European Parliament and the Council of 27 April 2016 on the protection of natural persons, the use of up-to-date dot maps in public discourse has been virtually impossible.
3.1.2. Digital Maps of Social Problems
While today, traditional paper or atlas map methods are rightly considered to be archaic solutions, their basic assumptions are being developed in activities using digital maps. These tools, depending on the objectives and capabilities of the implementing institutions, take the form of passive (static) or interactive dynamic maps. In fact, static maps differ from traditional paper maps only in terms of the medium and methodology of preparation: the physical application of dots on the map has been replaced by the use of statistical tools such as IBM SPSS. Dynamic maps enable the selection, filtering, and comparison of results, i.e., scaling [
44].
The first group includes those solutions in which data aggregated by social policy institutions are visualized on a map in order to analyze and demonstrate the dynamics of distribution of specific problems and phenomena and compare them. However, maps are static in form. An example is the action taken by the Gierałtowice commune as part of a project to develop the commune’s revitalization program (see
Figure 6). The diagnosis was made from January to April 2017. In 2017, on behalf of the Gierałtowice municipality, the Technical Assistance Operational Program served as a source of financing [
45]. The delimitation procedure was conducted here in several steps. The first one was the division of the municipality’s territory into analytical units of a given area. Preference was given to units in the shape of a hexagon with an area of approximately 10,000 m
2. The map of the commune was then marked with all address points located in its area. The source of spatial data was the state registry, the Ewidencja Miejscowości, Ulic i Adresów (EMUiA) (the Municipality, Street, and Address Registry). Subsequently, particular problems and challenges of a social character were assigned a geographical attribute in the form of an address point: each of the analyzed phenomena was unambiguously located on the map. In order to anonymize the results, the collected data were aggregated, first by summing up the occurrences of a given phenomenon in a specific analytical unit and then by calculating the indicator of intensity (strength) of a given phenomenon in relation to the number of inhabitants [
46]. Maps were an element of the strategic document (the municipal revitalization strategy) and were published in electronic form. Similar diagnostic activities have been carried out in other communes, including Brzeszcze (Oświęcim County), Żywiec, Świętochłowice, and Katowice [
47].
The development of the mapping strategy described above, which was an important step toward the creation of maps in accordance with GIS assumptions, consisted of dynamic solutions that now allow users to filter and collate selected results at the presentation level. An interesting example is the chronologically older study “Social Problems of Oświęcim County”, which was commissioned by the County Center for Family Assistance in Oświęcim in 2008–2009 and financed by the European Union. The diagnostic activities carried out by the interdisciplinary team included the preparation and development of a diagnosis of selected social problems (covered by the obligatory support of the commune), as well as an analysis and direction for activities of the communes and the county through the use of an electronic map, which finally enabled the visualization and filtering of selected data. The data were collected and aggregated by local social welfare centers and the District Family Support Center. The data obtained made it possible to construct maps of social problems and an interactive atlas for phenomena such as poverty, people with disabilities and their families, alcohol abuse and violence in families, and care and educational inefficiencies [
48] (p. 3–5).
The maps show the ratio of the number of people who had a specific social problem, e.g., poverty, unemployment, and disability, in relation to the total population. The technique of zone maps was also used, which determines the areas of concentration of social problems and issues both in a district and in the municipalities of a district. The application was developed using flash technology, while its “interactivity” is based on the user’s ability to choose a specific social problem, which is presented in the main part of the board with an assigned impoverishment indicator (see
Figure 7).
In this case, it should be emphasized that the digital maps are also an element of the overall sociological study and the final report, i.e., the “Atlas of Social Problems and Social Resources”, which is the result of a comprehensive diagnosis and assessment of social problems and the social welfare system in the district.
The above solutions are model solutions, but they are not the only examples among similar projects in this area in the Upper Silesian conurbation.
An important value of the solutions characterized above is contained in the prospect of combining diagnostic activities with designing activities in social policy planning, where the map itself is something of a stepping stone between activities carried out on a microscale (the identification of social problems and negative phenomena) and the planning of aid, compensation, or prevention activities. Maps are created at a low cost on the basis of desk research: objective and aggregated data provided by social policy institutions. This is data collected, inter alia, in the course of institutional activities or individual/environmental diagnoses. The compilation and analysis of this information in the form of a map, meanwhile, is one of the bases in the process of preparing strategic documents, i.e., those that shape future activities (and their financing) in the fields of social policy and that are conducted and commissioned (delegated) in accordance with the principles of subsidiarity and multisectorality (part of the Polish legal order). Due to the appropriate anonymization of data, maps may be available to specialists as well as to the general public, which is in line with the assumptions of the national spatial information infrastructure.
The aforementioned solutions, as social policy tools, provide a matrix of general benefits: digital maps enable the effective analysis and visualization of information, leaving a lot of freedom for users. Depending on the specific needs and objectives of the study, as well as expectations and research preferences, selected categories of empirical data or combinations thereof can be the focus, as they are available in the application algorithm within the filtering variants. This type of map still offers great cognitive as well as functional possibilities. The problems associated with the implementation of this tool are primarily of an institutional nature: they are related to the absence of a unified system for the aggregation and exchange of data, which constitutes the content of a digital map. It is primarily a matter of coherence in terms of the possibilities of exporting and merging various data and records from various institutions (labor offices, social welfare centers, the police, municipal guards, probation officers, and health centers, which represent separate social policy subsystems) in a uniform system.
In conclusion, the main advantages of using a diagnostic tool, i.e., a map of social problems, are its transparency, the visualization of statistical data by means of graphical representation on the map, and the prioritization of the problems of the local environment. The main barriers are the cost, as well as the time-consuming and static nature of the tool. Organizational units of the social policy system do not have a uniform platform or software that enables the cost-free importation and processing of data traditionally aggregated in Excel tables or in the reporting modules of individual institutions without the involvement of external experts (e.g., the Pomost (Bridge) system in social welfare institutions and in Syriusz (labor offices).
3.1.3. Interactive Map of Social Problems and Resources in the Local Environment
Objectives and assumptions other than the analysis and presentation of data accompany the design of an interactive map, which is an innovative and open solution. This tool is a significant extension of traditional methods (paper dot map and digital map), with mechanisms of participation and the interinstitutional cooperation of multisectoral social policy actors (not only the public, but also commercial and nongovernmental entities). The concept was developed as part of a research and implementation project entitled “Building a Culture of Cooperation between Institutions in the Area of Employment and Social Integration through the Joint Mapping of Social Problems and Local Environment Resources with the Example of the City of Bielsko-Biała”, which was led and created by the municipal social welfare center and whose partners were the district labor office and the Higher School of Administration in Bielsko-Biała. The project was implemented from 2011 to 2014.
The basic tool developed as part of the cooperation was an interactive map of social problems and the resources of the local environment, which is a common platform for collecting, cataloguing, exchanging, and sharing information in a spatial dimension [
49]. The map, through its open formula, allowed for the recording of an entire spectrum of problems, phenomena, and resources within local environments, but did not constitute a finite catalogue. Its value was the ability to obtain a much higher functionality index, as well as its detail and completeness in terms of the data, which reflected the distribution of the studied phenomena according to their places of occurrence, e.g., buildings, streets, estates, or districts in the territorial unit in which the local partnership was established. The map, together with a handbook including a full description of the map operation, partnership building, and a training program, is made available free of charge to social policy institutions that declare their willingness to use it (see
Figure 8).
The reliability of the map, similarly to traditional dot maps, results from its methodology, which assumes a full diagnosis of specific social problems and resources using the entire local population and not just one community sample. On the other hand, the technological properties of the map, which are related to its interactivity and networking, open up a wide range of possibilities for entities and civic groups cooperating within the framework of the established partnership.
Importantly, a map is not of an autotelic nature in this dimension: it serves as a tool, a common platform for developing interinstitutional cooperation, undertaking and conducting institutionalized diagnostic activities, and developing a formula of cooperation in the field of social policy that will ensure a high level of effectiveness.
It is assumed that the joint implementation of the diagnosis of social problems and resources of local communities by means of the interactive map method is the first step in building a stable interinstitutional and intersectoral partnership with a view toward further cooperation, i.e., the development and implementation of social projects, the building of local partnerships, the joint development or evaluation of strategic documents in the area of social policy, and the preparation and implementation of preventive and corrective programs.
If an interactive map is used, the process of inventory and diagnosis of various social phenomena and local environment resources is carried out in accordance with the following logarithms:
The first research cycle is a starting point for conducting a diagnosis in a given area. It includes establishing (gathered around the leader/initiator) a partnership of interinstitutional diagnostic teams (including employees of, e.g., social assistance centers, the district family assistance center, the labor office, and other institutions of the social assistance and integration system). The responsibilities of the team include the process of collecting the full data necessary to develop a local diagnosis of social problems and environmental resources from the databases/files/acts. The diagnosis can be implemented on the scale of a district, a commune, a quarter, a housing estate, or even a street. The program’s interface is intuitive and refers to graphical solutions, functions, and typical ways of proceeding known from other applications. The methods of obtaining source materials from the institution’s databases are compatible with the IT systems functioning in social policy institutions (e.g., syriusz, pomost), which makes it possible to import data from Excel databases and adhere to methods of collecting and archiving information, which are subject to further analysis in the process of inventorying and diagnosing social problems.
The launch of subsequent research cycles is optional and depends on the needs of the municipality or institution; for example, when a strategy for solving social problems within a given period is needed, the municipality plans to develop a program to solve a specific social problem or prepares an assessment of social welfare resources. The team can fulfill different tasks in parallel, complementing each other and at the same time tracking the results of the activities of other members. It is then possible to update data that can be made available on the internet in accordance with specific procedures.
The attractiveness of the interactive map stems from, among other things, new visualization possibilities for presenting data, correlating specific phenomena with the place of their occurrence at different levels of detail. The ease of this multivariate filtering through the selection of available substantive criteria is an additional benefit. The platform is fully scalable and enables the selection and cataloguing of data to be aggregated. The program panel also allows the user to choose how to anonymize the phenomena and the problems presented on the map and determine which data or layers are visible to the logged-in users of the tool.
The described tool makes it possible to obtain the necessary information in an effective way, because the entire available database of specific institutions is analyzed, so it is based on the facts found in the documentation. Due to this, the actual problems, social issues, and issues for which the inhabitants of the city turn to a specific institution are known. Importantly, the catalogue of mapped phenomena depends on the choice made each time, so it is possible to focus on those phenomena that are important from the perspective of the functioning of cooperating institutions. The map also enables institutions to reconstruct their own characteristics in terms of objectives and areas of activity (who is the actual client, beneficiary, patient, stakeholder, applicant, or recipient); to reconstruct the sociodemographic characteristics of people in the examined archives/files/acts; and to recognize material resources, human resources, potential, and the environment of the institution and local community.
The goals that were achieved within the framework of the implementation of this model in Bielsko-Biała also included the following:
Deepening and disseminating knowledge on the scale, dynamics, structure, and spatial location of social phenomena and processes;
Broadening knowledge related to the local network of social institutions, especially nongovernmental organizations working for social integration and employment;
Improving co-operation between institutions dealing with granting support to people from groups threatened by social exclusion and building new forms of cooperation between public and nonpublic institutions within the framework of “partnerships” aimed at creating and exchanging information concerning social problems and the resources of inhabitants on an ongoing basis;
Establishing new and lasting professional contacts that break through a number of interinstitutional and intersectoral barriers;
Creating a new quality associated with the culture of cooperation between representatives of partner institutions and organizations within the diagnosis team;
Jointly developing a diagnosis of social problems occurring in the local communities of Bielsko-Biała housing estates; and
Jointly updating (on an interinstitutional, or network, basis) information on problems and the resources of local communities, which is needed to design and implement strategies and activate and self-organize them.
In summary, a model of effective cooperation in the field of social policy—with the use of an interactive map of problems and resources, which is assumed to shape the presented solution—occurs in terms of information and experience exchange, the implementation of diagnoses and analyses, and the mutually coordinated monitoring of conducted activities. This formula assumes cooperation between the representatives of institutions currently diagnosing unfavorable changes in social situations and resources at various levels of operation in a local environment, which can be referred to in the process of social activation and integration. The data obtained, which are updated on a regular basis, enable effective counteraction to problems through the undertaking of appropriate measures at the right time. The implementation of the model provides municipal authorities with new possibilities of accessing information on domestic social issues; moreover, it becomes possible to initiate discussions or debates on actual social problems. This facilitates the reorientation of the strategies, projects, and programs being implemented, the key criterion of which is the transition from a stereotypical perception of various social phenomena to the actual recognition of these phenomena, consolidated in reliable data analyses.
The effectiveness of the solution described, as with the previous solutions, should be considered from the point of view of the applied social policy; unfortunately, we only have data concerning the use of the tool in Bielsko-Biała. The maps created and the cooperation mechanisms developed were used by the city of Bielsko-Biała to develop three strategic documents, namely a strategy for solving social problems for the years 2014–2020, an Urban Revitalization Program for the years 2014–2020, and a Development Strategy for the Southern Subregion of the Silesian Voivodeship through Integrated Territorial Investments. The key barrier hindering the development of the described tool turned out to be the necessity of additional activities being undertaken by representatives of social policy institutions, as well as concerns of the management staff related to the restrictive requirements of protecting data against disclosure or unauthorized use (or appropriate anonymization of the data).
3.2. Silesian Map of Security Threats
Another interesting solution, despite the fact that it was developed independently and operates in another sector, public security, closely corresponds to the basic assumptions of an interactive map, making it possible not only to diagnose problems or threats and visualize and collate them, but also to increase the effectiveness of the work of public services (the police) and to activate citizens through an interactive function of threat reporting. The solution for mapping security threats in the Silesian Voivodeship is part of the “National Map of Security Threats”, a tool implemented in 2016 by the police in Poland. Previously, a trial version of the map operated in the province.
The “National Map of Security Threats” [
3,
4,
5,
6] is “a list of the specific, most common threats to the safety of human life and health, property, and public order, taking into account their spatial distribution, the occurrence of which is important from the point of view of society, the Police, as well as other bodies and institutions, and affects the feeling and enforcement of security in society” [
3]. It was established in 2016 as a result of 12,000 meetings between police officers and local communities devoted to the greatest threats in the area from the residents’ points of view. It operates through Ordinance No. 768 of the Police Chief Commander (14 August 2007), which is about the forms and methods of performing tasks among police officers on patrol duty and the coordination of preventive actions (Journal of Laws of Police Headquarters No. 15, item 119, as amended); Guideline No. 3 of the Police Chief Commander (14 September 2016), which is about the conduct of police officers during the performance of tasks related to the functioning of the “National Map of Security Threats”; and Guideline No. 1 of the Chief Commander of the Police (31 July 2017), which amends the guidelines on the conduct of police officers during the performance of tasks related to the functioning of the “National Map of Security Threats”. At the level of the Silesian Voivodeship, the functioning of the “National Map of Security Threats” is regulated by the following:
Decision No. 42/16 of the Voivodeship Police Commander in Katowice (10 February 2016), which is about appointing a team to prepare and coordinate activities related to the functioning of the “National Map of Security Threats” in the Silesian Voivodeship;
Decision No. 345/2016 of the Voivodeship Police Commander in Katowice (19 August 2016), which is about appointing a team to coordinate activities related to the implementation and functioning of the “National Map of Security Threats” in the Silesian Voivodeship;
Decision No. 357/2016 of the Voivodeship Police Commander in Katowice (29 August 2016), which amends Decision No. 345/2016 of the Voivodeship Police Commander in Katowice (19 August 2016), appointing a team to coordinate activities related to the implementation and functioning of the “National Security Threat Map” in the Silesian Voivodeship; and
Decision No. 477/2016 of the Voivodeship Police Commander in Katowice (8 November 2016), which is about the principles of supervision over implementation by police officers of tasks related to the functioning of the “National Map of Security Threats” in the Silesian Voivodeship [
32] (p. 264).
The statistical data on offenses can be displayed by geographical breakdown (voivodeship, county, and municipality level). These data are presented based on information collected by the police. In situations where the police force is one of several institutions collecting data on a selected subject, information on this type of threat is not presented on the map (e.g., domestic violence, where the police force is one of five entities entitled to trigger the “blue card” procedure). The categories presented on the map are represented in
Table 2 and in
Figure 9.
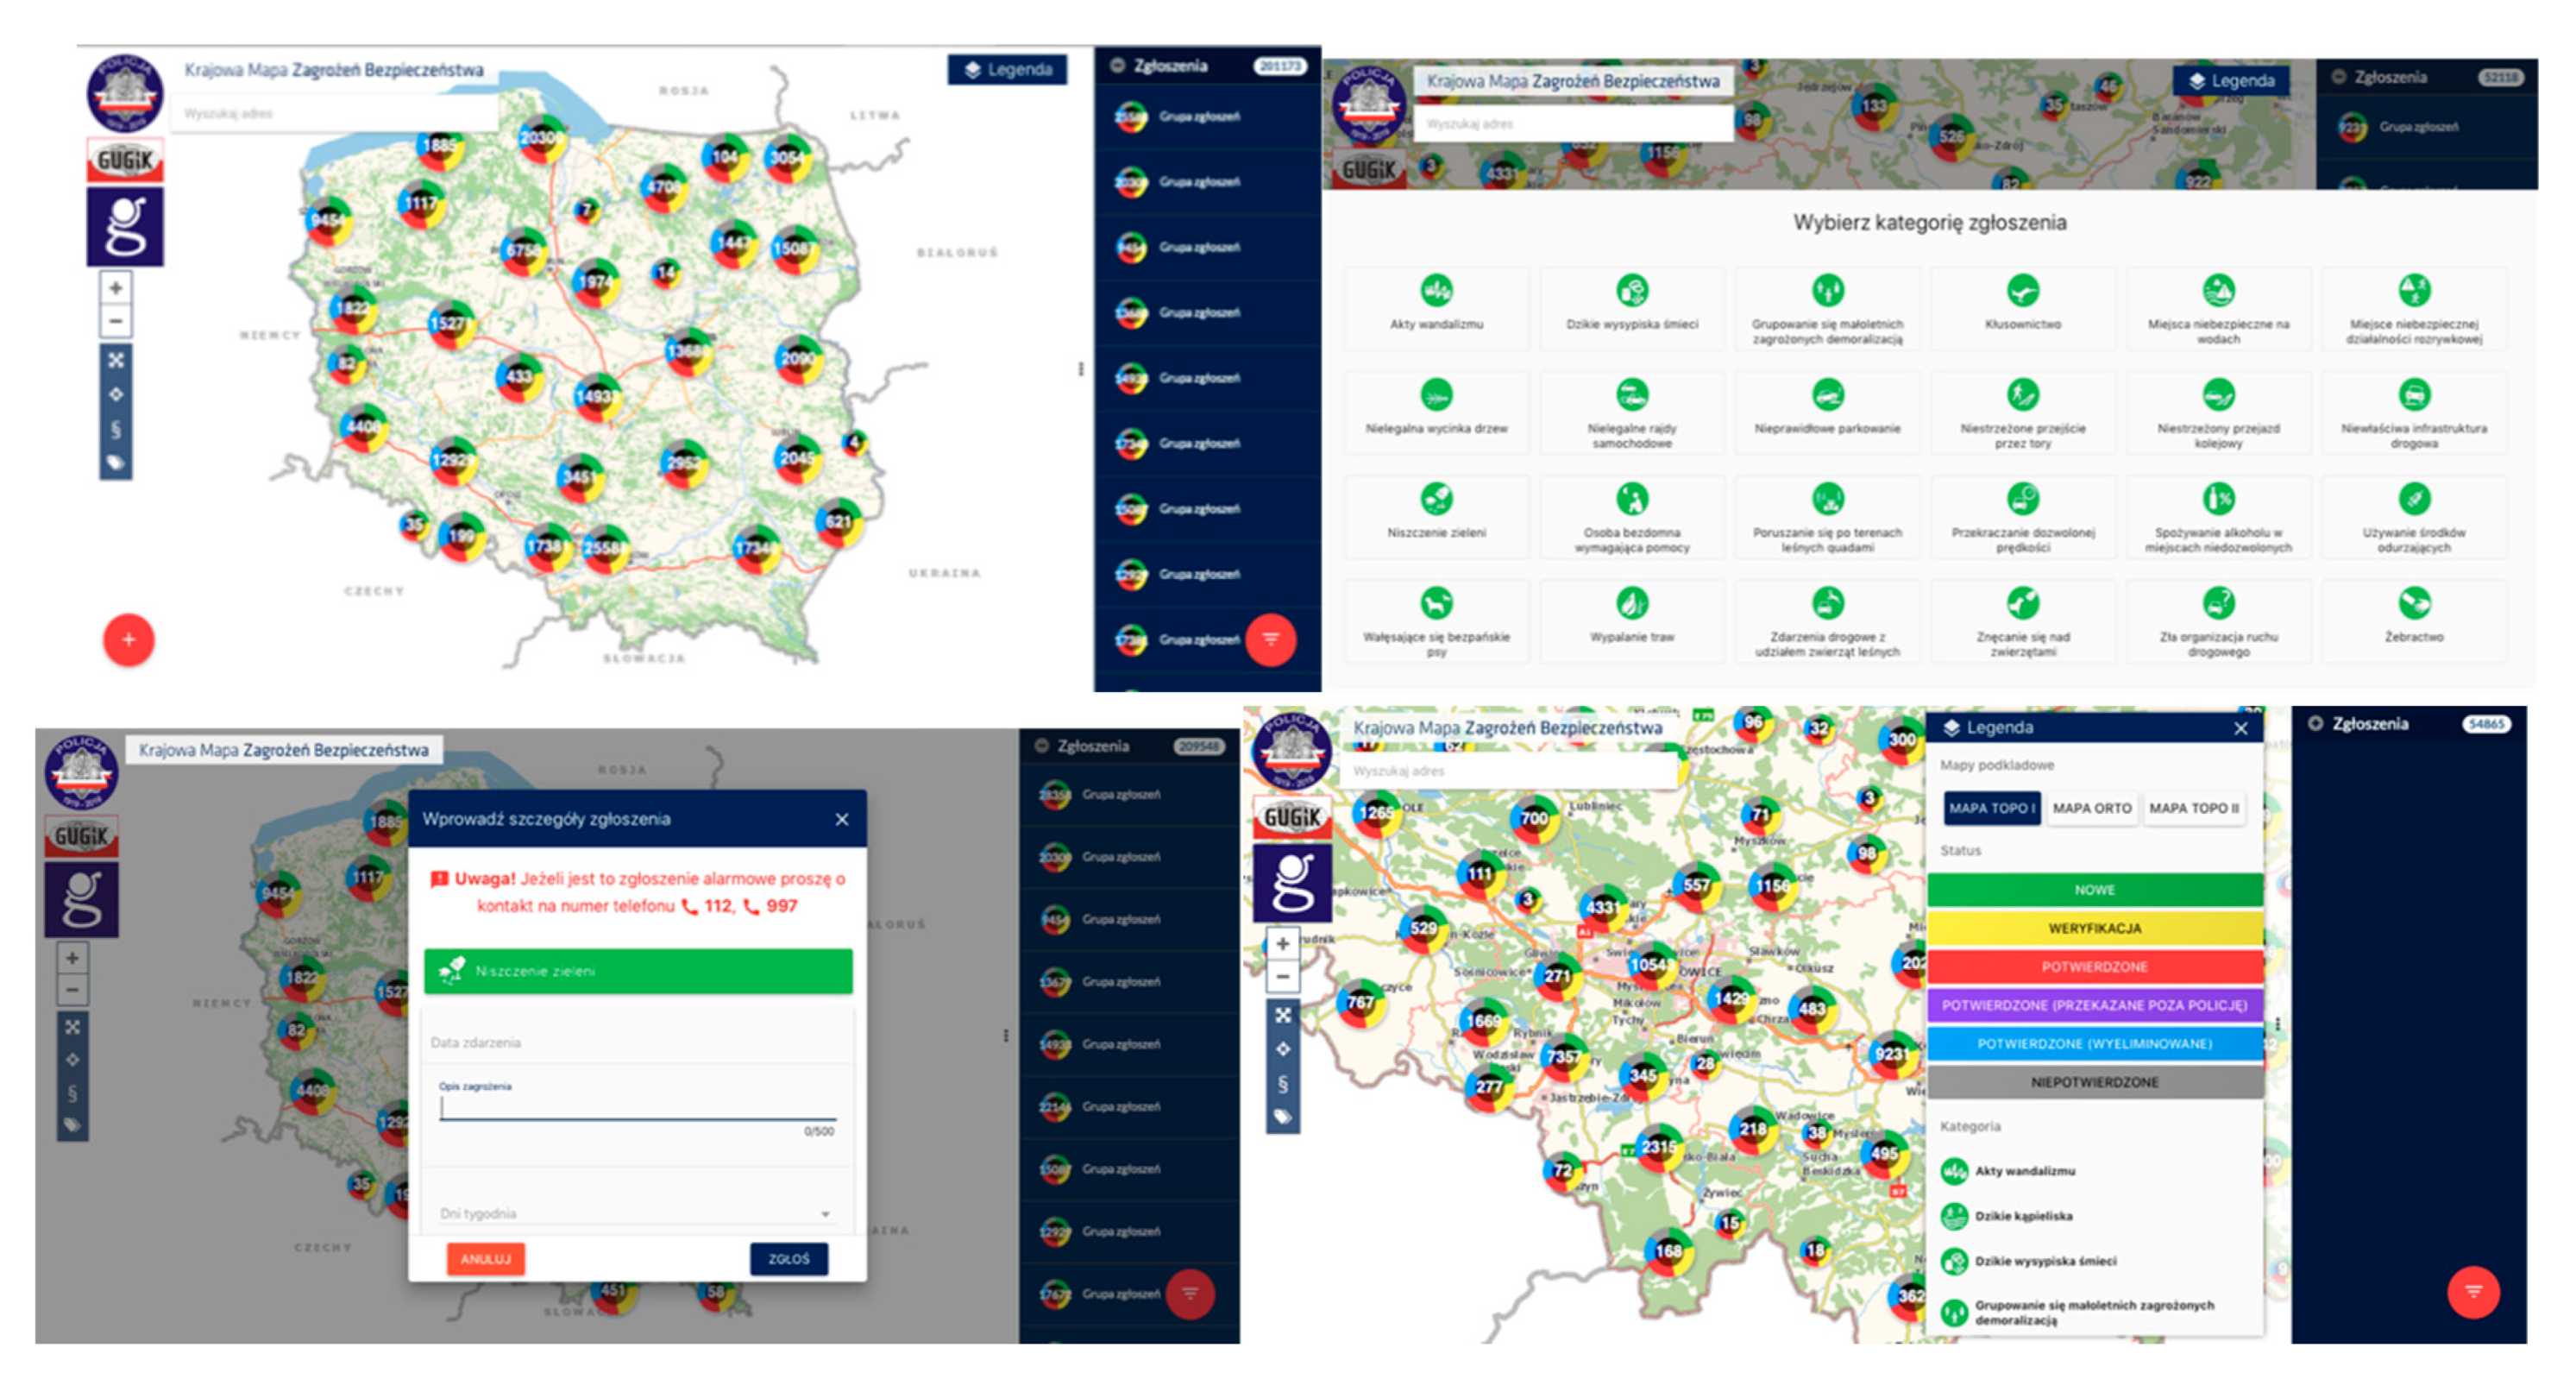
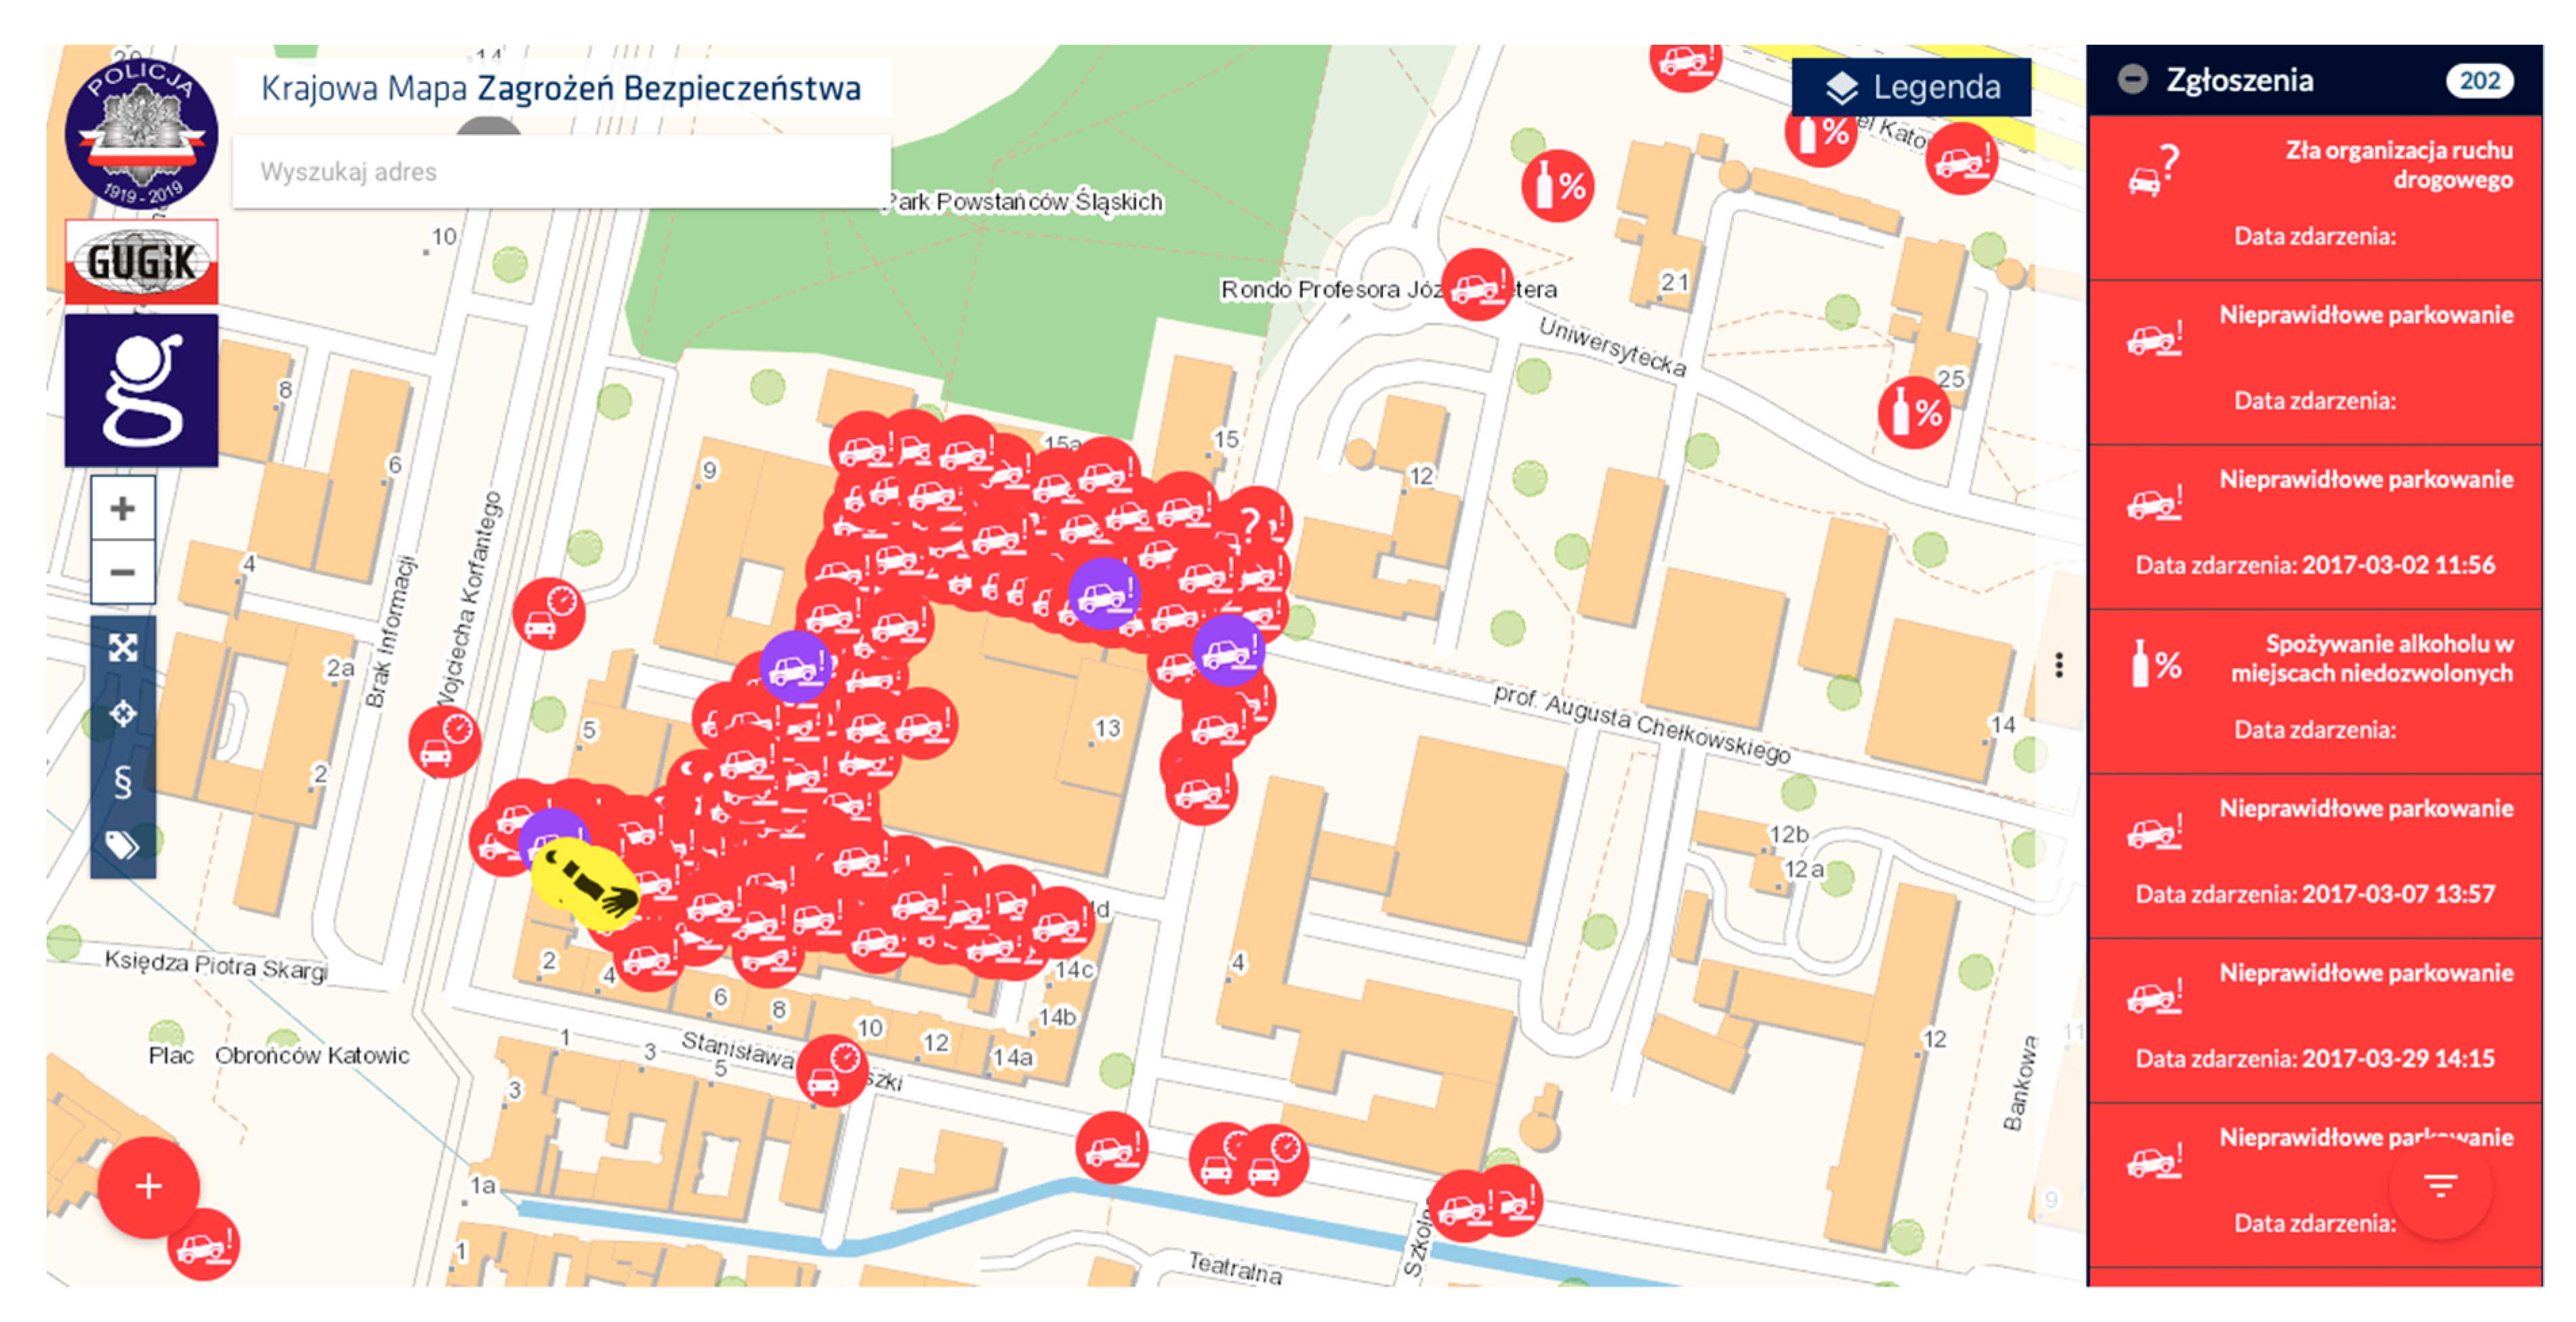
The interactive part of the map is based on information shared with the police by the public. Reports made by citizens are visible down to the exact street and number (if this can be indicated). The map allows for reports to be made in 26 hazard categories, such as acts of vandalism, unguarded bathing sites, wild waste dumps, groupings of minors at risk of corruption, poaching, dangerous places on the water, dangerous places for entertainment, illegal logging, illegal car rallies, improper parking, unguarded track crossings, unguarded railway crossings, inappropriate road infrastructure, destruction of greenery, a homeless person in need of assistance, driving quads in forest areas, speeding, alcohol consumption in prohibited places, drowning, the use of drugs, wandering stray dogs, the burning of grass, traffic incidents involving forest animals, animal abuse, poor traffic organization, and begging. In December 2019, at the time this article was being written, a new category was added: the location of dangerous entertainment activities.
The reporting system is simple and intuitive. The user clicks the “add report” button and selects the type from the list of categories and then indicates the location of the report on the map by clicking on the right place or by entering the address. In the report, the user can indicate the time of day or days of the week or if the threat occurs periodically and can describe it in detail and attach a photo. Each time, the person entering the report is informed that in the case of an emergency, the police should be contacted immediately by telephone at indicated numbers. The report is anonymous. The process of reporting is shown in
Figure 10.
Reports in a given location are marked with colors indicating their status: new (green), verification (yellow), confirmed (red), confirmed and transferred to other institutions (violet), confirmed and eliminated (blue), and unconfirmed (gray). After two years of operation of the “National Map of Security Threats”, in January 2019, the millionth threat report was recorded. According to police statistics, half of all reports are confirmed [
4]. Unfortunately, these statistics are not being updated on an ongoing basis and are not made available to the public. Similarly, it is equally difficult to obtain information on the number of reports in selected periods, the dynamics of social activity in the application, or detailed information of the following type: the most numerous types of unconfirmed reports, the most active crime reporting areas, etc. The police justify their unwillingness to disclose this information by stating that the map is still being developed.
A citizen’s report registered in the system appears on the map with a “new” status. Within a maximum of two days, it must be examined by the local coordinator appointed at the level of the city (county, district) headquarters and placed on a threat verification card. The verification may take a maximum of five days, which does not always make it possible to determine the validity of the report, especially in the case of incidental or seasonal events. After verification, the report is assigned a “confirmed” or “unconfirmed” status. Subsequent events from the same category in the same area added in a short time interval automatically receive the status of “confirmed” (see
Figure 11) [
50].
The “National Map of Security Threats” is a tool that stands a chance of lending substantial support to police activities, provided that it is developed further based on conclusions from its operation to date. The following aspects are particularly important here:
Verification and expansion of the catalogue of threats;
The possibility of tracking the events being reported in the time domain (e.g., in a selected week or month) on the map, instead of tracking current events only;
The continuous improvement of report verification standards;
The promotion of the tool with the use of modern technology (so far, this has only been done in the form of leaflets and traditional meetings with residents);
Combining data from police statistics and citizens’ reports in a single location.
4. Discussion
This overview of the use of different types of maps in social and security policy in the Silesian Voivodeship makes it possible to draw specific conclusions.
It is not without reason that the introduction highlights the historical context. The technique of mapping social problems was showcased on a huge scale for the first time by the aforementioned Charles Booth, a British reformer and pioneer in the field of social research. His aim was strictly pragmatic: to provide the representatives of the British Parliament with factual data that would prove helpful in conducting reforms and legislative activity. It was thanks to his research that a timeless dependence was noticed, namely that areas with a high crime risk are geographically and functionally linked to districts of poverty. Similarly, representatives of the Chicago school, including Vivien M. Palmer, pointed out that the mapping of social problems should most faithfully reflect reality. Further, through their compilation, comparison, and critical analysis, this can provide a basis for practical actions that fit into contemporary social policy.
The pragmatic aspects of creating and publishing maps have proven to be timeless. Traditional ways of mapping social problems and threats (paper, walls, etc.) should rightly be considered as archaic in the 21st century. Although widely used (the case study of the Silesian Voivodeship), they do not make it possible to track the dynamics of the visualized phenomena and their changes over time, as they only capture data from a specific moment in time. Moreover, they require additional activities, requiring in each case expert support and the involvement of employees, which is a significant problem due to staff and resource deficits and an excessive number of tasks being performed by social policy institutions. For these reasons, the use of the tool in the form of a traditional map was finally abandoned. Digital solutions not only allow users to visualize the phenomena at any given moment, but some of them also make it possible to compare dynamics at any given time and thus forecast possible subsequent events or challenges. This solution also enables the automation of the process of collecting data and information. In that way, information maps become tools for predicting the future, thus allowing for the implementation of a number of preventive measures.
Further extensive use and development of such maps, both static and dynamic, should be expected in social policy, especially in the processes of preparation and evaluation of strategic documents.
Interactive solutions such as the tool developed in Bielsko-Biała or the police map of threats enable activity and the inclusion of users themselves into the process of diagnosis and lead to deep and important results: the activation of users, an increase in their involvement in public matters, and an increase in the possibility of additional data being obtained by institutions from dispersed sources. Ordinary citizens can easily use these tools and influence their shape (at least some of the resources and activities). In this way, authorities and executors of public policies gain access to information concerning local problems, threats, or social issues, and it becomes possible to initiate discussions and strengthen mechanisms of social participation and activation among local communities and representatives of nongovernmental organizations, which is nowadays a key principle in organizing public order and security.
The prospect of building civil society, which has not been discussed in other studies on the subject, is also not without significance, as the described maps to some extent make the functionality of reports and interactions available to citizens (the police security map) or representatives of nongovernmental organizations carrying out diagnoses within the framework of partnership (the “Interactive Map of Social Problems”) and thus
de facto activate participation in this mechanism, which should be perceived as a tool for social activation. It is also worth noting that the use of modern information and communication technologies by institutions that have been struggling with image problems for many years may be important in the process of building their reputation and positive social perception [
51].
The mapping of social problems and phenomena as well as events that threaten security is associated—as shown in the case studies mentioned above—with key problems and concerns.
The first is widespread public access to data, which does not always do justice to the investigated phenomena. In the case of crime or other security threats and social problems and issues, data from disclosed, reported, or diagnosed events are presented, which obviously does not represent all phenomena.
Secondly, a map of events created by citizens should be approached with some caution. The example of the Silesian Map of Security Threats shows that every second report is verified by police officers or other cooperating services. Thus, the map shows events that probably did not occur (marked with a different color from those confirmed). Moreover, specialists have noticed the phenomenon of duplication of events: people examining the map realize that there are indeed threats already revealed in a given place and they duplicate them. Although the verification process assumes the elimination of duplicated reports at short intervals, it will not eliminate all such situations.
Open or partially open (limited) access to maps also raises the question of mapping sensitive data, such as places of domestic violence or the locations of social welfare beneficiaries, which should not be available (for the benefit of the victims or the beneficiaries of support). However, this is information that is important from the point of view of services responsible for combatting crime and pathology or organizing social support on maps. Importantly, in the context of mapping social problems, when there are clusters of unfavorable tendencies (disadvantaged areas, socially degraded neighborhoods), even adequate anonymization of detailed data and the use of units that make it impossible to assign a problem to a specific family/environment when creating the maps do not prevent the unfavorable process of stigmatization of local communities due to their place of residence.
Fourth, it is important to bear in mind the challenges of securing and anonymizing data and protecting maps against unauthorized use (hacking attacks).
Fifth, the interactive map of phenomena, problems, and the resources of local communities, despite its functionality, is not a model that is permanently included in the social policy being implemented: it is an open model in Poland for use by interested institutions. However, this requires additional activities and involvement on the part of employees representing the entities of the partnership, with no possibility for the refund of additional labor costs. This is a serious obstacle in the context of the specific general trend observed in social policy institutions, i.e., the predominance of needs and tasks of an obligatory nature, as well as deficits in resources and possibilities, be they financial, HR (human resources)-related, or organizational.
5. Conclusions
The map of police security threats is a model of activities in Poland that has gained stability and recognition, and its inclusion in the infrastructure of public spatial information (
geoportal.gov.pl) (as an element of national activities and strategies for public security) has guaranteed the continuity of operations and expansion of the tool in subsequent years. Combining the functionalities of collecting information on spatial distribution and its visualization with the possibility of intervention, i.e., citizens’ reports, brings measurable benefits to the police, other public service institutions, and citizens themselves. As a tool, the map was built on the basis of a methodical foundation, as well as in a stable software environment, enabling easy and intuitive access as well as the development of the tool in the future, e.g., by extending the range of its functionalities or adding new categories of threats.
At the present stage, a significant limitation to the development of this tool is the lack of real evaluation activities. Much would be brought to the current state of knowledge through the examination of models for using the application at a user level—among other things, the motivations of the reporting individuals and information about social groups/environments that use the application most frequently. We also do not know—and this is an area that is cognitively interesting and important for system development—the following: the attitudes of representatives of services (the police) toward this tool and whether the operation of the map actually translates into effective actions (i.e., an actual reduction in the scale of occurrence of threats/accidents reported in the given areas). The implementation of the discussed solution has not been accompanied by and is not currently being implemented as part of information and promotion activities conducted on a larger scale: this is yet another serious shortcoming of the implementation of the discussed solution, which should be accompanied by a specific public relations strategy that should also be implemented on social media.
The interactive map of the problems and resources of a local community, developed within the framework of a regional innovation project, is an example of a solution that, although it fits into the key needs, priorities, and challenges of social policies and creates (as a model) the possibility of cohesion and the coordination of activities undertaken at different levels and scales, has not entered mainstream national social policy as a commonly used solution, which would enable further development and stabilization and the development of its functionalities. The basic obstacle to the wider implementation of the model turned out to be its regional (provincial) dimension and lack of connection with the national spatial information infrastructure. Another important barrier also turned out to be the necessity of undertaking and coordinating additional tasks (when creating the map) among entities associated in partnerships: a secondment of employees to participate in diagnosis teams. These are the main reasons why the tool was used in only 21 (out of 167) municipalities of the Silesian Voivodeship, although in formal terms as many as 56 institutions have expressed their willingness to implement the tool (model). Undoubtedly, the tool in question should be treated as a prototype solution that needs to be modernized and, most of all, included in the public spatial information infrastructure (using the national Geoportal system, which is supervised and supported by the Head Office of Land Surveying and Cartography). Only such a solution would enable the wider implementation of this effective and positively evaluated tool.
In conclusion, it should be stressed that although public spatial information systems, which are open to a wide range of users, currently do not take into account social problems and unfavorable phenomena, their mapping itself is an interesting and creative challenge, as is the appropriate protection of confidential information and the anonymization of data in order to make it impossible to connect a given problem/phenomenon to a specific person or family. However, the examples from the Silesian Voivodeship confirm that maps of social problems can be successfully used as an important tool for social diagnosis, including the planning and evaluation of assistance, prevention, and revitalization activities.


