Article

Seaweed Production Potential in the Brazilian Northeast: A Study on the Eastern Coast of the State of Rio Grande do Norte, RN, Brazil

by
Herika Mylena Medeiros de Queiroz Andrade
1,2,3,*,
Luiz Pinguelli Rosa
1,4,
Flavo Elano Soares de Souza
2,
Neilton Fidelis da Silva
1,3,4,
Maulori Curié Cabral
5 and
Dárlio Inácio Alves Teixeira
2
1
Energy Planning Program (PPE), Coordination of Post-Graduation Programs in Engineering of the Federal University of Rio de Janeiro (COPPE/UFRJ), Rio de Janeiro, RJ 21.941-914, Brazil
2
Agricultural School of Jundiaí, Federal University of Rio Grande do Norte (UFRN), Distrito de Jundiaí, Km 03, Macaíba, RN 59.280.000, Brazil
3
Federal Institute of Education, Science, and Technology of Rio Grande do Norte (IFRN), Natal, RN 59015-000, Brazil
4
Internacional Virtual Institute of Global Change (IVIG), Rio de Janeiro, RJ 21.941-909, Brazil
5
Institute of Microbiology Paulo de Góes: Department of Virology, Federal University of Rio de Janeiro UFRJ, Rio de Janeiro, RJ 21941-901, Brazil
*
Author to whom correspondence should be addressed.
Sustainability 2020, 12(3), 780; https://doi.org/10.3390/su12030780
Submission received: 5 December 2019 / Revised: 11 January 2020 / Accepted: 15 January 2020 / Published: 21 January 2020
(This article belongs to the Section Environmental Sustainability and Applications)

Abstract

:
Seaweed is a source of multipurpose bioresources, providing millions of dollars to the world’s economy and performing various ecosystem services that aid in maintaining marine balance, reducing eutrophication, providing nutrients and mitigating atmospheric CO2. In this context, this study aims to evaluate the potentialities of the cultivation of the Crassiphycus birdiae seaweed on the eastern coast of the state of Rio Grande do Norte (RN), Brazil, considering the physical and environmental aspects. Estimates concerning suitable areas and their productive potential for the Biomass, Bioethanol, Biofertilizer and Agar bioproducts were carried out. These estimates were based on the Modular Ferry System (MFS) installed on the state coast. Suitable cultivation areas were determined by applying an Analytic Hierarchy Process (AHP) and change detection analysis based on physical and infrastructure factors, such as areas sheltered by winds, sea currents and waves, proximity to seaweed banks, road infrastructure and socioeconomic and environmental factors. Areas identified as suitable for seaweed cultivation totaled 2227.59 ha in area, with a productive potential of 195 thousand tons of fresh biomass/year, over two million liters of ethanol/year and about 43 tons of agar/year. These findings demonstrate that the northeastern coast of Brazil has the potential to generate employment and income through seaweed cultivation, stimulating the coastal region’s development in a sustainable manner.

1. Introduction

Seaweeds have long been used by mankind, as they are extremely versatile, especially regarding human and animal nutrition and as cosmetics and fertilizers [1]. Their potential in biofuel production has also been demonstrated, beginning in the 2000s. [2,3,4], as many seaweed species display excellent growth rates and are rich in carbohydrates [1]. In addition, the use of seaweed as carbon dioxide scavengers reduces sea eutrophication, which contributes to the balance of the marine ecosystem, as well as the mitigation of atmospheric CO2, in turn reducing the global greenhouse effect [5,6].
Algae cultivation is widely developed around the world, which is heavily dependent on ecosystem-based management, combining planning and integrated and spatial management. Their healthy exploitation requires the elaboration and implementation of a regulatory framework and the adoption of conducts that promote the sustainable exploitation of these resources. It should thus align with the national and international political agenda in socio-economic and environmental terms.
The favorable appeal of macroalgae cultivation in the world is strongly based on sustainability principles, in order to meet several factors: i) the limitation of natural seaweed banks in the face of increased demands; ii) the potential profitability of this activity; iii) the search for employment and income in coastal communities; iv) the stimulation of industrial development projects in tropical countries aimed at generating employment and income in coastal areas presenting low social development and environmental vulnerability [7,8].
In Brazil, macroalgae cultivation occurs along its coast by simple techniques, the northeast region being where its occurrence is more pronounced, based on harvesting in natural banks. The period between 1973 and 1974 marked the peak of algae production in the country, and this production began to decline at the end of that decade.
In the 2000s, due to the overexploitation of natural banks, there was a decline in several agar-producing species. It should be noted that this decline also resulted from the low quality of the offered product, the fall in price, and the absence of public policy oriented to this market.
This decline impacted the lives of coastal populations—especially those with low income—who depended on this market, which forced them to look for new work or commercial activities such as fishing, shrimp farming, and tourism; these last two activities were the ones that have stood out in the northeastern coast since the 1980s.
Considering its potential socioeconomic benefits, algaculture activity in Brazil can contribute to regional development sustainably. When considering its management and planning, its legal framework and the adoption of a sustainable practice supported by public policy, it can promote the generation of jobs and income through the production of bioethanol, biogas, biostimulants for agricultural and livestock use, cosmetics, agar, and carrageenan, among others [8,9,10].
In this context, the challenges of developing seaweed cultivation as a biomass source for different uses, including biofuel production, require knowledge concerning the possible difficulties and opportunities encountered in setting up a production chain. In addition, seaweed production chain structuring must also take into account socio-economic and environmental impacts and associated costs and infrastructures, as well as regulatory public policies that must be adopted, and government incentives for this purpose. Therefore, it is paramount to understand that the sustainable promotion of this activity requires not only economic viability, but also social, cultural, political and environmental viabilities [8].
Seaweed algaculture is a lucrative activity, reaching USD 11.7 billion in 2016 [11]. Statistically, from 1990 to 2016, the total number of people involved in fishing decreased from 83% to 68%, while participation in aquaculture activities increased from 17% to 32%. In addition, the world production of economically important seaweeds increased significantly, from 3.8 million t in 1990 to 30.1 million t in 2016 [11].
In Brazil, seaweeds are cultivated by simple techniques in coastal communities, most notably in Northeastern Brazil. This activity has the potential to contribute to sustainable environmental, social and economic development in this region [8], leading to employment and income generation through the production of bioethanol, biogas, biostimulants for agricultural and livestock use, as well as cosmetics, agar and carrageenan, among others [8,9,10].
Many seaweed genera are noteworthy regarding the worldwide production of economically important industrial products. One of them, the red algae genus Gracilaria, is distributed throughout tropical regions worldwide, and species belonging to this genus are important agar producers [12], with Crassiphycus birdiae being economically exploited for agar extraction [7,8,13].
One of the predominant seaweed constituents, polysaccharides, can be hydrolyzed to fermentable sugars that can be used in the production of third generation ethanol [2,3,14,15,16,17,18,19]. Studies regarding the use of these seaweeds in biofuel production are still incipient [4], although the available assessments indicate that seaweeds present a large production potential for this purpose [3,4,14,15,16,19,20,21,22,23]. These studies also pointed out that this activity has the potential to become a technological alternative that may play a relevant role in the world market of liquid biofuels. This alternative adheres to the distribution infrastructure used in the conventional liquid fuels and end-use technologies market, and can be introduced and maintained with minor adjustments, without, therefore, adding significant costs to the distribution process. In this environment, seaweed cultivation for biofuel production is becoming increasingly important as the demand for “environmentally friendly sources” to be used to ensure the growing demand for liquid fuels tends to increase. This is because, according to the United Nations (UN), the current population exceeds 7.6 billion people on the planet, with an estimated nine billion by 2050, which will increasingly cause greater food, transport, liquid fuels and electricity supply demands [24]. Therefore, the share of fuels produced from renewable sources tends to increase in the global energy matrix [4]. In this sense, seaweeds represent competitive attractors for biofuel production compared to other biomass sources, since they compete with food production, use of arable land and rely on water, fertilizers and pesticides [25]. Given these advantages, seaweed, a promising source of raw material for the production of third generation biofuels, is considered a potential raw material for large-scale bioethanol production [4].
In the Brazilian Northeast, and especially in the state of Rio Grande do Norte (RN), the subject of this study, commercial marine seaweed exploitation began in the 1970s [8,9,10], where a commercial network was developed for the exploitation of agarophyte and carrageenan, which played an important role in the economics of coastal populations [9,10]. Until the mid-1970s, a representative part of this population, driven by the economic attractiveness registered at the time, found an income supplement in harvesting seaweed of industrial interest, in addition to other activities, such as fishing [9,10].
Seaweed harvesting still persists in coastal communities along the coast of RN as a secondary activity, in the municipalities of Extremoz and Rio do Fogo, aimed at the commercial cultivation of red Gracilaria seaweed through two farmers’ associations [26].
Among the main conditioning factors regarding full algaculture development, the selection of potential cultivation areas is one of the themes considered as essential for aquaculture production sustainability. Several factors are taken into consideration for area selection, including the environmental and socioeconomic attributes of potential areas [27,28,29]. In the case of marine seaweed cultivation, some of the analyzed criteria are paramount, such as the existence and conditions of coastal areas sheltered from winds, currents and waves, the proximity of seaweed banks and the road infrastructure for production outlets and markets, among others [30].
Several studies aimed to point out essential area selection criteria using physical, social and infrastructure data [27,28,30,31]. These studies generally employed area selection factors based on technical attributes, which qualify areas that may house crop structures, neglecting other parameters such as socioeconomic and environmental factors and, therefore, the local vulnerabilities linked to these parameters.
The expansion of algaculture activities on the Brazilian coast requires the mapping of suitable areas that do not compete with other local activities, such as fishing, tourism and navigation. The use of these areas should not lead to negative impacts on the social dynamics of communities, as well as on the local environment. When weighing only physical criteria, [30] a selection, sizing and hierarchization study of the most suitable spaces identified a 2232.20 ha area suitable for the cultivation of the C. birdiae seaweed, on the eastern coast of the state of RN, Brazil.
In this context, this paper incorporates social and environmental sustainability indicators into a model applied for the selection of suitable C. birdiae seaweed cultivation areas developed by [29]. Therefore, this study aims to evaluate the potentialities of the cultivation of this seaweed from the inclusion of these indicators on the eastern coast of RN, estimating areas recommended as appropriate, as well as the potential for biomass production, including annual bioproduct production potential.

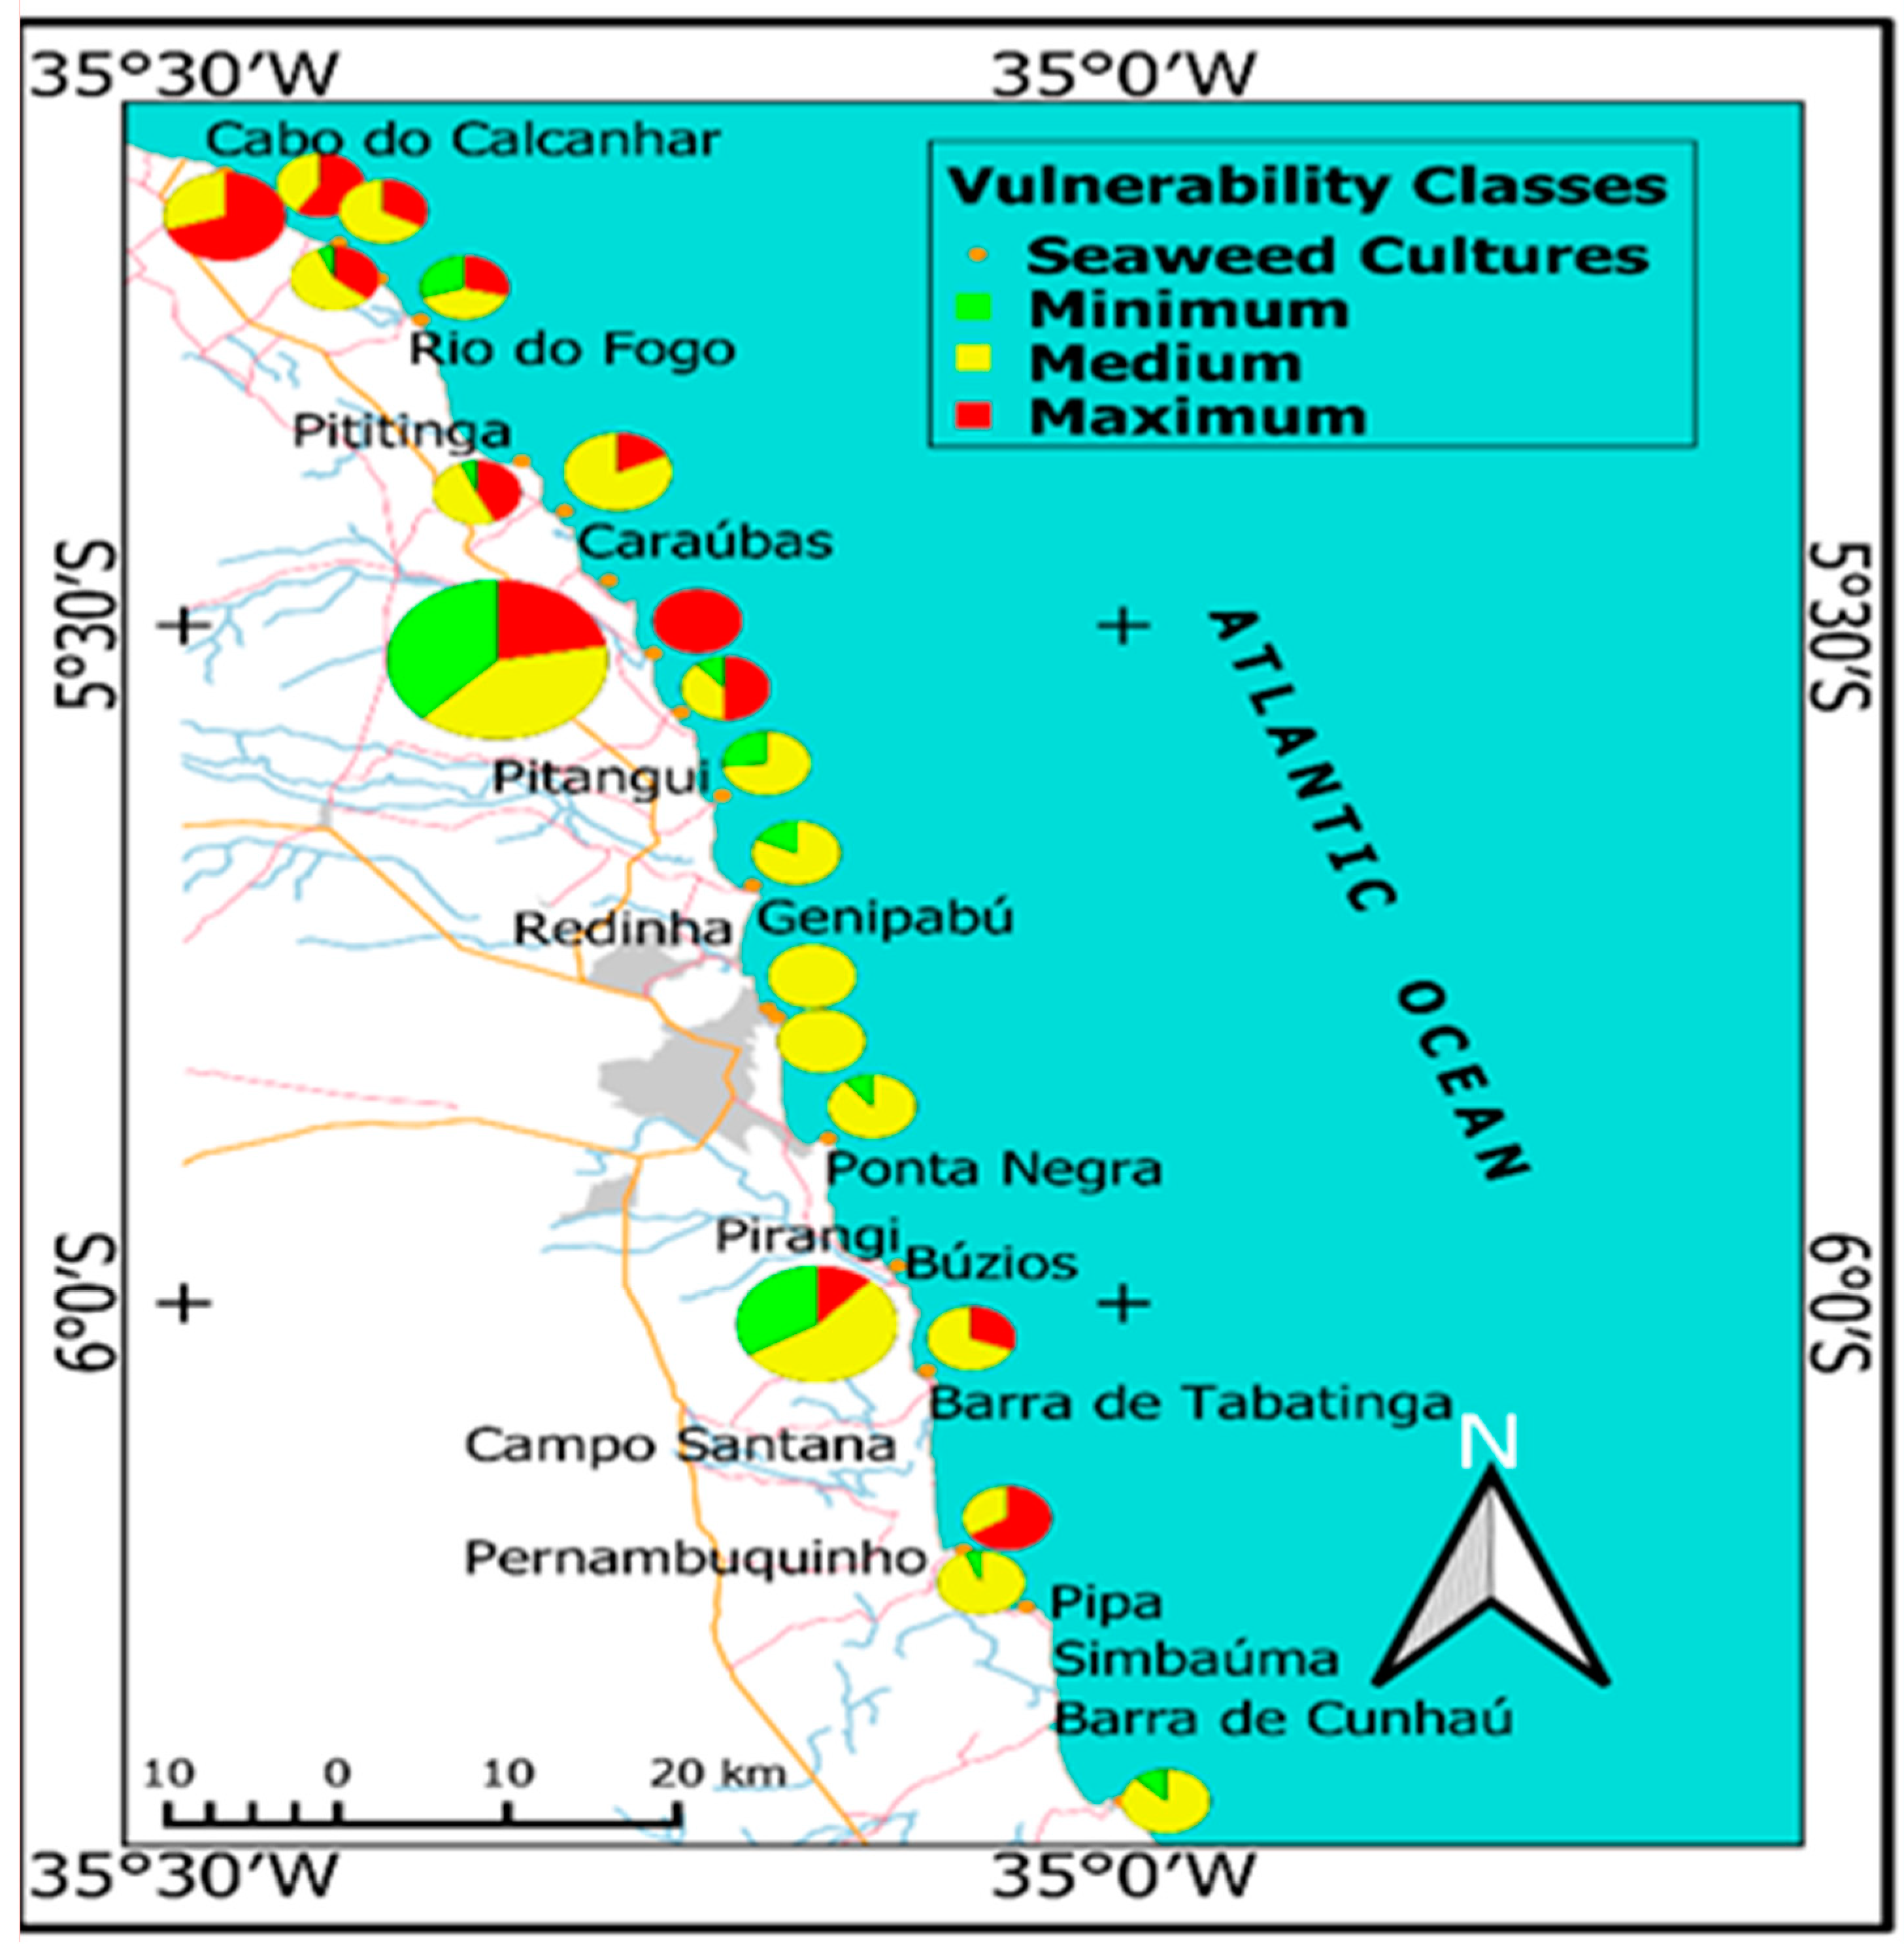
2. Study Object Characterization
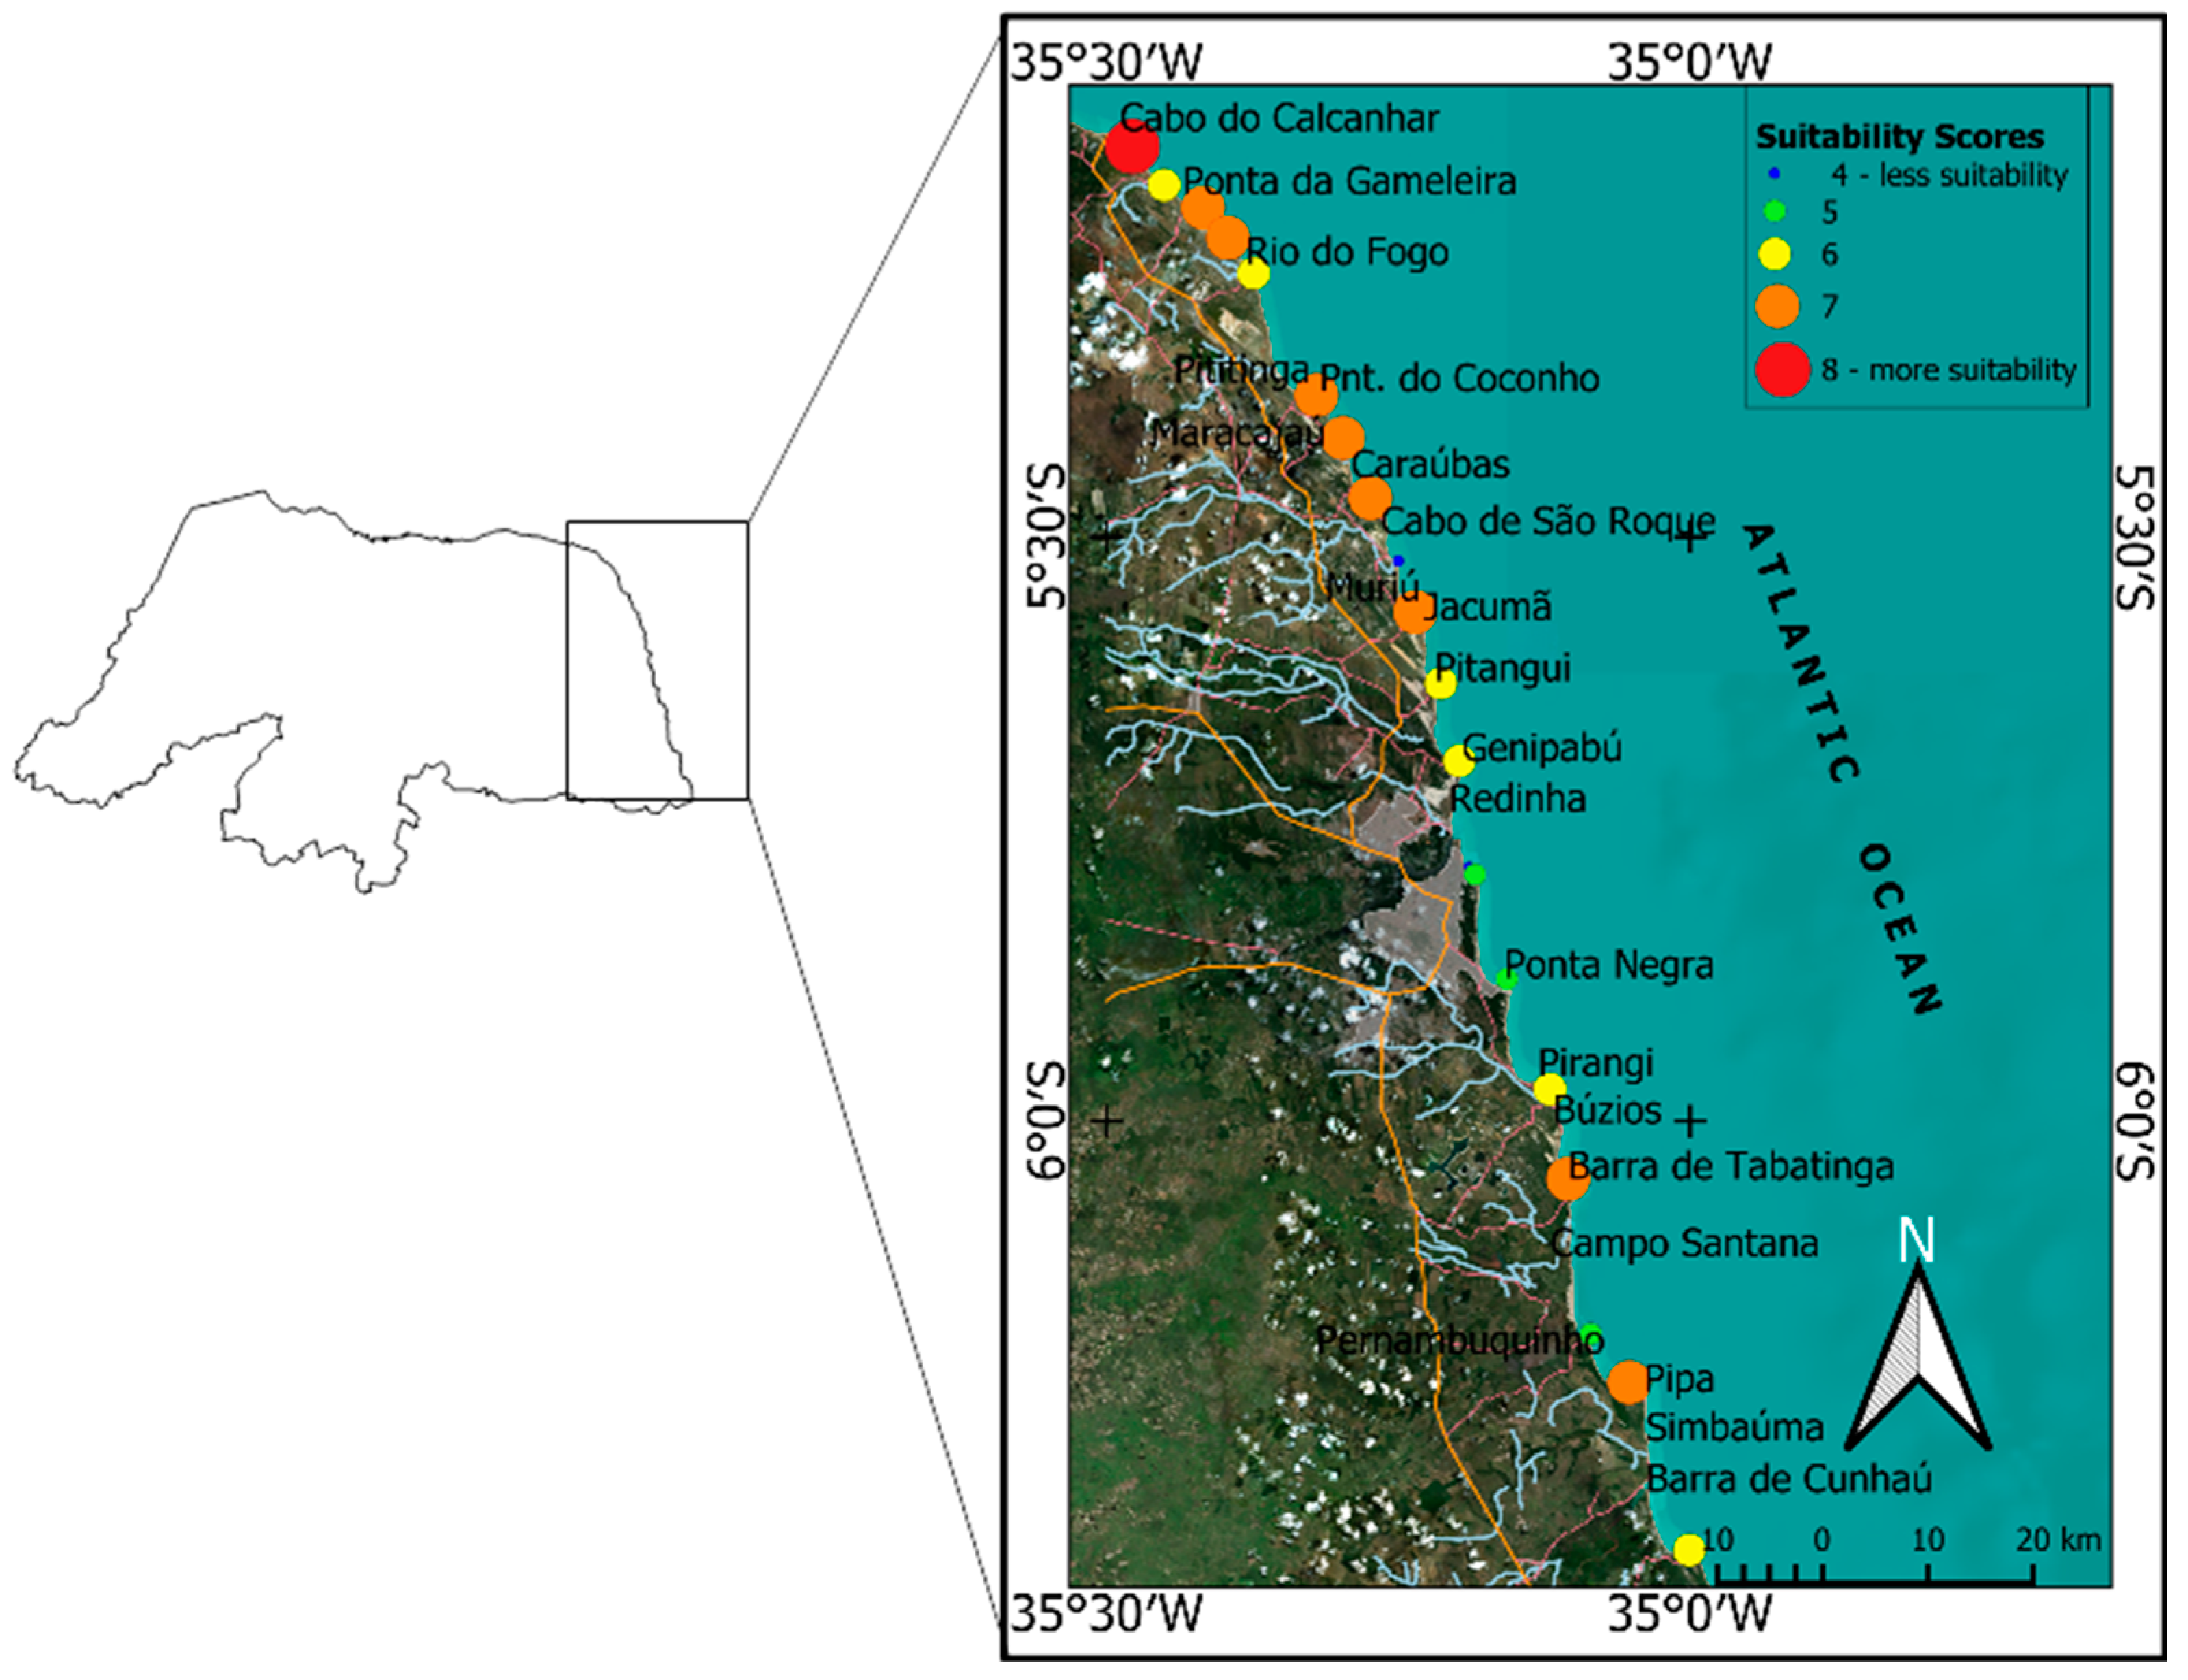
Study Area

Brazil has an 8000 km coastline, lying between the mouths of the Oiapoque (04°52′45″N) and Chuí (33°45′10″S) rivers. The Brazilian coast features warm waters on the northern and northeastern coasts and cold waters on the southeastern and southern coasts, housing a wide variety of ecosystems, including reefs, sandy beaches, rocky shores, estuaries and mangroves, which contain numerous flora and fauna species [32,33].
In Brazil, marine seaweed occurs along the coast, but is more diverse and abundant in the northeast. The seaweed exuberance in this region is mainly related to favorable temperatures, salinities and light conditions, as well as rocky substrates and suitable reefs for their establishment and growth [10,34].
The absence of large rivers and the predominance of warm waters from the equatorial stream provide an adequate environment for reef formation, with a considerable biological diversity on the northeastern coast [10,35]. Given its tropical location, the environmental parameters of the northeastern region are relatively constant, without major changes throughout the year, with a 12:12 h photoperiod, a tide that ranges from 0.0 to 2.9 m and two distinct seasons, a rainy season from March to July and a dry season for the rest of the year [10].
The state of Rio Grande do Norte (RN) is located in northeastern Brazil, comprising 53,077.3 km2, occupying 3.41% of the northeastern region and approximately 0.62% of the entire national territory. The state is located in the southern western hemisphere and its extreme points are limited by the Greenwich 4°50′ and 7°20′ south latitude parallels and the 34°58′ and 35°36′ west longitude meridians [36] (Figure 1).
The state’s coast is characterized by coral reefs, highly diverse environments presenting significant ecological, economic and social importance [10]. In some areas, reefs extend along a long strip parallel to the coast, providing effective protection against wave action, which greatly favors the development of different seaweed species [30].
The RN coast comprises a small jagged coastline, 410 km long [35]. It is divided into two sectors, eastern and northern, depending on the geographical location, which allow a preferential coastline direction in the north–south direction for the eastern sector and east–west direction for the northern sector, associated with climatic and tectonic differences which, in turn, influence the wind direction regime and ocean circulation pattern that, together, shape the state coast [35]. The winds that pass through the state come predominantly from the south-easy quadrant, with speeds ranging between 3.8 and 5 m/s at the state capital (Natal) station, generating a coastal drift that transports sediments from south to north almost all year round [35].
The eastern coastal sector of the state is 166 km long, representing 41% of the state’s coast, with a predominance of sandy, flat and narrow beaches and warm, humid tropical weather. The northern sector is 244 km long, representing 59% of the state’s coast, with a predominance of sandy beaches and a warm, dry or semi-arid tropical climate [35,37].
The area investigated in this study comprises the eastern portion of RN’s coast, limited to the south by Sagi Beach, in the Baía Formosa municipality (which borders the state of Paraíba (PB)) and to the north by Cabo Calcanhar, in the municipality of Touros (Rio Grande do Norte). This area is spread over 101 km (61%) comprising flat, narrow sandy beaches and 65 km (39%) consisting of active cliffs, i.e., coastal boards of barrier formation that reach the sea. The area also presents itself as a coastal plain intersected by wave-dominated estuaries and structurally presenting zeta-shaped coves [38] (Figure 1).
Two commercial C. birdiae seaweed crops are present in the study area, at two artisanal fishing communities located at the Rio do Fogo and Pitangui beaches, at the Rio do Fogo municipality and Extremoz municipality, respectively.
Cultivation at Pitangui beach, located 25 km from the state capital, is carried out approximately 100 m from the beach line, at an approximate bathymetric depth of 3 m, occupying 4 ha, belonging to the Pitangui Algae Mariculture and Beneficiation Association (AMBAP). Cultivation at the Rio do Fogo beach, 70 km from Natal, occupies 1 ha, is located 190 m from the coast and belongs to the Rio do Fogo Mariculturists Association (AMAR).

3. Methods

3.1. Crop Area Selection Criteria

Sousa et al. [30] mapped the entire RN coast, totaling 3316.82 ha, with potential for C. birdiae cultivation. A total of 94.6% of the assessed area (3137.64 ha) was considered highly adequate or adequate, while 4.4% was evaluated as inadequate. A total of 2232.20 ha are located on the eastern RN coast, which were assessed in the present study.
The area classification carried out by [30] considered as a selection parameter coastal areas sheltered from waves and currents, with depths ranging between 1.0 and 3.0 m. A Hierarchical Analysis Process (AHP) of the cultivation variables was used to conduct a spatial analysis, where the variables were evaluated by means of a paired comparison matrix on a continuous scale, from the least important (1/9, 1/7, 1 / 5… 1/2) to the most important variables (1, 2, 3… 9).
Table 1 expresses the Pairwise Comparison Matrix (PCM) used to assess the relative importance of the parameters applied for seaweed cultivation in RN. The weights of each variable as a crop evaluation criterion were generated and used as weighting factors for the crop potentiality of each selected area.
The resulting image from this analysis (Figure 2) derives from an eight-level classification, ranging from the most appropriate area (level 8) to the least appropriate (level 1). The combination of all physical, social and infrastructure seaweed cultivation parameters indicates that 53.67% of the analyzed areas were classified by the authors as 8 and 7 (highly adequate), 40.93% as 6 and 5 (moderately adequate) and only 5.40% of the regions received a score of 4 (inadequate). Figure 2 displays the selection and hierarchization of potential C. birdiae seaweed production areas on the RN coast, obtained from values reported by [30].
The multicriteria evaluation (MCE) used to identify appropriate seaweed development areas by [30] applied variables considered essential for seaweed cultivation. According to the authors, the variables with the highest weights in determining cultivation potential were the distance from cultivation sites to urban areas, the distance from the main city, the distance from the market and the distance from estuaries. The lowest weights were assigned to the distance from the districts, roads, sheltered coasts and seaweed banks.
This assessment also incorporates social and environmental vulnerability indicators as criteria used to consider the sustainability level of the identified areas. Figure 3 summarizes the modeling process applied in the present study.

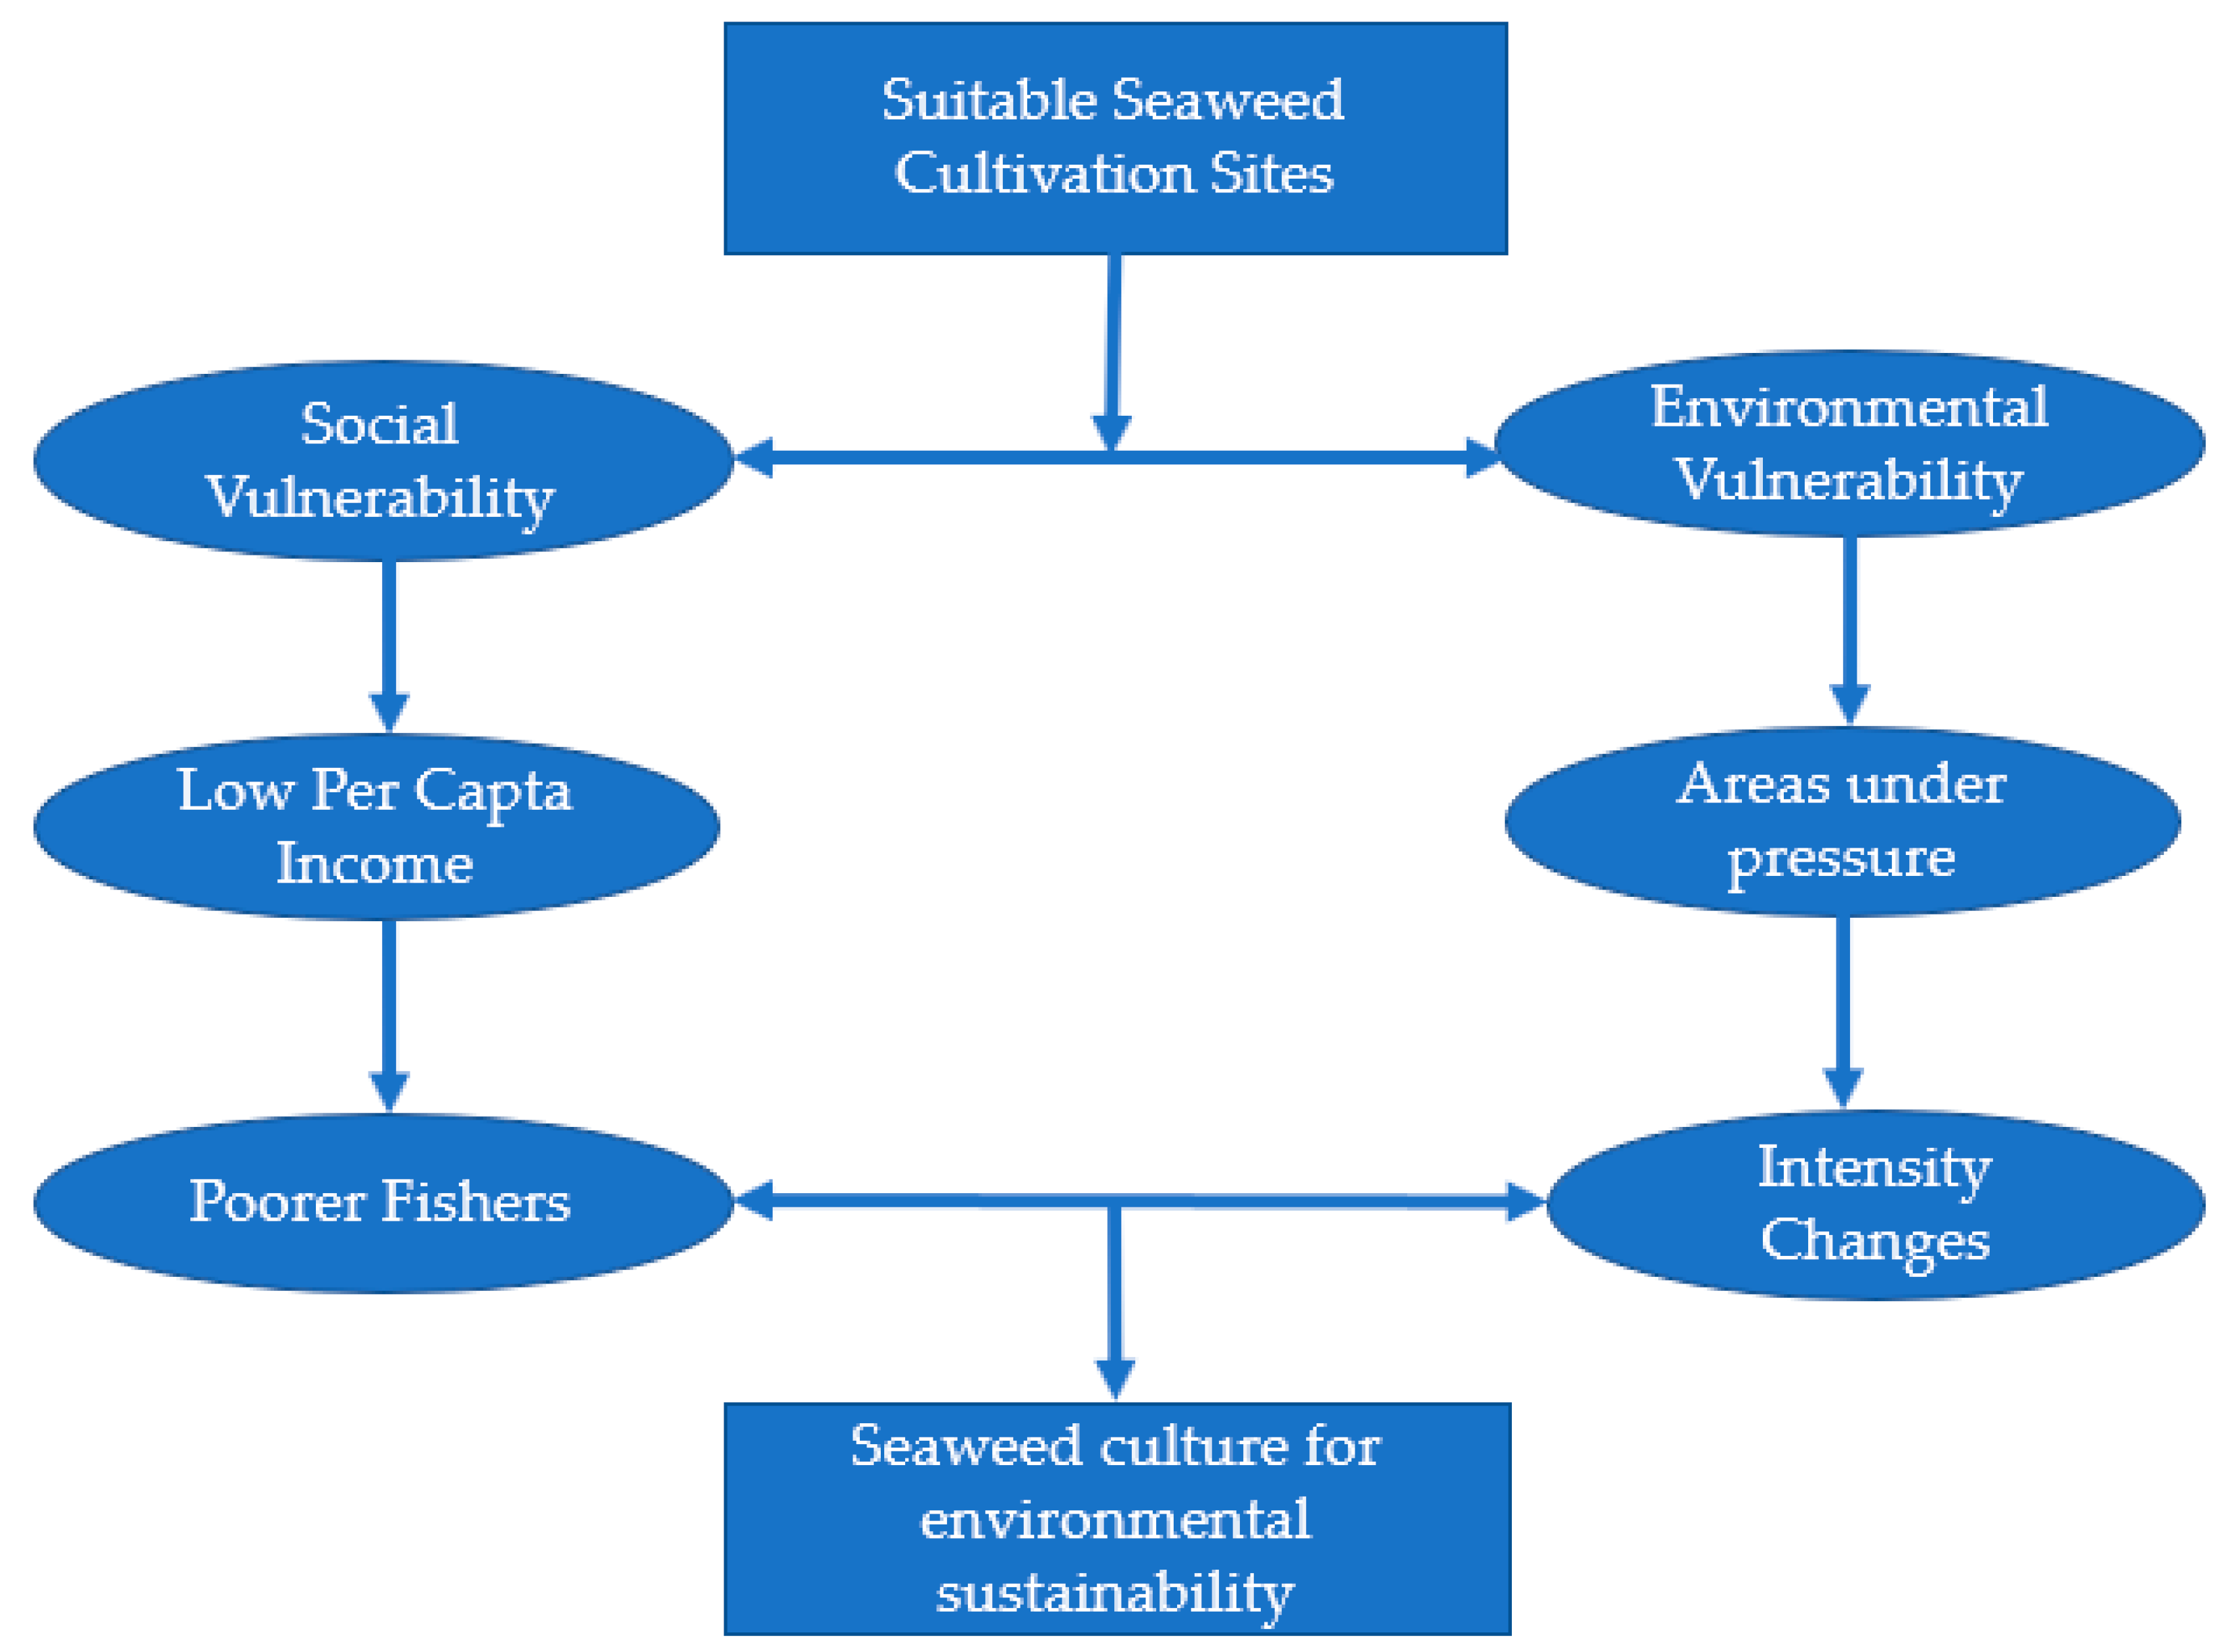
3.1.1. Social and Environmental Vulnerability Indicators

A change detection analysis using remote temporal sensing data was applied to identify social and environmental vulnerability areas [39]. In this approach, areas were classified based on detected change levels, where those with the highest change levels are classified as “most vulnerable”, while areas with the lowest or most stable change levels are considered “less vulnerable”.
Two scenes from the Landsat satellite point and orbit (214/064) ETM+ sensor from 4 August 2001 and OLI sensor from 23 August 2017, with a spatial resolution of 30m, were used for the change detection analysis. The Landsat 7/s ETM+ band 3 and Landsat 8’s OLI band 4 correspond to the red visible spectrum band [40]. This portion of the spectrum is capable of detecting a wide range of water, rock, soil, vegetation and urban area reflection behaviors. The comparison of the assessed scenes, on a timescale, was used to detect changes in environmental compartments [41].
Landsat 7 and 8 orbital images were pre-processed at the L2 level, subjected to atmospheric corrections and made available on the USGS/Earth Explorer web site. However, other parameters such as sensor life may lead to target reflectance pattern variations when images are compared at different times. The most applied digital orbital image processing technique to remove these variations is principal component analysis (PCA) [42,43]. In this case, Landsat 7 ETM+ band 3 and Landsat 8 OLI band 04 were combined/fused, and two principal components (PC) were extracted. The first PC accounts for the highest variance and auto correlation between the bands, indicating behavioral spectral response similarities between them. The second component was used as the shift detection image, as it describes reflectance variances not correlated between the analyzed bands.
The image of the second PC was classified into change levels, and the frequency histogram of the pixel value classes was categorized into four parts, in order to identify normal modification variations that characterize the most pronounced changes [43]. Thus, the values between the mean and the standard deviation (X ± SD) were classified as normal variations occurring between 2001 and 2017. On the other hand, values within the limits between X ± SD and X ± 2SD were classified as the first level of change (soft changes), while values between X ± 2SD up to the extremes (maximum and minimum value) were classified as the second level of change (extreme changes).
In this case, the cost distance algorithm displayed a coefficient of friction inversely proportional to the vulnerability class, with a coefficient of friction of 1.0 applied to areas within the 2nd limit of accentuated changes and of 2.0 to areas falling below this limit, located within the 1st limit of sharp changes. A coefficient of friction of 10.0 was applied to other regions that do not comprise any vulnerable areas.
The classified image of the second PC was used to produce an environmental vulnerability map, excluding normal variation classes and maintaining only accentuated change classes. Each accentuated change class was taken into account to produce a cost distance surface (CDS), with greater weight being given to crop areas located near the most vulnerable or most intense areas of change. Figure 4 displays the hypothetical CDS from areas presenting mild change (A) to those displaying extreme changes (B), i.e., areas ranging from minor to greatest vulnerability, located near crop areas 1, 2 and 3. Dark red tones refer to the shortest distances from the most vulnerable areas (B) with lowest coefficient of friction, light red tones (A) with the highest coefficient of friction), while blue tones (farthest from areas A and B) have the maximum coefficient of friction. Crop area 2 presents lower friction and distance costs for A and B, area 1 presents greater friction than area 2, and area 3 presents greater friction than areas 1 and 2.
This procedure allowed for the development of a CDS between the environmental vulnerability areas and the areas with the highest weight and lower coefficient of friction and, consequently, lower distance cost, closer to areas that underwent the most changes between 2001 and 2017. The IDRISI Selva software was used to produce the distance cost map.
This scenario is based on the premise that cultivated areas close to areas presenting greater environmental vulnerability lead to change pressures concerning local populations, such as coastal erosion, deforestation, dune movements and increased urbanization in coastal areas, among others, being thus subject to more intense changes, favoring seaweed cultivation activities. This, in turn, gives this activity a greater weight regarding the promotion of local sustainability, through the mitigation of social and environmental impacts, fixing fishing populations that use seaweed cultivation as a source of income (Figure 3).
It should be noted that coastal populations which are potentially available for seaweed cultivation lack the cultural and financial capital that favors their access to credit and technical assistance, and thus are vulnerable to market dictation.
Significant migrations from inland to coastal populations, motivated by new jobs and income opportunities, where tourism is strongly attractive, have intensified social conflicts caused by the region’s socioeconomic vulnerability, further deteriorating the living conditions of communities, and contributing to the progressive depletion of seaweed banks and fishing stocks.
The lack of proper management also contributes to the extinction of natural algae banks, which makes it imperative, in an incentive process for algaculture, to implement experimental crops oriented to act as a practical aid and technical support for the development and implementation of family farms and the restoration of natural banks.
Therefore, it is essential to minimize the risks and maximize the gains from the promotion of algae cultivation in the study area, to design public policy oriented to the generation of employment, income, and settlement of the populations in the coastal areas. These demands must be aligned with the socio-economic and environmental demands of this activity.
Another crop sustainability criterion applied herein consisted in the social condition of local populations. Therefore, the main indicator used in this case was per capita family income or household income. Income distribution allows for the evaluation of how wealth distribution occurs, and the population’s access conditions to goods and services. In Brazil, the most vulnerable population in terms of family or household income are those who earn less than the national minimum wage—about USD 250.00, based on June 2019—established as necessary to maintain a family of four [44]. Data on household incomes were obtained from the Brazilian Institute of Geography and Statistics (IBGE) [45].
The vector point file used to identify the populations and their family income was spatialized by the Voronoi triangulation method, widely used for data or social phenomena decomposition [46] of a given space. The generated polygons were converted from vector to matrix form, generating a continuous family income surface of localities near the cultivation areas.

3.1.2. Social and Environmental Sustainability Indicators

The cost distance surface (CDS) image of the areas presenting the highest change intensity, i.e., the most environmentally vulnerable, were standardized on a scale from 0 to 255 by a monotonically (gradually) decreasing linear function. To this end, a value of 255 was considered for the most vulnerable areas near the cultivation areas, and was continuously reduced to areas 5 km away, reaching the lowest value of 0. This distance parameter considered the possibility for community access to potential cultivation areas up to 5 km away from the fishing community. In these terms, greater distances result in the restriction of fishing community access to the cultivation sites. The images referring to the continuous surface of community family income, i.e., crop areas close to the fishing communities according to family income, were also standardized from 0 to 255 by a decreasing linear monotonic function. The values were scaled from 255, from an income of USD 250.00 or less. For incomes of over USD 250, values were usually close to 0.
The standardized images were combined to obtain a weighted average, and the same weights were applied to both the environmental and social vulnerability image (0.5). The resulting image consisted of a surface with values ranging from 0 to 255, where values closer to or equal to “255” indicate areas presenting greater social and environmental vulnerability, while values close to or equal to “0” indicate lower vulnerability areas.
The production of the socio-environmental sustainability map for seaweed cultivation was based on a reclassification of the values ranging from 0 to 255 in the resulting image into eight classes. The overlap of the classified image with the crop areas delimited by [30] and their potentiality classes allowed for the identification and proportional quantification within the cultivation areas through a cross classification, to indicate areas with greater social and environmental sustainability conditions in relation to the contiguous cultivation area. This assessment demonstrated that [30] indicated contiguous potentiality areas displaying different sustainability level potentialities.
The quantification of these cross-classification areas allowed for the incorporation of an economic and environmental appeal of the productive potential of each area into the analysis. Thus, it was assumed that local populations tend to integrate more with seaweed cultivation in greater sustainability attractiveness areas, due to the expectation that this activity will lead to employment and income generation for local communities, as well as promote the mitigation of the environmental impacts registered in these areas, already classified as more susceptible to anthropic and natural changes.
The assumption assumed demands for its materialization that communities can have access to training programs in the technical, economic-financial and environmental areas, as well as technical assistance. It is also noteworthy that Brazil continues to record conflicts related to the ownership and use of its lands, which makes it necessary to structure a legal rule that guarantees local populations full access and use of the areas necessary for the activity of algaculture.

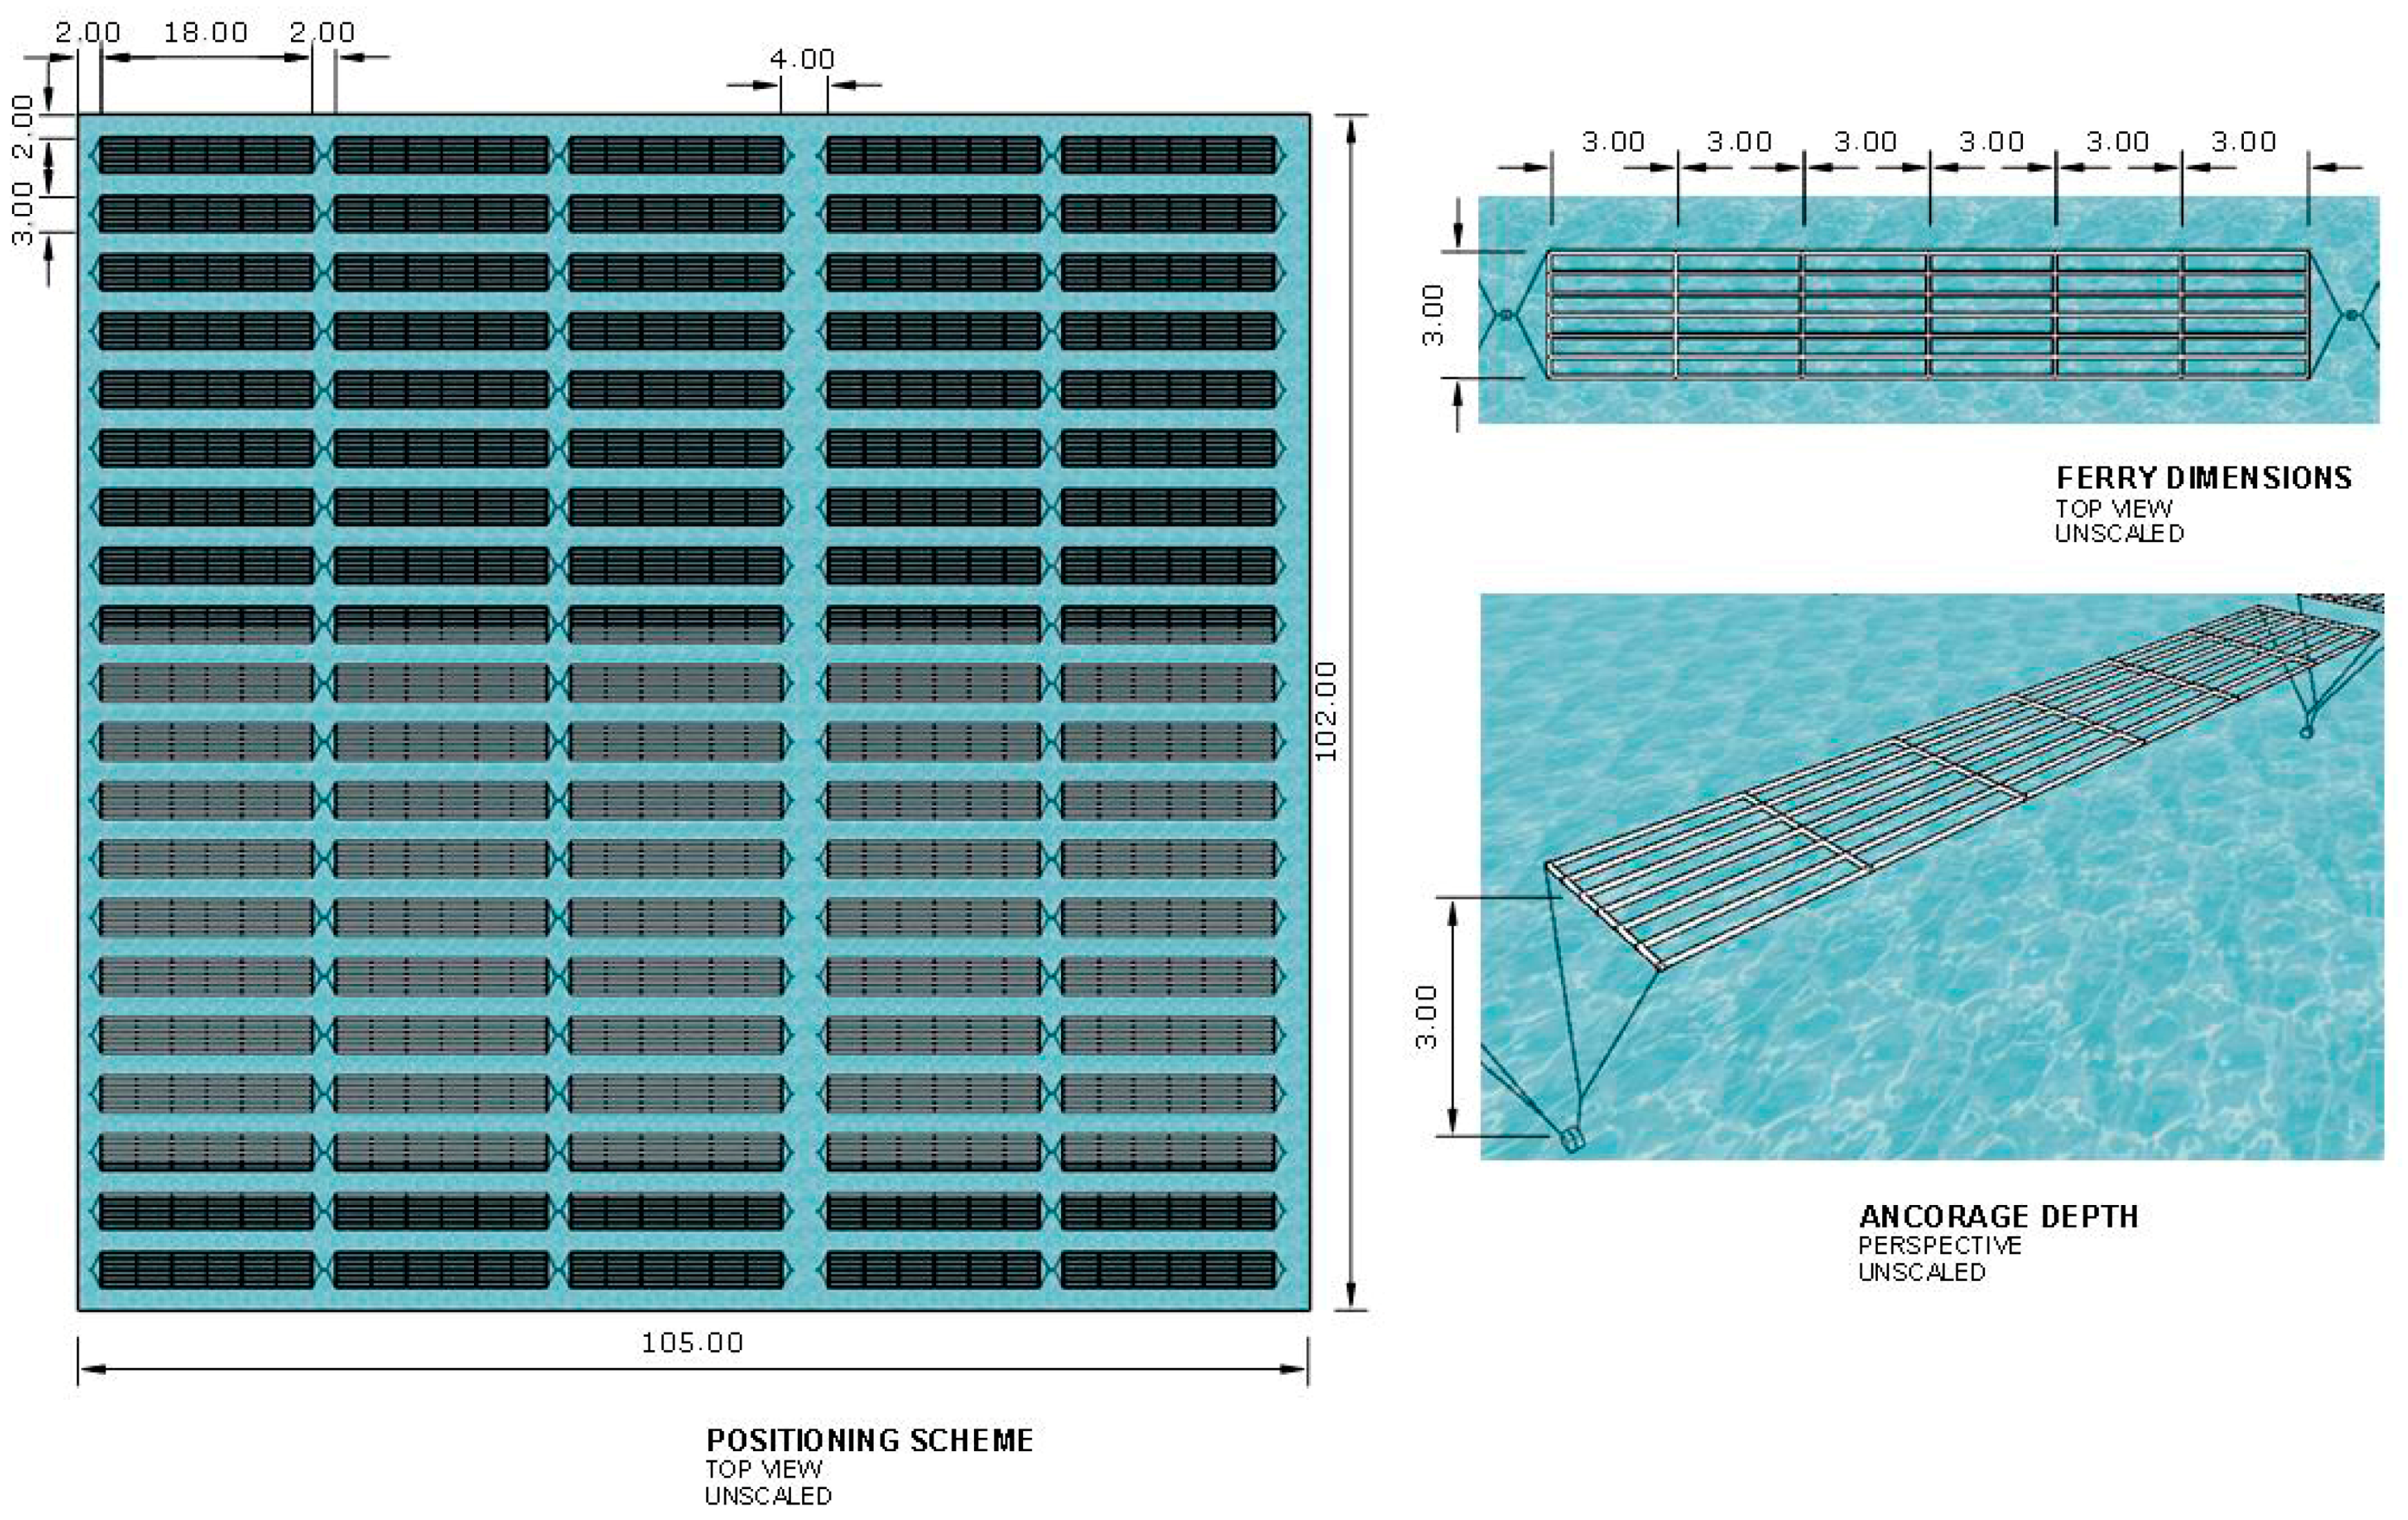
3.2. Potential Seaweed Biomass Production Estimation

Crassiphycus birdiae cultivation is widespread and various methods are applied in this regard. These seaweeds may be grown vegetatively (i) in open waters at the bottom of bays, estuaries or reefs; (ii) on lines, ropes or nets; (iii) in lagoons; or (iv) in tanks, with the first three being the most widely applied [7].
Estimates concerning seaweed biomass production potential as t/hectare/year used the planting system carried out in Pitangui Beach/RN as a reference, according to [44], where cultivation is carried out through the use of a Modular Ferry System (MFS). Each ferry measures 18 x 3 meters, formed by six 3 x 3 meters modules. Six tubular nets that accommodate the seaweed for growth and subsequent collection are set in each module. The rafts are constructed with PVC pipes with lids (floatable structures), 8 mm nylon ropes, 6 mm silk ropes, tubular nets, and the floating raft’s fastening structure consists of an anchor made of recycled tires and concrete.
One ferry has an estimated production potential of 146 kg of fresh biomass per production cycle. Considering the area occupied by a raft (54 m2) and the area required for seaweed management (at a 2 m spacing between rafts), one hectare allows for the installation of 100 rafts, occupying a planting area of 5400 m2. This may produce up to 14.6 t of fresh biomass per cultivation cycle. Considering the real possibility of carrying out six cultivation cycles per year, the estimated yield potential in this system is of 87.6 t/ha/year [44]. Figure 5 displays the MFS structure applied to crop areas installed at Pitangui Beach and used as a reference for the estimates carried out herein.
The MFS used as a basis for the biomass production potential estimates was justified by the fact that this system presents low manufacturing and maintenance costs and is easy to install. This cultivation system has been traditionally used on RN’s eastern and northern coasts [47], a region with low HDI and low per capita family income, which translates into high social vulnerability. Thus, the MFS is widely accepted due to its attractiveness concerning employment and income generation in seaweed cultivation areas, as observed at Pitangui and Rio do Fogo.

3.3. Bioproduct Productive Potential Estimates

3.3.1. Bioethanol

The bioethanol production estimate considers the biomass to be obtained from the calculation of its productive potential, as defined in item 3.2. The bioethanol volumes that can be obtained through Crassiphycus birdiae cultivation are from [44], calculated when developing a hydrolysis methodological process for bioethanol production. Considering the 58% efficiency obtained in the fermentation process, [44] estimated the equivalent of 360 liters of ethanol extracted from one ton of residual biomass, i.e., fermentable mass, composed of polysaccharides to be hydrolyzed and fermented.
The residual biomass is obtained by drying the fresh biomass, at a ratio of 1 t of fresh biomass to 0.1 t in the dry form. The dry form (resulting from sun drying) still contains 20%–25% water, which requires the use of a greenhouse or other drying method to complete the total dehydration process, resulting results in 0.08 t of dehydrated biomass [44]. The volume of dehydrated biomass contains 0.03 t of fermentable polysaccharides. Thus, one ton of residual biomass requires 33.33 t of fresh seaweed. In contrast, one tonne of fresh biomass can generate 10.8 l of ethanol by the process developed by [44].

3.3.2. Biofertilizer

Biofertilizer extraction from seaweed is carried out through a crushing process, followed by filtering of the fresh biomass. Thus, the productive potential is estimated from the offered biomass as defined in item 3.2. [48] reported that biofertilizer production yields vary according to the extraction conditions and red seaweed species, reaching 70% per kilo of fresh seaweed for the strains adapted to Brazil. The practice performed in the Pitangui cultivation area by AMBAP results in the use of 50% of the fresh weight biomass. Thus, this value was used to obtain the estimates calculated out herein.

3.3.3. Agar

Agar is a seaweed cell wall biopolymer that can be extracted from several red seaweed species belonging to the Rhodophyta class [1], with the Gelidium and Gracilaria genera as the most explored sources in this regard [7].
Agar extraction is carried out by washing the seaweed to remove adhered impurities, and then immersing and heating the entire biomass in water. The agar dissolves in water and the resulting mixture is then filtered to remove any remaining residues. The warm mixture, termed "the filtrate", is then cooled to a gel (gelatin). Because the gel is highly demanded by the food industry, this bioproduct has a high commercial value [7]. The agar is offered in different forms—powder, flakes, bars and threads—which are used according to the final product destination [7].
Rhodophyta phylum seaweed requires pretreatment to potentiate gel production, through different processes, including alkaline, hot or cold, acid or acid followed by CaCl2 addition pretreatments [49]. Alkaline pretreatment leads to a chemical alteration on Crassiphycus agar, resulting in a high “gel power” product [7]. In the absence of this pretreatment, most Gracilaria species produce an agar with a low commercially attractive gel strength. [7].
Rhodophyta agar extraction yields through alkaline pretreatment have been reported as ranging from 22% to 47% [47,49]. This variation reflects the influence of climate and environmental parameters alterations [7,47]. In this scenario, the productive potential of the agar is obtained by estimating the offered biomass as defined in item 3.2, considering the lower and upper yield limits given in literature references, of 22% and 47%.

4. Results and Discussion

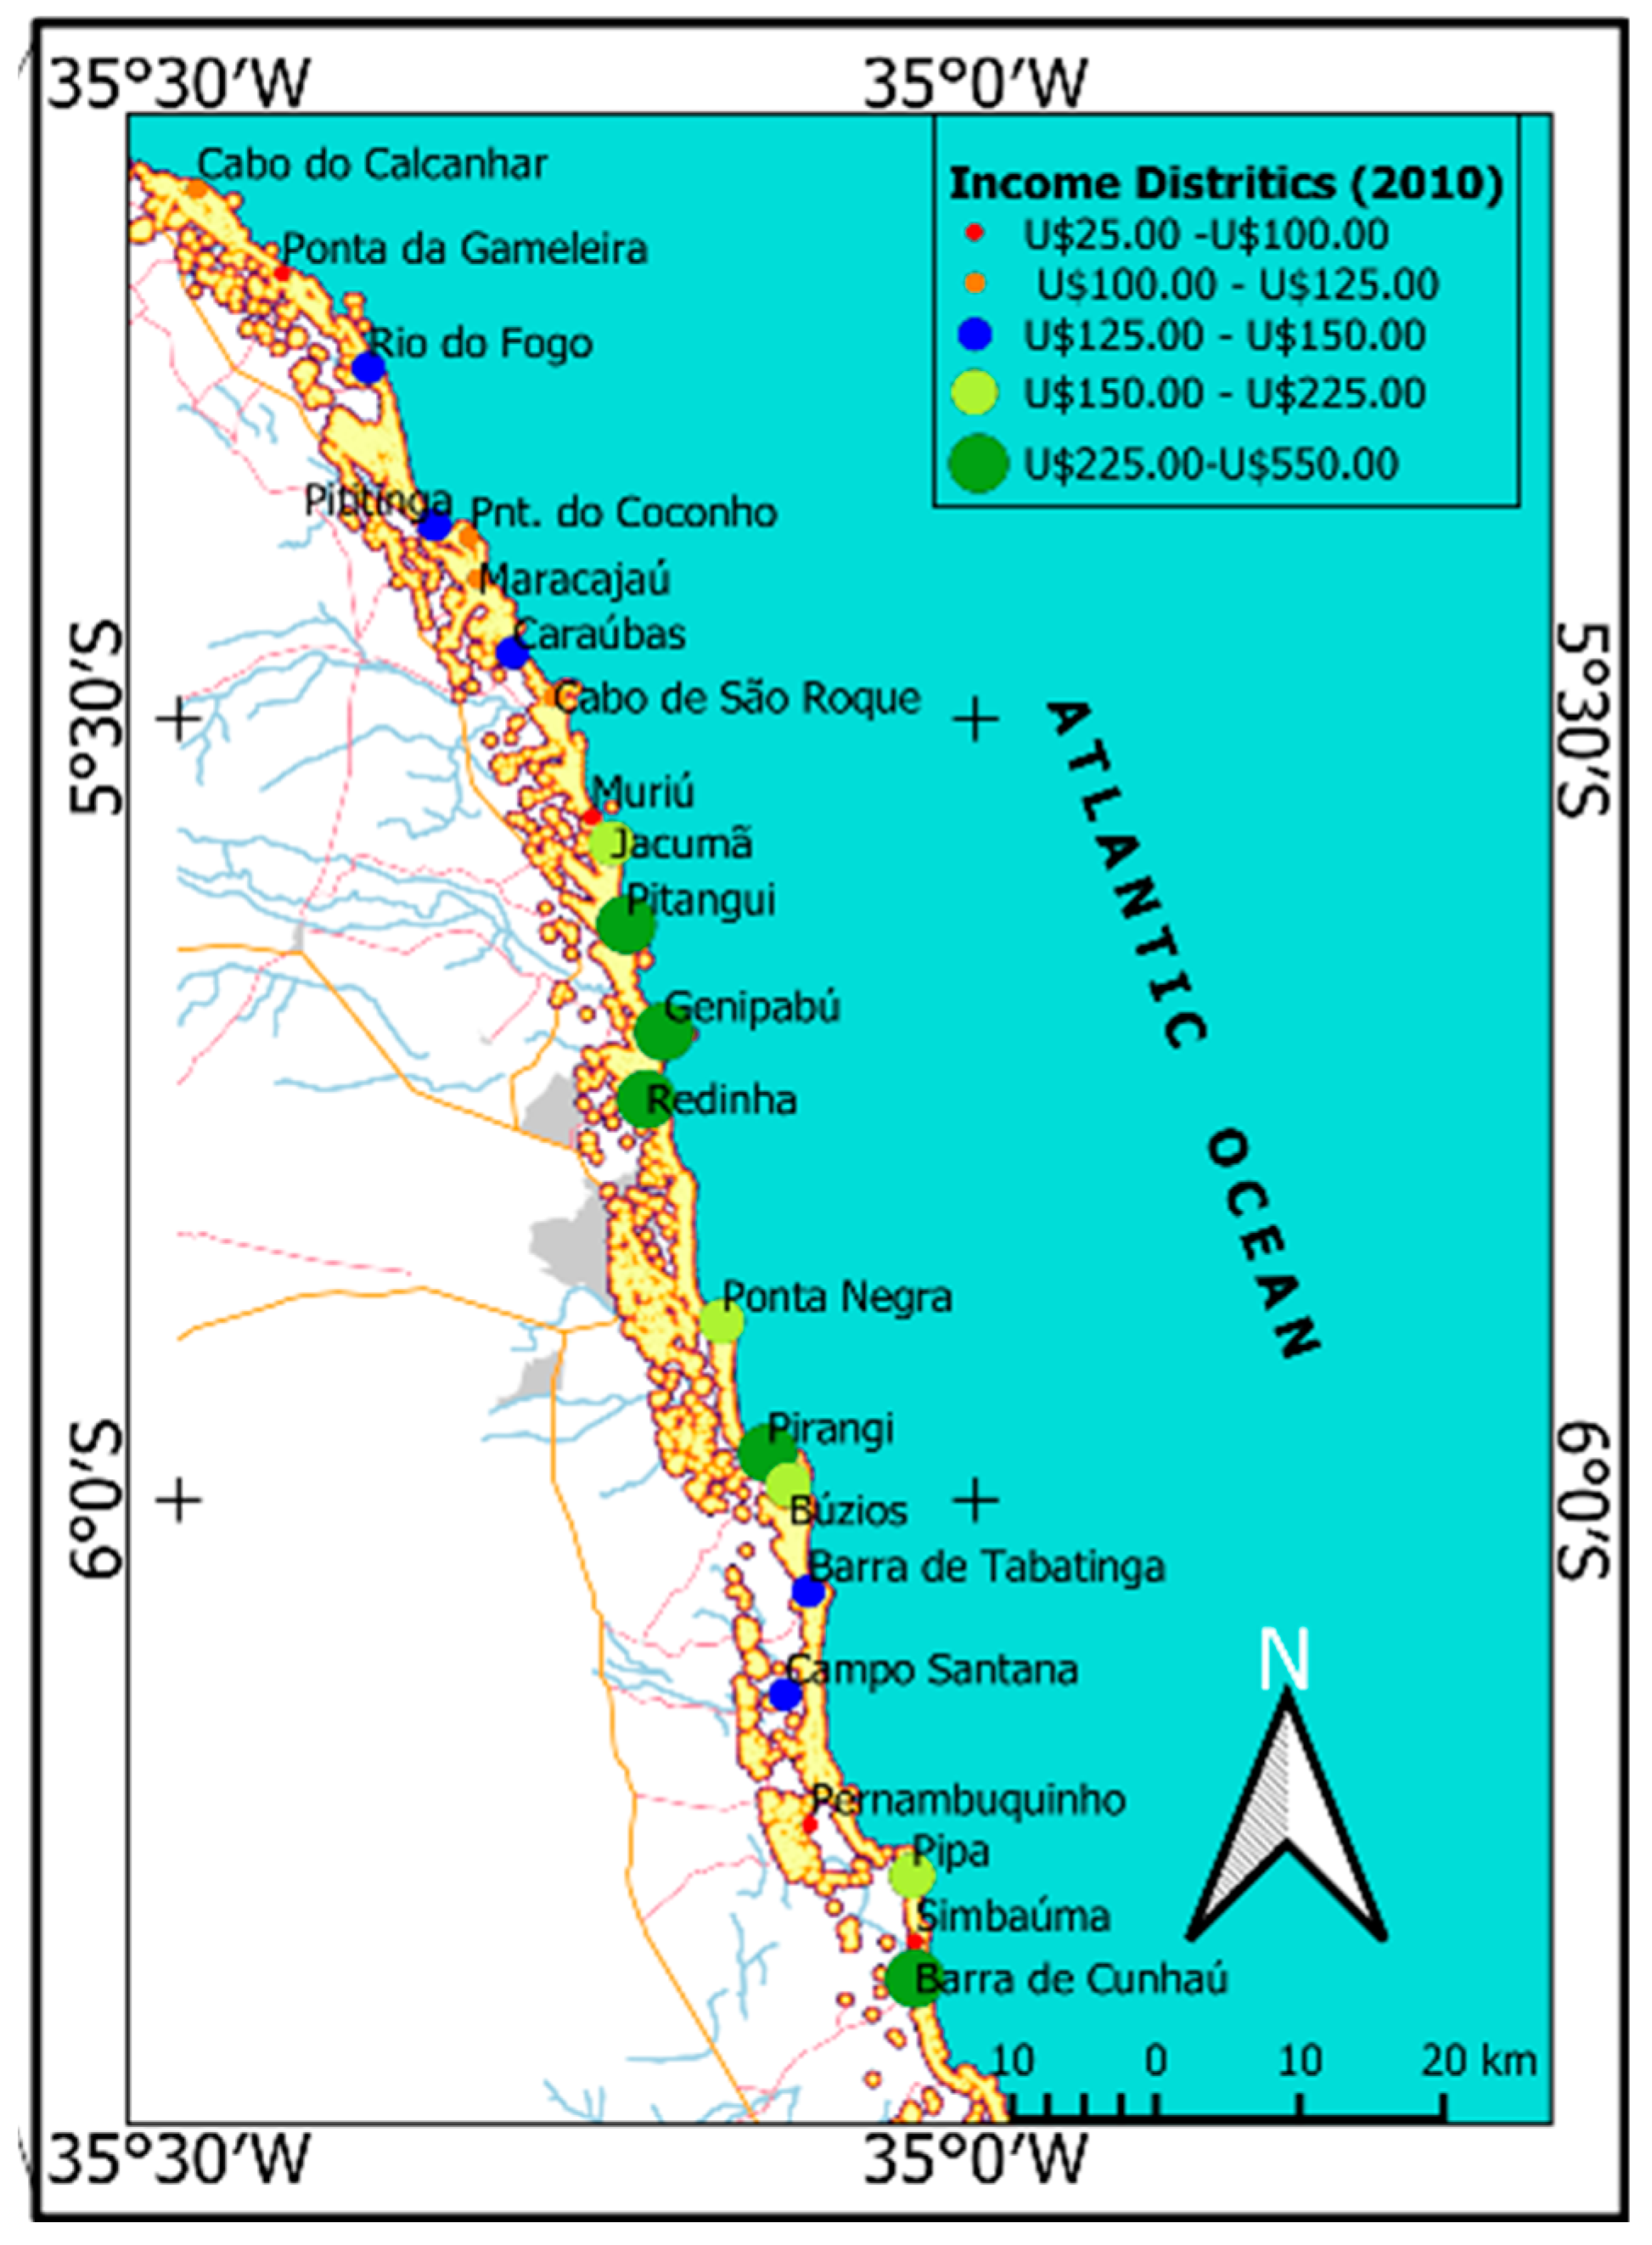
4.1. Social and Environmental Sustainability of Potential Cultivation Areas

Based on the change detection analysis of the orbital images of Landsat 7 ETM +, 4 August 2001, and Landsat 8 OLI, 23 August 2017, given by the second PC, the areas with the most significant and intense changes are located on the coastal strip, with dune fields and beach areas undergoing the most intense phenomena,
The marked changes in these areas result from the erosive process that continues to affect these spaces. These alterations, characterized herein as “environmental changes”, are due to rises in the sea level and decreased sediment input caused by anthropogenic barriers, such as disordered occupation of the beach and dune strips. In this context, the erosive process tends to worsen due to climate change [35].
Concerning social vulnerability, most of the investigated areas were classified into the family income range below the national minimum wage, ranging from 25.00 to 550.00 USD [50,51]. It is noteworthy that the fishing communities furthest from urban centers and those with the least influence of tourism activity present the lowest income values. Figure 6 presents the family income distribution of the populations living in localities close to potential cultivation areas. The yellow spots refer to the most susceptible or vulnerable areas due to environmental changes as considered in the study, registered between 2001 and 2017, in areas near potential cultivation locations.
The sustainability analysis of the potential seaweed cultivation areas indicates that areas presenting greater social and environmental vulnerability are more concentrated in the northern regions of the urban area of Natal, the state capital. In these areas, in addition to the intense erosion process of the beach strips, dunes were also occupied by large wind projects that use towers with an average height of 100 m and aerogenerators with an average power of 1.5 MW, which are reflected in the detection of the changes indicated by the orbital images. The most extreme environmental changes were concentrated in these areas. Figure 7 indicates the cultivated areas and the classifications according to the adopted social and environmental vulnerability level. Gray spots comprise urban areas.
The cross-classification of the socioenvironmental vulnerability classes with the crop suitability classes presented by [30] demonstrate that the present assessment, by adding vulnerability indicators such as family income and areas susceptible to environmental change, establishes a new productive potential arrangement scenario for cultivation areas.
Tibau do Sul, Maxaranguape, Quixaba, Ponta dos Touros, and Muriú were classified as presenting a higher cultivation potential, due to greater socio-environmental vulnerability, which suggests, based on the adopted criteria, greater potential for the engagement of local populations, as they have been unable to fit into the regional economic development process, whether in the wind industry, commerce, agriculture, or even in the tourism industry, which have not included fishing populations in their activities.
In this context, greater socioenvironmental vulnerability contributes to the expansion of the cultivation potential in a given area, since the lack of other employment opportunities makes algaculture a viable alternative.
Pipa, in the municipality of Tibau do Sul, although presenting greater cultivation potential, in terms of socio-environmental vulnerability, reflected in higher income from tourism activities, presents a restrictive variable concerning the community’s involvement in seaweed cultivation activities, leading to lower socio-environmental vulnerability and, in this scenario, lower cultivation potential. Localities near the north of the state capital, between the municipality of Ceará-Mirim/RN and Touros/RN, besides displaying the best physical and climatic conditions for seaweed cultivation, present low family incomes and significant changes in the area, thus leading to high social and environmental vulnerability. Thus, these areas are attractive concerning the promotion of sustainability, since seaweed cultivation has the capacity to promote greater community engagement, fostering employment and income. In this regard, this area comprises about 602 ha with the best cultivation indicators. Table 2 presents the areas with potential for seaweed cultivation, based on a new arrangement that considers the areas in ha classified into social and environmental vulnerability levels. The figure also presents the areas calculated by [30] in ha, using as reference polygon vectors, with the areas of the present calculated in matrix format (30x30m-Landsat pixel). Except for the highlighted discrepancies, the model applied in this study serves to update the potential levels of the areas described by [30], broadening the analysis by also considering local social and environmental determinants.

4.2. Potential Seaweed Biomass Estimated

The calculation of the estimated potential of annual algal biomass production considers the areas presented in Table 2, classified as low vulnerability (unattractive areas), medium vulnerability (attractive areas) and high vulnerability (very attractive areas) and use as reference the use of a MFS, with an estimated productive potential of 87.6 t/ha/year [44]. This potential is scaled from three scenarios:
(i)
Scenario I considers the use of the areas classified as of maximum vulnerability (very attractive), comprising the most attractive physical and socio-environmental indicators for seaweed cultivation. These areas total 601.92 ha, where 89% are concentrated in the territorial strip located to the north of the city of Natal/RN, between the municipalities of Ceará-Mirim/RN and Touros/RN. This range already records cultivation activities of the assessed seaweed, and therefore, due to its set of attractions, is considered a priority for the development of seaweed algaculture in the region. According to the conditions presented in item 3.2, an estimated 52,728 t of fresh biomass may be produced per year, which results in 5272 t/year of commercially available dry biomass if 100% of the available areas are used. This estimate reaches 26,364 t when 50% of the areas are used and is reduced to 10,545 t when cultivation is restricted to 20% of the same areas;
(ii)
Scenario II considers the use of the sum of areas classified as presenting high (very attractive) and medium vulnerability (attractive), comprising 1825.47 ha distributed along the entire coast of RN. According to this scenario, under the conditions presented in item 3.2, an annual supply of 159,911 fresh biomass is estimated, resulting in 16,000 t/year of dry biomass to be sold, in the case of the use of 100% of the classified area. When 50% of the areas are used, 79,955tons are produced, and when cultivation is reduced to 20% of the same area, 31,981 tons are produced;
(iii)
Scenario III, less likely, estimates the use of all areas with presenting the potential for seaweed cultivation, around 2227.59 ha comprising areas of maximum, medium and minimum vulnerability – unattractive –. According to this scenario, under the conditions presented in item 3.2, the annual supply of fresh biomass would reach 195,136. t, which corresponds to 19,000 t of annual dry biomass, when using 100% of the classified areas. When using 50% of the same area, 97,568. t are produced, decreasing to 38,997. t when the cultivation area is of only 20%.
The estimated values of annual production of fresh and dry biomass, based on the presented scenarios, considering different occupation levels of the areas classified in the cultivation activity of 100%, 50% and 20%, are summarized in Table 3. It is important to highlight that the dry biomass is the largest portion of the products sold by the state ‘s mariculturists’ associations, AMBAP and AMAR. This product is traded at USD 50.00 per kilogram of dry mass.
The estimated values in the different scenarios presented in Table 3 reveal the inclusive potential of structuring the seaweed production chain in promoting sustainability, generating employment and income. This statement is supported by the study carried out by [52], which points to the economic viability of dry biomass production, crediting it with an increase in the average income of the women who cultivate seaweed. [52] report that the production and marketing of dry biomass by the Rio do Fogo Mariculture Association (AMAR), has enabled an additional income of USD 75.00 for each seafood restaurant. This increase causes the per capita family income to increase by 42.9%, increasing from 85.5 to 122.2 USD, which is 100% higher than the per capita Rio do Fogo family income reported by the IBGE 2010 census [45].
In this context, the practice of cultivating Crassiphycus birdiae, alongside its productive potential, indicate the viability of marketing Crassiphycus birdiae products, indicating that this seaweed is of significant social, economic and environmental relevance for mariculture families. This leads to the possibility of structuring a regional development model aimed at reducing inequalities and promoting the improvement of the quality of life of coastal communities.

4.3. Bioproduct Potential Estimates

4.3.1. Bioethanol

The estimated annual bioethanol production is carried out using the estimated biomass production potential in the classified areas, presented in Table 3. Bioethanol extraction per tonne of fresh biomass makes use of the values referenced by [44], which report that one ton of fresh biomass can provide 10.8 l of ethanol. This estimate is based on the three scenarios described in item 4.2 whose results are presented as follows:
(i)
Scenario I—In this scenario, an estimated 569,464 liters per year of bioethanol could be produced if 100% of the available areas were cultivated, reaching 284,732 liters using 50% of the areas and 113,892 liters when cultivation decreases to 20% of the areas defined in this scenario.
(ii)
Scenario II—This scenario offers 1,727.04 liters of bioethanol if 100% of the available areas were to be used. This estimate reaches 863,515 liters when 50% of the areas are used and is reduced to 345,40 liters when cultivation is restricted to 20% of the same areas.
(iii)
Scenario III—The annual supply of bioethanol for this scenario the reaches 2,107.48 liters when using 100% of the classified areas, decreasing to 1,053,73 liters when using 50% and reducing to 421,18 liters when the cultivation area reaches only 20%.

4.3.2. Biofertilizer

The estimated annual production of biofertilizer considers that extraction is performed at a 50% yield from fresh biomass, according to the conditions presented in item 3.2, and that the estimates are made from the three scenarios described in item 4.2, for which the results are presented as follows:
(i)
Scenario I—This scenario estimated 26,364 liters of biofertilizer per year if 100% of the available areas are cultivated, decreasing to 13,182 liters when 50% of the areas are used and to 5,272 liters is assumed when the cultivation is only in 20% of the defined areas in this scenario.
(ii)
Scenario II—This scenario estimates the production of 79,955 liters of biofertilizer if 100% of the areas are used, decreasing to 39,977 liters when 50% of the areas are used and to 15,990 liters when the cultivation is restricted to 20% of the same areas.
(iii)
Scenario III—The estimated annual supply of biofertilizer for this scenario totals 97,568 liters, in 100% of the classified areas. If 50% of this same area is used, 48,784 liters are obtained, reduced to 19,498 liters when the cultivation area reaches only 20%.

4.3.3. Agar

Estimated agar production is obtained by considering two yield percentages (22% and 47%) as described in item 3.3.3, and also specified according to the three scenarios outlined in item 4.2.
Table 3 presents biomass production potential estimates for Crassiphycus birdiae from the areas identified as suitable for production on the coast of the state of RN, considering the socioeconomic and environmental aspects for this production.
In Scenario I, with 22% yield, when grown in 100% of classified areas, 11,600 t of agar/year is extracted. For 50% of the areas, this value reaches 5800 t/year, decreasing to 2320 t when cultivation is performed in 20% of the areas defined in this scenario. With 47% yield, 24,782 t of agar/year extraction is obtained if 100% of available areas are used. This amounts to 12,391 t when 50% of the areas are utilized, decreasing to 4956 t when cultivation is performed on only 20% of the total area accounted for in this scenario.
Regarding Scenario II, for 22% yield, using 100% of the areas defined in this scenario, it is possible to obtain 35,180 t of agar, decreasing to 17,590 t when 50% of the areas are used, reaching only 7036 t when cultivation is restricted to 20% of the same areas. For a yield of 47%, an estimated 75,158 t of agar/year is obtained when cultivation is performed in 100% of the classified areas in this scenario. By using 50% of these same areas, 37,578 t/year are obtained, decreasing to 15,031 t/year when cultivation occupies 20% of the areas.
And finally, in Scenario III, with 22% yield, algae cultivation in 100% of classified areas results in 42,930 t of agar/year. If 50% of this same area is used, 21,464 t of agar/year will be obtained, decreasing to 8,579 t/year by using only 20% of the areas defined in this scenario. For 47% yield, this scenario estimates 91,714 t of agar/year if 100% of classified areas are cultivated, decreasing to 45,856 t of agar/year when 50% of areas are used and reaching 18,328 t of agar/year when cultivation occurs in only 20% of areas.
The productive potential of algaculture products, shown in the scenarios described in item 4.3, reveals that this activity displays significant economic, social and environmental relevance for coastal communities, reducing inequalities and promoting the improvement of life quality of these communities.

5. Conclusions

Seaweeds have long been present in human history as a food source. The demands placed on the promotion of sustainability put seaweed production on another level, since they can become an important raw material in bioproduct production, especially bioethanol, since they are an alternative for mitigating greenhouse gases, primarily from the transport sector, thus with the attractive power to replace liquid fuels of fossil origin.
This study emphasizes the attractiveness of the use of the Brazilian coast, in particular the northeastern coast, for bioproduct production from Crassiphycus birdiae seaweed as a support to the promotion of sustainable regional development. Stimulation of this activity has the ability to promote employment and income generation through the commercialization of seaweed-derived bioproducts.
The appropriate seaweed cultivation areas for macroalgae cultivation were determined using the Analytic Hierarchy Process (AHP) and Change Detection Analysis based on physical and infrastructure factors, such as sheltered areas from the coast to winds, sea currents and waves, proximity to seaweed banks, road infrastructure for production, and socioeconomic and environmental factors such as family income and changes in the natural environment.
The seaweed bioproduct values estimated in this article allow for the conclusion that considering the level of socioeconomic development of the population inserted in the areas with present potential for seaweed cultivation (1825.47 ha) and taking as reference the cultivation practice, seaweed production in the study region displays the potential for employment and income generation. This assertion takes as a reference that, occupying 100% of the areas favorable to the production of the assessed seaweed, 16 thousand tons of dry biomass could be obtained per year. In addition, adopting the sale price of dry biomass practiced in the Rio do Fogo community, through AMAR’s commercialization, which reaches USD 50.00 per kg, a market expectation of USD 800,000.00 per year is observed.
Thus, the promotion of the seaweed production chain structuring is an attractive opportunity for the insertion of coastal communities of low socioeconomic development in public policies, thus enabling the development of regional and local development models aimed at promoting sustainability, thereby reducing inequality as a means of promoting quality of life improvement of coastal communities and their sustainability.

Author Contributions

Conceptualization, H.M.M.d.Q.A., N.F.d.S., F.E.S.d.S.; Data curation, H.M.M.d.Q.A, F.E.S.d.S., N.F.d.S.; Formal analysis, F.E.S.d.S., N.F.d.S.; Investigation, H.M.M.d.Q.A., N.F.d.S., F.E.S.d.S.; Methodology, H.M.M.d.Q.A., F.E.S.d.S., N.F.d.S., M.C.C., D.I.A.T.; Project administration, F.E.S.d.S., N.F.d.S.; Supervision, L.P.R., N.F.d.S.; Validation, L.P.R., N.F.d.S., F.E.S.d.S.; Writing—original draft, H.M.M.d.Q.A., N.F.d.S.; Writing—review & editing, H.M.M.d.Q.A., L.P.R., N.F.d.S. All authors have read and agreed to the published version of the manuscript.

Funding

This research received no external funding

Conflicts of Interest

The authors declare no conflict of interest.

References

  1. Rioux, L.-E.; Turgeon, S.L. Seaweed carbohydrates. In Seaweed Sustainability; Elsevier BV: Amsterdam, The Netherlands, 2015; pp. 141–192. [Google Scholar]
  2. Sudhakar, K.; Mamat, R.; Samykano, M.; Azmi, W.; Ishak, W.; Yusaf, T. An overview of marine macroalgae as bioresource. Renew. Sustain. Energy Rev. 2018, 91, 165–179. [Google Scholar] [CrossRef]
  3. Ghadiryanfar, M.; Rosentrater, K.A.; Keyhani, A.; Omid, M. A review of macroalgae production, with potential applications in biofuels and bioenergy. Renew. Sustain. Energy Rev. 2016, 54, 473–481. [Google Scholar] [CrossRef]
  4. Fernand, F.; Israel, A.; Skjermo, J.; Wichard, T.; Timmermans, K.R.; Golberg, A. Offshore macroalgae biomass for bioenergy production: Environmental aspects, technological achievements and challenges. Renew. Sustain. Energy Rev. 2017, 75, 35–45. [Google Scholar] [CrossRef]
  5. Sondak, C.F.A.; Ang, P.O.; Beardall, J.; Bellgrove, A.; Boo, S.M.; Gerung, G.S.; Hepburn, C.D.; Hong, D.D.; Hu, Z.; Kawai, H.; et al. Carbon dioxide mitigation potential of seaweed aquaculture beds (SABs). J. Appl. Phycol. 2017, 29, 2363–2373. [Google Scholar] [CrossRef]
  6. Lago, C.; Herrera, I.; Caldés, N.; Lechón, Y. Nexus Bioenergy–Bioeconomy. In The Role of Bioenergy in the Bioeconomy; Elsevier BV: Amsterdam, The Netherlands, 2019; pp. 3–24. [Google Scholar]
  7. McHugh, D.J. A Guide to the Seaweed Industry; Food and Agriculture Organization of the United Nations: Rome, Italy, 2003; ISBN 92-5-104958-0. [Google Scholar]
  8. Rebours, C.; Marinho-Soriano, E.; Zertuche-González, J.A.; Hayashi, L.; Vasquez, J.A.; Kradolfer, P.; Soriano, G.; Ugarte, R.; Abreu, M.H.; Bay-Larsen, I.; et al. Seaweeds: An opportunity for wealth and sustainable livelihood for coastal communities. Environ. Boil. Fishes 2014, 26, 1939–1951. [Google Scholar] [CrossRef] [PubMed] [Green Version]
  9. Bezerra, A.D.F. Cultivo de Algas Marinhas Como Desenvolvimento de Comunidades Costeiras; UFRN: Natal, Brazil, 2008. [Google Scholar]
  10. Marinho-Soriano, E. Historical context of commercial exploitation of seaweeds in Brazil. J. Appl. Phycol. 2017, 29, 665–671. [Google Scholar] [CrossRef]
  11. Estado Mundial, E.l. De La Pesca Y La Acuicultura 2018; FAO: Rome, Italy, 2018; ISBN 978-92-5-130688-8. [Google Scholar]
  12. de Oliveira Fernandes, F.; de Oliveira, S.R.; Klein, V.; do Amaral Carneiro, M.A.; Colepicolo, P.; Marinho-Soriano, E. Effect of fertilization pulses on the production of Gracilaria birdiae seedlings under laboratory and field conditions. J. Appl. Phycol. 2017, 29, 695–705. [Google Scholar] [CrossRef]
  13. Baghel, R.S.; Reddy, C.; Jha, B. Characterization of agarophytic seaweeds from the biorefinery context. Bioresour. Technol. 2014, 159, 280–285. [Google Scholar] [CrossRef]
  14. Hargreaves, P.I.; Barcelos, C.A.; Da Costa, A.C.A.; Pereira, N. Production of ethanol 3G from Kappaphycus alvarezii: Evaluation of different process strategies. Bioresour. Technol. 2013, 134, 257–263. [Google Scholar] [CrossRef]
  15. Tan, I.S.; Lee, K.T. Enzymatic hydrolysis and fermentation of seaweed solid wastes for bioethanol production: An optimization study. Energy 2014, 78, 53–62. [Google Scholar] [CrossRef]
  16. Chen, H.; Zhou, N.; Luo, G.; Zhang, S.; Chen, J. Macroalgae for biofuels production: Progress and perspectives. Renew. Sustain. Energy Rev. 2015, 47, 427–437. [Google Scholar] [CrossRef]
  17. Jiang, R.; Ingle, K.N.; Golberg, A. Macroalgae (seaweed) for liquid transportation biofuel production: What is next? Algal. Res. 2016, 14, 48–57. [Google Scholar] [CrossRef]
  18. De Castro, G.M.C.; Benevides, N.M.B.; Cabral, M.C.; Miranda, R.D.S.; Rocha, M.V.P.; Araújo, M.L.H.; Filho, E.G. Optimized acid hydrolysis of the polysaccharides from the seaweed Solieria filiformis (Kützing) P.W. Gabrielson for bioethanol production. Acta Sci. Boil. Sci. 2017, 39, 423. [Google Scholar] [CrossRef] [Green Version]
  19. Adeniyi, O.M.; Azimov, U.; Burluka, A. Algae biofuel: Current status and future applications. Renew. Sustain. Energy Rev. 2018, 90, 316–335. [Google Scholar] [CrossRef]
  20. Khambhaty, Y.; Mody, K.; Gandhi, M.R.; Thampy, S.; Maiti, P.; Brahmbhatt, H.; Eswaran, K.; Ghosh, P.K. Kappaphycus alvarezii as a source of bioethanol. Bioresour. Technol. 2012, 103, 180–185. [Google Scholar] [CrossRef]
  21. Shukla, R.; Kumar, M.; Chakraborty, S.; Gupta, R.; Kumar, S.; Sahoo, D.; Kuhad, R.C. Process development for the production of bioethanol from waste algal biomass of Gracilaria verrucosa. Bioresour. Technol. 2016, 220, 584–589. [Google Scholar] [CrossRef]
  22. Kumar, S.; Gupta, R.; Kumar, G.; Sahoo, D.; Kuhad, R.C. Bioethanol production from Gracilaria verrucosa, a red alga, in a biorefinery approach. Bioresour. Technol. 2013, 135, 150–156. [Google Scholar] [CrossRef]
  23. Kumar, K.; Ghosh, S.; Angelidaki, I.; Holdt, S.L.; Karakashev, D.B.; Morales, M.A.; Das, D. Recent developments on biofuels production from microalgae and macroalgae. Renew. Sustain. Energy Rev. 2016, 65, 235–249. [Google Scholar] [CrossRef]
  24. Organization of Ukrainian Nationalists. World Population Prospects 2017; Population Division, Department of Economic and Social Affairs, OUN: New York, NY, USA, 2017; Volume 91. [Google Scholar]
  25. Kraan, S. Mass-cultivation of carbohydrate rich macroalgae, a possible solution for sustainable biofuel production. Mitig. Adapt. Strateg. Glob. Chang. 2013, 18, 27–46. [Google Scholar] [CrossRef]
  26. United Nations Intergovernmental Organization. Mulheres Conquistam Independência Financeira com Projeto de Maricultura No RN. Available online: https://nacoesunidas.org/mulheres-conquistam-independencia-financeira-com-projeto-de-maricultura-no-rn/ (accessed on 1 January 2020).
  27. Nath, S.S.; Bolte, J.P.; Ross, L.G.; Aguilar-Manjarrez, J. Applications of geographical information systems (GIS) for spatial decision support in aquaculture. Aquac. Eng. 2000, 23, 233–278. [Google Scholar] [CrossRef]
  28. Salam, M.; Ross, L.G.; Beveridge, C. A comparison of development opportunities for crab and shrimp aquaculture in southwestern Bangladesh, using GIS modelling. Aquaculture 2003, 220, 477–494. [Google Scholar] [CrossRef]
  29. Liu, Y.; Saitoh, S.-I.; Radiarta, I.N.; Isada, T.; Hirawake, T.; Mizuta, H.; Yasui, H. Improvement of an aquaculture site-selection model for Japanese kelp (Saccharinajaponica) in southern Hokkaido, Japan: An application for the impacts of climate events. ICES J. Mar. Sci. 2013, 70, 1460–1470. [Google Scholar] [CrossRef] [Green Version]
  30. De Sousa, F.E.S.; Moura, E.A.; Marinho-Soriano, E. Use of geographic information systems (GIS) to identify adequate sites for cultivation of the seaweed Gracilaria birdiae in Rio Grande do Norte, Northeastern Brazil. Rev. Bras. Farm. 2012, 22, 868–873. [Google Scholar] [CrossRef] [Green Version]
  31. Radiarta, I.N.; Saitoh, S.-I.; Miyazono, A. GIS-based multi-criteria evaluation models for identifying suitable sites for Japanese scallop (Mizuhopecten yessoensis) aquaculture in Funka Bay, southwestern Hokkaido, Japan. Aquaculture 2008, 284, 127–135. [Google Scholar] [CrossRef]
  32. Muehe Ceará, D. Die Guaporé-Expedition (1933–1935); Böhlau Verlag: Köln, Germany, 2015; pp. 52–63. [Google Scholar]
  33. Ministério do Meio Ambiente. ÁREAS PRIORITÁRIAS PARA CONSERVAÇÃO, USO SUSTENTÁVEL E REPARTIÇÃO DE BENEFÍCIOS DA BIODIVERSIDADE BRASILEIRA; MMA: Brasilia, Brazil, 2008; ISBN 9788577380763. [Google Scholar]
  34. Carneiro, M.A.A.; Marinho-Soriano, E.; Plastino, E.M. Phenology of an agarophyte Gracilaria birdiae Plastino and E.C. Oliveira (Gracilariales, Rhodophyta) in Northeastern Brazil. Rev. Bras. Farmacogn. 2011, 21, 317–322. [Google Scholar] [CrossRef] [Green Version]
  35. Vital, H.; Da Silveira, I.M.; Tabosa, W.F.; Lima, Z.M.C.; Lima-Filho, F.P.; De Souza, F.E.S.; Chaves, M.D.S.; Pimenta, F.M.; Gomes, M.P. Beaches of Rio Grande do Norte. In Climate Change and Sea Level Rise in South Florida; Springer Science and Business Media LLC: Berlin, Germany, 2016; Volume 17, pp. 201–229. [Google Scholar]
  36. Instituto De Desenvolvimento Econômico E Meio Ambiente. Perfil do Rio Grande do Norte; IDEMA: Natal, Brasil, 2014. [Google Scholar]
  37. VITAL, H.; Silveira, I.M.d.S.; Tabosa, W.F.; Lima, Z.M.C.; Lima-Filho, F.P.; Souza, F.E.S.; Chaves, M.d.S.; Pimenta, F.M.; Gomes, M.P. Brazilian Beach Systems, 1st ed.; Springer International: Berlin, Germany, 2016. [Google Scholar]
  38. Nimer, E. Climatologia do Brasil, 2nd ed.; Departamento de Recursos Naturais e Estudos Ambientais, IBGE: Rio de janeiro, Brazil, 1989; ISBN 8524002824. [Google Scholar]
  39. Asokan, A.; Anitha, J. Change detection techniques for remote sensing applications: A survey. Earth Sci. Inform. 2019, 12, 143–160. [Google Scholar] [CrossRef]
  40. The National Aeronautics and Space Administration. Landsat 7 Science Data Users Handbook; Landsat Project Science Office, NASA: Greenbelt, MA, USA, 2011.
  41. Chacon, M.; Carrillo, O.; Argotty, F.; Fung, E.; Imbach, P.; Islas, G.; Larios, E.; Lopez, D.; Maldonado, V.; Medellin, C.; et al. El Estado del Monitoreo Forestal en Latinoamérica y el Caribe: Tipos de Iniciativas y uso de Tecnologías; CATIE: Turrialba, Cartago, Costa Rica, 2016; ISBN 9789977577098. [Google Scholar]
  42. Junior, C.I.; Gregorio, L.M.; Francisco, M.; Hugo, S. Multitemporal Analysis of Forest Cover Using the Methodology of Spatial Remote Sensing and GIS in the Sub-Basin of the Coroico river—Caranavi Province in the Years 1989–2014. J. Selva Andina Res. Soc. 2018. Available online: http://www.scielo.org.bo/scielo.php?script=sci_arttext&pid=S2072-92942018000100003 (accessed on 1 January 2020).
  43. Española de Teledetección; Maldonado, F.D.; Dos Santos, J.R.; De Carvalho, y.V.C. Caracterización de cambios e influencia climática sobre la cobertura vegetal en el semiárido brasileño mediante Análisis de Componentes Principales (ACP). Available online: http://www.aet.org.es/?q=revista13-3 (accessed on 1 January 2020).
  44. de Andrade Neto, J.C. Produção potencial de etanol a partir de Macroalga Gracilaria birdiae cultivada; UFRN: Natal, Brazil, 2015. [Google Scholar]
  45. IBGE Weblet Importer. IBGE, Rio do Fogo. Available online: https://cidades.ibge.gov.br/brasil/rn/rio-do-fogo/panorama (accessed on 14 October 2019).
  46. Da Silva, R.R.; Bacha, C.J.C. Polígonos de Voronoi como alternativa aos problemas das áreas mínimas comparáveis: Uma análise das mudanças populacionais na região norte do Brasil. Revista Brasileira de Estudos de População 2011, 28, 133–151. [Google Scholar] [CrossRef] [Green Version]
  47. Bezerra, A.; Marinho-Soriano, E. Cultivation of the red seaweed Gracilaria birdiae (Gracilariales, Rhodophyta) in tropical waters of northeast Brazil. Biomass Bioenergy 2010, 34, 1813–1817. [Google Scholar] [CrossRef]
  48. Gelli, V.C. Desenvolvimento Ordenado e Potencial da Produção da Macroalga Kappaphycus Alvarezii no Estado de São Paulo Para Extração de Biofertilizante; UNICAMP: Campinas, Brazil, 2019. [Google Scholar]
  49. Ferreira, D.M. Extração de Agar de Algas Vermelhas do género Gracilaria; Instituto Superior de Engenharia de Coimbra: Coimbra, Portugal, 2015. [Google Scholar]
  50. IBGE censo 2010 | resultados. IBGE, censo2010. Available online: https://censo2010.ibge.gov.br/apps/mapa/ (accessed on 14 October 2019).
  51. IBGE Censo Demográfico 2010. IBGE, Censo Demográfico 2010. Available online: http://www.ibge.gov.br/home/estatistica/%0Apopulacao/censo2010/caracteristicas_da_populacao/%0Aresultados_do_universo.pdf (accessed on 14 October 2019).
  52. dos Santos Júnior, J.; Rebouças, L.d.O.S.; Figueiredo, J.P.d.V.; Bessa Júnior, A.P.; Maia, I.d.S. Viabilidade econômica de um produto a base de algas em uma associação de maricultoras do litoral Norte Potiguar. Pubvet 2017, 11, 313–339.14. [Google Scholar] [CrossRef] [Green Version]
Figure 1. Representation of the Eastern Coast of the state of Rio Grande do Norte, Brazil. Coastal areas displaying potential for seaweed production, identified by [30], are highlighted in red. Source: The authors.
Sustainability 12 00780 g001
Figure 2. Aptitude map for Crassiphycus birdiae seaweed cultivation development on the RN coast, Brazil. Source: The authors, obtained from [30].
Sustainability 12 00780 g002
Figure 3. Spatial modeling flow with the incorporation of social and environmental vulnerability criteria to identify seaweed cultivation areas presenting greater sustainability potential. Source: The authors.
Sustainability 12 00780 g003
Figure 4. Hypothetical cost distance surface (CDS). Source: the authors.
Sustainability 12 00780 g004
Figure 5. Schematic drawing of the floating MFS used in Crassiphycus birdiae cultivation at Pitangui Beach, RN, Brazil. Source: The authors.
Sustainability 12 00780 g005
Figure 6. Eastern coast of RN highlighting the areas presenting the greatest environmental change (yellow spots with red contours), overlapped by the household income distribution of the population located in districts near areas presenting cultivation potential [51]. Source: The authors.
Sustainability 12 00780 g006
Figure 7. Location of the cultivation areas and their classification by social and environmental vulnerability levels in relation to the urban area of Natal, highlighted in gray. Source: The authors.
Sustainability 12 00780 g007
Table 1. Pairwise comparison matrix for assessing the relative importance of parameters for seaweed cultivation in RN, Brazil.
ParametersDistance to:Weights
NATURAL BedsSeawardMarketDistrictsEstuaryRoadMain CityUrban Areas
Distance to:natural beds1 0.0351
seaward31 0.0423
market551 0.1949
districts331/51 0.0599
estuary551/351 0.1333
road131/311/31 0.0502
main city5515371 0.2357
urban areas333337110.2486
Weights1/91/7 1/5 1/3135 7
ExtremelyVery strongStronglyModeratelyEquallyModeratelyStronglyExtremely
Levels 12345678
Sustainability 12 00780 i001
Less important More important
Source: The authors, obtained from [30].
Table 2. Macroalgae crop sites with ha areas classified into social and environmental vulnerability levels.
DistrictsLocalityArea Vulnerability (ha)Total Area (ha) *
LowMediumHighTotal
TourosTouros064.89150.57215.46216.88
TourosTouros025.6536.6362.2862.05
TourosTouros045.7222.3268.0468.07
TourosTouros2.3422.0513.8638.2537.35
Rio do FogoRio do Fogo38.6152.8337.44128.88128.90
Rio do FogoRio do Fogo8.5573.4462.1144.09144.54
MaxaranguapeMaxaranguape0156.3333.93190.26190.90
MaxaranguapeMaxaranguape147.78155.0785.59388.44390.80
MaxaranguapeMaxaranguape0018.0918.0918.67
Ceara-MirimCeara-Mirim15.8454.1871.28141.3140.28
ExtremozExtremoz9.927.72047.1647.56
ExtremozExtremoz16.4775.96092.4393.30
NatalNatal01.3501.351.20
NatalNatal016.56016.5616.85
NatalNatal5.6748.51054.1853.55
ParnamirimParnamirim81131.3127.54284.76284.57
Nísia FlorestaNísia Floresta033.9315.1249.0549.33
Tibau do SulTibau do Sul014.3127.4541.7642.70
Tibau do SulTibau do Sul7.11118.890126125.08
Baia FormosaBaia Formosa14.4104.850119.25119.63
Total (ha)347.671.223.55601.922.227.592.232.20
* Classified by Sousa et al. (2012).
Table 3. Biomass and Bioproduct Production Potential Estimates for Bioethanol - Biofertilizer and Agar from Crassiphycus birdiae seaweed crops.
Scenario 1 *Scenario 2**Scenario 3***
20%50%100%20%50%100%20%50%100%
Area (ha)120.38300.96601.92365.09912.731825.47445.181113.792227.59
Fresh biomass (t/y)10,54526,36452,72831,98179,955159,91138,99797,568195,136
Dry biomass (t/y)1054263652723198799515,9913899975619,513
Bioethanol (kl/y)113.89284.73569.46345.40863.521727.04421.181,053.732107.48
Biofertilizer (l/y)527213,18226,36415,99039,97779,95519,49848,78497,568
Agar22%2320580011,600703617,59035,180857921,46442,930
(t/y)47%495612,39124,78215,03137,57875,15818,32845,85691,714
Legend: (*) Very adequate areas; (**) Very adequate and adequate areas; (***) Total area.

