Article

Treatment Assessment of Road Runoff Water in Zones filled with ZVI, Activated Carbon and Mineral Materials

by
Joanna Fronczyk
1,*,
Katarzyna Markowska-Lech
1 and
Ayla Bilgin
2
1
Institute of Civil Engineering, Warsaw University of Life Sciences—SGGW, Nowoursynowska 159, 02-776 Warsaw, Poland
2
Faculty of Engineering, Seyitler Campus, Artvin Coruh University, 08000 Artvin, Turkey
*
Author to whom correspondence should be addressed.
Sustainability 2020, 12(3), 873; https://doi.org/10.3390/su12030873
Submission received: 15 November 2019 / Revised: 17 January 2020 / Accepted: 20 January 2020 / Published: 24 January 2020

Abstract

:
Reducing the discharge of contaminants present in runoff water is important for a clean environment. This paper analyses field test results of three pilot-scale horizontal runoff water treatment zones filled with mixtures of zero valent iron (ZVI), activated carbon (AC), silica spongolite (SS), zeolite (Z), and limestone (LS). The investigated systems were (S1) ZVI/AC/SS, (S2) ZVI/AC/Z and (S3) ZVI/AC/LS. The efficiency of the three systems in the removal of Cd, Cu, Ni, Pb, Zn, COD and ammonium ions from runoff water was compared and the factors (temperature, pH, redox potential, hydraulic conductivity) and relationships affecting treatment effectiveness were determined. A statistical analysis of effluent contaminant concentrations and physicochemical parameters of effluent solutions included descriptive statistics, analysis of variance (ANOVA), a multidimensional analysis using a Principal Component Analysis (PCA), a factor analysis (FA) and a cluster analysis (CA). The ANOVA and cluster analyses indicated similarities between systems containing SS and LS. As a consequence, using cheaper SS can reduce investment costs. In addition, there were no significant differences between the three systems regarding Cd and Ni removal, while Cu and Pb were removed to almost 100%. The results indicate that all the tested materials supported ZVI and AC in the removal of heavy metals in a similar way. However, runoff water was enriched with nitrogen oxides and sulfates while flowing through treatment zones with SS and LS. The enrichment increased with increasing temperature and redox potential. The conducted analyses indicate that the most suitable mixture is ZVI/AC/Z. It should be emphasized that the ongoing processes (precipitation and ZVI corrosion) reduced the hydraulic conductivity of the filters up to two orders of magnitude. Expansive iron corrosion was the most limiting factor in ZVI filtration systems. In the future, applications decreasing the percentage of ZVI in the mixture are suggested.

1. Introduction

In EU countries, attention is increasingly being paid to the need to fulfill ecological standards of water discharged to receivers (defined in the EU Water Framework Directive). Runoff water from urban areas is a sort of “cocktail” of pollutants, the composition of which depends on climatic conditions (length of droughts, duration and intensity of precipitation), quality of precipitation, topography, geology, land use, economy, population density, traffic intensity, vehicle speed, etc. [1,2,3,4]. Typical contaminants present in runoff water from urbanized areas are heavy metals—Cd, Cr, Cu, Ni, Pb, Zn, Mn, Pt, Ti and V [5,6,7,8]—organic compounds-petroleum substances, PAHs, phenols, glycols, pesticides [5,9,10,11], nutrients-nitrogen and phosphorus compounds [12,13,14,15], dissolved salts, including those used as de-icing agents [11,16,17,18], and solid suspensions [4,7,19]. The main sources of these substances in runoff waters include the release of components from tires, car bodies, engines, brake pads, road surface, road signs, sound barriers, but also the emission of exhaust gases in the form of gas and solids, as well as emission of de-icing agents during the winter period [16,20,21,22]. Recently, the best management practices commonly classify infiltration systems (filter strips, soakaways, infiltration trenches, infiltration basins) and retention devices (e.g., retention ponds, lagoons, constructed wetlands) as solutions reducing the volume of runoff water and contaminant migration to the reservoir [23,24,25,26]. Under favorable conditions, during the infiltration process, the surface layers of subsoil act as a filter, which results in the accumulation of contaminants in this zone. Additionally, the phenomenon increases the protection of deeper soil layers against deterioration of groundwater quality. Nevertheless, subsurface conditions, such as the occurrence of well-permeable soil layers (k > 10−5 m/s) or preferential flow paths may often promote the migration of substances dissolved in water into the aquifer, which are undesirable in the soil and water environment [27].
Research centers, e.g., in Germany, Austria, USA and Australia [6,24,28,29,30,31,32] have undertaken numerous laboratory and pilot-scale tests of new methods of surface and groundwater protection that may be used in engineering practice; however, there are still limited reports of the monitoring results. Experience, to date, is limited and mainly concerns treatment chambers, infiltration basins and infiltration trenches that were modified by using selected reactive materials as a filter material. An overview of selected field-scale applications of modified infiltration systems together with the characteristics of the treatment zones and the contaminants monitored is presented in Table 1.
The application of closed chambers filled with reactive material is limited to small catchments, usually car parks, intersections and squares, which is a consequence of the limited volume of water that can be cleaned. Based on the performed tests [6,24,33,36], it was observed that in most cases, closed chambers were designed to remove micro-pollutants dissolved in water, as evidenced by placing the separator with the settler in the system in front of the chamber. Already in the 1990s, one of the first installations of pilot runoff systems was made in the USA based on filtration through a bed of peat moss placed as one of the layers in the treatment zone located in front of the inlet to the retention tanks [28]. The flow of runoff waters from the motorway through this permeable barrier resulted in a decrease of 95% in PAHs, 70% in total Pb, 70% in Zn dissolved (90% in total), Cu dissolved in 69% (total 97%), and increase of TDS (salts dissolved) in 87%. Fuerhacker et al. [6] proposed three chambers filled with a multi-layer bed consisting of gravel, composite, vermiculite, zeolite with two different grain sizes (chambers 1 and 2), activated carbon (chamber 3) and gravel. During the two-year exploitation period, a significant reduction in the concentration of contaminants characteristic of runoff water was observed (suspended solids on average by 85%, mineral oil by more than 90%, TOC by 52%, NH4 by 71%, Cu by 75%, Zn by 73% and individual PAHs from 78 to 99%). Hilliges et al. [24] proposed a three-stage method for the treatment of runoff water (with a gutter, hydrodynamic separator with a grit chamber, and filter unit built of a layer of activated lignite coke for the sorption of dissolved pollutants) from a catchment covering a road with high traffic. Monitoring during system operation indicated effective total removal of heavy metals (also by removing suspensions from runoff water) at the level of 95.2% for Cu to 100% for Pb, total organic carbon (94%) and suspended solids (100%). However, it was not possible to eliminate threats resulting from periodic appearance of high concentrations of salt following winter road safety maintenance. The system proposed by Vesting [36] proved to be ineffective due to the colmatation of the filter bed after several weeks to several months of operation. For the proposed solution (filter shaft system), a decrease of the hydraulic coefficient values of the filter layer from 8.0 × 10⁻³ to 2.8 × 10⁻⁴ m/s caused a disturbance of the proper flow of runoff water through the treatment zone. Nevertheless, during the operation time, the author observed a decrease in the concentration of suspension by an average of 77%, petroleum substances by 95%, PAHs by 98%, Cu by 78% and Zn by 82% during the flow of runoff water through the filter zone filled with a mixture of activated granular Al2O3 and Fe2O3, aerated concrete and activated carbon.
Infiltration and retention-infiltration tanks with a built-in filtration layer due to their dimensions are associated with the need to obtain large amounts of reactive materials. Birch et al. [29] proposed the use of a filtration layer consisting of a mixture of zeolite and pure quartzitic sand in the ratio of 1: 6 in the infiltration tank receiving runoff water from urban areas. Monitoring showed effective removal of lead (on average by 93%), while the removal of Cu and Zn (68% and 52%, respectively), total suspended solids (50%) and nutrients (total phosphorus-51% and total nitrogen-65%) was moderate. Other pilot studies conducted by Hatt et al. [33] showed only slight differences in treatment between reservoirs with a mixture of sandy loam, vermiculite, perlite and a mixture of sandy loam, compost and hardwood mulch. A possible explanation can be the large percentage (80% by volume) of sandy loam in both mixtures. During the tank operation, a constant reduction in the concentration of suspended solids and heavy metals was observed, but leaching of phosphorus and no changes in the nitrogen concentration in the system containing vermiculite and pertlite were also noted. On the other hand, the presence of compost and hardwood mulch positively influenced the reduction of the concentration of nitrogen oxides and ammonium ions (33–78%), which was related to the occurrence of denitrification processes during the summer. In a pilot study, O’Reilly et al. [34] proposed a filtration layer in the infiltration basin consisting of a mixture of tire crumb, silt and clay, and sand, aimed to prevent local flooding and reduce the concentration of biogenic components in the runoff waters discharged. A slight reduction of NO3 concentration was observed, while the concentration of total dissolved phosphorus and orthophosphate was reduced by 70% on average.
The exploitation of linear infiltration surfaces and the necessity of material exchange increases the cost of this runoff water treatment method. One of the examples of pilot field tests of this type of equipment are linear biofilters with a filtration layer composed of a mixture of silt loam and limestone, located in the subsoil of the overgrown roadway shoulder and in the bottom of a grassy ditch [35]. Monitoring tests have shown that suspensions and related Pb, Zn and PAH removal were at a level exceeding 90%, but a significant reduction in the ability to treat runoff waters from pollutants in the winter period has also been observed. In addition, research has shown that at a large reduction in the concentration of the analyzed components related to contaminants associated with suspensions, dissolved forms were removed with a lower intensity of approximately 80% on average for all analyzed indicators. However, it should be noted that for selected parameters, the concentration reduction had a negative value (Cu, Zn and Pb) after a longer operation time.
The presented literature review indicates a large variety of reactive materials used in infiltration systems to treat road runoff water from mineral materials—zeolite, vermiculite, perlite, limestone, sand, sandy loam, silt and clay [6,29,33,34,35], through organic materials—peat, compost, hardwood mulch and lignite coke [24,28,33] to waste materials and modified materials—activated concrete, tire crumb, activated carbon, activated Al2O3 and Fe2O2 [6,34,36]. Additionally, the effectiveness of zero valent iron (ZVI) in phosphate removal has been proven in laboratory and field studies by [37,38,39], while Reddy et al. [40] have proved the effectiveness of removing nitrates and phosphates on iron fillings. ZVI is also the most commonly used reactive material in the technology of permeable reactive barriers (PRB) to remove organic contaminants, heavy metals, radionuclides, and nutrients from groundwater [41,42], whereas activated carbon is used in the treatment of groundwater contaminated with e.g., diesel fuel [43]. The authors’ previous laboratory studies (batch and column tests) have shown the possibility of removing heavy metals using ZVI and zeolite [44,45], with the multilayered treatment zone consisting of activated carbon, silica spongolite and zeolite [46]. The studies of Fronczyk and Mumford [47] have shown the possibility of removing ammonium ions and phosphates on zeolite and limestone, respectively. Taking into account the complex composition of runoff water from roads and the selectivity of materials in relation to individual types of contaminants, the components of the mixtures were selected to remove heavy metals (silica spongolite, limestone, zeolite, activated carbon), organic compounds (activated carbon), ammonium ions (zeolite) and nitrates (ZVI). Three mixtures were used in the pilot studies analyzed in the paper. Each of them included ZVI and activated carbon, while the material distinguishing the mixtures was mineral aggregate (zeolite, silica spongolite and limestone), which was selected for its availability and low acquisition costs. Each of the materials constituted 33% of the mixture; therefore, the percentage of ZVI in the mixture did not exceed the threshold value of 52% proposed by Care et al. [48]. Additionally, both silica spongolite and limestone showed similarity in terms of mineral composition (calcite accompanied by a small amounts of quartz) [46,47], but silica spongolite is about 20 times cheaper than limestone. When deciding on these two materials, the writers wanted to investigate whether the effectiveness of contaminants removal of the cheaper material is comparable to that of limestone.
Referring to the literature review presented above, it should be emphasized that large-scale studies have been conducted so far in a small range, the most advanced being laboratory tests. Therefore, observations from field studies, even on a small scale, which take into account the influence of external factors on processes occurring inside the treatment zone, are of a high value. The main purpose of the paper was to answer the question as to what factors affect the effectiveness of road runoff water treatment based on the analysis of the results obtained in pilot-scale horizontal permeable treatment zones. The authors wanted to characterize the relationships between the external factor (temperature), physical–chemical interactions, removal of selected contaminants, and changes of permeability in three treatment zones containing: (1) zero valent iron, activated carbon and silica spongolite, (2) zero valent iron, activated carbon and zeolite, and (3) zero valent iron, activated carbon and limestone. This paper is a continuation of the analysis of the test results presented in the previous publication [49], which revealed the application potential of proposed mixtures to remove micropollutants. Although the most effective mixture for all the tested substances was not indicated, it was concluded that the most effective mixtures for removing PAHs were ZVI/AC/SS and ZVI/AC/LS, and for ammonium ions—ZVI/AC/Z. Moreover, all analyzed heavy metals, except nickel (Cd, Cu, Pb, Zn), were effectively removed in all three systems, while a high chloride concentration was insufficiently reduced in the proposed treatment systems. In [49], the variability of the analyzed parameters over the cumulative infiltration time was shown. In this paper, the test results were subjected to a descriptive statistical analysis, analysis of variance (ANOVA), multidimensional analysis using Principal Component Analysis (PCA), factor analysis (FA) and Cluster Analysis (CA).

2. Materials and Methods

2.1. Pilot-Scale Tests

The studies concerned the treatment of artificial road runoff water (ARRW) from micro-pollutants dissolved in water (heavy metals—Cd (0.100 mg/L), Cu (0.280 mg/L), Ni (0.600 mg/L), Pb (0.799 mg/L) and Zn (0.950 mg/L), nitrogen compounds-NO3 (0.500 mg/L), NO2 (0.02 mg/L) and NH4 (0.831 mg/L), ΣPAH (5.7477 μg/L), Cl (1000 mg/L)); therefore the composition of synthetic runoff water did not include suspensions and components retained on them. The treatment zones were made of mixtures prepared in a weight proportion of 1:1:1 using zero valent iron, activated carbon and silica spongolite in system 1 (S1); zero valent iron, activated carbon and zeolite in system 2 (S2); and zero valent iron, active carbon, and limestone in system 3 (S3). The detailed characteristics of the three pilot-scale systems are presented in Table 2. The measurements were made in an interval of 11 months. One measuring cycle consisted of the simulation of runoff by adding 16 L of ARRW to each treatment zone, followed by a week-long break that reflected the period between the occurrence of atmospheric precipitation. During that stage the treatment zones were kept at saturation close to full. The reliable rainfall intensity was calculated for an annual rainfall of 541.7 mm [50] and a rain duration of 10 min, while the runoff volume (Qd) for one measuring cycle was estimated assuming a runoff coefficient φ of 0.9 and a rainfall intensity of 100 L/(s·ha). Samples were taken during the measuring cycles, for which the concentration of pollution indicators, as well as COD, pH, redox potential (Eh) and electrical conductivity (EC) were determined. The descriptive statistics and box plots for all tested parameters were prepared using Microsoft Office Excel 2016 (Microsoft, Redmond, Washington, USA).

2.2. Statistical Analysis

The results of the field measurements (quality parameters of water flowing out of the treatment zones, temperature and values of hydraulic conductivity) were used in analysis of variance (ANOVA), multidimensional analysis using the principal component analysis (PCA), factor analysis (FA) and cluster analysis (CA). ANOVA is the division of the total variance in a set of data into a number of component parts, so that relative contributions of the identifiable variable variation sources to the total variation in the measured data can be determined [51]. The one-way ANOVA analysis defines whether there is a difference between the mean of dependent variables [52]. The concept of PCA is to ensure preservation of the largest volume of variation in the dataset while reducing the dimensionality of a set of multiple interrelated variables. This is achieved by converting the first few variables into a new set of variables, which are the main components (PCs) listed so that they can retain most of the variation available in all the original variables without losing information about the analyzed phenomenon [53,54]. This method allows to determine the relations between a large number of variables and their classification due to their internal variability. Variables (VFs) are obtained by rotating the axis defined by PCA, but the factor rotation does not change the basic mathematical properties of the solution. After the axis rotation, the weight of substances in a factor increases while the weight of other factors decreases. Thus, the factors identify substances with a high correlation with themselves and thus, can be interpreted more easily [55]. CA is a data analysis tool used to group data with similar characteristics [56]. The hierarchical cluster analysis (HCA) allows for the use of a mathematical definition of similarity for grouping some measurements in the same sample or between different samples [57]. HCA is the most common approach, which allows to group similar objects into distinct categories (set of clusters) by minimizing the difference within groups and maximizing the difference between particular groups. As a result, the observations are organized into a dendrogram structure. HCA was carried out on the data normalized by full connectivity and Ward methods using Euclidean distances. The dendrogram provides a scheme of the groups and their proximity to each other [31]. A statistical analysis of the results was performed using the SPSS19 program.

3. Results and Discussion

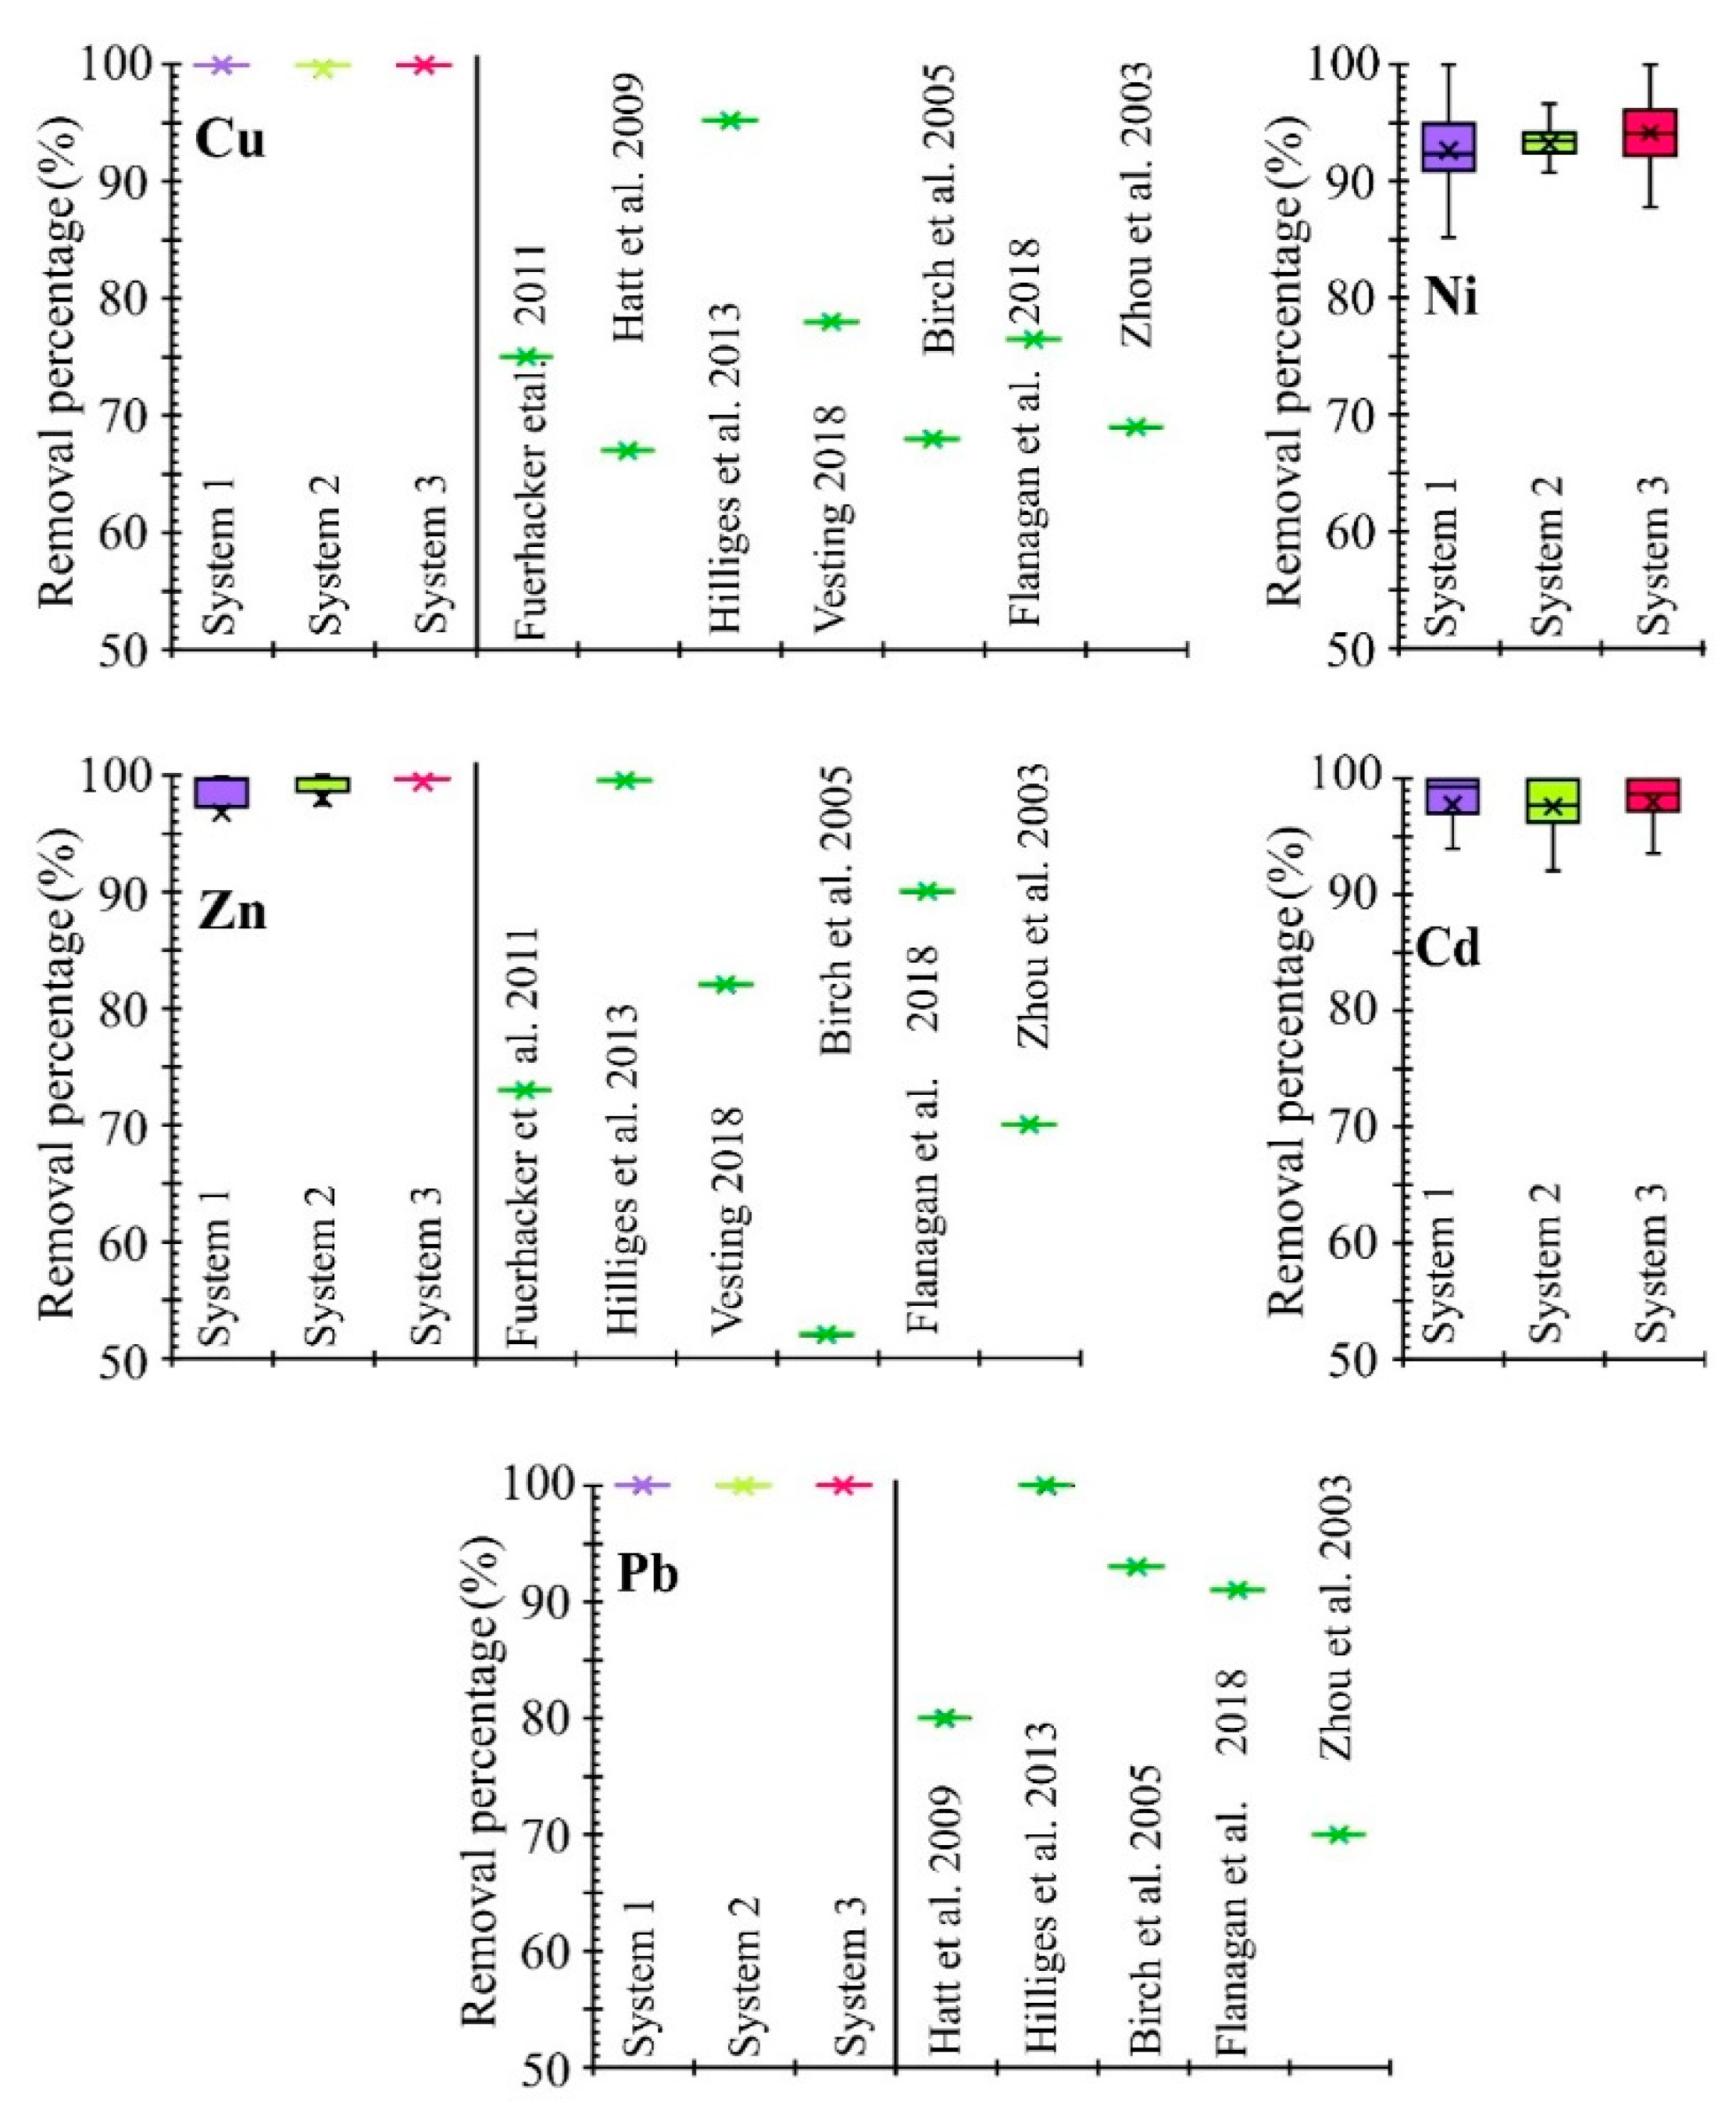
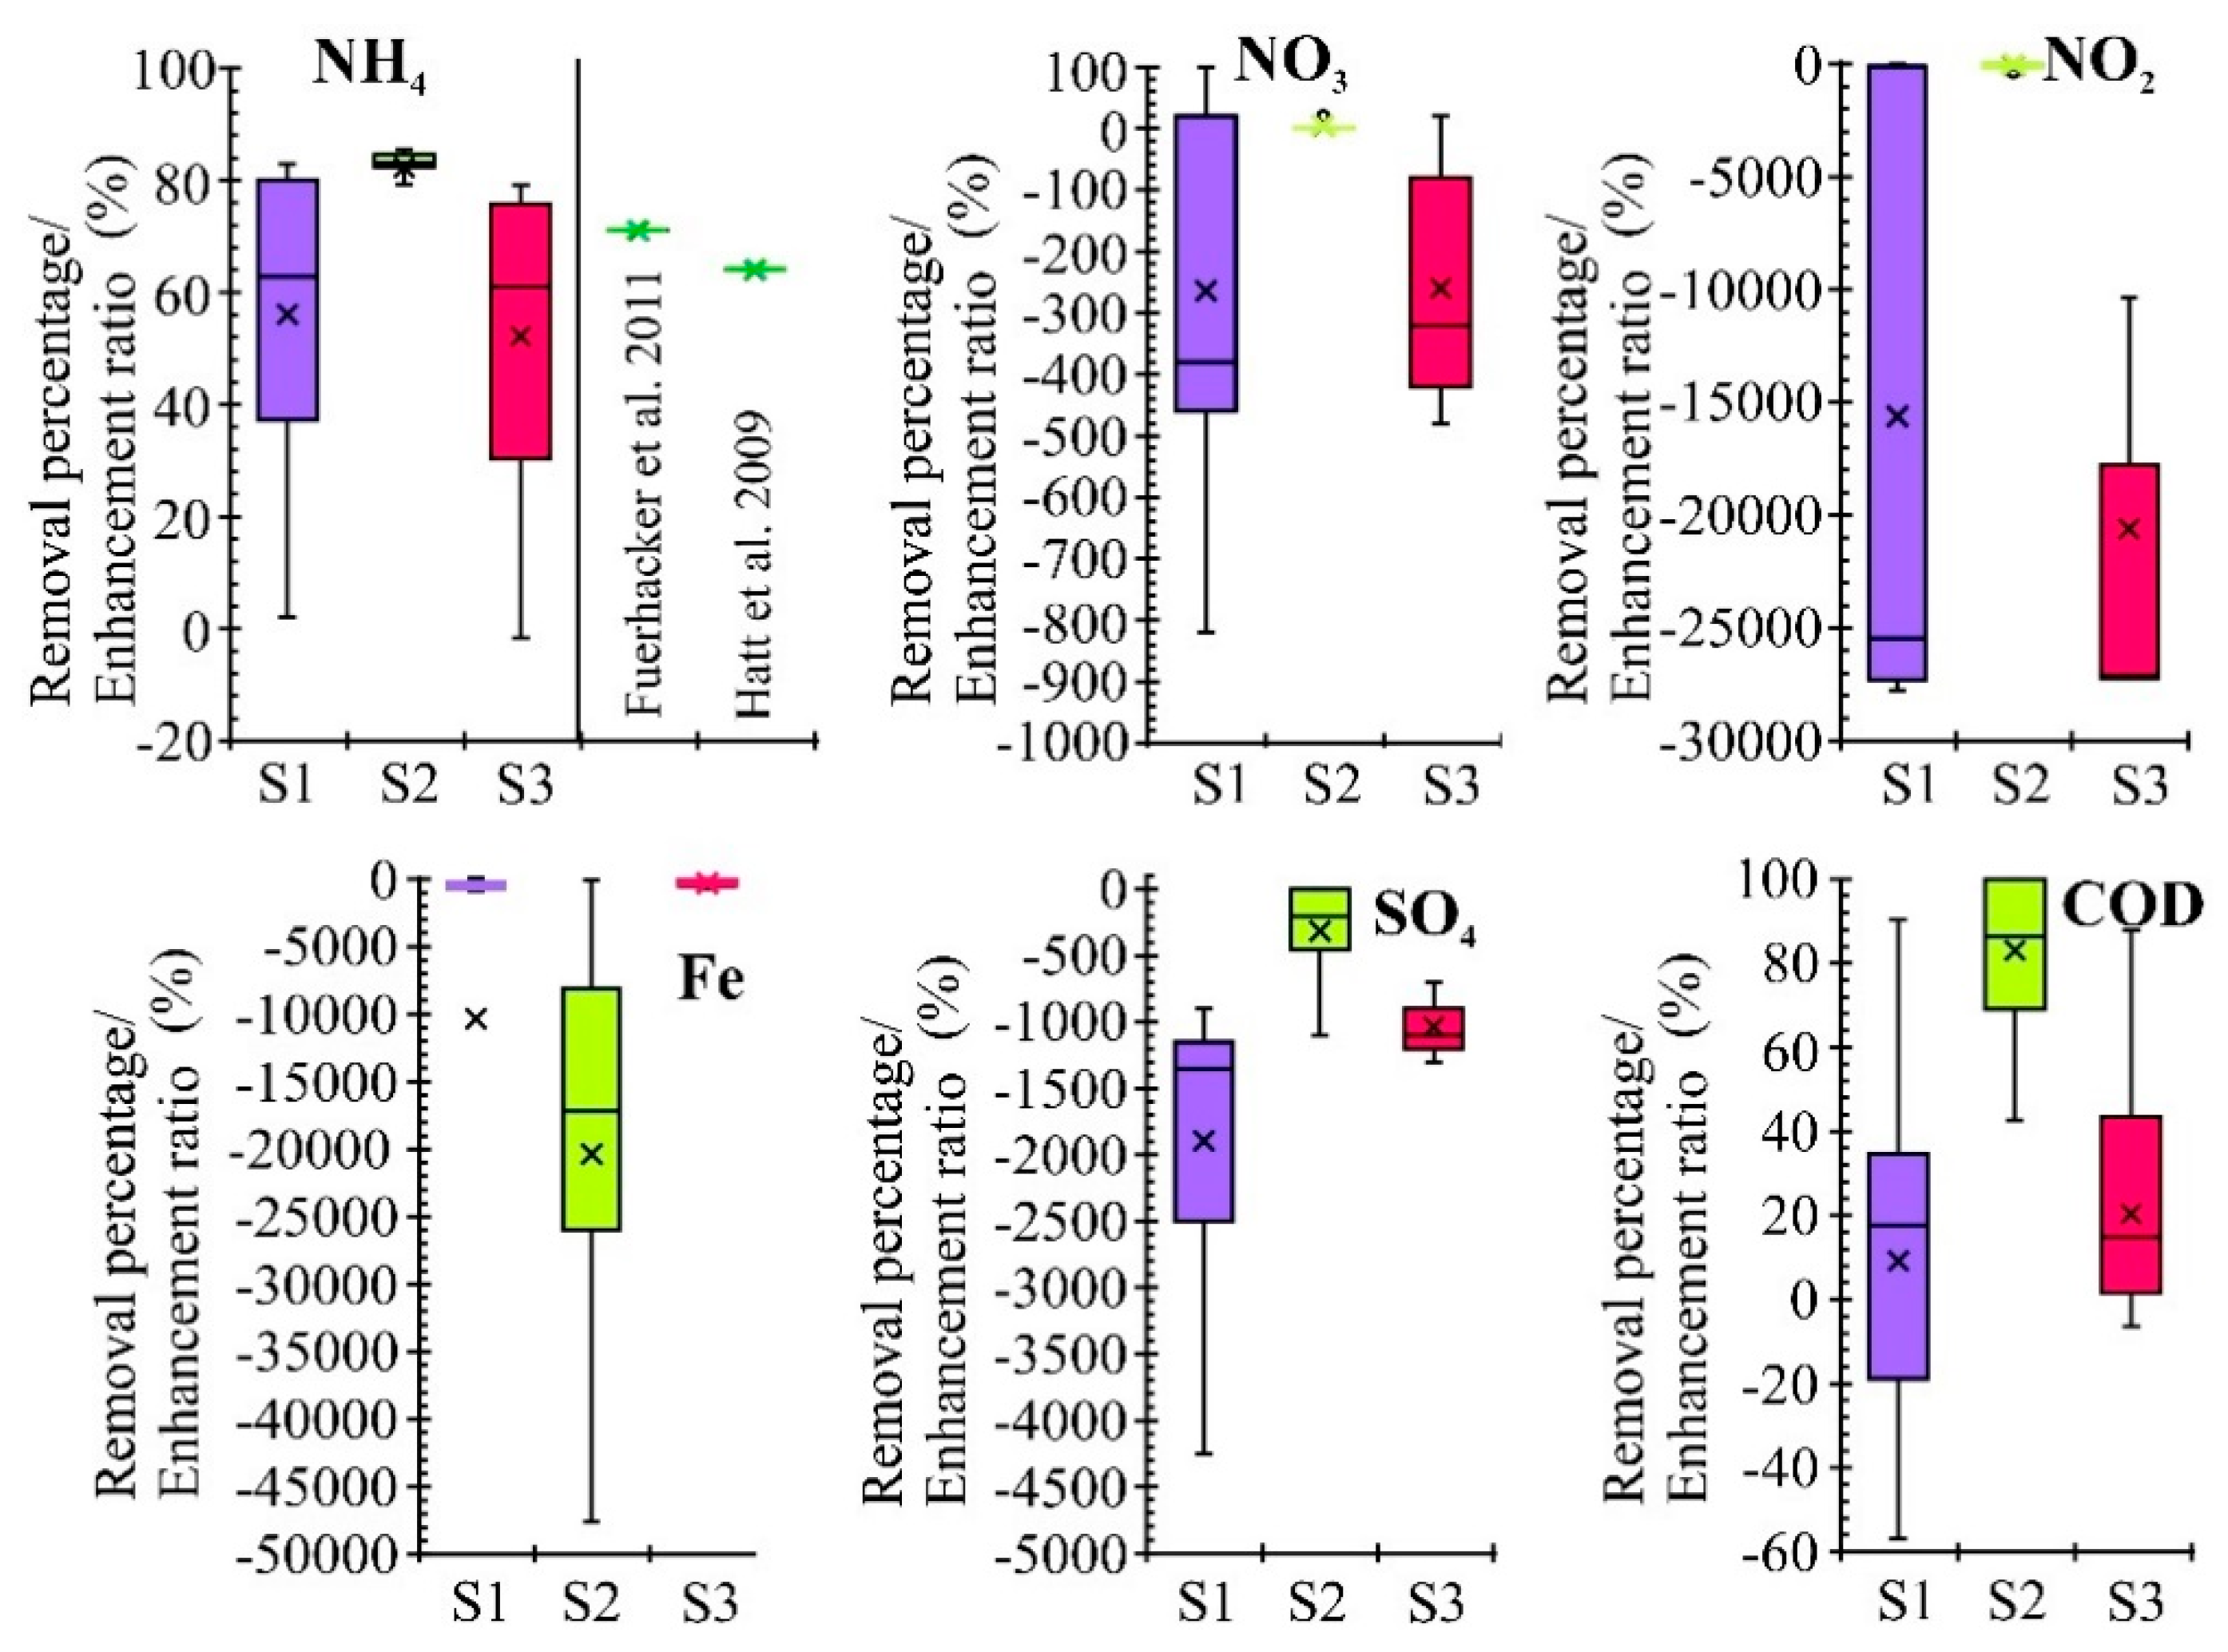
3.1. Characteristics of Removal Efficiency

The removal efficiency of heavy metals in pilot-scale systems compared with the results of field studies from the literature [6,24,28,29,33,35,36] are presented in Figure 1. The observed removal capacities of the analyzed systems (mainly sorption of ammonium ions and heavy metals) can positively affect the quality of the water body, in this case, groundwater, which receives runoff water. In all three systems, the highest removal efficiency (close to 100%) was observed for Pb and Cu, while the lowest for nickel ions in the range from 80% to 100%. The median and average values of Ni removal were 92.3% and 92.6% (S1), 93.5% and 93.2% (S2), and 98.7% and 97.9% (S3). The median and minimum values for Cd were 93.3% and 97.7% (S1), 97.7% and 97.6% (S2), 94.1% (both values) (S3), and for Zn 99.7% and 96.8% (S1), 99.7% and 98.0% (S2), 99.7% and 99.4% (S3). In most publications, the removal of copper, zinc and lead was considered; the remaining metals (Cd and Ni) were not tested as often due to their low concentrations in runoff water, also below the detection limit. The effectiveness of Cu, Zn and Pb removal by materials proposed by other research centers (peat, zeolite, sandy loam, vermiculite, perlite, compost, hardwood mulch, activated carbon, granulated Al2O3 and Fe2O3, aerated concrete, quartz sand, and their specific mixtures) was mostly lower than the effectiveness of the materials used in these studies. Similar results were obtained only by Hilliges et al. [24] for lead and zinc. The total efficiency of the system proposed by the mentioned authors is presented in Figure 1. Hilliges et al. [24] applied a multi-stage runoff water treatment system consisting of a gutter system, grit chamber and filter unit. The removal efficiency of the filter unit made of lignite coke was ~38% for Zn, ~45% for Cu and ~39% for Pb.
The removal percentages of nitrogen compounds, Fe, sulfate and COD, shown in Figure 2, were calculated as ratios of the influent and effluent concentration difference to the influent concentration. Therefore, negative values of this parameter indicate that the solution flowing out from the treatment zone was enriched with the analyzed element. From among the inorganic dissolved forms of nitrogen, only ammonium ions were removed to a satisfactory degree (Figure 2). It should be emphasized here that the changes of ammonium concentration in the effluent solutions in S2 and S3 presented by Fronczyk [49] were mistakenly changed. The highest efficiency, similar to the efficiency of filter beds proposed by Hatt et al. [33] and Fuerhacker et al. [6], was noted for a mixture composed of zero valent iron, activated carbon and zeolite (S2) and not for a mixture containing limestone (S3). This is consistent with the results presented by Fronczyk and Mumford [47], which, in laboratory conditions, showed a much greater efficiency of ammonium ion removal by zeolite than limestone. Moreover, silica spongolite and limestone, materials that distinguish systems 1 and 3, are both carbonate in character. Ammonium ion removal was at a similar level (mean and median values at 56% and 63% for S1, and at 52% and 61% for S3, respectively) and could be associated with transition of NH4 to ammonia gas, which was most likely related to pH values of the effluent solution, as well as with oxidation to nitrate oxides. The mean and median pH values for S1 were 8.46 and 8.26, and 7.28 and 6.90 for S3, whereas for system 2, 5.22 and 4.85, respectively (Figure 3). In the latter case (S1), the occurrence of ammonia gas in this system was less likely.
Similarly to the experiences of other research centers [33,58] the analyzed treatment zones turned out to be a source of nitrates and nitrites because the supplied anions flew freely through a filter bed and most probably, ammonium ions and ammonia were additionally oxidized in oxygen conditions to nitrogen oxides. Birch et al. [29] also observed that the concentrations of NOx, Fe and Ni in the effluent samples were higher than in the runoff waters supplied to the system. This phenomenon was explained by the elution of ingredients from the treatment layer and topsoil (Fe and Ni), and oxidation of nitrogen (NOx). However, it is worth noting that in the case of the pilot-scale tests analyzed in this paper, the measured concentrations of nitrogen oxides did not exceed the permissible concentrations of these nitrogen compounds (10 mg/L for nitrates and 0.5 mg/L for nitrites). The influent concentrations of nitrogen oxides were 0.5 mg NO3/L and 0.0016 mg NO2/L, while the average effluent concentrations of NO3 and NO2 were 1.79 mg/L and 0.29 mg/L for S1, 0.48 mg/L and 0.003 mg/L for S2, and 1.72 mg/L and 0.389 mg/L for S3, respectively. The analysis above justifies the assumption that nitrates and nitrites will not be effectively removed in treatment zones filled with the proposed mixtures. According to LeFevre et al. [59] intensification of nitrogen oxides removal can be achieved by simultaneous stimulation of denitrification processes (creating anaerobic conditions) and nitrogen uptake by plants.
With regard to nitrogen oxides, ARRW contact with reactive materials filling the treatment zone caused an increase in the concentration of sulfates in the effluent. The highest fluctuations were observed for S1 (from 20 to 93 mg/L), while the lowest SO4 concentration was noted in the eluate from S2 (from 2 to 27 mg/L). It could also be related to the presence of dissolved oxygen in water as well as leaching from the filter bed. The presence of SO3 in the surface element composition of the reactive material mixtures that were analyzed in the field tests was 0.225% for system 1, 0.512% for system 2 and 0.262% for system 3, respectively (Table S1).
Although the mean oxidation-reduction potential (Eh) values of effluents from systems 1 and 3 were positive (53.2 mV for system 1 and 1.1 for system 3) (Figure 3), during the measuring cycle, the measured values changed from positive to negative, suggesting a decrease of dissolved oxygen during the contact with the filter bed. Only for the zone filled with a mixture of zero valet iron, activated carbon and zeolite, the mean and median Eh values were negative (−8.7 and −35.5 mV, respectively). Only an insignificant appearance of nitrates (median value of 0.5 mg/L) and nitrites (median value of 0.003 mg/L) in the eluate and the highest concentration of iron were observed for this system. The increase in Fe concentration (Figure 2) to the average value not exceeding 3.96 (±3.86) mg/L (limit value for the third groundwater class 5 mg/L) may point to the transition of Fe0 to Fe2+ forms (oxidation reactions) [48,60,61], or the formation of unstable Fe(OH)3 iron hydroxide, which is dissolved and re-precipitated in the form of goethite (FeOOH) [62]. This can be confirmed by the fact that this iron compound was observed in the XRD studies of the filter bed materials performed on samples taken after their end use [49]. It should be noted that the average concentration of Fe in the effluent solution from the treatment zone containing silica spongolite (S1) and limestone (S3) was close to zero (average value of 2.1 mg/L and 0.08 mg/L, respectively). Therefore, it can be assumed that the release of nitrates and nitrites was associated potentially with the oxidation of ammonia and ammonium ions. Fe ions released to the solution can be removed in the fine sand layer placed beneath the treatment zone. Additionally, the content of organic contaminants expressed as COD was reduced at an average level of 9% for S1, 82% for S2 and 20% for S3. The removal efficiency was higher from than reported in the literature [31] only for systems containing zeolite. Small values of the average removal percentage for systems 1 and 3 were caused by periodic leaching of organic contaminants expressed as COD, which were removed in the systems during earlier phases of the experiment.
The selectivity series for particular systems observed on the basis of the average level of removal efficiency attained the following form: (1) Cu ≈ Pb > Cd > Zn > Ni > NH4 > COD for a treatment zone filled with a mixture of zero valent iron, activated carbon and silica spongolite; (2) Cu ≈ Pb > Cd ≈ Zn > Ni > NH4 > COD for a treatment zone filled with a mixture of zero valent iron, activated carbon and zeolite; and (3) Cu ≈ Pb > Zn > Cd > Ni > NH4 > COD for a treatment zone filled with a mixture of zero valent iron, activated carbon and limestone. On the other hand, the series of released elements (based on the average percentage value) was as follows: Fe < COD < NO3 < SO4 < NO2 for S1, NO3 ≈ NO2 < SO4 < Fe for S2, and Fe < COD < NO3 < SO4 < NO2 for S3.
The value of hydraulic conductivity for mixtures filling the treatment zones was reduced by about two orders of magnitude for S1 and S2 and by one order of magnitude for S3 (Table 3). This was due to clogging of the upper part of the bed, which, in turn, was initialized by iron corrosion processes and in consequence, precipitation of volumetrically more expansive iron oxides and hydroxides at pH > 4.5 [63,64]. These processes caused the formation of porous aggregates in the top layer of the filter bed, which were still permeable but not in loose form. The lowest median value of hydraulic conductivity was observed for system 2 (4.23 × 10⁻⁵ m/s) and the highest-for system 3 (1.03 × 10⁻⁴ m/s). However, these values were still around 3 to 8 times higher than the minimum recommended value for sand filtration systems [65]. Particle size distribution curves for the mixtures before the tests together with the pictures of aggregates formed during the tests are presented in Figure 4. The decrease of hydraulic conductivity causes a decrease of runoff water volume that can flow through the unit cross-section of the filter bed, and therefore, limits the application of materials as a complementary element of the drainage systems. In the case of decrease of the hydraulic properties of materials, replacement of the filtration layer may be more difficult to implement in tanks and ditches than in closed chambers, both for technical and economic reasons. However, it should be noted that hydraulic conductivity (and thus, the volume of runoff water treated per unit of time) should be greater in closed chambers compared to tanks and ditches. According to Caré et al. [48], a significant permeability loss in filtration systems containing ZVI and operating in the vadose zone should be expected and therefore, the admixing of ZVI with non-expansive materials, e.g., sand, gravel, pumice, is required. The other research group did not observe any detrimental effect on the hydraulic conductivity of sand filtration systems amended by up to 10.7% of iron [37,38,39]. In the studies presented in this paper, mixtures containing 33% by mass of iron were used and the percentage of ZVI in the mixture did not exceed the maximum value of 52% proposed by Care et al. [48]. To prevent deterioration of the hydraulic properties, oxygen-poor conditions must be created within the treatment zone, e.g., by placing the O2-scavenging layer [63,64]. Based on the research results presented by Erikson et al. [38], a possible solution may be reducing the amount of ZVI in the mixture or usage of different types of ZVI, e.g., steel wool. In the authors’ opinion, the best solution will be to ensure the levels of pipes supplying and draining runoff water in and from the chamber above the upper level of the treatment zone and forcing the flow of water from the bottom to the top of the system.

3.2. Statistical Analysis

3.2.1. ANOVA

The ANOVA analysis is used to determine the difference of more than two independent variables. In this study, a one-way ANOVA analysis was performed to determine the differences between system 1, system 2 and system 3. According to the ANOVA results (Table 4), the concentrations of Zn, COD (chemical oxygen demand), NH4, NO3, NO2, Fe, SO4, pH and Eh (redox potential) values differ among the three systems at a statistically significant level (p < 0.05). On the other hand, it may be assumed that the removal of Cd and Ni was at a similar level in all three systems. A further Post-hoc analysis was performed to identify the systems where these parameters vary, the results of which are shown in Table 5. The p < 0.95 conclusion at the end of this analysis confirmed the significant difference between system 1 and system 2 in the values of eight parameters (Zn, COD, NO3, NO2, Fe, SO4, pH and Eh). A significant difference was also observed between system 1 and system 3 in the values of four parameters (Zn, NH4, SO4 and pH), and between system 2 and system 3 in the values of seven parameters (COD, NH4, NO3, NO2, Fe, SO4 and pH). This indicates that all the selected mineral materials supported ZVI and AC in a similar way in the removal of Cd, Cu, Ni and Pb, while the mixture containing LS differs from other mixtures in terms of removal of Zn ions (lower removal). Therefore, considering this criterion, ZVI/AC/SS and ZVI/AC/Z mixtures should be considered in future applications. The smallest differences were observed between S1 (a mixture of zero valent iron, activated carbon and silica spongolite) and S3 (a mixture of zero valent iron, activated carbon and limestone). As indicated by the study of the mineralogical composition, both silica spongolite and limestone are carbonate materials, whose main mineral component is calcite with admixture of quartz [45,66]. This may be the reason why the treatment efficiencies and occurring processes are similar in both systems (S1 and S3). The analysis showed that the differences in the release of nitrogen oxides and organic compounds, expressed as COD, into runoff water during their contact with filter beds in S1 and S3, are not statistically significant. Therefore, when considering one mixture for large-scale application, the mixture containing zeolite seems to be the most suitable. The appropriateness is also confirmed by the fact that this mixture reduces COD to the greatest extent and releases the lowest amounts of nitrogen oxides and sulfates. However, it should be noted that the highest Fe concentrations in the effluent solution were observed for this filter bed. For all systems, it was observed that the changes in hydraulic conductivity were statistically not significant, therefore this factor did not affect the selection of the best mixture.

3.2.2. Principal Component and Factor Analysis

The suitability of data for factor analysis was tested by the Kaiser–Meyer–Olkin and Barlett Tests. The Barlett test of sphericity is used to test high significant correlation between at least some variables in the correlation matrix [67,68]. The KMO value (in a range of 0 to 1) must be over 0.5 for the suitability of factor analysis. The obtained value of KMO equal to 0.79 indicates that this data is appropriate for factor analysis. The results of the Barlett Test indicate whether the correlation of parameters is sufficient. It tests the null hypothesis showing that all correlation coefficients are equal to zero. The dataset was appropriate for PCA/FA because of p < 0.05.
The results of the FA/PCA analysis for system 1, system 2 and system 3 are given in Table S2. According to the results of the FA/PCA analysis, a high load factor indicates the effects of a high factor. As a result of PCA, 3 factors with eigenvalues > 1 and decreasing ratio of the total variance were determined for system 1 (Table S2). These three factors explained 75.3% of the total variance for S1. The first factor (VF1) explained 37.03%, the second factor (VF2)-20.20% and the third factor (VF3)-18.12% of the total variance, respectively. The value of variance for all the observed variables, which is generally acceptable, was achieved for five factors that explained 84.24% of the total variance for System 2: VF1-30.41%, VF2-18.82%, VF3-12.57%, VF4-8.48%, VF5-14.96%. The level of 88.91% explanation of the total variance for system 3 was obtained also for the first five factors. The VF1 explained 29.74%, VF2 27.71%, VF3 12.36%, VF4 9.58%, and VF5 9.52% of the total variance.
The factor coordinates presented in Table S2 can be used to calculate the equations of the principal components for individual factors determined for the examined systems. Analysis of the test results shows that for all systems, factor 1 was affected by Ni concentration, salinity expressed as EC and hydraulic conductivity, and factor 2 by the temperature of flowing water. For factor 3, a parameter common for all three systems cannot be specified.
The graphic position of factor load vectors with respect to the first two main components (PC1 and PC2) separated on the basis of PCA is presented in Figure 5. The influence of particular variables observed on the first and second main components illustrates the direction and length of vectors. In addition, factor load vectors with the same direction and similar values indicate a strong positive correlation of the described variables, vectors of opposite directions point to negative correlation, while vectors perpendicular to each other suggest no correlation between the variables.
In the complete system 1, the highly weighted variables were NO2, T, SO4, Zn, k, Ni, EC, and pH —they have the largest participation in PC1 and PC2 (see also Table S2); the least significant variables are Cd and NH4. PC1 is well described by positively correlated SO4, Zn, k and Ni variables, while PC2 is well described by NO2 and T. A negative correlation can be seen between PC1 and EC, pH, and also between PC2 and Fe, Ni; this means that an increase of the variable values causes a decrease in the value of the dependent PC1 and PC2. In system 1, two groups of parameters strongly related to each other with similar factor loadings and positively correlated with PC1 and PC2 can be extracted i.e., group 1: SO4, Zn, k and group 2: NO2, T, Eh. Additionally, in system 1, the most related groups of parameters (the highest correlation between the factors but different factor loadings) were EC-pH-NH4, COD-Cd-NO3, NO3-NO2. The analysis showed also a negative correlation between SO4-EC, Ni-COD, Fe-NO3, Fe-NO2 variables. The inverse correlation between Fe and nitrogen oxides concentrations may indicate the occurrence of reduction processes, since Fe2+ is considered as the electron source to NO3 in the Fe0–H2O system [69].
In System 2, Eh, COD, NO2, k, Ni, SO4, NH4, and EC had the largest participation in PC1 and PC2 (see also Table S2); the least significant parameters having the smallest factor loadings were Cd, Zn and NO3. PC1 was strongly positively correlated with SO4, k, Ni, NO2 variables, while PC2 was well described by Eh and COD. A negative correlation was observed between PC1 and EC, also between PC2 and the NH4 and T variables. In system 2, just like in system 1, two groups of parameters strongly related to each other with similar factor loadings and positively correlated with PC1 and PC2 can be extracted, i.e., group 1: NO2, k, Ni, SO4, and group 2: Eh, COD and pH (which is much less related to PC2). The most related groups of factors with the highest correlation and different factor loadings were pH-Eh-COD-Cd, NO2-k-Ni-SO4-NO3-Zn, Zn-NO3-T-NH4 and Fe-EC. Additionally, the analysis showed a negative correlation between Eh-T as well as COD-NH4. The higher value of removal efficiency of contaminants expressed as COD at higher pH (observed for all three systems) may be related to the higher likelihood of iron hydroxides. These compounds may be responsible for the removal of contaminants by complex formation or electrostatic attraction [70]. Additionally, the highly positive correlation between Ni and SO4 (r = 0.626 for S1 and r = 0.746 for S2) may suggest a significant role for NiSO4 precipitation in the removal of this heavy metal.
In System 3, NO3, NO2, COD, EC, pH, Ni, k, SO4 and T have the largest participation in PC1 and PC2 (see Table S2); the least significant variables were Cd and Fe. PC1 was strongly positively correlated with COD and EC, while PC2 was well described by T, SO4 and NO3. A negative correlation was observed between PC1 and k, Ni variables, as well as between PC2 and pH. In system 3, the factors were scattered and could not be grouped. The parameters strongly related to each other with different factor loadings were NO3-NO2, NH4-COD-EC-Fe-Cd, Fe-Cd-pH, Ni-k and Eh-Zn-SO4-T. The analysis also showed the negative correlation between EC-k and pH-Eh.
When the factor analysis was evaluated together for the three systems, SO4 was the first order variable and Ni, k, NO2 EC and COD were the next important variables. For system 1 and system 3, pH was another important parameter, while for system 2, the same role was played by NH4. For the three systems, Cd was the least important variable. The rest of the parameters i.e., NO3, Eh, Zn, Fe had different weights in the tested systems.

Effect of Temperature on the Removal Processes

Temperature as an external factor may affect the intensity of treatment processes taking place in the analyzed treatment zones. In system 1, the concentration of nitrogen oxides (NO2 and NO3) and sulfates, as well as the Eh value increased with rising temperature. A positive temperature influence, but to a lesser extent, was also observed for the concentration of Zn, Cd and COD. It can therefore be concluded that with temperature increase, the removal efficiency of the mentioned pollutants decreased. An inverse relationship was observed for Fe, Ni and NH4, as well as EC and pH values. In system 2, a positive correlation with temperature was observed for the concentration of NH4, SO4, NO3, Zn and Ni as well as for the value of hydraulic conductivity, while a negative correlation was noted for Eh values and, to a much lesser extent, for pH and EC, as well as for COD concentration and to a much smaller extent, for Cd. Lower values of Eh at higher temperatures may have been caused by a lower oxygen saturation capacity and a more rapid oxygen consumption, but this correlation was observed only for the system containing zeolite. In system 3, the concentration of SO4, NO3, NO2, Zn and NH4 as well as the values of Eh and k increased with increasing temperature and the value of pH, EC and the concentration of Ni, Cd, COD decreased with temperature. In conclusion, for all systems, the release of NO3 and SO4 was positively correlated with temperature, whereas the removal of Zn and values of EC and pH were negatively correlated with temperature. These relationships were valid in the temperature range from 5.3 to 23.5 °C, because such values were measured for effluent water from pilot-scale treatment zones. Laboratory studies conducted by Fronczyk and Mumford [47] showed that the removal of Cu and Zn on activated carbon, zeolite and limestone, as well as NH4 removal on zeolite increased with rising temperature. However, the maximum sorption capacity of activated carbon and limestone relative to ammonium ions slightly changed with increasing temperature. For S1, there was an insignificant negative correlation between hydraulic conductivity and temperature (r = 0.201). For S2 and S3, an inverse relationship was observed. According to common knowledge, as the temperature of the liquid increases, its viscosity decreases and the flow velocity increases [71,72]. Road runoff water treatment systems are exposed to direct impact of the environment, therefore optimization of the treatment process in terms of temperature seems to be difficult to implement for economic reasons. However, the engineer can consider the impact of this parameter on the occurring processes when choosing a material for large-scale applications. In the analyzed studies, the mixture, for which the smallest effect of temperature (both positive and negative) was observed, was ZVI/AC/LS (nitrogen oxides, sulfates and pH), followed by ZVI/AC/Z (COD, nitrates, sulfates, pH and Eh) and ZVI/AC/SS (nitrogen oxides, sulfates, Fe, EC and Eh).

Effect of Hydraulic Conductivity on Removal Processes

Considering infiltration systems for road runoff water treatment, hydraulic conductivity may be one of the most important factors in determining the effectiveness of the solutions used. Although the experimental boundary conditions were not differentiated in the analyzed studies in terms of hydraulic conductivity, the value of this parameter in all systems changed during the study. The results of the pilot tests led to the general conclusion that the concentration of Ni, SO4 and Zn as well as the temperature of the outflowing water were positively correlated with the velocity of water flow. Additionally, for systems 1 and 3, a positive correlation was also observed for the redox potential value (Eh). A decrease in NH4, Cd, Fe as well as in NO2, NO3 and COD concentrations was noted for all the systems with an increase of hydraulic conductivity. This may indicate that the reaction kinetics of oxygen consumption was slower than the residence time of runoff water in the treatment zone at higher values of hydraulic conductivity. Additionally, oxidation processes of zero valent iron occurred with less intensity; moreover, ammonia/ammonium ions oxidation to nitrogen oxides played a minor role in NH4 removal at a higher flow velocity. A negative correlation was also observed for pH and EC values and hydraulic conductivity of materials filling systems 1 and 3. It can be assumed that the increase in pH and salinity (EC) increased the intensity of processes resulting in clogging of filter beds (e.g., precipitation and corrosion of ZVI). Reardon [73] confirmed the enhanced corrosion of ZVI in the presence of sodium chloride, whereas in our studies, we observed a positive correlation between Fe release and the concentration of NaCl expressed as EC. This relation was statistically significant for S2 (r = 0.463) and S3 (r = 0.373). The presented relationships were observed for hydraulic conductivity in the range of 9.70 × 10⁻⁴ to 3.22 × 10⁻⁵ m/s (S1), 1.07 × 10⁻³ to 3.37 × 10⁻⁵ m/s (S2), and 7.20 × 10⁻⁴ to 5.04 × 10⁻⁵ m/s (S3), respectively. When designing infiltration treatment systems, it is particularly difficult to optimize the permeability of reactive materials. It is necessary to balance the residence time and the volume of road runoff water treated per unit of time, taking into account the reaction kinetics for contaminants, whose concentration is positively correlated with hydraulic conductivity. Therefore, to guarantee an appropriate reaction time, it seems more desirable to extend the filtration path rather than reduce the permeability of the filter bed.

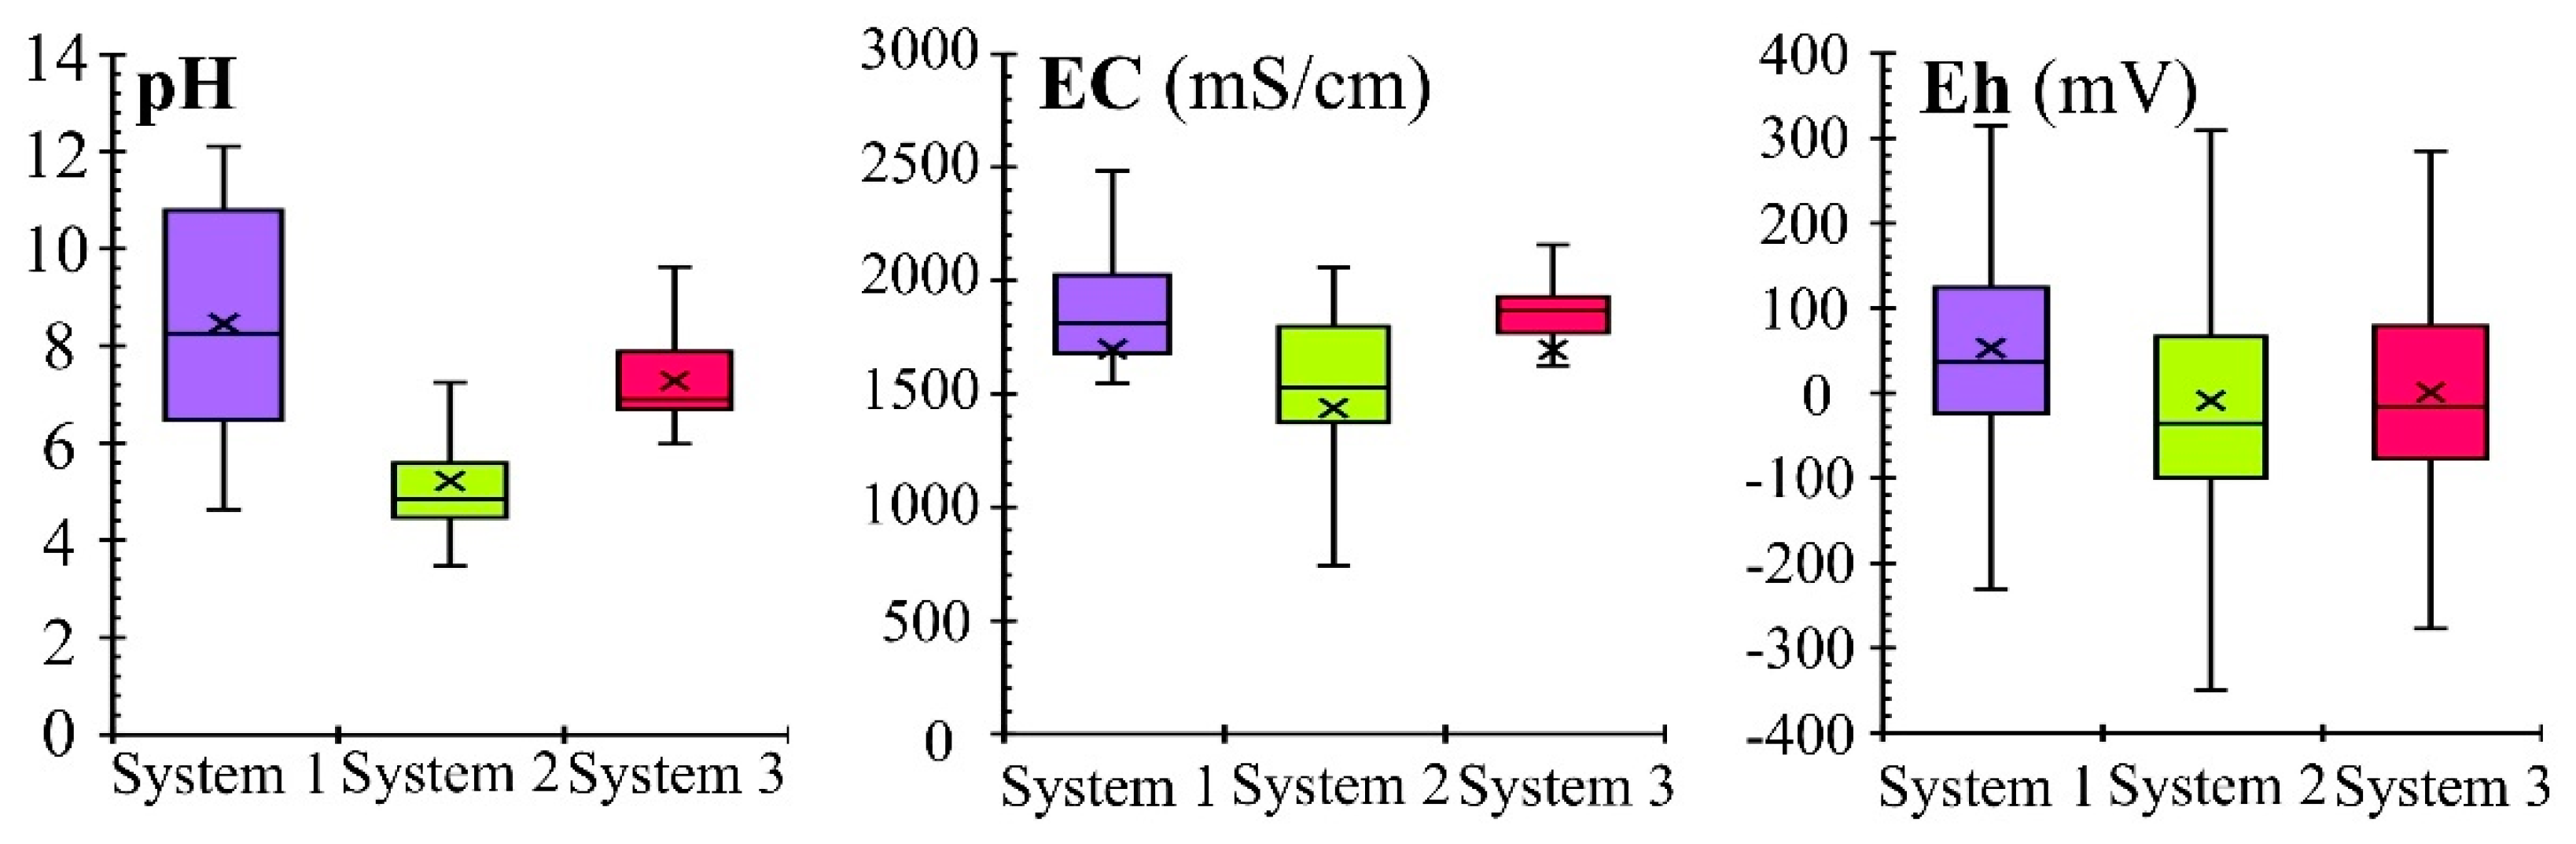
Effect of pH on the Removal Processes

Despite the fact that the pH value plays an important role in regulating the solubility and chemical transformation of heavy metals, in this research, we observed negative, statistically significant correlations between Ni (r = −0.633) and Zn (r = −0.526) concentration, and the pH value of the effluent solution only for the treatment zone filled with iron, activated carbon and silica spongolite. This may be due to the highest pH values measured for effluent samples from this treatment zone (Figure 3). For the other two systems, this relationship was also negative, but statistically insignificant. Moreover, COD and Cd were positively correlated with pH, while SO4, Zn, Ni concentrations and hydraulic conductivity were negatively correlated with pH for all the systems. In the system containing zeolite (S2), a statistically significant negative correlation between pH and the concentrations of nitrate (r = −0.590) and ammonium (r = −0.459) was observed (Figure 5). Therefore, an increase in the Ni, Zn and NH4 removal can be achieved by extending the contact time of the solution with reactive materials, which will increase the pH of the solution. The pH of effluent solution from the treatment zone (excluding samples for which ammonium ions were not analyzed) varied from 4.19 to 7.07 (median value 4.57). This may suggest that ion exchange of ammonium ions was supported by turning of NH4 into a form of ammonia gas (NH3), but this process starts at a pH of about 7.0 [74,75]. However, no measurements of ammonia concentration were made that could confirm this process. Furthermore, there was a positive (but not significant) correlation between pH values and concentration of NH4 for systems S1 and S3 but at the same time, the release of NO3 and NO2 decreased with increasing pH. This relationship was statistically significant only for NO3 in system 3 (r = −0.381). It may be suspected that at higher pH values, less ammonium ions were oxidized to nitrates and nitrites. Moreover, a decrease of Eh with an increase of pH was also observed for both systems, which indicates a higher oxygen consumption at a higher pH.

Effect of Eh on the Removal Processes
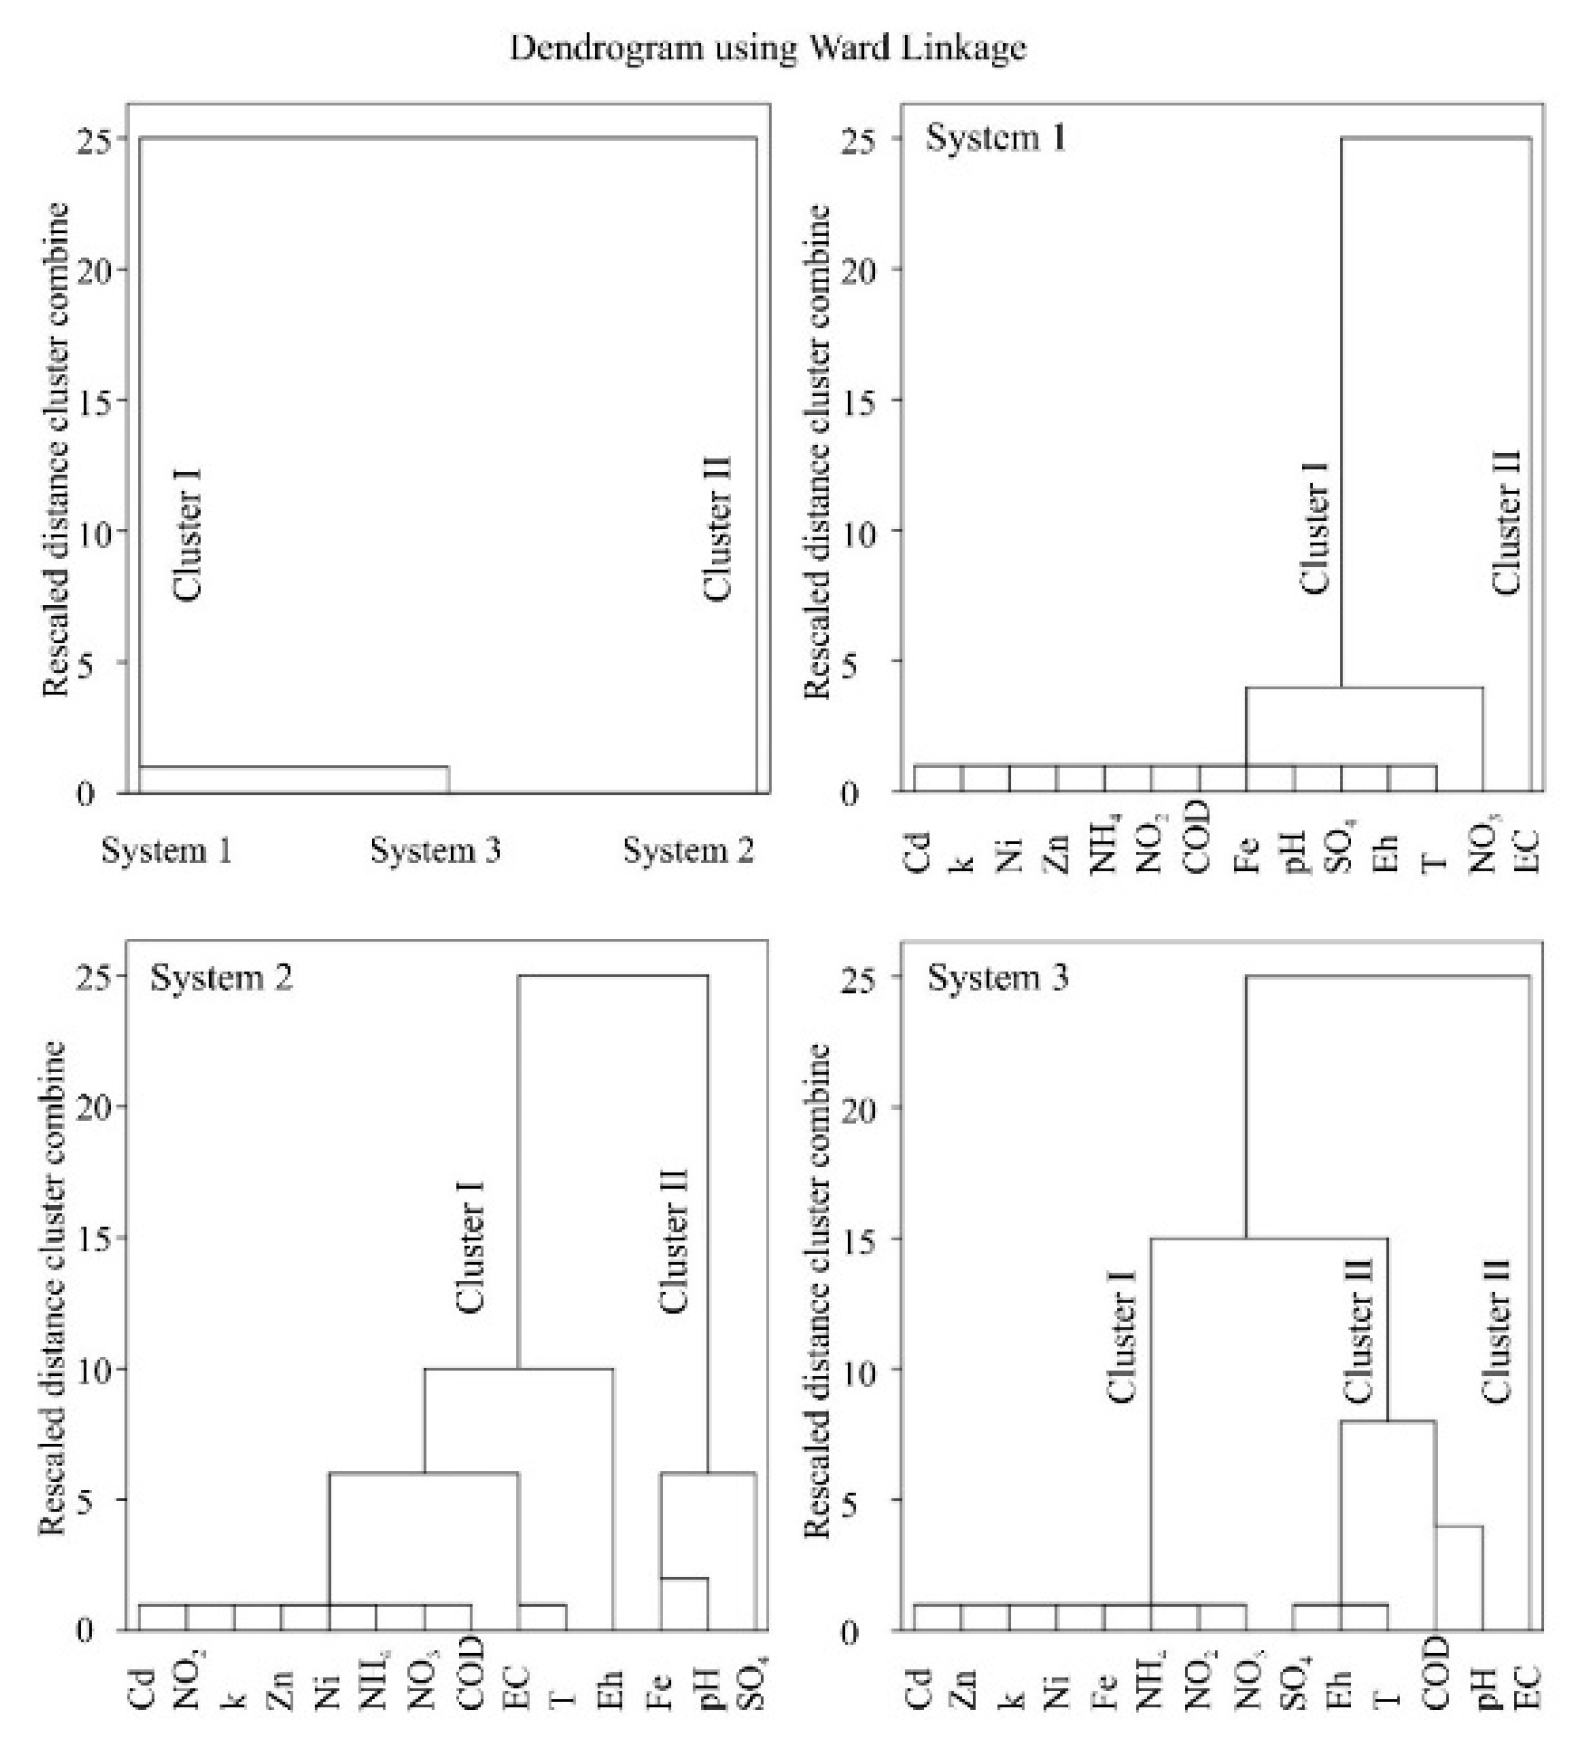
After analyzing the data, it can be stated that in all the systems, a negative correlation can be observed between the redox potential (Eh) and the concentration of NH4 and Fe ions, which may be related to the lower consumption of dissolved oxygen in the ZVI and NH4 oxidation processes. In the case of systems 1 and 3, Eh was most strongly positively correlated with temperature and hydraulic conductivity, as well as concentrations of SO4, NO2, NO3 and Zn. As a consequence, applying mixtures ZVI/AC/SS and ZVI/AC/LS is justified to extend the residence time in order to reduce the release of nitrogen oxides and sulfates into the flowing liquid. For system 2, an increase in Eh caused an increase in COD and pH, and, to a lesser extent, in EC, Cd, NO2 and hydraulic conductivity. In systems 1 and 3, a negative correlation existed between the redox potential and the values of EC and pH, while for system 2, it was the concentration of SO4, NO3 and Zn ions. The correlation of Eh with Cd, Ni and Zn concentrations was statistically insignificant, although this is the second parameter, after pH, influencing the mobility and availability of heavy metals. According to common knowledge [71], the most mobile forms of heavy metals occur in acidic environments with a high redox potential, while poorly soluble sulfides of divalent metals occur in a strongly reducing environment (Eh < −100 mV). In addition, metals in a slightly soluble form predominate in a neutral or slightly alkaline environment. Therefore, in most cases, in natural conditions, metals are effectively bounded in the form of oxides, hydroxides and carbonates [76].

Cluster Analysis

The dendrogram obtained as a result of CA, hierarchical cluster analysis and Wards method for three analyzed systems is shown in Figure 6. One linked clustering method was preferred by using Euclidean distance criteria in the cluster analysis. Accordingly, two groups were obtained. Cluster 1 consists of system 1 and system 3, while Cluster 2 includes system 2. This analysis showed also similarity between the treatment zones filled with mixtures containing silica spongolite (S1) and limestone (S3) in their composition. Tests of physicochemical properties of silica spongolite and limestone have shown similar characteristics of these materials. The pH values of SS and LS were 7.74 and 8.27, respectively, while the CaO content was determined at 96.5% for SS and 86.9% for LS.SiO2 was additionally noted in the SS oxide composition, while Fe2O3, SO3, SiO2, Al2O5, K2O, MgO, Na2O (in decreasing series) were observed in the LS sample. It was found, however, that silica spongolite has a larger specific surface area (2.82 m2/g) than limestone (0.91 m2/g), a much higher CEC value (77.61 meq/100 g and 1.12 meq/100 g, respectively), and is about 20 times cheaper than limestone. The similarity between these systems determined on the basis of statistical analyzes (ANOVA and CA) may be a premise to consider using cheaper material (silica spongolite) in future applications. Moreover, a cluster analysis was performed for the physical-chemical parameters for each system (Figure 6). System 1 consists of two clusters. Cluster I (Cd, k, Ni, Zn, NH4, NO2, COD, Fe, pH, SO4, Eh, T and NO3) is linked to a simplicifolius Cluster II (EC) for system 1. System 2 consisted of two clusters. EC and T are linked with Cd, NO2, k, Zn, Ni, NH4, NO3 and COD. This group was linked to Eh in the same group (Cluster I). Fe and pH is linked to SO4 (Cluster II) (Figure 6). System 3 comprises two clusters. The first cluster includes Cd, Zn, k, Ni, Fe, NH4, NO2, NO3-N, linked to SO4, Eh, T and COD. The second cluster contains EC and pH.

4. Conclusions

The results of our research and investigations presented in the literature allow us to conclude that infiltration of runoff waters from roads by appropriately selected materials is a method minimizing the migration of pollutants in the natural environment, especially in soil and water environments. The effective application of this method is limited to areas in which the soil is well permeable. In this paper, factors affecting the treatment processes occurring during the flow of artificial road runoff water through three pilot-scale treatment zones were discussed. The analysis of the test results allows the following conclusions to be drawn:
  • Proposed mixtures of reactive materials effectively remove dissolved heavy metals, primarily including Cu and Pb and, to a lesser extent, Zn, Cd and Ni. Statistically significant differences in the removal of Cd, Cu, Ni and Pb were not revealed for any of the selected mineral materials (SS, Z and LS). In addition, the system containing zeolite effectively removes ammonium ions.
  • Processes occurring during the flow of runoff water through filter beds resulted in the leaching of nitrogen oxides (S1 and S3), sulfates (all three systems) and iron (system 2) into the effluent solution. The concentration of nitrogen oxides and sulfates in the effluent solution from S1 and S3 and sulfate from S2 can be reduced by extending the residence time of runoff water in the treatment zones. However, this may result in increased iron release.
  • The statistical analysis (ANOVA and Cluster Analysis) showed similarity in the treatment effectiveness of the filter beds containing calcareous materials (SS and LS). Significant differences between these two systems were observed for four out of the 14 analyzed parameters (Zn, NH4, SO4 and pH), which may be the deciding factor in choosing a cheaper material (silica spongolite) for future applications.
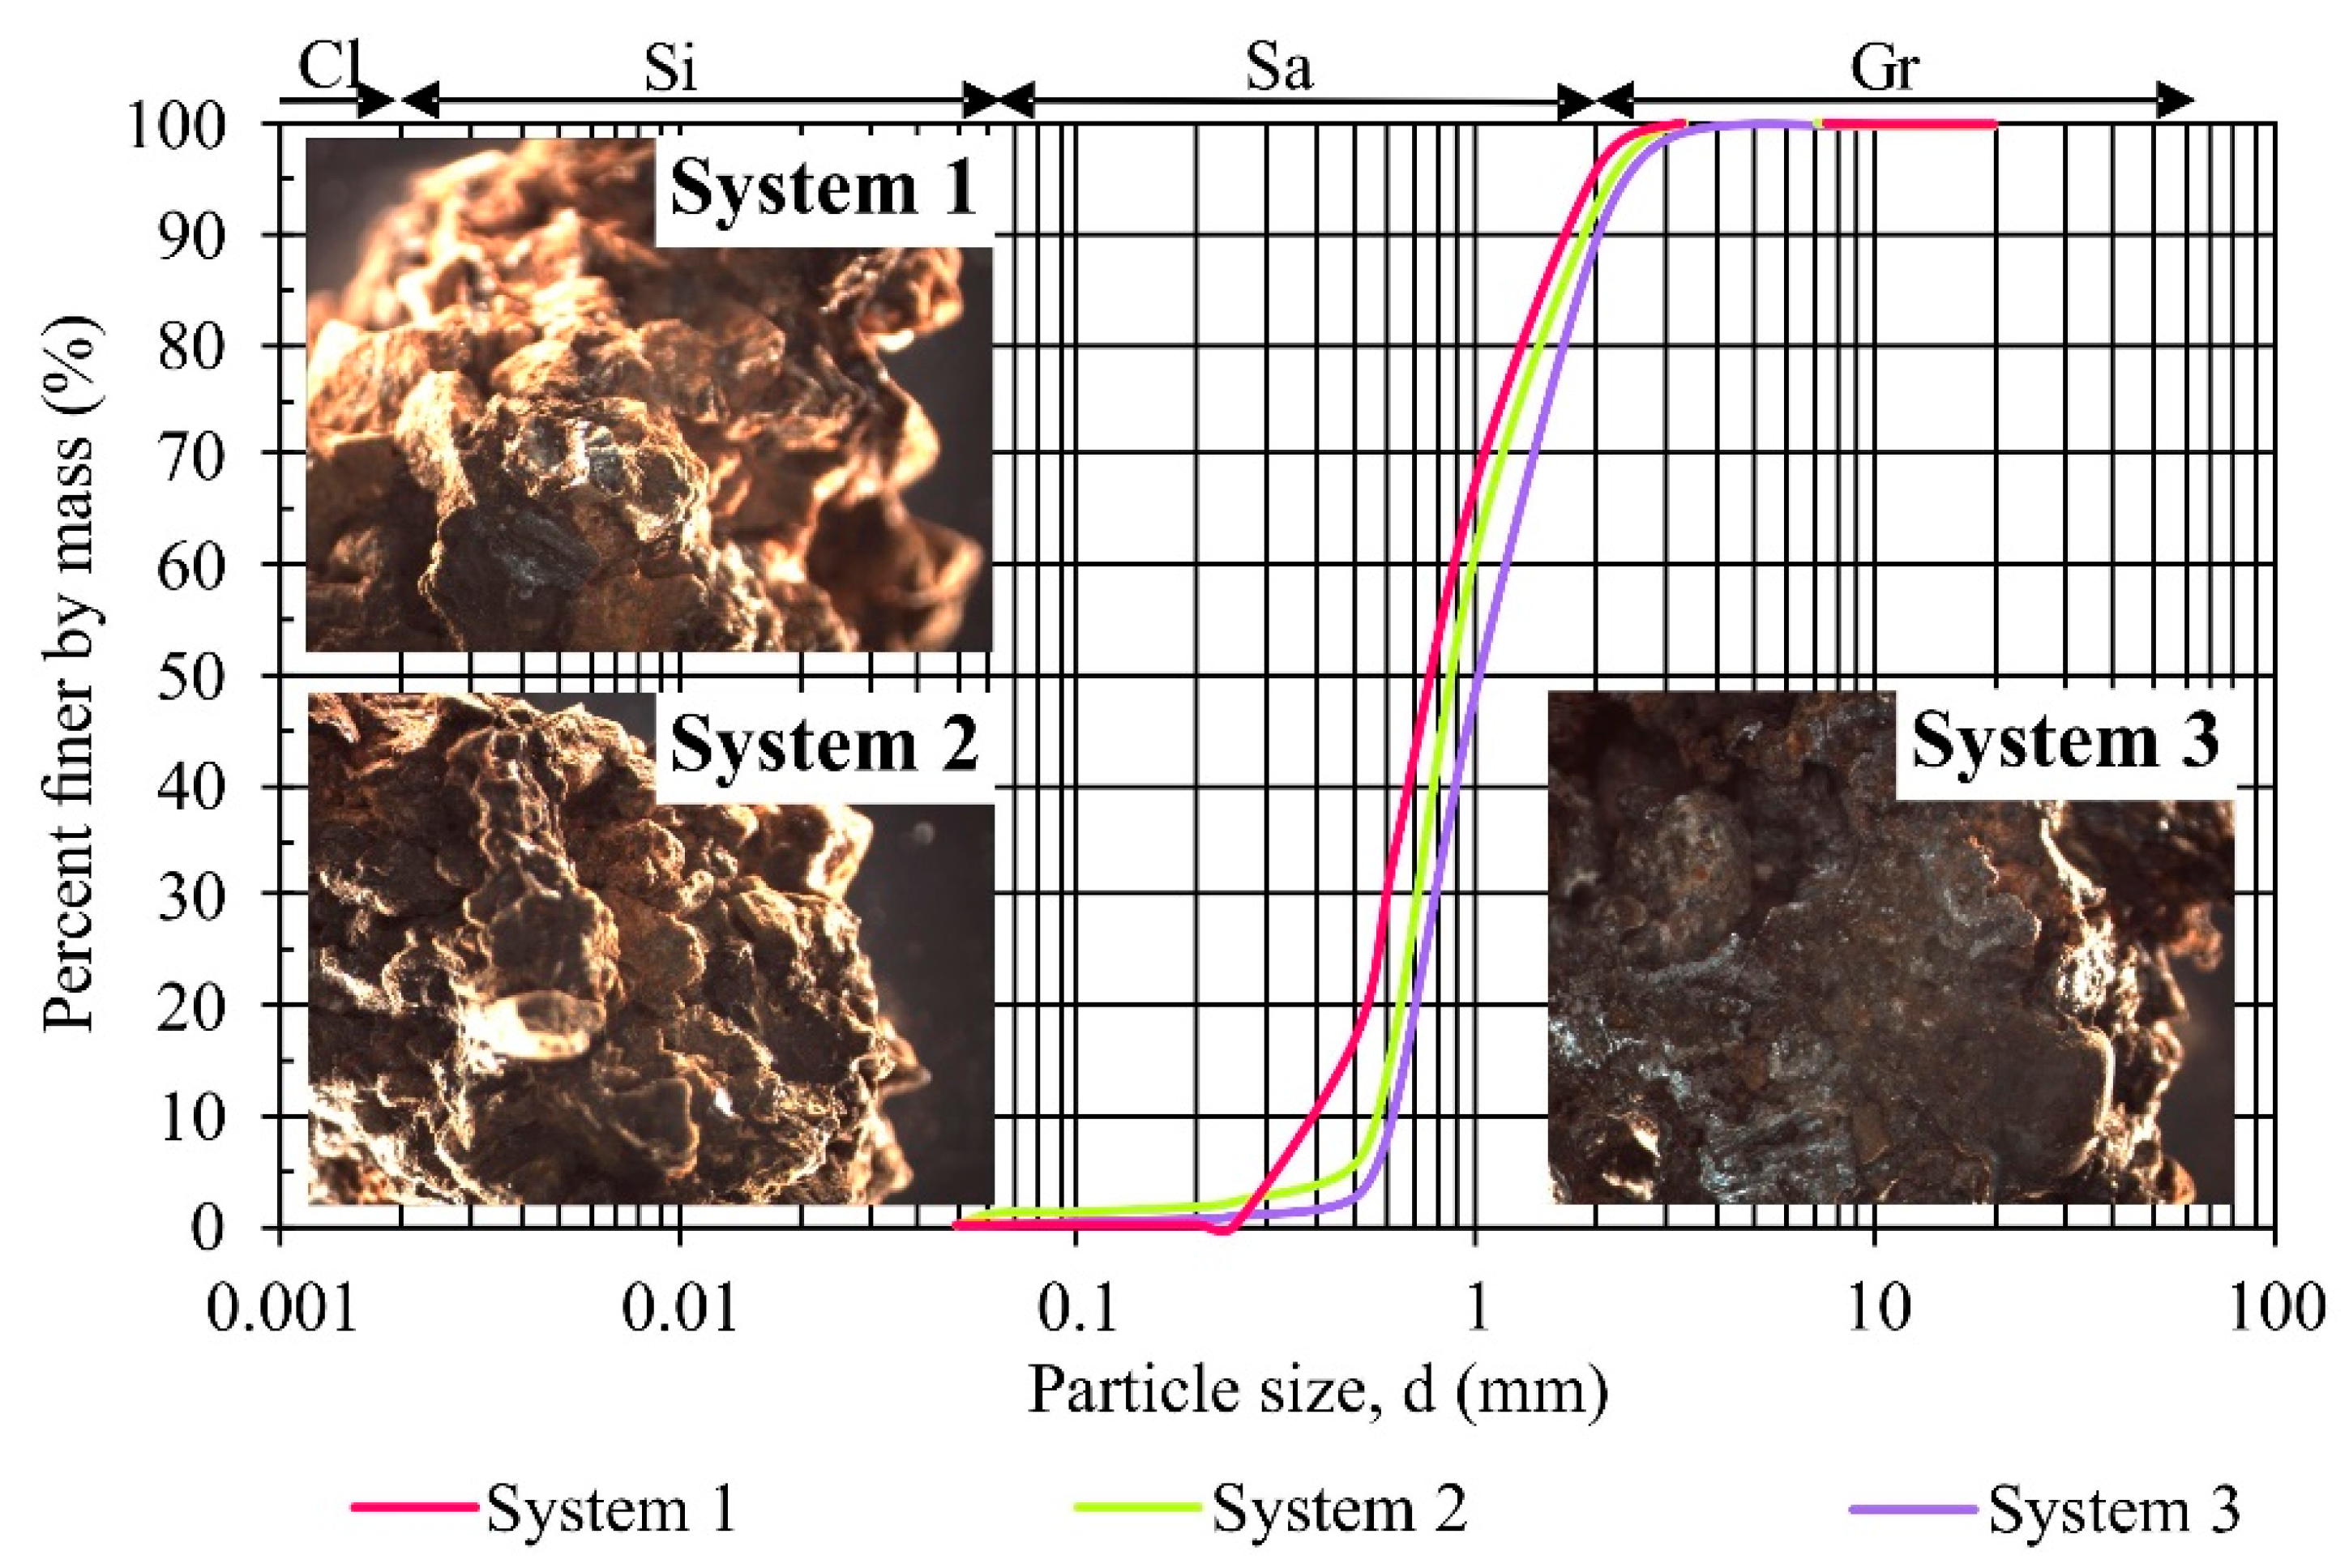
  • During 11 months of the field pilot-scale tests, a decrease of hydraulic conductivity was detected by about two orders of magnitude for the filter beds containing i.a. silica spongolite (S1) and limestone (S2), and by one order of magnitude for systems containing i.a. zeolite (S3). This was due to the occurrence of iron corrosion process and the precipitation of iron hydroxides. However, the changes in hydraulic conductivity were statistically not significant; therefore, this factor did not affect the selection of the best mixture for future applications.
  • The removal effectiveness of individual contaminants together with the results of the statistical analysis allow to consider ZVI/AC/Z as the most suitable mixture for large-scale application. However, due to clogging processes, it is necessary to consider the decrease of the ZVI content in the mixture and maintaining the treatment zone as fully saturated, e.g., by ensuring the level of the inlet and outlet of the runoff water above the filter bed level.

Supplementary Materials

The following are available online at https://www.mdpi.com/2071-1050/12/3/873/s1: Table S1: Oxide composition for mixtures of reactive materials from systems analyzed after field tests, Table S2: Varimax rotated factor matrix for the whole data set.

Author Contributions

Conceptualization, J.F.; methodology, J.F., A.B. and K.M.-L.; investigation, J.F.; validation, J.F. and K.M.-L.; data curation, J.F., A.B. and K.M.-L.; writing—original draft preparation, J.F.; writing—review and editing, J.F., A.B. and K.M.-L.; visualization, J.F. and A.B.; supervision, J.F. All authors have read and agreed to the published version of the manuscript.

Funding

This research was funded by National Science Centre (Poland) grant number NN523 561638.

Acknowledgments

The authors would like to thank anonymous reviewers of Sustainability, whose comments contributed to improving the quality of the manuscript.

Conflicts of Interest

The authors declare no conflict of interest.

References

  1. Helmreich, B.; Hilliges, R.; Schriewer, A.; Horn, H. Runoff pollutants of a highly trafficked urban road—Correlation analysis and seasonal influences. Chemosphere 2010, 80, 991–997. [Google Scholar] [CrossRef]
  2. Lundy, L.; Ellis, J.B.; Revitt, D.M. Risk prioritisation of stormwater pollutant sources. Water Res. 2012, 46, 6589–6600. [Google Scholar] [CrossRef]
  3. Mullaney, J.; Lucke, T. Practical review of pervious pavement designs. Clean–Soil Air Water 2014, 42, 111–124. [Google Scholar] [CrossRef]
  4. Revitt, D.M.; Lundy, L.; Coulon, F.; Fairley, M. The sources, impact and management of car park runoff pollution: A review. J. Environ. Manag. 2014, 146, 552–567. [Google Scholar] [CrossRef] [PubMed] [Green Version]
  5. Brown, J.N.; Peak, B.M. Sources of heavy metals and polycyclic aromatic hydrocarbons in urban storm water runoff. Sci. Total Environ. 2006, 359, 145–155. [Google Scholar] [CrossRef] [PubMed]
  6. Fuerhacker, M.; Haile, T.M.; Monai, B.; Mentler, A. Performance of a filtration system equipped with filter media for parking lot runoff treatment. Desalination 2011, 275, 118–125. [Google Scholar] [CrossRef]
  7. Alam, M.Z.; Anwar, A.F.; Heitz, A.; Sarker, D.C. Improving stormwater quality at source using catch basin inserts. J. Environ. Manag. 2018, 228, 393–404. [Google Scholar] [CrossRef] [PubMed]
  8. Huber, M.; Welker, A.; Helmreich, B. Critical review of heavy metal pollution of traffic area runoff: Occurrence, influencing factors, and partitioning. Sci. Total Environ. 2016, 541, 895–919. [Google Scholar] [CrossRef] [PubMed]
  9. Kalmykova, Y.; Björklund, K.; Strömvall, A.M.; Blom, L. Partitioning of polycyclic aromatic hydrocarbons, alkylphenols, bisphenol A and phthalates in landfill leachates and stormwater. Water Res. 2013, 47, 1317–1328. [Google Scholar] [CrossRef] [PubMed] [Green Version]
  10. Markiewicz, A.; Björklund, K.; Eriksson, E.; Kalmykova, Y.; Strömvall, A.-M.; Siopi, A. Emissions of organic pollutants from traffic and roads: Priority pollutants selection and substance flow analysis. Sci. Total Environ. 2017, 580, 1162–1174. [Google Scholar] [CrossRef]
  11. Gavrić, S.; Leonhardt, G.; Marsalek, J.; Viklander, M. Processes improving urban stormwater quality in grass swales and filter strips: A review of research findings. Sci. Total Environ. 2019, 669, 431–447. [Google Scholar] [CrossRef]
  12. Maestre, A.; Pitt, R. The National Stormwater Quality Data-Base, Version 1.1 A Compilation and Analysis of NPDES Stormwater Monitoring Information; U.S. Environmental Protection Agency (EPA) Office of Water: Washington, DC, USA, 2005.
  13. Kayhanian, M.; Fruchtman, B.D.; Gulliver, J.S.; Montanaro, C.; Ranieri, E.; Wuertz, S. Review of highway runoff characteristics: Comparative analysis and universal implications. Water Res. 2012, 46, 6609–6624. [Google Scholar] [CrossRef]
  14. Griffiths, L.N.; Mitsch, W.J. Removal of nutrients from urban stormwater runoff by storm-pulsed and seasonally pulsed created wetlands in the subtropics. Ecol. Eng. 2017, 108, 414–424. [Google Scholar] [CrossRef]
  15. Duan, S.; Mayer, P.M.; Kaushal, S.S.; Wessel, B.M.; Johnson, T. Regenerative stormwater conveyance (RSC) for reducing nutrients in urban stormwater runoff depends upon carbon quantity and quality. Sci. Total Environ. 2019, 652, 134–146. [Google Scholar] [CrossRef]
  16. Novotny, E.V.; Murphy, D.; Stefan, H.G. Increase of urban lake salinity by road deicing salt. Sci. Total Environ. 2008, 406, 131–144. [Google Scholar] [CrossRef]
  17. Collins, S.J.; Russell, R.W. Toxicity of road salt to Nova Scotia amphibians. Environ. Pollut. 2009, 157, 320–324. [Google Scholar] [CrossRef]
  18. Fronczyk, J.; Radziemska, M.; Dynowski, P.; Mazur, Z.; Bazydło, M. Quality of water in the road drainage systems in the Warsaw agglomeration, Poland. Water 2016, 8, 429. [Google Scholar] [CrossRef] [Green Version]
  19. Gunawardana, C.; Goonetilleke, A.; Egodawatta, P.; Dawes, L.; Kokot, S. Source characterisation of road dust based on chemical and mineralogical composition. Chemosphere 2012, 87, 163–170. [Google Scholar] [CrossRef] [Green Version]
  20. Pratt, C. A review of source control of urban stormwater runoff. Water Environ. Manag. 1995, 9, 132–139. [Google Scholar] [CrossRef]
  21. Norrström, A.C. Metal mobility by de-icing salt from an infiltration trench for highway runoff. Appl. Geochem. 2005, 20, 1907–1919. [Google Scholar] [CrossRef]
  22. Fach, S.; Dierkes, C. On-site infiltration of road runoff using pervious pavements with subjacent infiltration trenches as source control strategy. Water Sci. Technol. 2011, 64, 1388–1397. [Google Scholar] [CrossRef] [PubMed] [Green Version]
  23. Eriksson, E.; Baun, A.; Scholes, L.; Ledin, A.; Ahlman, S.; Revitt, M.; Noutsopoulos, C.; Mikkelsen, P.S. Selected stormwater priority pollutants—A European perspective. Sci. Total Environ. 2007, 383, 41–51. [Google Scholar] [CrossRef] [PubMed]
  24. Hilliges, R.; Schriewer, A.; Helmreich, B. A three-stage treatment system for highly polluted urban road runoff. J. Environ. Manag. 2013, 128, 306–312. [Google Scholar] [CrossRef] [PubMed]
  25. Bogacz, A.; Woźniczka, P.; Burszta-Adamiak, E.; Kolasińska, K. Methods of enhancing water retention in urban areas. Sci. Rev. Eng. Env. Sci. 2013, 59, 27–35. (In Polish) [Google Scholar]
  26. Matusiewicz, W.; Wrzesiński, G. Drainage of the depression area in a small urban catchment. Acta Sci. Pol. Archit. 2018, 17, 131–144. (In Polish) [Google Scholar]
  27. Weiss, P.T.; LeFevre, G.; Gulliver, J.S. Contamination of Soil and Groundwater Due to Stormwater Infiltration Practices. A Literature Review; Minnesota Pollution Control Agency: Saint Paul, MN, USA, 2008. [Google Scholar]
  28. Zhou, W.; Beck, B.F.; Green, E.T. Evaluation of a peat filtration system for treating highway runoff in a karst setting. Environ. Geol. 2003, 44, 187–202. [Google Scholar] [CrossRef]
  29. Birch, G.F.; Fayeli, F.S.; Matthai, C. Efficiency of an infiltration basin in removing contaminants from urban storm water. Environ. Monit. Assess. 2005, 101, 145–155. [Google Scholar]
  30. Karczmarczyk, A.; Bus, A. Removal of phosphorus using suspended reactive filters (SRFs)—Efficiency and potential applications. Water Sci. Technol. 2017, 76, 1104–1111. [Google Scholar] [CrossRef]
  31. Zhao, J.; Zhao, Y.; Xu, Z.; Doherty, L.; Liu, R. Highway runoff treatment by hybrid adsorptive media-baffled subsurface flow constructed wetland. Ecol. Eng. 2016, 91, 231–239. [Google Scholar] [CrossRef]
  32. Reddy, K.R.; Kumar, G. Permeable reactive filter systems for the treatment of urban stormwater runoff with mixed pollutants. Geotech. Front. 2017, 2017, 508–517. [Google Scholar]
  33. Hatt, B.E.; Fletcher, T.D.; Deletic, A. Treatment performance of gravel filter media: Implications for design and application of stormwater infiltration systems. Water Res. 2007, 41, 2513–2524. [Google Scholar] [CrossRef] [PubMed]
  34. O’Reilly, A.M.; Wanielista, M.P.; Chang, N.-B.; Xuan, Z.; Harris, W.G. Nutrient removal using biosorption activated media: Preliminary biogeochemical assessment of an innovative stormwater infiltration basin. Sci. Total Environ. 2012, 432, 227–242. [Google Scholar] [CrossRef] [PubMed]
  35. Flanagan, K.; Branchu, P.; Boudahmane, L.; Caupos, E.; Demare, D.; Deshayes, S.; Dubois, P.; Meffray, L.; Partibane, C.; Saad, M.; et al. Field performance of two biofiltration systems treating micropollutants from road runoff. Water Res. 2018, 145, 562–578. [Google Scholar] [CrossRef] [PubMed]
  36. Vesting, A. Entwicklung und Evaluation Eines Dezentralen Behandlungssystems zum Rückhalt von Organischen Spurenstoffen und Schwermetallen aus Verkehrsflächenabflüssen; Schriftenreihe Siedlungswasserwirtschaft Bochum: Bochum, Germany, 2018; p. 74. [Google Scholar]
  37. Erickson, A.J.; Gulliver, J.S.; Weiss, P.T. Enhanced sand filtration for storm water phosphorus removal. J. Environ. Eng. 2007, 133, 485–497. [Google Scholar] [CrossRef] [Green Version]
  38. Erickson, A.J.; Gulliver, J.S.; Weiss, P.T. Capturing phosphates with iron enhanced sand filtration. Water Res. 2012, 46, 3032–3042. [Google Scholar] [CrossRef]
  39. Erickson, A.J.; Gulliver, J.S.; Weiss, P.T. Phosphate removal from agricultural tile drainage with iron enhanced sand. Water 2017, 9, 672. [Google Scholar] [CrossRef] [Green Version]
  40. Reddy, K.R.; Xie, T.; Dastgheibi, S. Nutrients removal from urban stormwater by different filter materials. Water Air Soil Pollut. 2014, 225, 1778. [Google Scholar] [CrossRef]
  41. Henderson, A.D.; Demond, A.H. Long-Term Performance of Zero-Valent Iron Permeable Reactive Barriers: A Critical Review. Environ. Eng. Sci. 2007, 24, 401–423. [Google Scholar] [CrossRef] [Green Version]
  42. Liu, Y.; Wang, J. Reduction of nitrate by zero valent iron (ZVI)-based materials: A review. Sci. Total Environ. 2019, 671, 388–403. [Google Scholar] [CrossRef]
  43. Arora, M.; Snape, I.; Stevens, G.W. The effect of temperature on toluene sorption by granular activated carbon and its use in permeable reactive barriers in cold regions. Cold Reg. Sci. Technol. 2011, 66, 12–16. [Google Scholar] [CrossRef]
  44. Pawluk, K.; Fronczyk, J.; Garbulewski, K. Reactivity of nano zero-valent iron in permeable reactive barriers. Pol. J. Chem. Technol. 2015, 17, 7–10. [Google Scholar] [CrossRef] [Green Version]
  45. Pawluk, K.; Fronczyk, J.; Garbulewski, K. Experimental development of contaminants removal from multicomponent solutions—Column test. Desalin. Water Treat. 2019, 144, 89–98. [Google Scholar] [CrossRef]
  46. Pawluk, K.; Fronczyk, J. Evaluation of single and multilayered reactive zones for heavy metals removal from stormwater. Environ. Technol. 2015, 36, 1576–1583. [Google Scholar] [CrossRef] [PubMed]
  47. Fronczyk, J.; Mumford, K.A. The impact of temperature on the removal of inorganic contaminants typical of urban stormwater. Appl. Sci. 2019, 9, 1273. [Google Scholar] [CrossRef] [Green Version]
  48. Caré, S.; Crane, R.; Calabrò, P.S.; Ghauch, A.; Temgoua, E.; Noubactep, C. Modeling the permeability loss of metallic iron water filtration systems. Clean—Soil Air Water 2013, 41, 275–282. [Google Scholar] [CrossRef] [Green Version]
  49. Fronczyk, J. Artificial road runoff water treatment by a pilot-scale horizontal permeable treatment zone. Ecol. Eng. 2017, 107, 198–207. [Google Scholar] [CrossRef]
  50. Majewski, G.; Przewoźniczuk, W.; Kleniewska, M. Precipitation at the meteorological station in Ursynów WULS—SGGW in 1960–2009. Sci. Rev. Eng. Env. Sci. 2010, 2, 3–22. (In Polish) [Google Scholar]
  51. Landau, S.; Everitt, B. A Handbook of Statistical Analysis Using SPSS, 1st ed.; CRC Press: Boca Raton, FL, USA, 2003. [Google Scholar]
  52. Kalaycı, Ş. SPSS Uygulamalı çok Değişkenli Istatistik Teknikleri, 1st ed.; Asil Yayın Dağıtım: Çankaya, Turkey, 2009. (In Turkish) [Google Scholar]
  53. Jolliffe, I. Principal Component Analysis, 2nd ed.; Springer: New York, NY, USA, 2002. [Google Scholar]
  54. Brtnický, M.; Pecina, V.; Hladký, J.; Radziemska, M.; Koudelková, Z.; Klimánek, M.; Richtera, L.; Adamcová, D.; Elbl, J.; Galiová, M.V.; et al. Assessment of phytotoxicity, environmental and health risks of historical urban park soils. Chemosphere 2019, 220, 678–686. [Google Scholar] [CrossRef]
  55. Tabachnick, B.G.; Fideli, L.S. Using Multivariate Statistics, 4th ed.; Ally and Bacon: Boston, FL, USA, 2001; pp. 256–267. [Google Scholar]
  56. Prakash, M.M.; Dagaonkar, A. Application of cluster analysis to physco-chemical parameters of Munj Sagar Talab, Dhar (Madhya Pradesh, India). Recent Res. Sci. Technol. 2011, 3, 41–50. [Google Scholar]
  57. Tiri, A.; Lahbari, N.; Boudoukha, A. Assessment of the quality of water by hierarchical cluster and variance analyses of the Koudiat Medouar Watershed, East Algeria. Appl. Water Sci. 2017, 7, 4197–4206. [Google Scholar] [CrossRef] [Green Version]
  58. Hsieh, C.H.; Davis, A.P.; Needelman, B.A. Nitrogen removal from urban stormwater runoff through layered bioretention columns. Water Environ. Res. 2007, 79, 2404–2411. [Google Scholar] [CrossRef] [PubMed]
  59. LeFevre, G.H.; Paus, K.H.; Natarajan, P.; Gulliver, J.S.; Novak, P.J.; Hozalski, R.M. Review of dissolved pollutants in urban storm water and their removal and fate in bioretention cells. J. Environ. Eng. 2015, 141, 04014050. [Google Scholar] [CrossRef]
  60. Roehl, K.E.; Meggyes, T.; Simon, F.G.; Stewart, D.I. (Eds.) Long-Term Performance of Permeable Reactive Barriers, 1st ed.; Elsevier: Amsterdam, The Netherlands, 2005. [Google Scholar]
  61. Suponik, T.; Lutyński, M. In-situ treatment of groundwater contaminated with underground coal gasification products. Arch. Min. Sci. 2013, 58, 1263–1278. [Google Scholar]
  62. Luo, P.; Bailey, E.H.; Mooney, S.J. Quantification of changes in zero valent iron morphology using X-ray computed tomography. J. Environ. Sci. 2013, 25, 2344–2351. [Google Scholar] [CrossRef]
  63. Noubactep, C.; Temgoua, E.; Rahman, M.A. Designing iron-amended biosand filters for decentralized safe drinking water provision. Clean—Soil Air Water 2012, 40, 798–807. [Google Scholar] [CrossRef] [Green Version]
  64. Rahman, M.A.; Karmakar, S.; Salama, H.; Gactha-Bandjun, N.; Btatkeu, K.B.D.; Noubactep, C. Optimising the design of Fe0-based filtration systems for water treatment: The suitability of porous iron composites. J. Appl. Solut. Chem. Model. 2013, 2, 165–177. [Google Scholar]
  65. Claytor, R.A.; Schueler, T.R. Design of Storfm Water Filtering Systems; Chesapeake Research Consortium and U.S. Environmental Protection Agency: Washington, DC, USA, 1996.
  66. Fronczyk, J.; Radziemska, M.; Mazur, Z. Copper removal from contaminated groundwater using natural and engineered limestone sand in permeable reactive barriers. Fresenius Environ. Bull. 2015, 24, 228–234. [Google Scholar]
  67. Hair, J.F.; Anderson, R.E.; Tatham, R.L.; Black, W.C. Factorial Analysis. Multivariate Data Analysis, 5th ed.; Prentice Hall: Upper Saddle River, NJ, USA, 1998. [Google Scholar]
  68. Sharma, S. Applied Multivariate Techniques, 1st ed.; John Wiley & Sons Inc.: New York, NY, USA, 1996. [Google Scholar]
  69. Suzuki, T.; Moribe, M.; Oyama, Y.; Niinae, M. Mechanism of nitrate reduction by zero-valent iron: Equilibrium and kinetics studies. Chem. Eng. J. 2012, 183, 271–277. [Google Scholar] [CrossRef]
  70. Hossain, M.; Mahmud, M.; Parvez, M.; Cho, H.M. Impact of current density, operating time and pH of textile wastewater treatment by electrocoagulation process. Environ. Eng. Res. 2013, 18, 157–161. [Google Scholar] [CrossRef]
  71. Suthersan, S.S.; Horst, J.; Schnobrich, M.; Welty, N.; McDonough, J. Remediation Engineering: Design Concepts, 2nd ed.; CRC Press: Boca Raton, FL, USA, 2016. [Google Scholar]
  72. Kuo, J. Practical Design Calculations for Groundwater and Soil Remediation, 2nd ed.; CRC Press: Boca Raton, FL, USA, 2014. [Google Scholar]
  73. Reardon, E.J. Zerovalent irons: Styles of corrosion and inorganic control on hydrogen pressure buildup. Environ. Sci. Technol. 2005, 39, 7311–7317. [Google Scholar] [CrossRef]
  74. Brennan, R.B. Chemical Amendment of Dairy Slurry for the Control of Phosphorus in Runoff from Grassland. Ph.D. Thesis, National University of Ireland Galway, Galway, Ireland, 2011. [Google Scholar]
  75. Kunz, A.; Mukhtar, S. Hydrophobic membrane technology for ammonia extraction from wastewaters. Eng. Agríc. 2016, 36, 377–386. [Google Scholar] [CrossRef] [Green Version]
  76. Yong, R.N.; Mulligan, C.N. Natural Attenuation of Contaminants in Soil, 1st ed.; CRC Press: Boca Raton, FL, USA, 2004. [Google Scholar]
Figure 1. Box plots showing the effectiveness of heavy metals removal in pilot-scale treatment zones (system 1, system 2 and system 3) with the results presented in the literature (lines extending vertically from the box indicate minimum and maximum values, the box reflects the 25 to 75 percentiles, the horizontal line in the box means that the median and the x is the mean value, n = 31).
Sustainability 12 00873 g001
Figure 2. Box plots showing the removal effectiveness and/or enhancement ratio of nitrogen compounds, COD, iron ions and sulfates in pilot-scale treatment zones (lines extending vertically from the box indicate minimum and maximum values, the box reflects the 25 to 75 percentiles, the horizontal line in the box means that the median and the x is the mean value, n = 31).
Sustainability 12 00873 g002
Figure 3. Box plots of pH, electrolytic conductivity (EC) and redox potential (Eh) (lines extending vertically from the box indicate minimum and maximum values, the box reflects the 25 to 75 percentiles, the horizontal line in the box means that the median and the x is the mean value, n = 500).
Sustainability 12 00873 g003
Figure 4. Particle size distribution curves for mixtures of reactive materials used in the field tests together with stereoscopic microscope images (×20) of aggregates formed during the tests.
Sustainability 12 00873 g004
Figure 5. Graphic position of factor load vectors for system 1 (a), system 2 (b), and system 3 (c).
Sustainability 12 00873 g005
Figure 6. Cluster analysis results for the three analyzed systems and for chemical parameters of system 1, system 2 and system 3.
Sustainability 12 00873 g006
Table 1. Overview of selected field-scaled applications of modified infiltration systems.
ReferenceType of Infiltration System (Country)Filter MaterialsContaminants Monitored
Zhou et al. [28]Permeable treatment wall (USA)Gabion filled with stone followed by peat filterPAHs, heavy metals (Cu, Pb, Zn), TPH, TSS, TDS, TVS
Birch et al. [29]Infiltration basin (Australia)Zeolite and coarse, pure quartzitic sand mixture (1:6 by volume)NO3, TKN, TP, fecal coliforms, trace metals (Cd, Cr, Cu, Fe, Mn, Ni, Pb, Zn), organochlorines, PCBs, PAHs, methylnaphthalene, oil, grease
Hatt et al. [33]Biofiltration basins (Australia)(1) 80% sandy loam, 10% vermiculite, 10% perlite (by volume)
(2) 80% sandy loam, 10% compost, 10% hardwood mulch (by volume)
TSS, TP, filterable reactive phosphorus, TN, NH4, NOx, dissolved organic nitrogen, Cu, Cd, Pb, Zn, Mn
Fuerhacker et al. [6]3 chambers filled with filter materials (Austria)Vermiculite, zeolite, activated carbon, gravelPAHs, mineral oil, TOC, TSS, NH4, chlorides, total and dissolved heavy metals (Cd, Cu, Zn)
O’Reilly i in. [34]Infiltration basin amended using biosorption activated media (USA)Tire crumb, silt and clay and sand mixture (1.0:1.9:4.1 by volume)Nutrients (NO3, NH4, PO4-P)
Hilliges et al. [24]System containing: (1) gutter system, (2) grit chamber and (3) filter unit (Germany)Filter unit (stage 3 of treatment system) consisted of lignite coke (activated lignite)Heavy metals (Zn, Cu, Pb), Na, TOC
Flanagan et al. [35]Linear biofilters and vegetative filter strip (France)Silt loam topsoil and 0-4 mm limestone mixture (1:1.5 by volume)TSS, OC, nutrients (N and P forms), trace metals and major elements (Al, As, Ba, Ca, Cd, Co, Cr, Cu, Fe, K, Mg, Mn, Mo, Na, Ni, Pb, Si, Sr, Ti, V, Zn), C10-C40 hydrocarbons, PAHs, bisphenol-A, alkylphenols, phthalates
Vesting [36]“FiltaPex” system consisting of a sedimentation chamber and a layer of filter mats (Germany)Filter mats filled with mixture of activated granular Al2O3 and Fe2O3, aerated concrete and activated carbonCa, Na, Cl, P, Fe, Cu, Zn, hydrocarbons, PAHs, MTBE
Table 2. Characteristics of pilot-scale horizontal permeable treatment zones.
Total Mass of Reactive Materials (kg)System 1System 2System 3
75 kg of a Mixture of Reactive Materials in a Weight Proportion of 1:1:1
ZVI/AC/SS *ZVI/AC/Z **ZVI/AC/LS ***
Treatment zone area (m2)0.130.130.13
Layers of treatment system (starting from the top)
(1)
0.15 m QG ****
(2)
geotextile
(3)
0.460 m treatment zone (ZVI/AC/SS)
(4)
geotextile
(5)
0.15 m QG
(1)
0.15 m QG
(2)
geotextile
(3)
0.485 m treatment zone (ZVI/AC/Z)
(4)
geotextile
(5)
0.15 m QG
(1)
0.15 m QG
(2)
geotextile
(3)
0.410 m treatment zone (ZVI/AC/LS)
(4)
geotextile
(5)
0.15 m QG
Runoff surface (m2)333
* ZVI/AC/SS—zero valent iron/activated carbon/silica spongolite; ** ZVI/AC/Z—zero valent iron/activated carbon/zeolite; *** ZVI/AC/LS—zero valent iron/activated carbon/limestone; **** QG—quartz gravel with grain diameter in the range of 1.0–5.0 mm.
Table 3. Characteristic values of hydraulic conductivity (k) (n = 31).
SystemAverage k Value (±SD) (m/s)Median k Value (m/s)Initial k Value (m/s)End k Value (m/s)
S11.71 × 10−4 (±0.00024)5.99 × 10−59.64 × 10−43.22 × 10⁻⁵
S21.83 × 10−4 (±0.00029)5.99 × 10−51.09 × 10−33.27 × 10⁻⁵
S31.59 × 10−4 (±0.00018)1.03 × 10−48.49 × 10−45.04 × 10⁻⁵
Table 4. ANOVA analysis for three horizontal permeable treatment zones (between groups) (values in bold show statistical difference between groups).
VariableSum of Squaresdf 1Mean SquareF 2Sig.
Cd0.00020.0000.0880.916
Ni0.00120.0011.1360.326
Zn0.01220.0066.0840.003
COD 3292.6732146.33669.0850.000
NH41.17120.58518.8500.000
NO338.857219.42923.7810.000
NO22.84821.42438.8070.000
Fe249.4722124.7367.6570.001
SO415,495.76327747.88243.1970.000
pH200.9152100.45855.3160.000
EC 41,355,197.0072677,598.5041.7600.178
Eh 581,037.964240,518.9824.3290.016
T 68.18824.0940.1510.860
k 70.00020.0000.0750.928
1 number of degrees of freedom, 2 value of test statistics, 3 chemical oxygen demand, 4 electrical conductivity, 5 redox potential, 6 temperature, 7 hydraulic conductivity.
Table 5. ANOVA analysis for three systems in (p < 0.05) statistical different parameters (values in bold show statistical difference between locations at 95% confidence level (p < 0.05); SE is the standard error; Sig. is the significance value; * shows that the mean difference is significant at the 0.05 level).
Dependent Variable(I) System(J) SystemMean Difference (I-J)SESig.Dependent Variable(I) System(J) SystemMean Difference (I-J)SESig.
Zn120.0196 *0.0080.018Fe12−6.74 *2.280.004
30.0269 *0.0080.001 32.002.270.379
21−0.0196 *0.0080.018216.74 *2.290.004
30.00720.0080.371 38.75 *2.290.000
31−0.026 *0.0080.00131−2.002.270.379
2−0.0070.0080.371 2−8.75 *2.290.000
COD124.07 *0.370.000SO41232.20 *3.410.000
30.600.360.104 317.12 *3.380.000
21−4.07 *0.370.00021−32.20 *3.410.000
3−3.47 *0.370.000 3−15.07 *3.410.000
31−0.6070.360.10431−17.12 *3.380.000
23.47 *0.370.000 215.07 *3.410.000
NH412−0.0390.040.376pH123.39 *0.340.000
30.220 *0.040.000 30.73 *0.340.034
210.0390.040.37621−3.39 *0.350.000
30.260 *0.040.000 3−2.65 *0.350.000
31−0.220 *0.040.00031−0.73 *0.340.034
2−0.260 *0.040.000 22.65 *0.350.000
NO3121.41 *0.230.000Eh1271.84 *24.910.005
30.0980.230.671 328.4824.700.252
21−1.41 *0.230.00021−71.84 *24.910.005
3−1.32 *0.230.000 3−43.3524.910.085
31−0.0980.230.67131−28.4824.700.252
21.320 *0.230.000 243.3524.910.085
NO2120.311 *0.040.000T12−0.0431.340.974
3−0.100 *0.040.044 30.581.320.665
21−0.311 *0.040.000210.041.340.974
3−0.411 *0.040.000 30.621.340.644
310.100 *0.040.04431−0.571.320.665
20.411 *0.040.000 2−0.621.340.644

