3DPortCityMeasure: Methodology for the Comparative Study of Good Practices in Port–City Integration


Abstract
:1. Introduction
2. Background: City and Port Studies
3. 3DPortCityMeasure: A Methodology for the Comparative Study of Good Practices in Port-City Integration
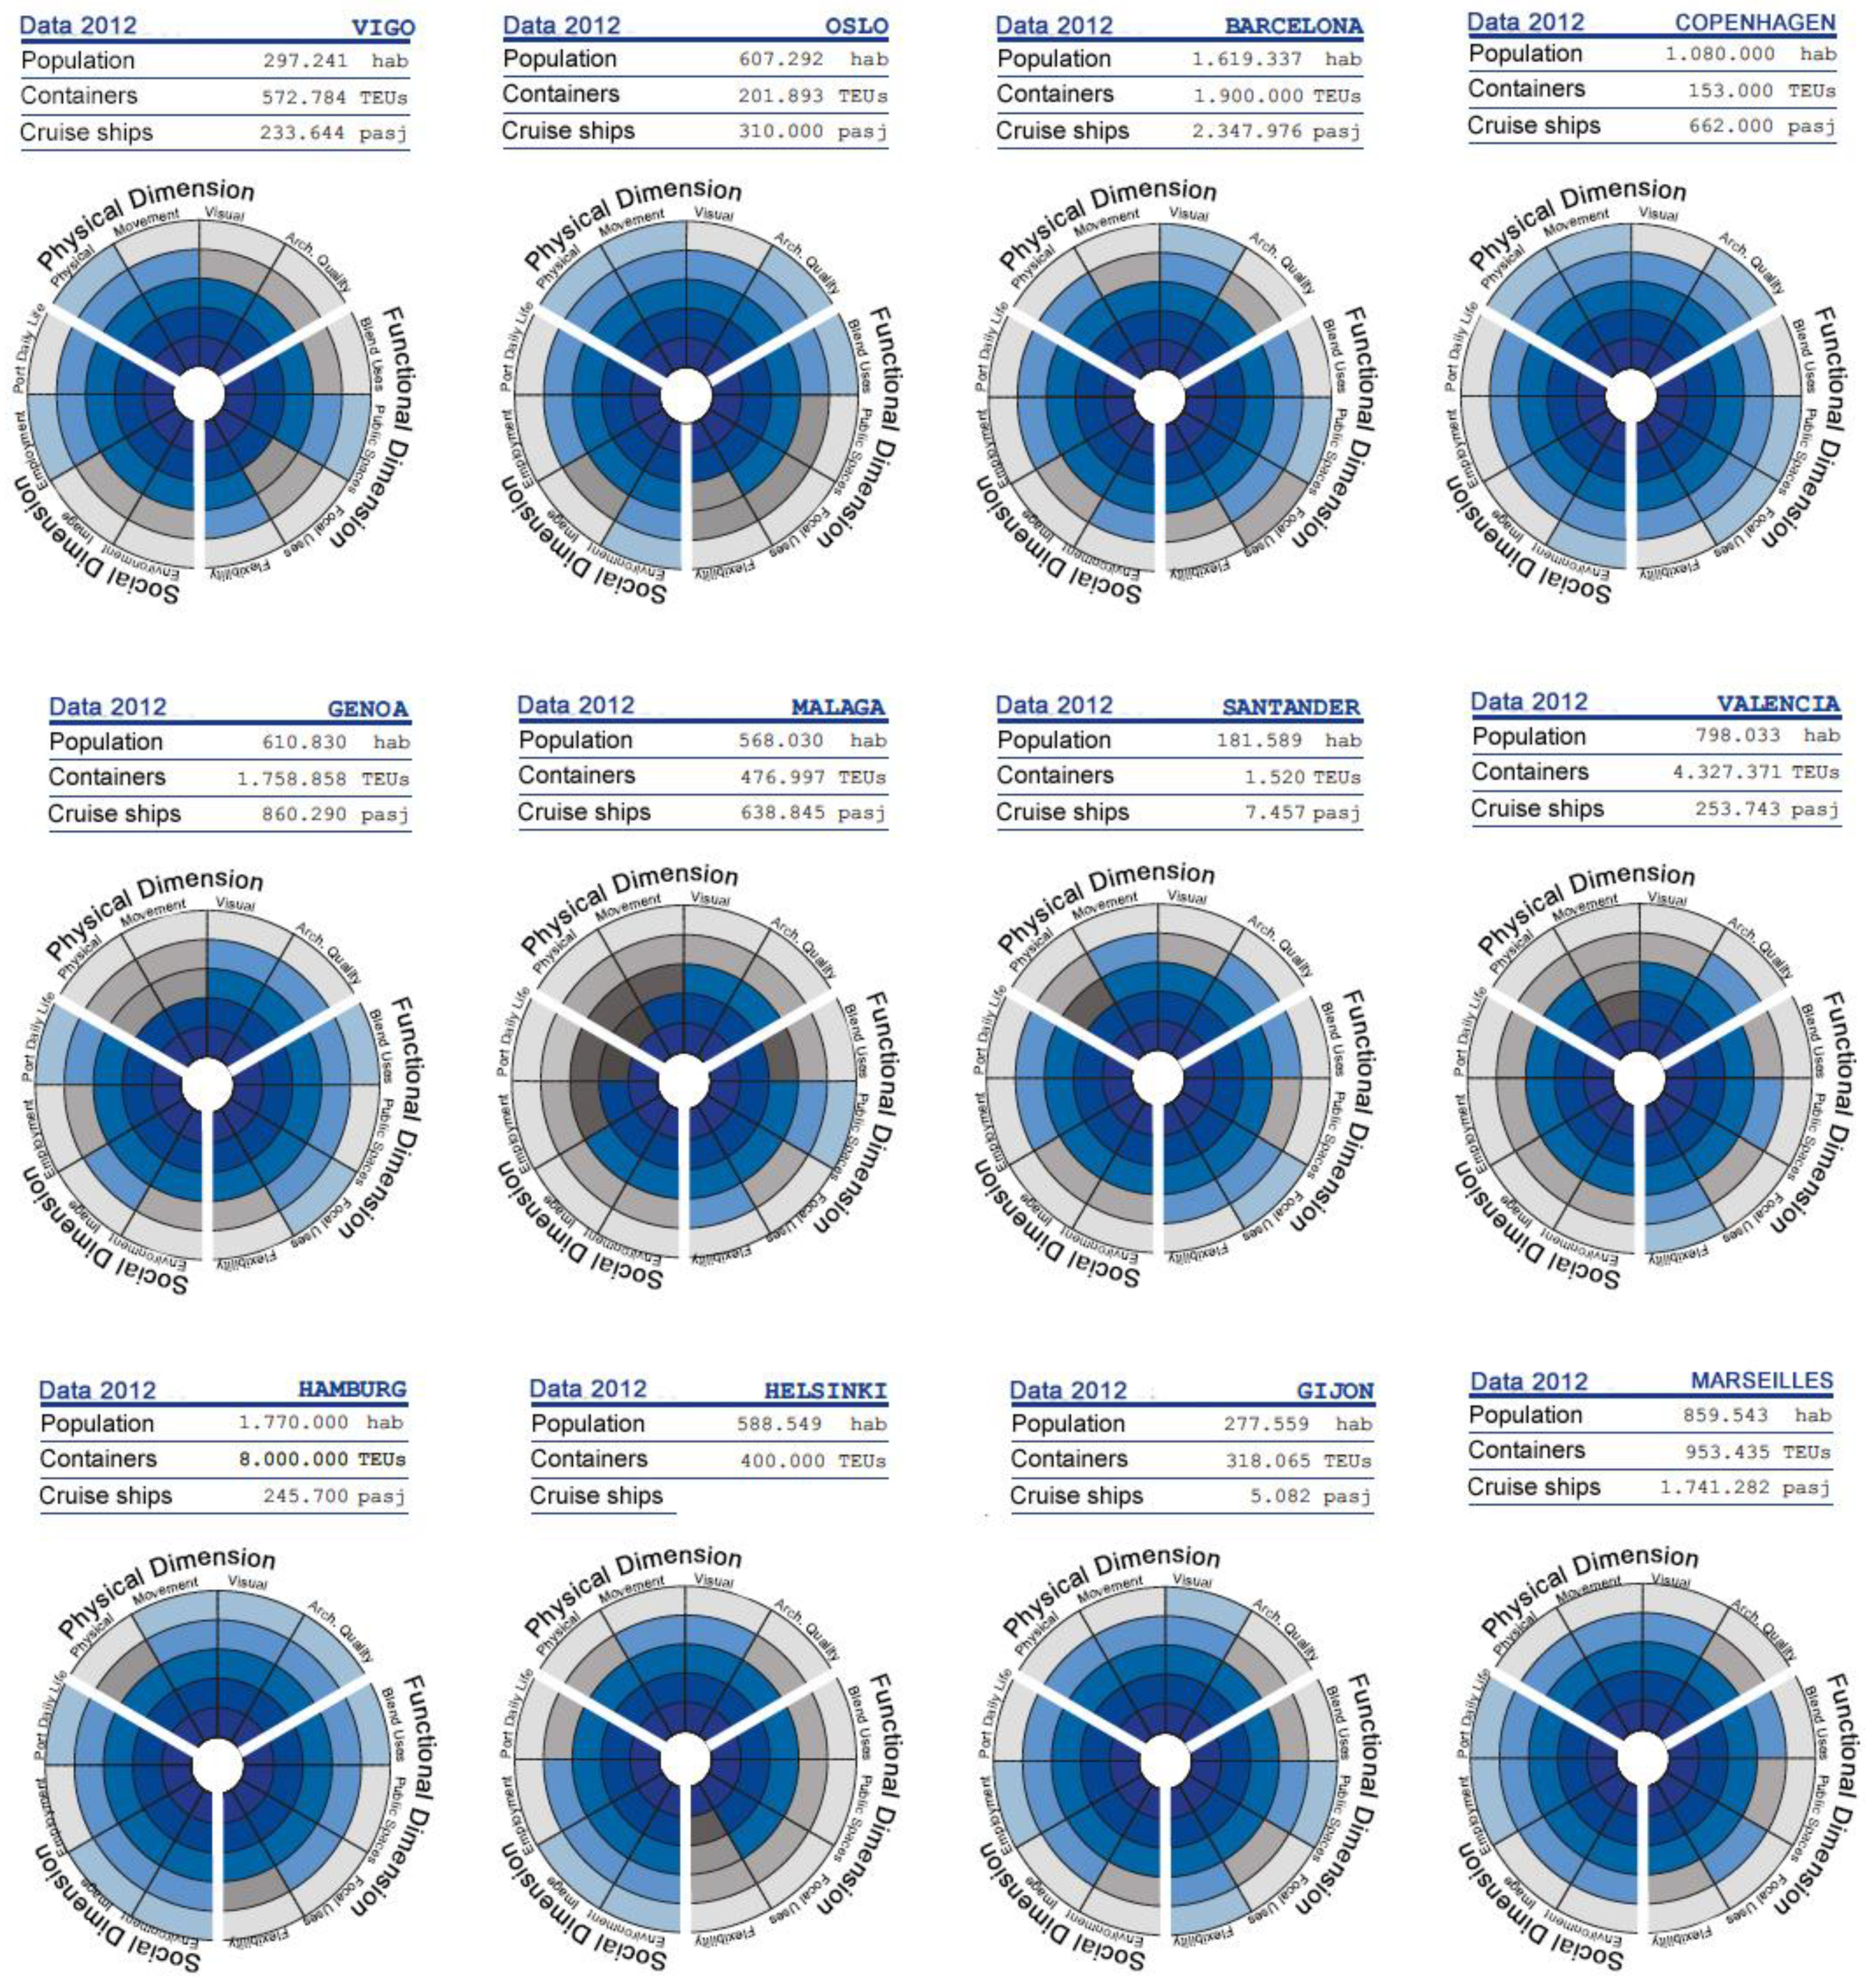
3.1. Collection of Cases
3.2. Description and Values of the Three Dimensions and Their Indicators for the Quantification of Port–City Integration
3.2.1. Physical Dimension (PD)
- 1.
- Physical Continuity (PDc) measures the continuity of public space and of the urban fabric. This is determined by the barriers (B)—from B = 0, for continuity without barriers, B = 1, indicating moderate ground-level road traffic, and B = 2 for barriers such as roads, port fences and railway tracks—and by the type of pedestrian access point (Pap)—Pap = 3 for complete pedestrian continuity, Pap = 2 for continuous pedestrian access points, Pap = 1 for more than three temporary pedestrian access points, and 0 for less than two temporary pedestrian access points.As can be observed in Table 2 and Table 3, a PDc = 1 indicates barriers (roads, port fences, railway tracks) in the total interface and less than two temporary pedestrian access points; PDc = 3 refers to barriers with permanent access points (e.g., an overpass); and a PDc = 5 is complete pedestrian continuity, with neither barriers nor ground-level road traffic;
- 2.
- Continuity of Movement (PDm) and the reach of public transport networks into these new spaces: in this factor, PDm = 1 means no terrestrial public transport (PTt = 0) or maritime (PTm = 0) near the port area; a port city with PDm = 2 has terrestrial public transport (PTt = 1) just into the port–city border area, while PDm = 3 indicates that the public transport (PTt = 2) network reaches into the port area and a PDm = 4 indicates that it also allows itineraries in different modes (PTt = 3), finally, a PDm = 5 is when not only the terrestrial public transport (PTt = 2) network reaches into the port area, but blue (maritime) transport (PTm = 1) is also part of the city’s public transportation network;
- 3.
- Visual Continuity (PDv) from the city’s streets and viewpoints: the perception of port activity by the city reinforces the feeling of acceptance. Two parameters are used for the evaluation, the view of the port (Vp), and the port atmosphere in the city (Va), for example, in store windows. No visual permeability between the port and the city (Vp = 0) and any port atmosphere (Va = 0) is evaluated with PDv = 1. There are still ports with a large wall that separates them from the city not only physically but also visually. A PDv = 2 indicates that there are occasional views of some port activity (Vp = 1), e.g., views of cranes from a street or views of a cruise ship from some point, but without any port atmosphere (Va = 0), while PDv = 3 means not only some views of port activity (Vp = 2), but also a port atmosphere in the vicinity (shops, businesses...) (Va = 1), and PDv = 4 means different points for observing the port and its activities (Vp = 3), and port atmosphere in the vicinity (Va = 1), PDv = 5 indicates a complete visual connection with the sea, docks, activities (Vp = 4), and a port atmosphere in the city (Va = 2);
- 4.
- Architectural Quality (PDq) of both town planning (Qp) (well-grounded and responding to the problems of the local context), and of buildings (Qb) and public spaces (Qps).Qp is evaluated by the global and long-term vision (tv): Qp = 1, no comprehensive and short-term vision (tv < 4 years), Qp = 2, comprehensive and medium-term vision (4 < tv < 12 years), Qp = 3, global and long-term vision (tv > 12 years).
3.2.2. Functional Dimension (FD)
- 5.
- Blending Uses (FDu) to regenerate areas that are characterized by an interesting complexity, with sea-related uses, activities linked to previous and original uses, and uses related to the working port. It is also necessary to integrate the hard functions of a port, as defined by Van Hooydonk [41]. Maintaining an active port will enhance a city’s port identity. In this factor, two values are used, on one hand the dockside uses (Ud)—Ud = 0 when there is any port activity in the basin, Ud = 1 if there is a marina, or Ud = 2 with port uses—and, on the other hand, function diversity (Uu) is evaluated as Uu = 0 when there is only leisure use, Uu = 1 if this use is mixed with cultural and business uses, and Uu = 3 when these are also mixed with daily urban uses such as fish markets, university, or transport.In this indicator, FDu = 1 means single-function, leisure and entertainment use only, shopping centres (Uu = 0), and no dockside uses (Ud = 0). A score of FDu = 5 is a waterfront with a blend of uses, with a prevalence of port uses, marine-related uses, (Ud = 2), everyday urban use, leisure and entertainment use (fish market, university, transport, offices) (Uu = 2);
- 6.
- Balancing Free Spaces (FDps), which refers to maintaining the proportion of free space that existed in the port with its previous activity, as part of its intangible heritage. It involves avoiding the great temptation for many cities to privatize these spaces and fill them with buildings. Three values are used, first the public space (Pss), that is Pss = 0 when it is more private than public, and Pss = 1 when it is public at all; then, the berth density in docks (Psdz), that is evaluated from Psd = 0 with a high berth density, to Psd = 1 with a balanced dock; and on the other hand, building density (Psb), from Psb = 0 with a high building density, Psb = 1 with a medium quayside density, and Psb = 2 with a low density, and open spaces for recreational walking and other activities.For instance, FDps = 2 is a waterfront with few public spaces (Pss = 0) and high building density on the quays (Psb = 0), but the basin is balanced and there is not a high berth density (Psd = 1). An FDps = 4 means public space (Pss = 1), medium quayside density (Psb = 1), and balanced docks (Psd = 1);
- 7.
- Focal Uses’ Locations are the provision of uses that can mobilize urban dynamics (FDfu), combining everyday uses with those that entail occasional visits in a way that ensures continuous occupation of the dockside. In this factor, two values are used: the use of building on the quay, (Fub)—evaluated from Fub = 1, in this case where there are buildings that hosted large events, as in many cases on waterfronts, but now are unused, Fub = 2 in cases of buildings for occasional use, such as auditoriums, or convention centres, Fub = 3 for buildings aimed at activities such as leisure, shops and restaurant, Fub = 4 for everyday uses, and Fub = 5 for everyday uses in heritage buildings—and the relationship with other uses located at city (Fc), as Fc = 0 when they are independent, and Fc = 1 if there is synergy between them, e.g. the library and the university, or the market and the fish market.An FDfu = 1 means that the waterfront has many buildings that hosted large events, now unused, located on the quay (Fub = 1) and without any connection with city uses (Fc = 0), as opposed to FDfu = 5, which means mixed daily uses (Fub = 5) that complement each other are distributed between the port and city (Fc = 1), including everyday uses and even use of heritage sites;
- 8.
- Flexibility in both spaces and buildings (FDfl) can increase the value of interventions, as it allows them to be adapted to the changing needs of both the port and city, to host multiple events and activities. In this factor, three values are used: lease terms (Fl)—a very long lease Fl = 25–50 years, does not allow adaptability to the demands and needs of each moment, while a short lease, Fl = 5–10 years allows more flexibility, and a medium lease Fl = 10–25 years, hinders adaptability—a revertible or flexible use, Flr = 1, or an inflexible use such as housing, with Flr = 0, and the third value is the building density, that determines the flexible use of public spaces, and could be high (Fld = 0), medium (Fld = 1) or low (Fld = 2).An FDfl = 1 means non-revertible buildings, buildings with very inflexible spaces (housing) (Flr = 0), a high building density (Fld = 0), and very long leases (Fl = 25–50 years), while an FDfl = 5 means short leases (Fl = 5–10 years), a few new, non-revertible but multi-purpose buildings (Flr = 0), low density on the quays, and complete flexibility of public space (Fld = 2).
3.2.3. Social Dimension (SD)
- 9.
- Environmental Integration (SDe) is crucial for the coexistence of a port close to the city, for providing inhabitants with well-being in a city that is green, environmentally friendly and balanced, and with a higher environmental quality. This is determined by the environmental management level (Em), which can be minimum (Em = 0), medium (Em = 1) or pro-active (Em = 2); the environment monitoring (Emo) corresponding to low (Emo = 0), medium (Emo = 1) or high monitoring (Emo = 2); and energy production (Ep) such as wind energy, solar energy (Ep = 1).In this factor, a port with SDe = 1 means minimal environmental management and little monitoring, while a port with SDe = 5 indicates high monitoring, energy production and pro-active environmental management to reduce the port’s environmental impact;
- 10.
- Public Image and Support (SDps): ports usually have a negative public image. People associate them with pollution and noise, traffic and bad smells, as well as the smuggling of drugs, immigrants and illegal goods. All these factors tend to make the local inhabitants want to stay away. This indicator measures actions and initiatives to understand the public perception of the port (Pp), which can be Pp = 0 for any action, or Pp = 1 for actions such as surveys or social media. Attempts restore the port’s reputation through visits and specific events are referred to as (Pa): for sporadic attempts, Pa = 0, for 1–3 actions, Pa = 1, for more than three, Pa = 2, and a strategy for continuous visitors means Pa = 3. In addition to the above, there are port visitor information centres, museums, etc., and website and social network activity (Pws), in which a confusing website and no social network activity, Pws = 0, little social network activity results in a Pws = 1, clear website and moderate social network activity means a Pws = 2, and a clear website and high social network activity results in Pws = 3. A waterfront with a Pws = 2 means a negative public perception (Pp = 0), where actions are few (more than three), sporadic, casual, and not part of any strategy (Pa = 1), with a confusing website and little social network activity (Pws = 1);
- 11.
- Education and Employment (SDee): Involving the local residents with the life of the port through education and training affects the development of both the port and the city. This is determined by educational programmes such as university (Ep), where a port city with university degrees, courses and research programmes in the port, maritime and logistics sector is a Ep = 2, a city with a university degree is a Ep = 1, and one without any is Ep = 0. If the training of port workers (Et) is encouraged, then Et = 1, but no training provision results in Et = 0. Important information is acquired on the labour activity in the port (Ei), such as visits from schools or high schools Ei = 1.A port city SDee = 2 indicates that the training of port workers is encouraged (Et = 1), but there is no educational provision outside the port (Ep = 0) and any visit from schools (Ei = 0), whereas, for instance, an SDee = 4 means that the training of port workers is encouraged (Et = 1), there are visits from schools to the port (Ei = 1), and there is some provision of marine-related university courses (Ep = 1);
- 12.
- Integrating the Port with the City (SDpc): integrating the port with the city residents’ everyday life helps a port city recover its identity. The port becomes part of the inhabitants’ daily life again, in aspects such as travel and mobility (Pct); as a place of study or work, residence, a retail market place, wholesale fish market, etc., with (Pcd) showing this on three levels—Pcd = 0 without daily uses, Pcd = 1 with 1–3 daily uses and Pcd = 2 with more than three daily uses; and as a place of leisure, contemplation and enjoyment (Pcl). This reconciliation is crucial for achieving coexistence and reincorporating the port and its activity in inhabitants’ daily lives.An SDpc = 2 expresses that the port relates to a minority of the inhabitants (auditorium, congress centre, etc.), and an SDpc = 5 shows direct integration of the port space in the population’s everyday activities (transport, work, residence, market).
4. Applying the Framework, A Case Study: Malaga
- 1
- Physical Continuity (PDc):B: In 2012, Malaga had a big barrier, a twelve-lane road, between the port and city, and in 2019 this remains;Pap: In 2012, only two crosswalks crossed the barrier; in 2019 there are three.The Physical Continuity has improved from PDc = 1 to PDc = 2, but it is still poor.
- 2
- Continuity of Movement (PDm):PTm: There was not maritime public transport in Malaga in 2012 and neither is there in 2019;PTt: The terrestrial public transport reaches only the port–city border area in both years.
- 3
- Visual Continuity (PDv):Vp: In 2012, there were some views of the port from different streets but, in 2019, the view of the port from the city is greater and viewpoints have originated on the terraces of the hotels which further increase the presence of the port in the city;Va: However, the atmosphere of the port has not yet reached the shops on either date.
- 4
- Architectural Quality (PDq):There has been no change in the architectural level in the waterfront, so the values are maintained on both dates.Qp: The town planning is quite comprehensive and with a medium-term vision, and it has not changed from 2012 to 2019;Qb: The heritage has not been preserved, but the new buildings have an architectural quality and generate an urban environment around them;Qps: The public spaces have a high quality, and both citizens and tourists walk and live in these spaces.
- 5
- Blending Uses (FDu):Ud: From 2012 to 2019, port activity has increased in urban docks, with ferries and some berths;Uu: Leisure uses mixed with cultural uses are maintained.
- 6
- Balancing Free Spaces (FDps):Pss: The public space is very wide and of great quality;Psd: There is a low berth density;Psb: A very low building density.
- 7
- Focal Uses Locations (FDfu):Fub: In the case of Malaga, no major international events have been held, so its buildings are small and medium sized and fit the scale of the city, focused on shops, restaurants and leisure;Fc: In Malaga, the city centre and the port are less than 500 meters away, however, they have no uses that complement and generate synergies with each other.
- 8
- Flexibility in spaces and buildings, (FDfl):Fl: A 10–25 years lease is a medium term that hinders the adaptability of buildings and uses;Flr: There are not revertible buildings in this waterfront;Fld: However, despite the lack of flexibility, the density of buildings is low.
- 9
- Environmental Integration (SDe):Em: The environment’s management is a very important issue to allow the permanence of an operative port close to the city centre of a city whose main industry is tourism. Although there is an environmental sustainability plan, this factor can and should continue to improve;Emo: This port has a high level of environment monitoring;Ep: Energy production is a pending issue in the case of Malaga, as it has the perfect conditions to do this, with 3.000 h of sunlight per year.
- 10
- Public Image and Support (SDps):Pp: This port has developed measures to understand public perception of the port and cruise activity;Pa: The port has improved its strategies for continuous visitors and there is a port visitor information centre and a Sea Museum;Pws: From 2012 to 2019, the port of Malaga has improved greatly with social networks.
- 11
- Education and Employment (SDee):Ep: There is no university degree related to the port, however there are relationships with research groups of the university, in economics, architecture and tourism, that work with the port;Et: The training of port workers is encouraged;Ei: The information on labour activity in the port has improved significantly, tripling school visits to the port.
- 12
- Integrating the Port with the City (SDpc):Pct: There are not mobility networks between the port and the city;Pcd: There are also no daily uses in this waterfront beyond leisure uses such as restaurants and clothing stores and museums;Pcl: In the seven years studied, the waterfront of Malaga has become a high-quality place of leisure, contemplation and enjoyment.
4.1. Physical Dimension (PD)
4.2. Functional Dimension (FD)
4.3. Social Dimension (SD)
5. Discussion
6. Conclusions
Author Contributions
Funding
Acknowledgments
Conflicts of Interest
References
- Baudouin, T.; Collin, M. Culture des Villes Portuaires et Mondialisation de l’Economie; Laboratoire d’Histoire Maritime, Université de Paris Sorbonne, AIVP: Le Havre, France, 1994. [Google Scholar]
- Hoyle, B. (Ed.) Cityports, Coastal Zones and Regional Change; John Wiley & Sons: West Sussex, UK, 1996. [Google Scholar]
- Hoyle, B.; Pinder, D. (Eds.) Cityport Industrialization and Regional Development; Pergamon Press: Oxford, UK, 1981. [Google Scholar]
- Hoyle, B.; Pinder, D. (Eds.) European Port Cities in Transition; Belhaven: London, UK, 1992. [Google Scholar]
- Malone, P. (Ed.) City, Capital and Water; Routledge: London, UK, 1996. [Google Scholar]
- Mosso, E. Città Portuali: L’economia E Il Território; Franco Angeli: Milano, Itlay, 1996. [Google Scholar]
- Costa, J.P. Urbanismo e Adaptação às Alterações Climáticas. As Frentes de Água; Livros Horizonte: Lisbon, Portugal, 2013. [Google Scholar]
- Breen, A.; Rigby, D. Waterfronts Cities Reclaim Their Edge; McGraw-Hill: New York, NY, USA, 1994. [Google Scholar]
- Breen, A.; Rigby, D. The New Waterfront: A Worldwide Urban Success Story; Thames and Hudson: London, UK, 1996. [Google Scholar]
- Bruttomesso, R. (Ed.) Waterfront: Una Nueva Frontiera Urbana. 30 Progetti Di Riorganizzazione E Riuso Di Aree Urbane Del Sul Fonte D’acqua; Conzorzio Autonomo del Porto di Genova, Centro Internazionale Città d’Acqua: Génova, Italy, 1991. [Google Scholar]
- Casariego, J. Waterfronts De Nuevo; Ayuntamiento de Las Palmas de Gran Canaria: Las Palmas, Spain, 1999. [Google Scholar]
- Chaline, C. Les nouveaux fronts d’eau: Une unique opportunité urbaine. Villes Ports 1991, 7, 2–5. [Google Scholar]
- Hall, P. Waterfronts: A new urban frontier. Aquapolis 1992, 1, 6–17. [Google Scholar]
- Marshall, R. (Ed.) Waterfronts in Post-Industrial Cities; Spon Press: London, UK, 2001. [Google Scholar]
- Meyer, H. Waterfront Renewal, an International Phenomenon. The discret charm of port and city, a seductive combination. In Antwerp–Reshaping a City; Vanreusel, J., Ed.; Blondé Art Printing International: Antwerp, Belgium, 1990; pp. 67–125. [Google Scholar]
- Alemany, J. Rehabilitar, Reconvertir, Revitalizar pero Mantener el Puerto en la Ciudad. Neutra 2006, 14, 22–25. [Google Scholar]
- Alemany, J. Port-City Relations in Europe and Latin America: Exchange of Experiences-Las relaciones puerto-ciudad en América Latina: Intercambio de experiencias. Portus 2001, 1, 6–17. [Google Scholar]
- Andrade Marques, M.J.; Blasco Lopez, J.; Marín Cots, P. Puerto-Ciudad. Estudio Comparativo de Buenas Practicas; Servicio de Programas europeos del Ayuntamiento de Málaga: Málaga, Spain, 2012. [Google Scholar]
- Bonillo, J.L.; Donzel, A.; Fabre, M. Métropoles Portuaires en Europe: Barcelone, Gênes, Hamburg, Liverpool, Marseille, Rótterdam. In Cahiers de la Recherche Architecturale; Éditions Parenthèses: Marseille, France, 1992; pp. 30–31. [Google Scholar]
- Busquets, J. Anvers, Barcelone et Buenos-Aires: Quand les villes s’occupent de leur ports. Ann. Rech. Urbaine 1992, 55–56, 35–44. [Google Scholar] [CrossRef]
- Busquets, J. Spanish Waterfronts/Los frentes de agua españoles. Portus 2001, 1, 52–59. [Google Scholar]
- Jauhiainen, J. Waterfront redevelopment and urban policy: The case of Barcelona, Cardiff and Genoa. Eur. Plan. Stud. 1995, 3, 3–18. [Google Scholar] [CrossRef]
- Meyer, H. City and Port: Urban Planning as a Cultural Venture in London, Barcelona, New York and Rotterdam; International Books: Rotterdam, The Netherland, 1999. [Google Scholar]
- Meyer, H. An Atlas of the Dutch Watercity. Aquapolis 2001, 1. [Google Scholar]
- Costa, J.P. The new waterfront: Segregated space or urban integration? Levels of urban integration and factors of integration in some operations of renewal of harbour areas. In On the Waterfront; Remesar, A., Ed.; Publicacions Universitat de Barcelona/Polis Research Centre: Barcelona, Spain, 2001; p. 3. [Google Scholar]
- Hall, P. Cities of Tomorrow: An Intellectual History of Urban Planning and Design in the Twentieth Century; Blackwell Publishing: Oxford, UK, 1996. [Google Scholar]
- Costa, J.P.; Remesar, A. Multifunctional Land Use in the Renewal of Harbour Areas: Patterns of Physical Distribution of the Urban Functions. In On the Waterfront; Remesar, A., Ed.; Publicacions Universitat de Barcelona/Polis Research Centre: Barcelona, Spain, 2004; p. 6. [Google Scholar]
- Busquets, J. Planeamiento: Pasado reciente y futuro próximo. Soc. Territ. 1995, 22, 15–16. [Google Scholar]
- Busquets, J. A Reabilitação das frentes de agua. Estuário 2003, 4. [Google Scholar]
- Alemany, J. El Port de Barcelona; Lunwerg Editores: Barcelona, Spain, 1998. [Google Scholar]
- Bruttomesso, R. Complexity on the urban waterfronts. In Waterfronts in Post-Industrial Cities; Marshall, R., Ed.; Spon Press: London, UK, 2001; pp. 39–49. [Google Scholar]
- Costa, J.P. La Ribera Entre Proyectos. Formación Y Transformación Del Territorio Portuário, A Partir Del Caso De Lisboa. Ph.D. Thesis, Universitad Politécnica de Catalunya, Barcelona, Spain, 2007. [Google Scholar]
- Falk, N. Turning the tide: British experience in regenerating urban docklands. In European Port Cities in Transition; Hoyle, B.S., Pinder, D.A., Eds.; Belhaven Press: London, UK, 1992. [Google Scholar]
- Schubert, D. Transformación de zonas portuarias y costeras en desuso: Experiencias, posibilidades y problemas. Ciudades 2004, 8, 15–36. [Google Scholar] [CrossRef] [Green Version]
- Solà-Morales, M. Five Questions Concerning Urban Port Projects. Aquapolis 1999, 4, 3–4. [Google Scholar]
- Vermeersch, L. La Reconversion Des Zones Portuaires Dans Les Centres-Villes Nord-Américains; De 1950 À Nos Jours: Vers Une Redéfinition De La Ville Moderne. Ph.D. Thesis, Université Paris IV-Sorborne, Paris, France, 1997. [Google Scholar]
- Guo, J.; Qin, Y.; Du, X.; Han, Z. Dynamic measurements and mechanisms of coastal port-city relationships based on the DCI model: Empirical evidence from China. Cities 2020, 96. [Google Scholar] [CrossRef]
- Carley, M.; Garcia, S. (Eds.) The Cool Sea, Waterfront Communities Project Toolkit; Waterfront Communities Project: Edinburgh, UK, 2007; Available online: https://inta-aivn.org/images/cc/Urbanism/background%20documents/The_cool_Sea_part1_1.pdf (accessed on 2 August 2018).
- Verhoeven, P.; Backx, N. Code of Practice on Societal Integration of Ports; ESPO, European Sea Ports Organisation: Brussels, Belgium, 2010; Available online: https://www.espo.be/media/espopublications/ESPOCodeofPracticeonSocietalIntegrationofPorts2010.pdf (accessed on 2 August 2018).
- Lemaire, O. Plan the City with the Port, Guide of Good Practices; AIVP, International Association Cities and Ports: Le Havre, France, 2007; Available online: http://www.aivp.org/wp-content/uploads/2012/03/fnau.pdf (accessed on 2 August 2018).
- Van Hooydonk, E. Soft Values of Seaports: A Strategy for the Restoration of Public Support for Seaports; Garant: Antwerp, Belgium, 2007. [Google Scholar]
- Alemany, J.; Bruttomesso, R. The Port City of the XXIst Century. New Challengues in the Relationship between Port and City; RETE: Venice, Italy, 2011. [Google Scholar]
- Chaline, C.; Coccossis, H. Guidelines for Urban Regeneration in the Mediterranean Region; Priority Actions Programma, Regional Activity Centre: Split, Croatia, 2004. [Google Scholar]
- Ducruet, C. A metageography of port-city relationships. Ashgate. Ports, cities, and global supply chains, Ashgate. Transp. Mobil. 2007, 157–172. [Google Scholar]
- Vallega, A. Fonctions portuaires et polarisations littorales dans la nouvelle régionalisation de la Méditerranée, quelques réflexions. Villes Ports Développement Portuaire Croissance Spat. Villes Environ. Littoral 1979, 355–367. [Google Scholar]
- Ducruet, C.; Lee, S.W. Frontline Soldiers of Globalisation: Port-City Evolution and Regional Competition. Geojournal 2006, 67, 107–122. [Google Scholar] [CrossRef]
- Schipper, C.A.; Vreugdenhil, H.; de Jong, M.P.C. A sustainability assessment of ports and port-city plans: Comparing ambitions with achievements. Transp. Res. Part D Transp. Environ. 2017, 57, 84–111. [Google Scholar] [CrossRef]
- Monios, J.; Bergqvist, R.; Woxenius, J. Port-centric cities: The role of freight distribution in defining the port-city relationship. J. Transp. Geogr. 2018, 66, 53–64. [Google Scholar] [CrossRef]
- Ducruet, C.; Jeong, O. European port-city interface and its Asian application. Anyang Korea Res. Inst. Hum. Settl. 2005, 12–16. [Google Scholar]
- Bohanec, M.; Bratko, I.; Cestnik, B. Methods for Developing Hierarchical Models. Research Project; Nanced by the Ministry of Science and Technology, of the Republic of Slovenia: Ljubljana, Slovenia, 1997. [Google Scholar]
- Campos-Sánchez, F.S.; Reinoso-Bellido, R.; Abarca-Álvarez, F.J. Sustainable Environmental Strategies for Shrinking Cities Based on Processing Successful Case Studies Facing Decline Using a Decision-Support System. Int. J. Environ. Res. Public Health 2019, 16, 3727. [Google Scholar] [CrossRef] [Green Version]
- Andrade, M.J. Mar A La Vista. Las Transformaciones Del Puerto De Málaga En El Debate De Los Waterfronts. Ph.D. Thesis, University of Malaga, Malaga, Spain, 2012. [Google Scholar]
- Simmons, J.W. The urban system: Concepts and hypotheses. In Urban Systems in Transition; Borchert, J.G., Bourne, L.S., Sinclair, R., Eds.; Nederlandse Geografishe Studies, Knag/Geografisch Instituut Rijksuniverseir Utrecht: Amsterda, The Netherland; Utrecht, The Netherland, 1986; pp. 23–31. [Google Scholar]
- Limtanakool, N.; Dijst, M.; Schwanen, T. A Theoretical Framework and Methodology for Characterising National Urban Systems on the Basis of Flows of People: Empirical Evidence for France and Germany. Urban Stud. 2007, 44, 2123–2145. [Google Scholar] [CrossRef]
- Rosa-Jiménez, C.; Perea-Medina, B.; Andrade, M.J.; Nebot, N. An examination of the territorial imbalance of the cruising activity in the main Mediterranean port destinations: Effects on sustainable transport. J. Transp. Geogr. 2018, 68, 94–101. [Google Scholar] [CrossRef]
- Daamen, T.A.; Vries, I. Governing the European Port-City Interface: Institutional Impacts on Spatial Projects between City and Port. J. Transp. Geogr. 2013, 27, 4–13. [Google Scholar] [CrossRef]


| Case Collection | Population | Cruisers | Containers | Dominant Success | Initiative Profile | Web Reference Data |
|---|---|---|---|---|---|---|
| 1. Vigo (SP) | 297,241 | 233,644 | 572,784 | Physical Continuity | Physical Dimension, PD | www.apvigo.com www.fupv.es www.hoxe.vigo.org www.uvigo.es |
| 2. Oslo (NW) | 607,292 | 310,000 | 201,893 | Continuity of Movement | Physical Dimension, PD | www.oslohavn.no www.ohv.oslo.no oslo.kommune.no www.uio.no |
| 3. Barcelona (SP) | 1,619,337 | 2,347,976 | 1,900,000 | Visual Continuity | Physical Dimension, PD | www.bcn.es www.bcnregional.com www.consorcielfar.org www.portdebarcelona.es www.portvellbcn.com www.ub.edu/es |
| 4. Copenhagen (DK) | 1,080,000 | 662,000 | 153,000 | Architectural Quality: Planning, Buildings and Public Spaces | Physical Dimension, PD | www.cmport.com www.byoghavn.dk https://byoghavn.dk/nordhavn/ www.ku.dk |
| 5. Genoa (IT) | 610,830 | 860,290 | 1,758,858 | Blend of Uses | Functional Dimension, FD | www.smart.comune.genova.it www.portsofgenoa.com www.comune.genova.it www.genoaportcenter.net www.unige.it |
| 6. Malaga (SP) | 568,030 | 638,845 | 476,997 | Balance of Public Spaces | Functional Dimension, FD | www.malagaport.com www.malagaturismo.com www.muelleuno.com www.malaga.eu www.omau-malaga.com www.puertomalaga.com www.uma.es |
| 7. Santander (SP) | 181,589 | 7457 | 1520 | Location of Focal Uses | Functional Dimension, FD | www.puertosantander.es cantabriacampusinternacional.com www.rfev.es www.fcvela.com www.santander2014.com www.ayto-santander.es www.uimp.es www.unican.es |
| 8. Valencia (SP) | 798,033 | 253,743 | 4,327,371 | Flexibility | Functional Dimension, FD | www.valencia.es www.valenciaport.es www.uv.es |
| 9. Hamburg (DE) | 1,770,000 | 245,700 | 8,000,000 | Environmental Integration | Social Dimension, SD | www.elbphilharmonie.de www.hamburg.de www.hafen-hamburg.de www.hafencity.com www.hcu-hamburg.de www.uni-hamburg.de |
| 10. Helsinki (FI) | 588,549 | 360,000 | 400,000 | Public Image | Social Dimension, SD | www.hel.fi/hki/taske/en/Urba n+Development www.helsinki.fi www.portofhelsinki.fi www.southharbour.fi |
| 11. Gijon (SP) | 277,559 | 5082 | 318,065 | Education and Employment | Social Dimension, SD | www.gijon.es www.puertogijon.es www.puertodeportivogijon.es |
| 12. Marseille (FR) | 859,543 | 1,741,282 | 953,435 | Port in Local People’s Daily Life | Social Dimension, SD | www.marseille-port.fr www.euromediterranee.fr www.reseau-euromed.org/en/institut-de-mediterranee/ www.univ-provence.fr |
| Dimension | Indicator | Rank | Definition |
|---|---|---|---|
| PHYSICAL DIMENSION PD | 1. Physical Continuity: city–port access and connections. Ground-level road/rail infrastructure barriers. | 5 | Complete pedestrian continuity. No barriers. No ground-level road traffic. |
| 4 | Complete pedestrian continuity. Moderate ground-level road traffic (ground-level public transport and residents). | ||
| 3 | Barriers (road traffic) with continuous pedestrian access points. | ||
| 2 | Barriers with temporary access points (pedestrian access). | ||
| 1 | Barriers (roads, port fences, railway tracks...). | ||
| 2. Continuity of Movement: Town connected to sea by development of transport and patterns of movement. Intermodal, sustainable transport network, in which land transport complements maritime (blue) transport. | 5 | Blue transport is part of the city’s public transportation network. Intermodal. | |
| 4 | Terrestrial public transport network reaches into port area to allow itineraries in different modes: pedestrian, bicycle, tramways... | ||
| 3 | Terrestrial public transport network reaches into port area: local people can access the port, and cruise passengers the town. | ||
| 2 | Terrestrial public transport network reaches into port–town border area. | ||
| 1 | No public transport near the port area. | ||
| 3. Visual Continuity: Visual permeability, presence of the port in the town, places for viewing port activities, port atmosphere in the town (businesses, shops...) | 5 | Complete visual connection with sea, docks, activities: viewpoints, streets, topography... | |
| 4 | Different points for observing the port and its activities. | ||
| 3 | Views of some port activity from town, port atmosphere in the vicinity (shops, businesses...) | ||
| 2 | Only occasional views of some port activity (view of cranes from street, cruise ship from some point...) | ||
| 1 | No visual permeability between the port and the city. | ||
| 4. Architectural Quality: Of both town planning (well-grounded and responding to the problems of the local context), and of buildings and public spaces. | 5 | Good quality planning with long-term, global vision. Good quality public spaces and buildings. Heritage conservation and management. | |
| 4 | Planning with a comprehensive vision. New buildings that create urban environment. Conservation of some heritage buildings. Quality public spaces. | ||
| 3 | Planning with a comprehensive vision. New buildings that create urban environment. No conservation of heritage buildings. Quality public spaces. | ||
| 2 | No comprehensive vision. Buildings that do not create urban environment. Quality public spaces | ||
| 1 | No comprehensive vision. Buildings that do not create urban environment, public spaces are small or poor quality. | ||
| FUCTIONAL DIMENSION FD | 5. Blend of uses: Urban complexity; balance between town and port uses, local and global uses, daily and occasional uses, uses by tourists and by locals. | 5 | Blend of uses. Prevalence of port uses, marine-related uses, everyday urban use, leisure and entertainment use (fish market, university, transport, offices...). |
| 4 | Dockside uses. Urban cultural and business uses, and daily uses (transport, offices, housing, university...). | ||
| 3 | Dockside uses. Urban cultural and business uses (museum, auditorium, shopping centre, restaurants. Docks: marina). | ||
| 2 | Urban cultural and business uses are mixed. No dockside uses. | ||
| 1 | Single-function. Leisure and entertainment use only. Shopping centres. No dockside uses. | ||
| 6. Balance of Public Spaces: Preservation of the characteristic openness of port spaces. Building density on quaysides. Berth density in docks. | 5 | Balance between low-density and free spaces both in docks and quays. Places for recreational walking and other activities, open spaces. | |
| 4 | Public space. Medium quayside density. Balanced docks. | ||
| 3 | Public space. Medium quayside density. High berth density in docks. | ||
| 2 | Few public spaces. Medium quayside density. High berth density in docks. | ||
| 1 | Few public spaces. High building density on quaysides. High berth density in docks. | ||
| 7. Focal Uses Location: Uses that form part of the local inhabitants’ daily activities take place at the docks, beyond the leisure area. | 5 | Uses that complement each other are distributed between port and town. Daily, everyday uses. Use of heritage sites. | |
| 4 | Everyday uses, such as offices, university, market, are located on the quays... | ||
| 3 | Buildings aimed at activities such as leisure, shops, and restaurants, are located on the quay. | ||
| 2 | Buildings for occasional use (such as auditorium, convention centre) are located on the quay. | ||
| 1 | Buildings that hosted large events, now unused, located on the quay. | ||
| 8. Flexibility: Ability to maintain the multi-purpose nature of these places throughout history. Ability to adapt to demand at all times. | 5 | Short leases. A few new non-revertible but multi-purpose buildings. Low density on quays, and complete flexibility of public space. | |
| 4 | Some new buildings are non-revertible but multi-purpose. Medium-term leases. Low density that allows complete flexibility of public space. | ||
| 3 | Non-revertible buildings. Long leases. Medium/low density allowing flexible use of public space. | ||
| 2 | Non-revertible buildings. Medium/low building density. Long leases. | ||
| 1 | Non-revertible buildings. High building density. Buildings with very inflexible spaces (housing); very long leases. | ||
| SOCIAL DIMENSION SD | 9. Environmental Integration: Monitoring of the port’s environmental aspects, solving or minimizing pollution problems arising from an active port being located in an urban area. Port space for power generation. | 5 | Energy production. Pro-active environmental management to reduce port’s environmental impact. Disclosure of measurements and data. |
| 4 | Pro-active environmental management to reduce port’s environmental impacts, such as water and air quality, noise, refuse. Disclosure of measurements and data. | ||
| 3 | Environmental management. Quality Control. Clean Port. Little disclosure. | ||
| 2 | Environmental management. Medium level of monitoring, surveillance and control. | ||
| 1 | Minimal environmental management. Little monitoring. | ||
| 10. Public Image: Actions and initiatives to (1) understand public perception of the port; (2) restore the port’s reputation through visits and specific events and/or (3) exhibition and visitor information centres, port museums… | 5 | Public perception of the port by local inhabitants is understood (surveys, social media, etc.). Visits and events to attract people to the port. Port visitor information centres, museums... | |
| 4 | Actions to fulfil at least two of the three aspects (understanding public perception, one-off or continuous visitor attraction actions). Clear web site. High social network activity. | ||
| 3 | Actions to fulfil at least two of the three aspects (understanding public perception, one-off or continuous visitor attraction actions). Clear web site. Moderate social network activity. | ||
| 2 | Negative public perception. Actions are few (more than three), sporadic, casual, not part of any strategy. Confusing web site. Little social network activity. | ||
| 1 | Negative public perception. Actions are very few (one to three), sporadic, casual, not part of any strategy. Very confusing web site. No social network activity. | ||
| 11. Education and Employment: Educational programmes at different levels, in schools, vocational training, and university education, to inform and train students about different port, maritime and logistics jobs. | 5 | Outreach about port activities in different academic contexts (visits from schools, study programmes...), provision of training and research programmes in the port, maritime and logistics sectors. | |
| 4 | Training of port workers is encouraged, there are visits from schools to the port, and some provision of marine-related university courses such as Marine Sciences or Marine Engineering. | ||
| 3 | Training of port workers is encouraged, and there are visits from schools to the port. | ||
| 2 | Training of port workers is encouraged, but there is no educational provision outside the port | ||
| 1 | No academic or training provision either for existing workers or for new staff. | ||
| 12. Port in Local People’s Daily Life: As regards mobility and public transport, as a place of study or work, place of residence, for shopping, as a market, fish market, place of leisure, for walking, for children’s games, for contemplation... | 5 | Direct integration of the port space in the population’s everyday activities (transport, work, residence, market...). | |
| 4 | The port relates to some of the inhabitants’ everyday activities. | ||
| 3 | The port relates to the inhabitants, not in their everyday activities, but for leisure (walking, shopping, restaurants...) | ||
| 2 | The port relates to a minority of the inhabitants (wholesale fish market, auditorium, congress centre, etc.). | ||
| 1 | The port has no relation to the inhabitants’ everyday activities. |
| Indicator | Rank | Value | |
|---|---|---|---|
| Physical Dimension (PD) | PDc | 5 | B = 0 Pap = 3 |
| 4 | B = 1 Pap = 3 | ||
| 3 | B = 2 Pap = 2 | ||
| 2 | B = 2 Pap = 1 | ||
| 1 | B = 2 Pap = 0 | ||
| PDm | 5 | PTm = 1 PTt = 3 | |
| 4 | PTm = 0 PTt = 3 | ||
| 3 | PTm = 0 PTt = 2 | ||
| 2 | PTm = 0 PTt = 1 | ||
| 1 | PTm = 0 PTt = 0 | ||
| PDv | 5 | Vp = 4 Va = 2 | |
| 4 | Vp = 3 Va = 1 | ||
| 3 | Vp = 2 Va = 1 | ||
| 2 | Vp = 1 Va = 0 | ||
| 1 | Vp = 0 Va = 0 | ||
| PDq | 5 | Qp = 3 Qb = 4 Qps = 1 | |
| 4 | Qp = 2 Qb = 3 Qps = 1 | ||
| 3 | Qp = 2 Qb = 2 Qps = 1 | ||
| 2 | Qp = 1 Qb = 1 Qps = 1 | ||
| 1 | Qp = 1 Qb = 1 Qps = 0 | ||
| Functional Dimension (FD) | FDu | 5 | Ud = 2 Uu = 2 |
| 4 | Ud = 1 Uu = 2 | ||
| 3 | Ud = 1 Uu = 1 | ||
| 2 | Ud = 0 Uu = 1 | ||
| 1 | Ud = 0 Uu = 0 | ||
| FDps | 5 | Pss = 1 Psd = 1 Psb = 2 | |
| 4 | Pss = 1 Psd = 1 Psb = 1 | ||
| 3 | Pss = 1 Psd = 1 Psb = 0 | ||
| 2 | Pss = 0 Psd = 1 Psb = 0 | ||
| 1 | Pss = 0 Psd = 0 Psb = 0 | ||
| FDfu | 5 | Fub = 5 Fc = 1 | |
| 4 | Fub = 4 Fc = 1 | ||
| 3 | Fub = 3 Fc = 0 | ||
| 2 | Fub = 2 Fc = 0 | ||
| 1 | Fub = 1 Fc = 0 | ||
| FDfl | 5 | Fl =5–10 years Flr = 1 Fld = 2 | |
| 4 | Fl =10–25 years Flr = 1 Fld = 2 | ||
| 3 | Fl =10–25 years Flr = 0 Fld = 1 | ||
| 2 | Fl =25–50 years Flr = 0 Fld = 1 | ||
| 1 | Fl =25–50 years Flr = 0 Fld = 0 | ||
| Social Dimension (SD) | SDe | 5 | Em = 2 Emo = 2 Ep = 1 |
| 4 | Em = 2 Emo = 2 Ep = 0 | ||
| 3 | Em = 1 Emo = 2 Ep = 0 | ||
| 2 | Em = 1 Emo = 1 Ep = 0 | ||
| 1 | Em = 0 Emo = 0 Ep = 0 | ||
| SDps | 5 | Pp = 1 Pa = 3 Pws = 3 | |
| 4 | Pp = 1 Pa = 2 Pws = 3 | ||
| 3 | Pp = 1 Pa = 2 Pws = 2 | ||
| 2 | Pp = 0 Pa = 1 Pws = 1 | ||
| 1 | Pp = 0 Pa = 0 Pws = 0 | ||
| SDee | 5 | Ep = 2 Et = 1 Ei = 1 | |
| 4 | Ep = 1 Et = 1 Ei = 1 | ||
| 3 | Ep = 0 Et = 1 Ei = 1 | ||
| 2 | Ep = 0 Et = 1 Ei = 0 | ||
| 1 | Ep = 0 Et = 0 Ei = 0 | ||
| SDpc | 5 | Pct = 1 Pcd = 2 Pcl = 1 | |
| 4 | Pct = 1 Pcd = 1 Pcl = 1 | ||
| 3 | Pct = 0 Pcd = 1 Pcl = 1 | ||
| 2 | Pct = 0 Pcd = 0 Pcl = 1 | ||
| 1 | Pct = 0 Pcd = 0 Pcl = 0 |
| MALAGA | 2012 | 2019 | ||
|---|---|---|---|---|
| Indicator | Value | Rank | Value | Rank |
| 1.Physical Continuity (PDc) | B = 2 Pap = 0 | 1 | B = 2 Pap = 1 | 2 |
| 2.Continuity of Movement (PDm) | PTm = 0 PTt = 1 | 2 | PTm = 0 PTt = 1 | 2 |
| 3. Visual Continuity (PDv) | Vp = 2 Va = 1 | 3 | Vp = 3 Va = 1 | 4 |
| 4.Architectural Quality (PDq) | Qp = 2 Qb = 2 Qps = 1 | 3 | Qp = 2 Qb = 2 Qps = 1 | 3 |
| 5.Blending Uses (FDu) | Ud = 0 Uu = 1 | 2 | Ud = 1 Uu = 1 | 3 |
| 6.Balancing Free Spaces (FDps) | Pss = 1 Psd = 1 Psb = 2 | 5 | Pss = 1 Psd = 1 Psb = 2 | 5 |
| 7.Focal Uses Locations (FDfu) | Fub = 3 Fc = 0 | 3 | Fub = 3 Fc = 0 | 3 |
| 8.Flexibility in spaces and buildings, (FDfl) | Fl = 10-25 years Flr= 1 Fld =2 | 4 | Fl=10-25years Flr =1Fld=2 | 4 |
| 9.Environmental Integration (SDe) | Em = 1 Emo = 2 Ep = 0 | 3 | Em = 1 Emo = 2 Ep = 0 | 3 |
| 10.Public Image and Support (SDps) | Pp = 1 Pa = 2 Pws = 2 | 3 | Pp = 1 Pa = 3 Pws = 3 | 5 |
| 11.Education and Employment (SDee) | Ep = 0 Et = 1 Ei = 0 | 2 | Ep = 1 Et = 1 Ei = 1 | 4 |
| 12.Integrating the Port with the City (SDpc): | Pct = 0 Pcd = 0 Pcl = 0 | 1 | Pct = 0 Pcd = 0 Pcl = 1 | 2 |
| Case Collection | P (inhab) | Cruisers | Containers | PDc | PDm | PDv | PDq | FDu | FDps | FDfu | FDfl | SDe | SDps | SDee | SDpc |
|---|---|---|---|---|---|---|---|---|---|---|---|---|---|---|---|
| Vigo (SP) | 297,241 | 233,644 | 572,784 | 5 | 4 | 3 | 3 | 3 | 5 | 2 | 4 | 3 | 3 | 5 | 4 |
| Oslo (NW) | 607,292 | 310,000 | 201,893 | 5 | 5 | 4 | 5 | 5 | 3 | 3 | 2 | 5 | 3 | 4 | 4 |
| Barcelona (SP) | 1,619,337 | 2,347,976 | 1,900,000 | 4 | 3 | 5 | 3 | 4 | 5 | 4 | 3 | 4 | 3 | 4 | 4 |
| Copenhagen (DK) | 1,080,000 | 662,000 | 153,000 | 5 | 5 | 4 | 5 | 4 | 5 | 5 | 4 | 5 | 4 | 4 | 4 |
| Genoa (IT) | 610,830 | 860,290 | 1,758,858 | 2 | 2 | 4 | 4 | 5 | 4 | 5 | 3 | 3 | 4 | 3 | 5 |
| Malaga (SP) | 568,030 | 638,845 | 476,997 | 1 | 2 | 3 | 3 | 2 | 5 | 3 | 4 | 3 | 3 | 2 | 1 |
| Santander (SP) | 181,589 | 7457 | 1520 | 2 | 4 | 3 | 4 | 4 | 3 | 5 | 4 | 3 | 3 | 4 | 4 |
| Valencia (SP) | 798,033 | 253,743 | 4,327,371 | 3 | 1 | 3 | 4 | 3 | 4 | 3 | 5 | 3 | 3 | 3 | 3 |
| Hamburg (DE) | 1,770,000 | 245,700 | 8,000,000 | 3 | 5 | 5 | 5 | 5 | 4 | 4 | 3 | 5 | 5 | 4 | 5 |
| Helsinki (FI) | 588,549 | 360,000 | 400,000 | 3 | 4 | 4 | 3 | 3 | 3 | 3 | 1 | 5 | 5 | 4 | 3 |
| Gijon (SP) | 277,559 | 5082 | 318,065 | 4 | 4 | 5 | 3 | 3 | 5 | 3 | 5 | 3 | 4 | 5 | 4 |
| Marseille (FR) | 859,543 | 1,741,282 | 953,435 | 4 | 4 | 4 | 3 | 4 | 3 | 4 | 3 | 4 | 4 | 5 | 5 |
© 2020 by the authors. Licensee MDPI, Basel, Switzerland. This article is an open access article distributed under the terms and conditions of the Creative Commons Attribution (CC BY) license (http://creativecommons.org/licenses/by/4.0/).
Share and Cite
Andrade, M.J.; Costa, J.P.; Blasco López, J. 3DPortCityMeasure: Methodology for the Comparative Study of Good Practices in Port–City Integration. Sustainability 2020, 12, 880. https://doi.org/10.3390/su12030880
Andrade MJ, Costa JP, Blasco López J. 3DPortCityMeasure: Methodology for the Comparative Study of Good Practices in Port–City Integration. Sustainability. 2020; 12(3):880. https://doi.org/10.3390/su12030880
Chicago/Turabian StyleAndrade, María J., João Pedro Costa, and José Blasco López. 2020. "3DPortCityMeasure: Methodology for the Comparative Study of Good Practices in Port–City Integration" Sustainability 12, no. 3: 880. https://doi.org/10.3390/su12030880