Article

Resource-Based Product and Process Innovation Model: Theory Development and Empirical Validation

1
College of Business, Jackson State University, Jackson, MS 39217, USA
2
Carlson School of Management, University of Minnesota, Minneapolis, MN 55455, USA
*
Author to whom correspondence should be addressed.
Sustainability 2020, 12(3), 913; https://doi.org/10.3390/su12030913
Submission received: 20 December 2019 / Revised: 15 January 2020 / Accepted: 21 January 2020 / Published: 26 January 2020
(This article belongs to the Section Economic and Business Aspects of Sustainability)

Abstract

:
Using a resource-based approach to innovation, this study proposes an alternative innovation model to the existing market-based Product Life Cycle (PLC) model. In particular, this study explores how the attributes of corporate strategic resources affect product and process innovation patterns. This study covers the development of new theory, as well as the empirical validation of the innovation model proposed in this study. Based on survey data from 257 chief operations officers in the United States, the ‘resource-based innovation model’ was tested and validated through various analytical methods, such as clustering, discriminant, and structural equation modeling analysis. The main findings are that (1) companies relying on both knowledge-based resources (KBR) and property-based resources (PBR) tend to focus on product and process innovation at the same time, (2) companies relying heavily on KBR tend to centralize their efforts for process innovation rather than product innovation, (3) companies with low reliance on KBR and PBR tend to minimize R&D efforts in product and process innovation, and (4) in a dynamic market condition, process innovations serves as order winners, while product innovations serves as order winners in a stable market. This research contributes to the operational management literature by proposing a new resource-based innovation algorithm that helps to understand innovation phenomena that are difficult to explain through the lens of the PLC-based innovation paradigm.

1. Introduction

Innovation is generally perceived as a significant driving force in corporate success, but innovation is also often recognized as a critical cause of risk, social and environmental turmoil, the so-called ‘double edges of innovation’ [1,2,3]. The literature has shown that decision-making on innovation activities can have a significant impact on the creation or destruction of an organization’s competitive advantage [4,5]. Since Utterback and Abernathy [6] introduced a product life cycle (PLC) model for innovation, the PLC model has become the dominant basis for how product and process innovation patterns evolve over the life of the product. This model supports the ‘product–process innovation’ flow, where the company’s process innovation follows the product innovation according to the product life cycle. Later, Barras [7] proposed a ‘reverse product life cycle’ model to illustrate the ‘process–product innovation’ flow that is often seen in the service industry. As such, these two model frames provide complementary insights into the enterprise’s decision-making processes for product and process innovation. However, neither the models of Utterback and Abernathy [6] nor of Barras [7] fully explain the existence of an organization that pursues product innovation and process innovation simultaneously, such as semiconductor and biotechnology companies. In addition, the two models cannot fully justify the existence of an organization that essentially focuses on only one type of innovation—either process innovation or product innovation. The limitations of existing PLC-based models can be attributed to the theoretical background that the models depend on. The PLC-based models emphasized a ‘market-based’ perspective in which organizations are considered to be systems that continuously adapt to changing business environments for survival [8,9,10,11,12]. Regarding this market-based perspective, Hayes et al. [13] (p. 52) asserted that “a strategy based solely on such static concepts as fit, trade-offs, and focus seemed lacking in an important respect: a more dynamic framework was needed for the rapidly changing global competition.” In a similar vein, Gagnon [14] has also argued that the paradigm shift has begun, with evidence that high performance is largely explained by the strength of corporate resources rather than market position. Further, many previous studies have shown that the discipline of competitive advantage has been transferring from a ‘market-based’ perspective to a ‘resource-based’ perspective [14,15,16]. Despite the paradigm shift in competitive advantage, research on the impact of corporate strategic resources on a company’s innovation decisions is very limited, and there has been no empirical study to investigate the relationship between strategic resource attributes and innovation patterns. This gap in the literature has led to a key research question of this study, and more details about the research gap are discussed in the next section. In short, the main purpose of this study is to explore how the attributes of a company’s strategic resources affect product and process innovation patterns, from a ‘resource-based’ perspective.
To investigate this research question, the remainder of this study includes the following organizations. This study begins with a brief overview of the existing PLC-based innovation models and their limitations. The discussion then leads to the theoretical underpinnings and hypotheses about the role of corporate strategic resources in innovation strategy decisions. In particular, we propose a ‘resources-based innovation model’ that can explain the phenomenon of innovation that is difficult to explain through the lens of the existing PLC-based innovation model. The following section discusses our methodology that describes our measures, sample data, and survey procedure. Next, various validation tests were conducted for the measurements and data used in this study, including confirmative factor analysis, non-response bias test, and common method variance assessment. Then, based on survey data from 257 chief operations officers in the United States, the ‘resource-based innovation model’ proposed in this study was tested through cluster analysis and the results were verified through discriminant analysis. In addition, some of the issues raised in this study were tested through structural equation modeling analyses. Finally, we conclude by discussing some theoretical and managerial implications, the limitations of the study, and suggestions for future research.
This study covers not only the development of new theory, but also the empirical validation of the model proposed in this study. The study contributes to operation management literature by suggesting a new resource-based innovation model that helps explain innovation phenomena that are difficult to understand through the PLC-based innovation paradigm. In other words, by integrating the literature on product and process innovation with a resource-based view, the study provides a new paradigm for understanding the mechanisms by which corporate strategic resources influence innovation strategy decisions.

2. Theory and Hypotheses Development

2.1. What Is Innovation

Gopalakrishnan and Damanpour [17] argued that innovation cannot be described as a unified definition but can only be defined in the context of a particular field. For example, on the economic side, innovation can be described as a factor that significantly improves productivity at the industry level; on the other hand, in the context of technology, innovation is seen as “a continuous process during which the innovation changes form as it is used and assimilated” [17] (p. 20). In terms of management, innovation can be defined as “the generation, evaluation, and implementation of new ideas to meet organizational objectives” [18] (p. 6). In the context of manufacturing, innovation can be depicted as “the application of new or different approaches or methods or technologies resulting in improved quality or reduced cost relative to competition” [18] (p. 6). Further, innovation can be taxonomically categorized into the following three sets of types: administrative vs. technical, radical vs. incremental, and product vs. process [17,19,20]. However, the main purpose of this study is to propose an alternative innovation algorithm that can account for innovation phenomena that are difficult to understand (especially with respect to the idiosyncratic patterns of product and process innovation) through the lens of PLC-based innovation models. Therefore, to clarify the boundaries of the research, this study focuses taxonomically on product versus process innovation in the context of operations management. Product innovation is illustrated as (i) a change made to the existing product or service for the benefit of customers [17,21,22] and (ii) a creation of entirely new product or service [23,24,25]. On the other hand, process innovation refers to a change in the method and knowledge that transform inputs into outputs [6,17,22,26]. In other words, product innovation is considered improvement and creation at the end of the product or service offering [21,25,27], while process innovation is considered a change in the way a firm produces a product or service [19,28,29,30].

2.2. PLC-Based Innovation Models

Abernathy and Utterback [6,31] introduced the product lifecycle innovation model to show how innovation strategies change over the product life cycle (PLC) phases. In the early stage of PLC, the ‘fluid phase,’ corporate R&D activities are mainly focused on product innovation [32]. As a result, the rate of product innovation is much higher than the rate of process innovation. However, once the dominant design of a product appears in the industry, the main competition tends to move towards reducing general design costs, and product improvements are gradual [13,33]. As a result, in the second phase, the ‘transitional phase,’ companies begin to invest more R&D budgets in process innovation (e.g., ERP, Six Sigma, JIT system, and Lean production) and the level of process innovation exceeds the level of product innovation. In the final phase, the ‘specific phase,’ companies rarely perform R&D on both product and process innovation. Accordingly, both types of innovation activities shrink and eventually converge to a more balanced level [31,34]. That is, the PLC innovation model assumes that the strategy of innovation moves from product innovation to process innovation according to the stages of PLC [6,31].
However, since the PLC model was initially developed to explain the patterns of innovation occurring in the manufacturing industry, the PLC model has inherent limitations in explaining the innovation patterns of the service industry. For this reason, Barras [7,35] proposed a ‘reverse PLC innovation’ model to illustrate the innovation patterns that occur in the service industry, which generally adopt new technologies developed in the manufacturing industry. Here, in the early stage of reverse PLC, the company’s innovation efforts begin with incremental process innovations to improve the efficiency of existing service delivery [7]. In the next phase, the company’s innovation activities focus on more radical process innovations to not only improve service quality but to also maximize service efficiency [7,34]. In the final stages, radical product innovation is dominant in creating a new type of service [7,35]. In brief, the reverse PLC model argues that major innovation activities in the service industry can be transformed from process innovation to product innovation, depending on the PLC stages.

2.3. Limitations of PLC-based Innovation Models

PLC-based models provide excellent logic that can be applied to describe innovation patterns in various industries. Furthermore, the PLC model and reverse PLC model complemented the shortcomings of each model. Nonetheless, there are still some innovations patterns that cannot be fully explained by the logic of these PLC-based innovation models. According to the PLC-based model, corporate innovation patterns must show the ‘product–process’ or ‘process–product’ flow to survive in the industry they are competing with. However, as a matter of fact, companies do not always follow one of them. For instance, companies in sectors such as pharmaceuticals and semiconductors continue to pursue product and process innovation at the same time, regardless of the PLC stage. Moreover, shipping delivery service companies such as FedEx and UPS mostly spend more R&D expenditure on process innovation than product innovation, regardless of the phase of the PLC. This limitation of the PLC-based model is mainly due to the theoretical view that the PLC models rely on. Namely, the PLC-based models stand on a market-based competition view (MBV), where the company’s strategy follows the guidelines set by market functions [14,36]. From an MBV perspective, an enterprise’s operating system is considered a fully tunable system that adheres to the rules defined by the market [14]. In particular, the PLC-based models are based broadly on the concept of ‘contingency theory’ [8,10], which emphasizes the strategic fit between organizational structure and environmental contingencies [37,38]. However, Hayes and Wheelwright [39] argue that various unexpected factors, such as economic swing, government regulation, and learning curve, often change the firm’s position on product–process matrices [40]. In addition, supporters of MBV suggest that strategic choices should be made in the event of a conflict of competition in accordance with the ‘trade-off’ principle [37,41]. However, some companies have challenged the ‘trade-off’ concept because they operate with higher quality, lower cost, and faster delivery than competitors [40]. In fact, “Japanese factories appeared to surpass their American counterparts on several competitive dimensions such as lower cost, higher quality, greater flexibility, and faster product introductions-all at the same time” [13] (p. 50). Besides, traditional PLC models are motivated to innovate processes only at an intermediate stage of product life because the core purpose of process innovation is simply cost savings of the product [13]. Strictly speaking, the PLC model regards process innovation simply as an auxiliary means of improving the product’s cost leadership in the marketplace. However, Hayes et al. [13] argued that new products could not be commercialized without significant advancements in process technology in biotechnology, semiconductors, advanced materials, medical, and many other services industries. In summary, MBV may not be the single framework that describes all sorts of product or process innovation patterns. A more dynamic theoretical framework is needed to explain and fill the limitations of MBV-based models.

2.4. Resource-Based Perspective for Alternative Innovation Paradigm

While the contingency theory assumes that most resources within a particular industry are homogeneous because they are highly mobile, the resource-based view (RBV) starts with two alternative assumptions: ‘resource heterogeneity’ and ‘resource mobility’ [42,43]. RBV claims that organizations can manage multiple resource bundles and that resource bundles are not easy to move across enterprises, increasing the heterogeneity of enterprise resources [15]. Based on these two alternative assumptions, the RBV suggests that a company is consistently superior to other companies if the resource has the following four attributes: valuable, rare, imperfectly imitable, and non-substitutable [42,44,45,46,47]. In short, the RBV ascertains that the potential to create a competitive advantage is related to the strength of the corporate resources, but MBV assumes that the competitive advantage of the firm is achieved by the strength of the firm’s market position [14,15,43,48]. Hence, proponents of the RBV assert that the paradigm is moving from the power of a firm’s market position to the power of a firm’s strategic resource [13,14,42,49,50]. Table 1 summarizes the differences between MBV and RBV; these comparisons reflect relative differences rather than the absolute nature of each view.

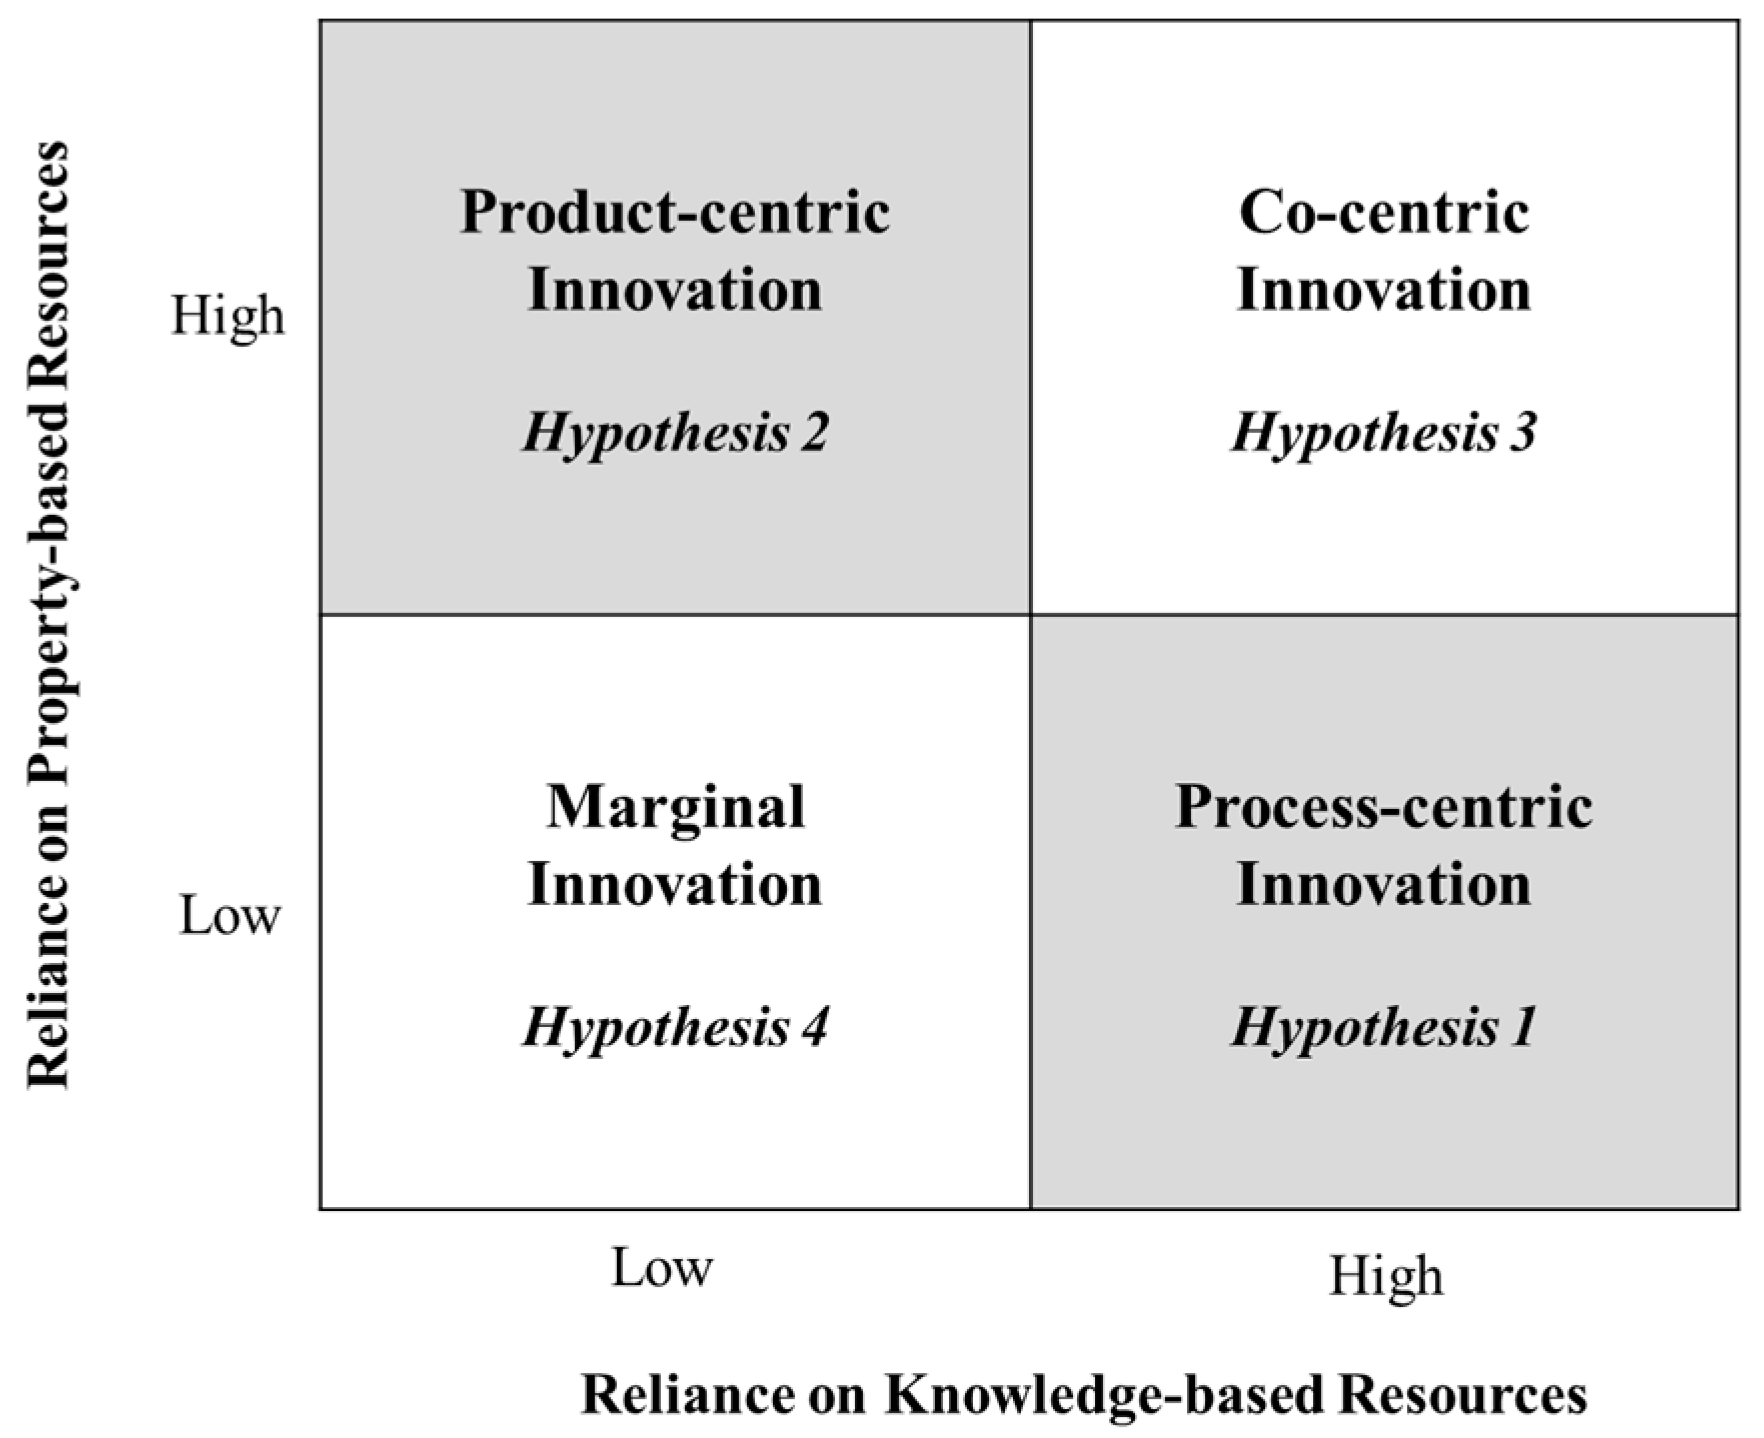
2.5. Resource-based Innovation Model

Taxonomically, a company’s resources can be defined as a set of different types. For example, Grant [54] suggested that resources could be classified into two categories: tangible resources and intangible resources. Das and Teng [55] argued that corporate resources could be classified into four types, such as technological, physical, managerial, and financial resources. Barney [42] (p. 100) described corporate resources as “all assets, capabilities, organizational processes, firm attributes, information, knowledge, etc. controlled by a firm that enable the firm to conceive and implement strategies that improve its efficiency and effectiveness.” In terms of resource theory, corporate resources include technology [49], leadership [56], organizational culture [57], innovation climate [58], product and service reputation [58], organizational structure [46], and workforce [45]. Based on the idea of barriers to imitability in the context of RBV, Miller and Shamsie [59] classified corporate resources into two groups: ‘knowledge-based’ resources and ‘property-based’ resources. According to their classification, property-based resources (PBR) are defined as some resources that can be protected by property rights such as patents, ownership, contracts, copyrights, trademarks and registered designs, while knowledge-based resources (KBR) are described as other resources that can be protected by knowledge barriers such as the company’s expertise, know-how, managerial system and processes that competitors cannot easily identify or imitate [59,60]. In other words, PBR is difficult to imitate by market competitors due to the granting of exclusive property rights; on the other hand, KBR cannot easily be imitated by competitors because of its ambiguous nature [60]. In short, KBR and PBR are resource types conceptualized based on RBV. Thus, this study adopts the resource typology of Miller and Shamsie [59] to develop a new theoretical framework of innovative patterns based on RBV. Figure 1 presents our research model called the ‘resource-based innovation matrix’ developed with the assumption that the pattern for product and process innovation can vary depending on the nature of the enterprise’s strategic resources. A detailed discussion of each innovation pattern in this innovation matrix is provided below, along with real industry examples:

2.5.1. Process-Centric Innovation

Trader Joe’s, operating more than 500 grocery stores in the U.S. as of 2019, is an example of a ‘process-centric innovation’ company because their competitiveness is derived primarily from their superior tacit know-how and innovative supply chain systems related to gourmet and organic foods. Trader Joe‘s founder, Coulombe, said in an interview with Business Week, “we adopted a policy of not carrying anything we could not be outstanding in, in terms of price … we had to create a whole new chain of logistics” [61]. In an article on why Trader Joe’s stands out from all the rest in the grocery business, Llopis [62] noted that “their (Trader Joe’s) non-conventional culturally-tailored approach and attitude is one that is deeply embedded in the roots of their business model: from their packaging, product selection, store layout, and graphics, to their vendors, employees, and management.” Bloomberg Businessweek [61] reported that Trader Joe’s could sell twice as many products per square foot than other supermarkets by restricting their products to specialized but inexpensive items. Thus, Trader Joe‘s success cannot be explained by the traditional ‘trade-offs’ approach based on MBV. Instead, Trader Joe‘s was able to gain a competitive edge in the market by creating an entirely new logistics system that could deliver high quality and affordable prices to their customers at the same time. In other words, Trader Joe’s changed market rules in the grocery industry, rather than complying with existing market rules, based on its superior KBR strength in logistics. Another example of a process-centric innovation company is FedEx, which offers USD 38 billion in delivery services annually. FedEx’s competitiveness comes from innovative knowledge-based know-how such as on-time delivery and technical superiority in tracking packages; FedEx invested more than USD 100 million in the process of coordinating the flow of goods [63]. The examples of Trader Joe’s and FedEx indicate that KBR acts as a major source of competitive advantage. As such, companies such as Trader Joe‘s and FedEx, where KBR plays an integral role in value-added activities, are likely to focus on process innovation rather than product innovation in order to create competitive advantages. Therefore, the following hypothesis is proposed to investigate the relationship between ‘process-centric innovation’ and KBR-based companies:
Hypothesis 1.
Firms heavily dependent upon knowledge-based resources tend to focus more on process innovation than on product innovation.

2.5.2. Product-Centric Innovation

Unlike the previous cases, 3M, which produces more than 55,000 products, can be considered a ‘product-centric innovation’ company because its competitive advantage is fundamentally created by PBR, such as numerous product patents and registered product designs. Another example of a product-centric innovation company could be Procter and Gamble, the world’s largest consumer product company with USD 84 billion in revenue and USD 25 billion in brand value [64]. The Symphony IRI New Product Pacesetters reported that “over the past 16 years, P&G has had 132 products on the top 25 Pacesetters list-more than its six largest competitors combined” [65]. 3M and P&G’s major innovation activities mainly focus on PBR-related innovations such as new product and brand development, or existing product improvement. In brief, companies like P&G and 3M, which rely heavily on PBR-based value-added activities, have been more committed to product innovation than process innovation to sustain a competitive advantage in the market. Hence, we propose the following hypothesis to investigate the ‘product-centric innovation’ phenomenon that is often seen in PBR-oriented companies:
Hypothesis 2.
Firms heavily dependent upon property-based resources tend to focus more on product innovation than on process innovation.

2.5.3. Co-Centric Innovation

Some companies require strong KBR and PBR at the same time to gain a competitive edge due to the rapid evolution of technology. Samsung Electronics, a global leader in semiconductor and consumer electronics with consolidated revenues of USD 221 billion in 2018, is an example of a ‘co-centric innovation’ company. In particular, the Dynamic Random-Access Memory (DRAM) industry requires new product development to be done simultaneously with process innovation due to a very short product life cycle, technology-driven, and equipment-based industry characteristics [66]. Between 1987 and 1992, Samsung’s capital expenditures accounted for about 40% of revenues, twice the average spending of the semiconductor industry, and the investment focused not only on the development of next-generation DRAM products but also on the manufacturing process of new DRAM products [66]. In addition, Samsung has been able to shorten development lead times through its specialized ‘concurrent engineering’ process know-how, which is an alternative to the traditional sequential development approach, where multiple development phases overlap [67]. Due to these simultaneous product and process innovations, Samsung’s DRAM became a leading company in 1992 and has accounted for more than 40% of the global market share since 2012. Other industry examples of ‘co-centered innovation’ are biotechnology enterprises such as Vertex Pharmaceuticals and Gilead Sciences, because new products cannot be commercialized without significant progress in process technology in the biotechnology industry [13]. In a nutshell, for some companies, the simultaneous innovation of products and processes is a prerequisite condition to remain competitive in the industry. Therefore, the following hypothesis is proposed to examine the ‘co-centric innovation’ phenomenon that is frequently observed in companies that heavily rely on both KBR and PBR:
Hypothesis 3.
Firms heavily dependent upon both knowledge-based and property-based resources tend to focus on process and product innovation at the same time.

2.5.4. Marginal Innovation

Finally, some companies, such as spring water and paper manufacturers, tend to minimize product and process innovation efforts because there is limited room for improvement through any innovation activities related to KBR or PBR. Instead, competitive advantage is simply generated by more effective marketing or lower prices than competitors. Accordingly, the following hypothesis is presented to verify the ‘marginal innovation’ phenomenon that is often found in companies that do not heavily rely on KBR as well as PBR:
Hypothesis 4.
Firms marginally dependent upon knowledge-based and property-based resources tend to minimize process and product innovation efforts.

3. Methodology

3.1. Measures

Multi-item scales were designed based on previous studies to test the hypotheses of this study. Survey respondents were asked to indicate their agreement with each statement on a seven-point Likert-type scale (e.g., 1 = strongly disagree and 7 = strongly agree). A detailed description of each item is given in Appendix A.

3.1.1. Product Innovation Intensity

Product innovation scales identify the extent of the company’s product innovation activities such as the improvements of existing products or services and the creation of entirely new products or services [17,23,25,34,68,69]. The high score on these scales means that the company tends to maintain a competitive advantage in the market by implementing a wider range of product innovation activities than their competitors [70,71,72,73]. Scale items PdI1 and PdI2 were adapted from [68]; PdI3 was developed based on [21,72]; PdI4 was developed, referring to [17,34,69]; PdI5 was adapted from [19].

3.1.2. Process Innovation Intensity

Process innovation scales capture the extent of the company’s process innovation activities, such as improving the way a company produces a product or service [17,19,22,26,68,74]. The high scores on these scales mean that the company tends to focus on process innovation to sustain a competitive advantage in the market [17,70,72,73]. In particular, scale item PcI1 was adapted from [68]; PcI2 was developed, referring to [17,70,72]; PcI3 was developed based on [17,19,74]; PcI4 was adapted from [73].

3.1.3. Property-Based Resource

The scale of property-based resources determines how much a company relies on property-based resources to maintain a competitive edge [13,14,42,59]. The high scores for these items indicate that the company relies heavily on property-based resources such as patents, ownership, contracts, copyrights, trademarks, and registered designs [19,59,60]. Item Pr1 was developed based on [59,60]; Pr2 was developed, referring to [13,14,42,49,59]; Pr3 was adapted from [19]; Pr4 was developed, referring to [63]; Pr5 was developed, referring to [59,60]; Pr6 was developed based on [13,14,19,59]

3.1.4. Knowledge-Based Resource

The scale of knowledge-based resources determines how much a company depends upon knowledge-based resources to sustain a competitive advantage [13,14,42,59]. High scores on these items denote that the company greatly depends on knowledge-based resources such as a firm’s specialized skills, processes, technical and managerial systems, and know-how to attain their competitive edge in the market [59,60,75,76]. Item Kr1 was developed based on [59,60]; Kr2 was developed, referring to [13,14,42,59,77]; items Kr3–Kr6 were adapted from [76].
In addition, a composite index of six variables, which includes a firm’s sales growth, market share growth, net profit margin, return on assets, customer satisfaction, and customer retention, was used to determine a firm’s sustainable competitive advantage in its competition [60,78]. Survey participants were asked to indicate their opinion about how their firm’s performance over the last three years compared with its competition in their industry on a scale of 1 to 7, with 1 being ‘low end of the industry,’ 2 being ‘much worse than average,’ 3 being ‘worse than average,’ 4 being ‘average,’ 5 being ‘better than average,’ 6 being ‘much better than average,’ 7 being ‘superior’ [79]. Furthermore, we have controlled for some theoretically relevant variables such as the size of the firm (i.e., the number of employees), the age of the firm (i.e., the length of time in business), and the dynamics of the market, because previous studies have suggested that the likelihood of R&D activities in firms is related to the firm’s size [80,81,82,83], the firm’s age [84], and market dynamism [85,86].

3.2. Sample

A survey method was used to collect the primary data, following the online survey design and procedure of Dillman et al. [87]. Our target respondents were chief operations officers or business owners (for relatively small businesses) in the U.S.-based companies because they were considered to have a comprehensive knowledge of the company’s resources, operations, and performance [88,89]. “Survey research has played a prominent role in testing theorized relationships that have collectively enhanced the operations management (OM) and supply chain management bodies of knowledge” [90] (p. 578). However, previous OM scholars acknowledged the potential threat of a common method variance (CMV) on the validity of the survey results due to the self-reported nature of data [91,92]. Therefore, as ex-ante remedies for controlling CMV, we applied the following criteria to recruit appropriate survey participants; (i) the participant must have a full-time position in his/her organization, and (ii) the participant must be fully aware of his/her organization’s resources and innovation activities, and (iii) if there are two or more respondents in the same organization, the survey participants are selected based on the position of the organization, that is, the top level information provider of the respondents [93,94]. We also asked respondents to participate in the survey anonymously to minimize the likelihood of CMV in the data [95]. Invitations to the survey were sent to a total of 346 target respondents and finally, 257 useful responses were collected with a response rate of 74.27%. A detailed description of the sample data is provided in Appendix B (Table A1).

3.3. Assessment of Sample Data

After collecting data from the survey respondents, the presence of non-response bias was assessed by the extrapolation method, comparing early and late survey responses [78,96,97]. The t-test results showed no significant differences between the two groups, suggesting that non-response bias is not present in our sample. We then applied Harman’s single-factor test using CFA settings to assess the potential threats of CMV [90,98]. As shown in Table 2, while the fit statistics for the measurement model showed that all fit statistics fully met the desirable thresholds for each fit index, the single-factor model revealed poor fit for the data and the items in the single-factor model also significantly suffered from poor path loadings, implying that the CMV threat was unlikely to exist in this study [22].

4. Data Analysis

4.1. Assessment of Measures

Confirmatory factor analysis (CFA) was conducted to assess the validity of the measures prepared for this study. As shown in Table 3, CFA results indicated that the factor loading for each item was in the range between 0.796 and 0.926, demonstrating that all measure items met the ideal acceptance level of 0.70 or higher [104]. The internal consistency examined by Cronbach alpha ranged between 0.934 for sustainable competitive advantage (SCA) variable and 0.959 for product-based resource variable, satisfying the threshold of 0.70 or higher [104,105]. The average variance extracted (AVE) estimates for each construct ranged from 70.2% for SCA to 81.4% for process innovation, indicating that all constructs fully satisfied the adequate level of convergent validity (50% or higher) [20,104]. Table 3 summarizes the results of CFA and other scales assessments. Further, Table 4 presents the correlation coefficients are lower than the square root of AVE estimates, which supports the discriminant validity of the constructs [106,107].

4.2. Hypotheses Test

First, to test hypotheses (i.e., resource-based innovation matrix) developed in this study, our sample was clustered into four groups according to the dichotomy of high and low dependence on property-based and knowledge-based resources. Based on the central tendency and distribution of data, the cutoff point to classify high and low reliance was set at 4.51 for property-based resources and 4.84 for knowledge-based resources [108]. Figure 2 shows the result of this sample grouping. Next, the mean value of product and process innovation intensity for each group was computed. Figure 3 presents the group means for (a) the product innovation intensity and (b) the process innovation intensity. Group 1 indicated the lowest levels of both product innovation (x = 3.267, S.D. = 1.343, S.E. = 0.131) and process innovation (x = 3.262, S.D. = 1.411, S.E. = 0.137) intensity. In Group 3, the intensity level of process innovation (x = 5.087, SD = 1.232, S.E. = 0.241) was statistically high but product innovation is low (x = 4.438, SD = 1.128, S.E. = 0.221). Group 4 illustrated the highest levels of both product innovation (x = 5.786, S.D. = 1.032, S.E. = 0.098) and process innovation (x = 5.811, S.D. = 0.840, S.E. = 0.079) intensity. However, Group 2 showed no significant difference between product innovation (x = 4.640, S.D. = 1.141, S.E. = 0.294) and process innovation (x = 4.767, S.D. = 0.703, S.E. = 0.181) intensity. In addition, the significances of the differences in product and process innovation intensity across the four clusters were examined by the ANOVA test, as presented in Table 5. In particular, since the sample size of the groups is not the same, all possible pairs of group means were compared using Tukey’s Honest Significance Difference (HSD) method [109]. As seen in Table 6, significant differences were observed between most pairs of group means (significant at p < 0.05) except for the mean between Group 2 and Group 3. Therefore, combining all the above statistics, H1, H3, and H4 were supported, but H2 was not supported on our sample data.

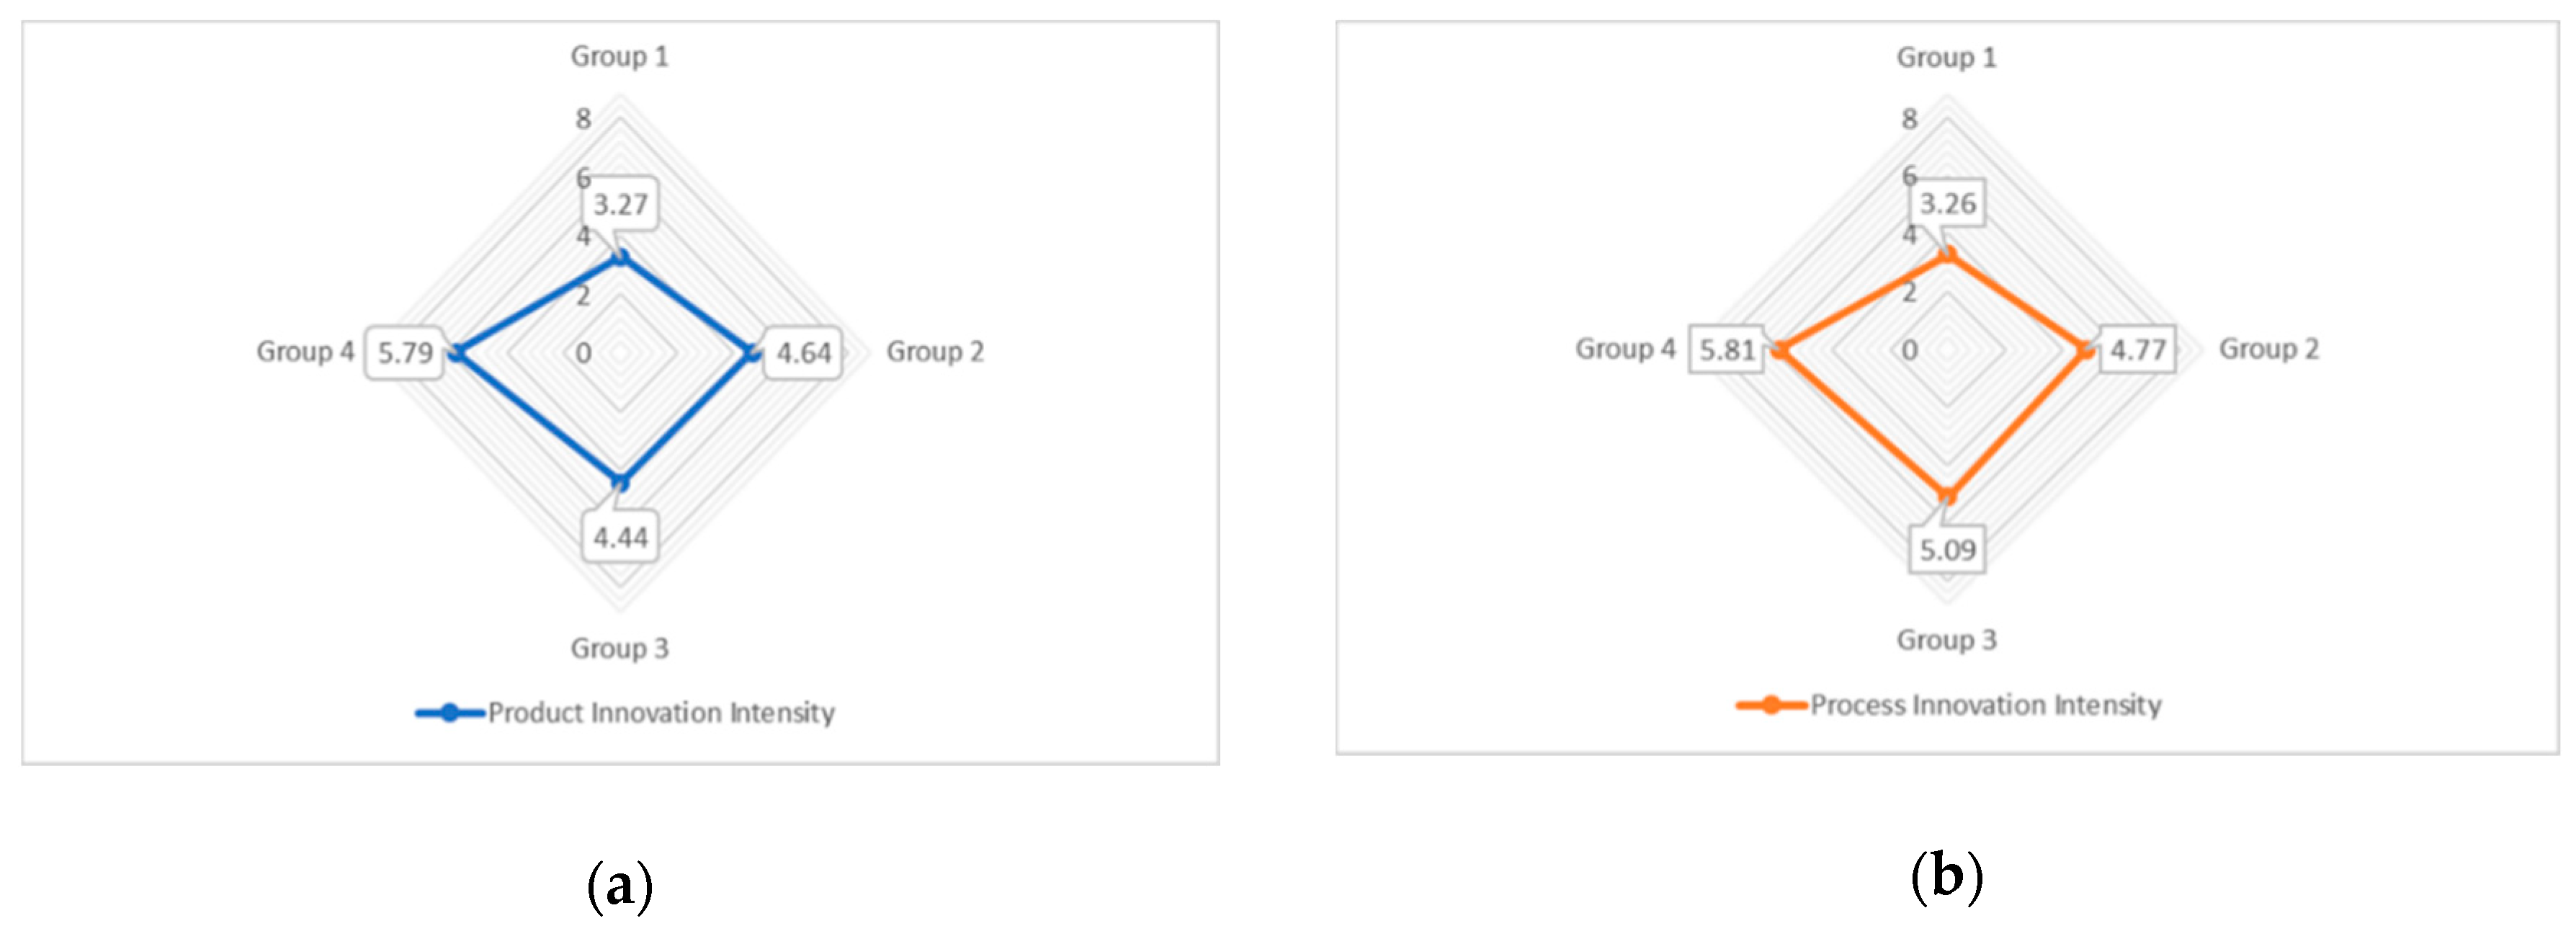
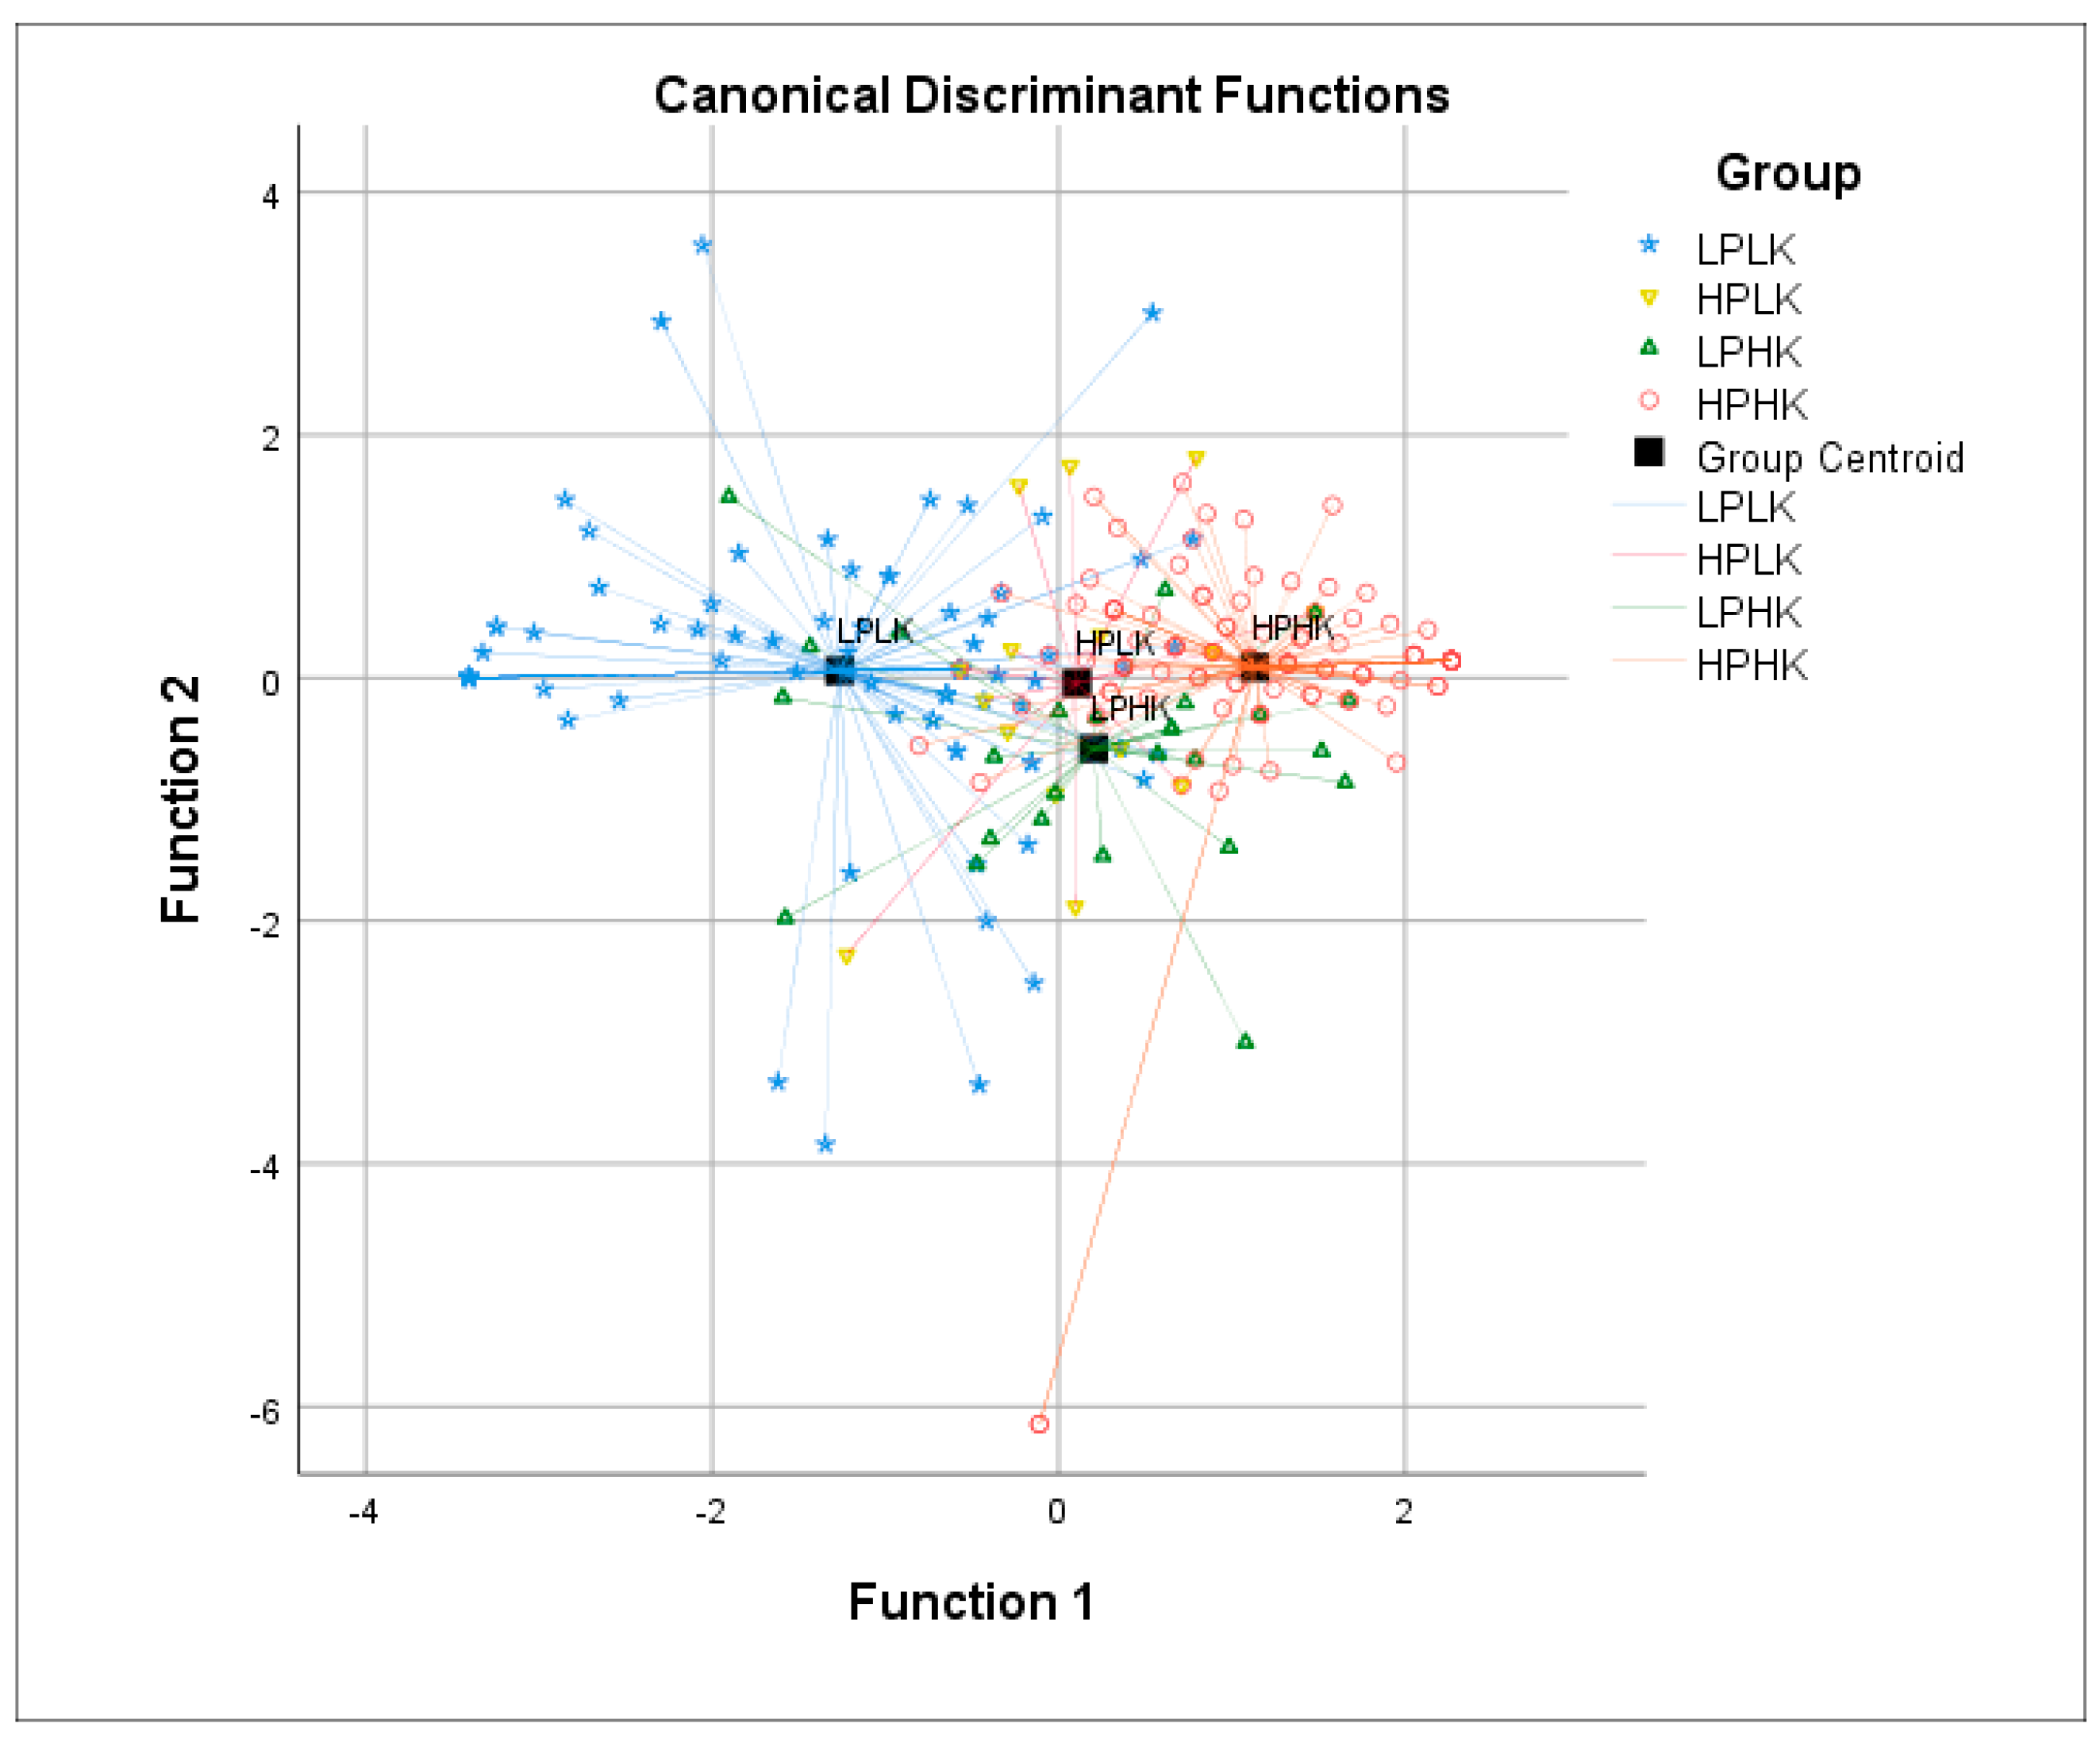
4.3. Post hoc Analysis

Follow-up tests were conducted to verify some issues raised in this study, as well as to provide additional evidence of the validity of this study. First, a discriminant analysis was conducted to determine whether there was a statistically significant difference between the four defined groups. The results demonstrated that standardized function coefficients for product and process innovations were 0.470 and 0.627, respectively, which indicates that product and process innovation intensity predicts group membership significantly (Wilks’ Lambda = 0.431, p < 0.001). The results also showed that the discriminant function means were −1.264 for Group 1, 0.107 for Group 2, 0.202 for Group 3, and 1.134 for Group 4, with a predictive accuracy of 77.0% for the sample. These results suggest that Group 1 has the least product and process innovation activity, while Group 4 has the most product and process innovation activity. Figure 4 presents the territorial map for the four-group discriminant analysis.
Second, the results of the inter-factor correlation analysis revealed that market dynamism (control variable) was strongly related to all other factors, as shown in Table 4. Further, a previous study has shown that environmental dynamism is positively associated with product and process innovation strategies [22]. For this reason, to control the impact of market dynamics on the company’s innovation patterns, the sample was divided into two groups based on a cutoff point of 4 (i.e., ‘neutral’) on a 7-point Likert-type scale: companies with dynamic market condition (N = 162) and companies with stable market condition (N = 94). Then, we established a structural equation model (SEM) to investigate how market forces affect the comprehensive relationship between enterprise strategic resources, innovation and performance. Table 7 summarizes the SEM results performed by IBM AMOS 24. The results showed that under dynamic market condition, process innovation (β = 0.628, t = 5.281) made a greater contribution to a firm’s SCA than product innovation (β = 0.112, t = 1.049). The results also indicated that KBR had a more significant relationship with process innovation (β = 0.620, t = 6.222) than product innovation (β = 0.231, t = 1.833) while PBR was more significantly related to product innovation (β = 0.610, t = 4.675) than process innovation (β = 0.347, t = 3.702) (X2/d.f. = 2.278; PNFI = 0.763; PCFI = 0.818; RMSEA = 0.089; TLI = 0.896; CFI = 0.906). On the other hand, when the market environment was stable, the results showed that SCA was significantly determined by the company’s product innovations (β = 0.573, t = 4.182) rather than process innovations (β = 0.152, t = 1.193) (X2/d.f. = 2.850; PNFI = 0.807; PCFI = 0.838; RMSEA = 0.085; TLI = 0.920; CFI = 0.928).

5. Discussions and Conclusions

5.1. Implications for Research and Practice

In this study, we proposed an alternative innovation model to the existing market-based PLC innovation model, using a resource-based approach to innovation. Based on survey data from 257 chief operations officers in the US, the ‘resource-based innovation model’ proposed in this study was tested and validated through various analytical methods, such as clustering, discriminant, and structural equation modeling analyses. The main findings were that (i) companies that heavily rely on KBR tend to focus their efforts on process innovation rather than on product innovation, (ii) companies that heavily rely on both KBR and PBR tend to focus on product and process innovation at the same time, (iii) companies with low reliance on KBR and PBR also tend to minimize their product and process innovation efforts, and (iv) in a dynamic market environment, process innovation has more significantly contributed to the company’s sustainable competitive advantage than product innovation, while in a stable market situation, the company’s product innovation, rather than process innovation, determined its sustainable competitive advantage. These findings contribute to research and practice in several ways:
Firstly, this study provides new insights that can complement the limitations of the existing PLC-based research paradigm. The most fundamental difference between ‘PLC-based’ and ‘resource-based’ innovation models lies in the theoretical perspectives of each model. In terms of organizational theory, the PLC-based model is consistent with an ‘open system’ in which an organization is seen as a system that continuously interacts with environmental variations to survive [8,110]. Accordingly, in the PLC-based model, external contingencies (e.g., market environment, changes in customer demand, and competition) are considered as crucial determinants of the company’s innovation strategy [6,111,112]. Contrastingly, the ‘resource-based’ innovation model focuses on internal coincidence within the organization and assumes that the inherent characteristics of strategic resources serve as the decisive determinants of innovation decision making. In other words, the innovation model proposed in this study is theoretically harmonized with the literature on the resource-based view of the firm [14,42,49], while the existing PLC-based model is consistent with the contingency theory [8,10,113]. Therefore, this study contributes to the operation management literature by providing new insights into how corporate resources impact innovation strategy decisions from a resource-based perspective.
Secondly, the study also provides new insights to business executives and policy makers by showing why more attention should be paid to the inherent attributes of corporate resources in determining innovation strategies. The findings supported the critical role of corporate strategic resources in optimizing product and process innovation. In particular, the ‘resource-based matrix’ proposed in this study provides a new algorithm for understanding the mechanism by which corporate strategic resources influence innovation strategy decisions. That is, the findings suggest that innovation strategy decisions should begin by identifying which enterprise resources are the primary source of competitive advantage [14,15,49,51]. Accordingly, it might be first asked where the firm’s competitive edge is derived from PBR, KBR, or both types of resources. The company can then use the intrinsic nature of its strategic resources as a profound guide for identifying the most optimal innovation alternatives: (a) product-centric, (b) process-centric, (c) co-centric, and (d) marginal innovations. This resource-based innovation approach is thereby expected to enhance the company’s core competencies and ultimately lead to a sustainable competitive advantage [15].
Thirdly, this study raises a fundamental question about the common rationale of the relationship between innovation adoption and competitive advantage. As discussed previously, the PLC model postulates that companies are more likely to focus on product innovation during the early dynamic market phase until its product design is standardized in an industry [31]. Then, as demand for products becomes more stable and predictable, companies accelerate process innovation to reduce production costs [13,33]. This logical frame is beneficial in explaining the relationship between industrial variations and innovation adoption, which can be advocated by the contingency theory [10]. However, a fundamental question arises when companies pursue the same innovation strategy according to industrial environmental factors; here, companies can face ‘competitive parity’ rather than ‘competitive advantage.’ Our study results suggest an alternative basis for how innovation strategies can have a competitive advantage, indicating that in dynamic market condition, a company’s process innovation had a more significant impact on competitive advantage than product innovation, while in a stable market, product innovation more significantly affected competitive advantage than process innovation. Based on these findings, it is inferred that when market dynamics are high, process innovation can be a source of ‘order winner’ that differentiates from competitions while product innovation plays a role of ‘order qualifier,’ a prerequisite for survival in the industry. Conversely, the results also suggest that in a stable market condition, product innovation creates a source of ‘order winners,’ but process innovation serves as ‘order qualifier’ because it is the minimum requirement for survival amongst the competition. Figure 5 is a graphical summary of these claims about how competitive advantage can be achieved through innovation activities in line with market dynamics.
Finally, the study also contributes to the research methodology by newly developing scale items for KBR and PBR measurements. Existing studies have used self-selected indicators as proxy to measure KBR and PBR, so they often suffer from non-representative samples, and there is a limit to comprehensively estimating the characteristics of strategic resources of individual companies [59]. In this study, based on extensive literature review, we developed PBR scale items that can be used to measure the extent to which a company relies on property-based resources (e.g., patents, ownership, contracts, copyrights, trademarks, and registered designs) to maintain a competitive advantage [13,19,49,59,60]. KBR scale items were also developed to measure the extent to which a company relies on knowledge-based resources (e.g., a firm’s specialized skills, processes, technical and managerial systems, and know-how) to maintain a competitive advantage in the market [14,42,60,76,77]. These items were validated through various statistical methods, including Cronbach alpha, average variances extracted, and factor analysis, and were posted in the Appendix for future researchers.

5.2. Limitations and Suggestions for Future Research

Although current research has made some meaningful contributions to the literature on product and process innovation, the methodological limitations of this research should be noted. Above all, the relatively small sample size of this study may be a source of concern about the generalizability of our model. In this study, H2 was not particularly supported. The reason why H2 is not supported can be thought of in two ways: (i) the rationale for H2 is wrong, or (ii) the problem of small sample size. We think the latter is more likely because we did a discriminant analysis to verify this problem as the post hoc analysis, and the results showed that there was a significant difference between the four groups even though the functional mean of Group 2 (i.e., high PBR and low KBR) was the lowest. As such, from a loose perspective, even H2 can be seen as being supported. Hence, given the minimal number of participants (n = 15) meeting the preconditions for H2 (i.e., high PBR and low KBR), future research can verify the claim of H2 with a larger-scale sampling. Another possible reason why H2 is not supported is that this study was conducted in the sole context of the US economy. H2 is an assumption for a company that relies heavily on PBR rather than KBR to stay competitive in the market. However, given the knowledge-intensive industrial structure of the United States, it is never easy for a company to gain a competitive advantage by simply focusing on PBR. In short, the sample that meets the H2 criteria is expected to be more structurally rare than other sample groups due to US business environmental factors. Besides, H2 was developed based the idea of barriers to imitability in the context of RBV. However, given that the ‘technical diffusion processes’ vary from country to country, even the basic assumption of RBV may not be applicable in the business environment of other countries (e.g., different barriers and regulations for patent, copyright, and technology transfer in countries) [114,115,116]. It is, thus, worthwhile for future studies to explore the insights of resource-based innovation models in a broader context beyond the U.S. economy by examining samples from various background countries. Further, instead of sticking to one innovation paradigm, future research will need to develop a multi-dimensional approach model to find the most effective innovation strategy by integrating resource-based and PLC-based innovation models.

5.3. Conclusions

As discussed earlier, we acknowledge that PLC-based innovation models [6,7,28,31] have contributed significantly to establishing a general logic that can be applied to a wide range of industrial innovation patterns. However, many of the innovation patterns in real industrial sites are not easily explained by the PLC innovation model and are still unresolved in the literature. Thus, we began this study with the motivation to fill this gap. As such, this study has proposed a new resource-based innovation algorithm that helps us to understand innovation phenomena that are difficult to explain through the lens of the PLC-based innovation paradigm. In short, by integrating the literature on product and process innovation with a resource-based perspective, this study provides a new paradigm for understanding the mechanisms by which corporate strategic resources influence innovation strategy decisions. Therefore, rather than denying the current PLC paradigm, we hope that this study will help broaden the scope of innovation research by presenting new insights to discover the logic that complements the limitations of the PLC paradigm.

Author Contributions

All authors contributed significantly to the completion of this manuscript. Conceptualization, Y.S.C.; methodology, Y.S.C., K.L.; formal analysis, Y.S.C., K.L.; writing-original draft preparation, Y.S.C.; writing-review and editing, K.L.; supervision, K.L. All authors have read and agreed to the published version of the manuscript.

Funding

This research received no external funding.

Acknowledgments

We are very grateful to David Peng (University of Houston) and Hale Kaynak (University of Texas-Rio Grande Valley), and the anonymous Sustainability reviewers for their insightful comments on an earlier draft of this paper.

Conflicts of Interest

The authors declare no conflict of interest.

Appendix A. Survey Questionnaire (Measure Items)

Appendix A.1. Product Innovation Intensity

  • PRODUCT Innovation is defined as: (i) the changes made to existing products or services for the benefit of customers or clients, or (ii) the creation of entirely new products or services. Please consider your company’s PRODUCT Innovation activities, and then indicate your agreement with each statement on a scale of 1 to 7.
PdI1:
PRODUCT innovations introduced by our company during the last three years have been extensive.
PdI2:
Our company’s PRODUCT improvements during the last three years have been radical.
PdI3:
In dealing with our competitors, our company tends to sustain competitive advantages through more intensive PRODUCT innovations than our competitors.
PdI4:
In general, our company tends to be ahead of our competitors in introducing new or improved products or services.
PdI5:
Our company is well known by our customers for outstanding PRODUCT innovations.

Appendix A.2. Process Innovation Intensity

  • PROCESS Innovation is defined as the changes in the way that a firm produces products or services. Please consider your company’s PROCESS Innovation activities, and then indicate your agreement with each statement on a scale of 1 to 7.
PcI1:
Our company’s PROCESS improvements during the last three years have been radical.
PcI2:
In dealing with our competitors, our company tends to sustain competitive advantages through more intensive PROCESS innovations than our competitors.
PcI3:
In general, our company tends to be ahead of our competitors in introducing new or significantly improved PROCESSES (e.g., information technology, productive process, and machinery and equipment) for producing products or services.
PcI4:
Our company has a superior capability to develop a new product or service in a shorter time compared to our competitors.

Appendix A.3. Reliance on Property-based Resources

  • Property-based Resources are defined as resources that can be protected by property rights such as patent, ownership, contracts, copyrights, trademarks, and registered designs. Please consider your company’s Property-based Resources, and then indicate your agreement with each statement on a scale of 1 to 7.
Pr1:
The reliance of our business on ‘Property-Based Resources’ (e.g., patent, ownership, contracts, copyrights, trademarks, and registered designs) has been significant.
Pr2:
In dealing with our competitors, our company tends to sustain our competitive edge by strengthening “Property-Based Resources.”
Pr3:
Our company tends to introduce new products or services into the market more frequently than our competitors.
Pr4:
Our company is superior to our competitors in terms of product variety.
Pr5:
Our product brands are typically considered more prestigious than those of our competitors.
Pr6:
Our company is well known by our customers for dominant legal properties such as registered designs, technical patents, and copyrights.

Appendix A.4. Reliance on Knowledge-based Resources

  • Knowledge-based Resources are defined as resources that can be protected by knowledge barriers such as a firm’s specialized skills, processes, technical and managerial systems, and know-hows that cannot easily be identified or imitated by market competitors. Please consider your company’s Knowledge-based Resources, and then indicate your agreement with each statement on a scale of 1 to 7.
Kr1:
The reliance of our business on ‘Knowledge-Based Resources’ (e.g., a firm’s specialized skills, processes, technical and managerial systems, and know-hows) has been significant.
Kr2:
In dealing with our competitors, our company tends to sustain our competitive edge by strengthening ‘Knowledge-Based Resources.’
Kr3:
Our company has a strong position regarding technical expertise compared to our competitors.
Kr4:
Our company has a strong position regarding expertise in marketing compared to our competitors.
Kr5:
Our company has a strong position regarding expertise in customer service compared to our competitors.
Kr6:
Our company has a strong position regarding highly productive staffs compared to our competitors.

Appendix A.5. Sustainable Competitive Advantage

  • Please consider your firm’s performance over the last three years, and then indicate your opinion about how your firm’s performance compares with its competition in your industry on a scale of 1 to 7 (e.g., 1 = low end of the industry, 2 = much worse than average, 3 = worse than average, 4 = average, 5 = better than average, 6 = much better than average, 7 = superior).
Sca1:
Sales growth
Sca2:
Market share growth
Sca3:
Net profit margin
Sca4:
Return on assets
Sca5:
Customer satisfaction
Sca6:
Customer retention

Appendix A.6. Market Dynamism

  • Please consider your company’s Business Environment, and then indicate your agreement with each statement on a scale of 1 to 7.
Md1:
The needs and wants of our customers are changing very fast.
Md2:
Our competitive pressures are extremely high.
Md3:
The demand for our products/services is unstable and unpredictable.

Appendix B

Table A1. Sample demographics.
CategoryCount
Industry
(2-digit SIC codes)
Agriculture, Forestry and Fishing (01–09)114.3%
Construction (15–17)2911.3%
Apparel and Fabricated Textile Products (23)72.7%
Papers and Allied Products (26)31.2%
Printing and Publishing (27)51.9%
Pharmaceuticals (28)31.2%
Chemical Products (28)10.4%
Petroleum Refining (29)20.8%
Semiconductors and Related Devices (36)83.1%
Transportation Services (47)155.8%
Communications Services (48)176.6%
Wholesale Trade (50–51)51.9%
Retail Trade (52–59)249.3%
Financial Services (60–64)207.8%
Hotels and Other Lodging Places (70)41.6%
Prepackaged Software (73)72.7%
Healthcare (80)249.3%
Legal Services (81)41.6%
Education (82)249.3%
Accounting and Business Consulting Services (87)83.1%
Others3212.5%
Missing responses41.6%
Length of Time in Business<5 years197.4%
5~10 years4116.0%
11~20 years4316.7%
21~30 years5019.5%
31~50 years4517.5%
51~100 years3714.4%
>100 years187.0%
Missing responses41.6%
Number of Employees<10 employees238.9%
11~50 employees207.8%
51~100 employees2810.9%
101~500 employees4216.3%
501~1000 employees5923.0%
1001~10,000 employees4617.9%
>10,000 employees3513.6%
Missing responses41.6%
Respondent’s Age<1800.0%
18~294517.5%
30~449235.8%
45~609838.1%
>60176.6%
Missing responses51.9%

References

  1. Cardozo, R.; McLaughlin, K.; Harmon, B.; Reynolds, P.; Miller, B. Product-market choices and growth of new businesses. J. Prod. Innov. Manag. 1993, 10, 331–340. [Google Scholar] [CrossRef]
  2. Frambach, R.T.; Schillewaert, N. Organizational innovation adoption: A multi-level framework of determinants and opportunities for future research. J. Bus. Res. 2002, 55, 163–176. [Google Scholar] [CrossRef]
  3. Hall, J.; Vredenburg, H. The challenges of innovating for sustainable development. MIT Sloan Manag. Rev. 2003, 45, 61–68. [Google Scholar]
  4. Cho, H.J.; Pucik, V. Relationship between innovativeness, quality, growth, profitability, and market value. Strateg. Manag. J. 2005, 26, 555–575. [Google Scholar] [CrossRef]
  5. Gunday, G.; Ulusoy, G.; Kilic, K.; Alpkan, L. Effects of innovation types on firm performance. Int. J. Prod. Econ. 2011, 133, 662–676. [Google Scholar] [CrossRef] [Green Version]
  6. Utterback, J.M.; Abernathy, W.J. A dynamic model of process and product innovation. Omega 1975, 3, 639–656. [Google Scholar] [CrossRef]
  7. Barras, R. Towards a theory of innovation in services. Res. Policy 1986, 15, 161–173. [Google Scholar] [CrossRef]
  8. Lawrence, P.R.; Lorsch, J.W. Differentiation and integration in complex organizations. Adm. Sci. Q. 1967, 12, 1–47. [Google Scholar] [CrossRef]
  9. Child, J. Organizational structure, environment and performance: The role of strategic choice. Sociology 1972, 6, 1–22. [Google Scholar] [CrossRef]
  10. Donaldson, L. Strategy and structural adjustment to regain fit and performance: In defense of contingency theory. J. Manag. Stud. 1987, 24, 1–24. [Google Scholar] [CrossRef]
  11. Chandler, A.D. Strategy and structure. In The History of the Industrial Enterprise; MIT Press: Cambridge, MA, USA, 1990; Volume 120. [Google Scholar]
  12. Porter, M.E. What is strategy? Harvard Business Review, November–December. 1996; 61–78. [Google Scholar]
  13. Hayes, R.; Pisano, G.; Upton, D.; Wheelwright, S. Operation, Strategy, and Technology: Pursuing the Competitive Edge; John Wiley & Sons: Indianapolis, IN, USA, 2004. [Google Scholar]
  14. Gagnon, S. Resource-based competition and the new operations strategy. Int. J. Oper. Prod. Manag. 1999, 19, 125–138. [Google Scholar] [CrossRef]
  15. Barney, J.; Arikan, A. The resource-based view: Origins and implications. In The Blackwell Handbook of Strategic Management; John Wiley & Sons: Hoboken, NJ, USA, 2005; pp. 124–188. [Google Scholar]
  16. Meredith, J.R.; Pilkington, A. Assessing the exchange of knowledge between operations management and other fields: Some challenges and opportunities. J. Oper. Manag. 2018, 60, 47–53. [Google Scholar] [CrossRef]
  17. Gopalakrishnan, S.; Damanpour, F. A review of innovation research in economics, sociology and technology management. Omega 1997, 25, 15–28. [Google Scholar] [CrossRef]
  18. Schroeder, R.G.; Scudder, G.D.; Elm, D.R. Innovation in manufacturing. J. Oper. Manag. 1989, 8, 1–15. [Google Scholar] [CrossRef]
  19. Kim, D.Y.; Kumar, V.; Kumar, U. Relationship between quality management practices and innovation. J. Oper. Manag. 2012, 30, 295–315. [Google Scholar] [CrossRef]
  20. Hsu, C.C.; Tan, K.C.; Jayaram, J.; Laosirihongthong, T. Corporate entrepreneurship, operations core competency and innovation in emerging economies. Int. J. Prod. Res. 2014, 52, 5467–5483. [Google Scholar] [CrossRef]
  21. Capon, N.; Farley, J.U.; Lehmann, D.R.; Hulbert, J.M. Profiles of product innovators among large U.S. manufacturers. Manag. Sci. 1992, 38, 157–169. [Google Scholar] [CrossRef]
  22. Jayaram, J.; Oke, A.; Prajogo, D. The antecedents and consequences of product and process innovation strategy implementation in Australian manufacturing firms. Int. J. Prod. Res. 2014, 52, 4424–4439. [Google Scholar] [CrossRef]
  23. Knight, K.E. A descriptive model of the intra-firm innovation process. J. Bus. 1967, 40, 478–496. [Google Scholar] [CrossRef]
  24. Kaynak, H. Total Quality Management and Just-in-Time Purchasing: Their Effects on Performance of Firms Operating in the U.S.; Garland Publishing: New York, NY, USA, 1997. [Google Scholar]
  25. Jajja, M.S.S.; Kannan, V.R.; Brah, S.A.; Hassan, S.Z. Linkages between firm innovation strategy, suppliers, product innovation, and business performance: Insights from resource dependence theory. Int. J. Oper. Prod. Manag. 2017, 37, 1054–1075. [Google Scholar] [CrossRef] [Green Version]
  26. Zhang, M.; Qi, Y.; Guo, H. Impacts of intellectual capital on process innovation and mass customisation capability: Direct and mediating effects. Int. J. Prod. Res. 2017, 55, 6971–6983. [Google Scholar] [CrossRef]
  27. De Propris, L. Types of innovation and inter-firm co-operation. Entrep. Reg. Dev. 2002, 14, 337–353. [Google Scholar] [CrossRef]
  28. Utterback, J.M. Mastering the Dynamics of Innovation; Harvard Business School Press: Boston, MA, USA, 1994. [Google Scholar]
  29. Koberg, C.S.; Detienne, D.R.; Heppard, K.A. An empirical test of environmental, organizational, and process factors affecting incremental and radical innovation. J. High Technol. Manag. Res. 2003, 14, 21–45. [Google Scholar] [CrossRef]
  30. Kach, A.; Busse, C.; Azadegan, A.; Wagner, S.M. Maneuvering through hostile environments: How firms leverage product and process innovativeness. Decis. Sci. 2016, 47, 907–956. [Google Scholar] [CrossRef]
  31. Abernathy, W.J.; Utterback, J.M. Patterns of industrial innovation. Technol. Rev. 1978, 80, 40–47. [Google Scholar]
  32. Bayus, B.L. Optimal dynamic policies for product and process innovation. J. Oper. Manag. 1995, 12, 173–185. [Google Scholar] [CrossRef]
  33. Rothaermel, F.T. Strategic Management: Concepts and Cases; McGraw-Hill Irwin: New York, NY, USA, 2013. [Google Scholar]
  34. Damanpour, F.; Gopalakrishnan, S. The dynamics of the adoption of product and process innovations in organizations. J. Manag. Stud. 2001, 38, 45–65. [Google Scholar] [CrossRef]
  35. Barras, R. Interactive innovation in financial and business services: The vanguard of the service revolution. Res. Policy 1990, 19, 215–237. [Google Scholar] [CrossRef]
  36. Porter, M.E. Competitive Strategy: Techniques for Analyzing Industries and Competitors, 1st ed.; Free Press: New York, NY, USA, 1980. [Google Scholar]
  37. Porter, M.E. Competitive Advantage; Free Press: New York, NY, USA, 1985. [Google Scholar]
  38. Donaldson, L. The Contingency Theory of Organizations; Sage Publications: Southend Oaks, CA, USA, 2001. [Google Scholar]
  39. Hayes, R.; Wheelwright, S.C. The dynamics of process-product life cycles. Harvard Business Review, March 1979; 127–136. [Google Scholar]
  40. Anderson, J.C.; Cleveland, G.; Schroeder, R.G. Operations strategy: A literature review. J. Oper. Manag. 1989, 8, 133–158. [Google Scholar] [CrossRef]
  41. Porter, M.E. Competition in Global Industries; Harvard Business School Press: Boston, MA, USA, 1986. [Google Scholar]
  42. Barney, J. Firm resources and sustained competitive advantage. J. Manag. 1991, 17, 99–120. [Google Scholar] [CrossRef]
  43. Barney, J. Gaining and Sustaining Competitive Advantage; Prentice Hall: Upper Saddle River, NJ, USA, 2002. [Google Scholar]
  44. Reed, R.; DeFillippi, R.J. Causal Ambiguity, Barriers to Imitation, and Sustainable Competitive Advantage. Acad. Manag. Rev. 1990, 15, 88–102. [Google Scholar] [CrossRef]
  45. Peteraf, M.A. The cornerstone of competitive advantage: A resource-based view. Strateg. Manag. J. 1993, 14, 179–191. [Google Scholar] [CrossRef]
  46. Powell, T.C. Firm-specific competitive advantage in high technology firms. J. High Technol. Manag. Res. 1993, 4, 197–209. [Google Scholar] [CrossRef]
  47. Barney, J.B.; Hesterly, W.S. Strategic Management and Competitive Advantage: Concepts and Cases; Pearson: Upper Saddle River, NJ, USA, 2006. [Google Scholar]
  48. Hitt, M.A.; Ireland, R.D.; Hoskisson, R.E. Strategic Management: Competitiveness & Globalization: Concepts, 9th ed.; Cengage Learning: Mason, OH, USA, 2011. [Google Scholar]
  49. Wernerfelt, B. A resource-based view of the firm. Strateg. Manag. J. 1984, 5, 171–180. [Google Scholar] [CrossRef]
  50. Gouda, S.K.; Saranga, H. Sustainable supply chains for supply chain sustainability: Impact of sustainability efforts on supply chain risk. Int. J. Prod. Res. 2018, 56, 5820–5835. [Google Scholar] [CrossRef]
  51. Conner, K. A historical comparison of resource-based theory and five schools of thought within industrial organization economics: Do we have a new theory of the firm? J. Manag. 1991, 17, 121–154. [Google Scholar] [CrossRef]
  52. McEvily, S.K.; Chakravarthy, B. The persistence of knowledge-based advantage: An empirical test for product performance and technological knowledge. Strateg. Manag. J. 2002, 23, 285–305. [Google Scholar] [CrossRef]
  53. Wiggins, R.R.; Ruefli, T.W. Sustained competitive advantage: Temporal dynamics and the incidence and persistence of superior economic performance. Organ. Sci. 2002, 13, 82–105. [Google Scholar] [CrossRef]
  54. Grant, R.M. The resource-based theory of competitive advantage: Implications for strategy formulation. Calif. Manag. Rev. 1991, 33, 114–135. [Google Scholar] [CrossRef] [Green Version]
  55. Das, T.K.; Teng, B. Resources and risk management in the strategic alliance making process. J. Manag. 1998, 24, 21–42. [Google Scholar] [CrossRef]
  56. Castanias, R.P.; Helfat, C.E. Managerial resources and rents. J. Manag. 1991, 17, 155–171. [Google Scholar] [CrossRef]
  57. Fiol, C.M. Managing culture as a competitive resource: An identity-based view of sustainable competitive advantage. J. Manag. 1991, 17, 191–211. [Google Scholar] [CrossRef]
  58. Lado, A.A.; Boyd, N.G.; Wright, P. A Competency-based model of sustainable competitive advantage: Toward a conceptual integration. J. Manag. 1992, 18, 77–91. [Google Scholar] [CrossRef]
  59. Miller, D.; Shamsie, J. The resource-based view of the firm in two environments: The Hollywood film studios from 1936 to 1965. Acad. Manag. J. 1996, 39, 519–543. [Google Scholar]
  60. Das, T.K.; Teng, B. A resource-based theory of strategic alliance. J. Manag. 2000, 26, 31–61. [Google Scholar] [CrossRef]
  61. Palmeri, C. Trader Joe’s Recipe for Success. Bloomberg Businessweek. 20 February 2008. Available online: https://www.bloomberg.com/news/articles/2008-02-20/trader-joes-recipe-for-success (accessed on 15 January 2020).
  62. Llopis, G. Why Trader Joe’s Stands Out from All the Rest in the Grocery Business. Forbes. 5 September 2011. Available online: https://www.forbes.com/sites/glennllopis/2011/09/05/why-trader-joes-stands-out-from-all-the-rest-in-the-grocery-business/#45d5286a4dec (accessed on 15 January 2020).
  63. Krajewski, L.J.; Ritzman, L.P.; Malhotra, M.K. Operations Management: Processes and Supply Chains, 10th ed.; Pearson/Prentice Hall: Upper Saddle River, NJ, USA, 2013. [Google Scholar]
  64. P&G 2012 Annual Report. Available online: http://annualreport.pg.com/annualreport2012 (accessed on 15 January 2020).
  65. P&G Company Website. Available online: http://www.pg.com/en US/company/corestrengths.shtml (accessed on 30 April 2013).
  66. Kang, J. A Study of the DRAM Industry. Master’s Thesis, Massachusetts Institute of Technology, Cambridge, MA, USA, 2010. [Google Scholar]
  67. Bozarth, C.; Handfield, R.B. Introduction to Operations and Supply Chain Management, 4th ed.; Pearson: Upper Saddle River, NJ, USA, 2015. [Google Scholar]
  68. Weerawardena, J. The role of marketing capability in innovation-based competitive strategy. J. Strateg. Mark. 2003, 11, 15–35. [Google Scholar] [CrossRef]
  69. Prajogo, D.I.; Sohal, A.S. The relationship between organization strategy, total quality management (TQM), and organization performance—The mediating role of TQM. Eur. J. Oper. Res. 2006, 168, 35–50. [Google Scholar] [CrossRef]
  70. Gopalakrishnan, S.; Bierly, P.; Kessler, E.H. A reexamination of product and process innovations using a knowledge-based view. J. High Technol. Manag. Res. 1999, 10, 147–166. [Google Scholar] [CrossRef]
  71. Atuahene-Gima, K.; Ko, A. An empirical investigation of the effect of market orientation and entrepreneurship orientation alignment on product innovation. Organ. Sci. 2001, 12, 54–74. [Google Scholar] [CrossRef]
  72. Real, K.; Poole, M.S. Innovation implementation: Conceptualization and measurement in organizational research. Res. Organ. Chang. Dev. 2005, 15, 63–134. [Google Scholar]
  73. Valle, S.; Vázquez-Bustelo, D. Concurrent engineering performance: Incremental versus radical innovation. Int. J. Prod. Econ. 2009, 119, 136–148. [Google Scholar] [CrossRef]
  74. Ettlie, J.E.; Reza, E.M. Organizational integration and process innovation. Acad. Manag. J. 1992, 35, 795–827. [Google Scholar]
  75. Armstrong, C.E.; Shimizu, K. A review of approaches to empirical research on the resource-based view of the firm. J. Manag. 2007, 33, 959–986. [Google Scholar] [CrossRef]
  76. Shepherd, D.A.; Wiklund, J. Entrepreneurial Small Businesses: A Resource-Based Perspective; Edward Elgar Publishing: Northampton, MA, USA, 2005. [Google Scholar]
  77. Wernerfelt, B. The resource-based view of the firm: Ten years after. Strateg. Manag. J. 1995, 16, 171–174. [Google Scholar] [CrossRef]
  78. Cho, Y.S.; Linderman, K. Metacognition-Based Process Improvement Practices. Int. J. Prod. Econ. 2019, 211, 132–444. [Google Scholar] [CrossRef]
  79. Guo, L.; Tobias, J.; Bendoly, E.; Hu, Y. Different departments, different drivers: Asymmetry in antecedents and outcomes of voluntary knowledge exchange between sales and production functions. Int. J. Oper. Prod. Manag. 2017, 37, 1031–1053. [Google Scholar] [CrossRef] [Green Version]
  80. Damanpour, F. Organizational size and innovation. Organ. Stud. 1992, 13, 375–402. [Google Scholar] [CrossRef]
  81. Martinez-Ros, E. Explaining the decisions to carry out product and process innovations: The Spanish case. J. High Technol. Manag. Res. 1999, 10, 223–242. [Google Scholar] [CrossRef] [Green Version]
  82. Camisón-Zornoza, C.; Lapiedra-Alcamí, R.; Segarra-Ciprés, M.; Boronat-Navarro, M. A meta-analysis of innovation and organizational size. Organ. Stud. 2004, 25, 331–361. [Google Scholar] [CrossRef]
  83. Kach, A.; Azadegan, A.; Wagner, S.M. The influence of different knowledge workers on innovation strategy and product development performance in small and medium-sized enterprises. Int. J. Prod. Res. 2015, 53, 2489–2505. [Google Scholar] [CrossRef]
  84. Calantone, R.J.; Cavusgil, S.T.; Zhao, Y. Learning orientation, firm innovation capability, and firm performance. Ind. Mark. Manag. 2002, 31, 515–524. [Google Scholar] [CrossRef]
  85. Pagell, M.; Krause, D.R. A multiple-method study of environmental uncertainty and manufacturing flexibility. J. Oper. Manag. 1999, 17, 307–325. [Google Scholar] [CrossRef]
  86. Zhang, D.; Linderman, K.; Schroeder, R.G. The moderating role of contextual factors on quality management practices. J. Oper. Manag. 2012, 30, 12–23. [Google Scholar] [CrossRef]
  87. Dillman, D.A.; Smyth, J.D.; Christian, L.M. Internet, Phone, Mail and Mixed-Mode Surveys: The Tailored Design Method, 4th ed.; Wiley: New York, NY, USA, 2014. [Google Scholar]
  88. Miller, D.; Toulouse, J.M. Chief executive personality and corporate strategy and structure in small firms. Manag. Sci. 1986, 32, 1389–1409. [Google Scholar] [CrossRef]
  89. Zahra, S.A.; Covin, J.G. Business strategy, technology policy and firm performance. Strateg. Manag. J. 1993, 14, 451–478. [Google Scholar] [CrossRef]
  90. Craighead, C.W.; Ketchen, D.J.; Dunn, K.S.; Hult, G.T.M. Addressing common method variance: Guidelines for survey research on information technology, operations, and supply chain management. IEEE Trans. Eng. Manag. 2011, 58, 578–588. [Google Scholar] [CrossRef]
  91. Wagner, S.M.; Bode, C. Supplier relationship-specific investments and the role of safeguards for supplier innovation sharing. J. Oper. Manag. 2014, 32, 65–78. [Google Scholar] [CrossRef]
  92. Escrig-Tena, A.B.; Segarra-Ciprés, M.; García-Juan, B.; Beltrán-Martín, I. The impact of hard and soft quality management and proactive behaviour in determining innovation performance. Int. J. Prod. Econ. 2018, 200, 1–14. [Google Scholar] [CrossRef]
  93. Miller, J.G.; Roth, A.V. A taxonomy of manufacturing strategies. Manag. Sci. 1994, 40, 285–304. [Google Scholar] [CrossRef] [Green Version]
  94. Cho, Y.S.; Jung, J.Y.; Linderman, K. The QM Evolution: Behavioral Quality Management as a Firm’s Strategic Resource. Int. J. Prod. Econ. 2017, 191, 233–249. [Google Scholar] [CrossRef]
  95. Podsakoff, P.M.; MacKenzie, S.B.; Lee, J.Y.; Podsakoff, N.P. Common method biases in behavioral research: A critical review of the literature and recommended remedies. J. Appl. Psychol. 2003, 88, 879–903. [Google Scholar] [CrossRef] [PubMed]
  96. Armstrong, J.S.; Overton, T.S. Estimating nonresponse bias in mail surveys. J. Mark. Res. 1977, 14, 396–402. [Google Scholar] [CrossRef] [Green Version]
  97. Akgün, A.E.; Ince, H.; Imamoglu, S.Z.; Keskin, H.; Kocoglu, İ. The mediator role of learning capability and business innovativeness between total quality management and financial performance. Int. J. Prod. Res. 2014, 52, 888–901. [Google Scholar] [CrossRef]
  98. Prajogo, D.; Mena, C.; Nair, A. The fit between supply chain strategies and practices: A contingency approach and comparative analysis. IEEE Trans. Eng. Manag. 2018, 65, 168–180. [Google Scholar] [CrossRef]
  99. Segars, A.H.; Grover, V. Strategic information systems planning success: An investigation of the construct and its measurement. MIS Q. 1998, 22, 139–163. [Google Scholar] [CrossRef]
  100. Byrne, B.M. Structural Equation Modeling with LISREL, PRELIS, and SIMPLIS: Basis Concepts, Application and Programming; Lawrence Erlbaum Associates Inc.: Mahwah, NJ, USA, 1998. [Google Scholar]
  101. Mulaik, S.A.; James, L.R.; Van Altine, J.; Bennett, N.; Lind, S.; Stilwell, C.D. Evaluation of goodness-of-fitness indices for structural equation models. Psychol. Bull. 1989, 105, 430–445. [Google Scholar] [CrossRef]
  102. Bentler, P.M.; Bonett, D.G. Significance tests and goodness of fit in the analysis of covariance structures. Psychol. Bull. 1980, 88, 588–606. [Google Scholar] [CrossRef]
  103. Bollen, K.A.; Long, J.S. Testing Structural Equation Models; Sage Publications: Thousand Oaks, CA, USA, 1993. [Google Scholar]
  104. Hair, J.F.; Black, W.C.; Babin, B.J.; Anderson, R.E. Multivariate Data Analysis, 7th ed.; Pearson: Upper Saddle River, NJ, USA, 2010. [Google Scholar]
  105. Cronbach, L.J. Coefficient alpha and the internal structure of tests. Psychometrika 1951, 16, 297–334. [Google Scholar] [CrossRef] [Green Version]
  106. Fornell, C.; Larcker, D.F. Evaluating structural equation models with unobservable variables and measurement error. J. Mark. Res. 1981, 18, 39–50. [Google Scholar] [CrossRef]
  107. Dubey, R.; Gunasekaran, A.; Ali, S.S. Exploring the relationship between leadership, operational practices, institutional pressures and environmental performance: A framework for green supply chain. Int. J. Prod. Econ. 2015, 160, 120–132. [Google Scholar] [CrossRef]
  108. Prajogo, D.I.; Sohal, A.S. The multidimensionality of TQM practices in determining quality and innovation performance-an empirical examination. Technovation 2004, 24, 443–453. [Google Scholar] [CrossRef]
  109. Hinkle, D.E.; Wiersma, W.; Jurs, S.G. Applied Statistics for the Behavioral Sciences, 5th ed.; Cengage Learning: Belmont, CA, USA, 2003. [Google Scholar]
  110. Scott, W.R.; Davis, G. Organizations and Organizing: Rational, Natural and Open System Perspectives; Pearson Prentice-Hall: Upper Saddle River, NJ, USA, 2007. [Google Scholar]
  111. Baldwin, W.L.; Scott, J.T. Market Structure and Technological Change; Psychology Press: London, UK, 1987. [Google Scholar]
  112. Fisher, R.J.; Price, L.L. An investigation into the social context of early adoption behavior. J. Consum. Res. 1992, 19, 477–486. [Google Scholar] [CrossRef]
  113. Porter, M.E. The five competitive forces that shape strategy. Harv. Bus. Rev. 2008, 86, 78–93. [Google Scholar] [PubMed]
  114. Aldieri, L.; Vinci, C. Green economy and sustainable development: The economic impact of innovation on employment. Sustainability 2018, 10, 3541. [Google Scholar] [CrossRef] [Green Version]
  115. Aldieri, L.; Makkonen, T.; Vinci, C.P. Spoils of innovation? Employment effects of R&D and knowledge spillovers in Finland. Econ. Innov. New Technol. 2019, 1–15. [Google Scholar] [CrossRef]
  116. OECD. Oslo Manual 2018: Guidelines for Collecting, Reporting and Using Data on Innovation, 4th ed.; OECD Publishing: Paris, France; Eurostat: Luxembourg, 2018. [Google Scholar]
Figure 1. Resource-based product and process innovation model.
Sustainability 12 00913 g001
Figure 2. Sample grouping.
Sustainability 12 00913 g002
Figure 3. Group means: (a) product innovation intensity; (b) process innovation intensity.
Sustainability 12 00913 g003
Figure 4. Territorial map for four group discriminant analysis (n = 257). Note: LPLK = low PBR and low KBR (Group 1); HPLK = high PBR and low KBR (Group 2); LPHK = low PBR and high KBR (Group 3); HPHK = high PBR and high KBR (Group 4).
Sustainability 12 00913 g004
Figure 5. Market dynamism and sources of competitive advantage.
Sustainability 12 00913 g005
Table 1. Comparison of market-based and resource-based perspectives.
Market-Based ViewResource-Based ViewSupporting Literature
Assumption on resourcesMobility and homogeneityImmobility and heterogeneity[15,42]
Strategic approachFit to market rulesChange market rules[10,13,14,36,41]
Source of competitive advantageThe power of a firm’s market positionThe power of a firm’s strategic resource[14,15,37,43,49]
Operating focusSuperior performanceSustainability[51,52,53]
Table 2. Test results of the model fit (n = 257).
Index(Threshold)Measurement Model
(CFA)
CMV Testing Model
(Single Factor)
Chi-square (X2) 816.5492109.014
The degree of Freedom (d.f.) 314324
X2/d.f.<3.00 b2.6006.509
Comparative fit index >0.90 c0.9380.781
Parsimony normed fit index>0.50 d0.8090.694
Tucker-Lewis coefficient indexClose to 1.00 e0.9310.762
RMSEA a<0.08 f0.079 (0.072~0.086) g0.147 (0.141~0.153)
a Root mean square error of approximation; b [99]; c [100]; d [101]; e [102]; f [103]; g RMSEA 90% confidence interval.
Table 3. CFA results (n = 257).
Factor and ItemsLoading aS.E. bt-ValueSig.AVE c
Product Innovation (Cronbach α = 0.945)
PdI10.8600.05119.412***0.774
PdI20.8560.05019.240***
PdI30.8880.04820.804***
PdI40.9120.04522.131***
PdI50.883
Process Innovation (Cronbach α = 0.946)
PcI10.8840.04821.409***0.814
PcI20.9210.04323.756***
PcI30.9070.04722.848***
PcI40.897
Product-Based Resource (Cronbach α = 0.959)
Pr10.9260.04422.999***0.795
Pr20.9140.04522.301***
Pr30.9020.04721.615***
Pr40.8610.04819.509***
Pr50.8650.04519.698***
Pr60.879
Knowledge-Based Resource (Cronbach α = 0.952)
Kr10.8710.05019.873***0.767
Kr20.8790.04920.280***
Kr30.9060.04921.686***
Kr40.8960.04821.125***
Kr50.8230.05317.775***
Kr60.878
Sustainable Competitive Advantage (Cronbach α = 0.934)
Sca10.8520.06615.727***0.702
Sca20.8680.06516.126***
Sca30.8660.06316.078***
Sca40.8420.06515.465***
Sca50.8010.06714.456***
Sca60.796
a Standardized coefficient; b Standard error; c Average variances extracted; S.E. and t-value were not estimated when loading set to fixed value (i.e., 1.0); *** p < 0.001.
Table 4. Inter-factors correlations matrix.
Factors1234567MeanS.D.
1Product innovation0.880 a 4.5531.651
2Process innovation0.823 **0.902 a 4.6351.638
3PBR0.800 **0.821 **0.892 a 4.4961.648
4KBR0.765 **0.824 **0.834 **0.876 a 4.8351.548
5SCA0.638 **0.669 **0.677 **0.780 **0.838 a 4.7171.248
(Control Variables)
6Firm age−0.092−0.134 *−0.102−0.128 *−0.016 3.9641.705
7Firm size0.160 *0.1120.201 **0.132 *0.128 *0.446 ** 4.4701.800
8Market dynamism0.588 **0.587 **0.660 **0.648 **0.607 **−0.154 *0.1184.7261.426
a Square root of AVE; ** Significant at the 0.01 level (2-tailed); * Significant at the 0.05 level (2-tailed); PBR = Property-based resources; KBR = Knowledge-based resources; SCA = Sustainable competitive advantage.
Table 5. ANOVA test results.
Variable Sum of Squaresd.f.Mean SquareFSig.
Product Innovation Between Groups342.8323114.27781.4410.000
Within Groups355.0082531.403
Total697.840256
Process Innovation Between Groups356.9883118.99691.2650.000
Within Groups329.8762531.304
Total686.864256
Table 6. Tukey’s HSD test results.
VariableGroupGroupMean DifferenceStd. ErrorSig.
Product innovation12−1.373 *0.3260.000
13−1.171 *0.2590.000
14−2.518 *0.1610.000
230.2010.3840.953
24−1.145 *0.3250.003
34−1.347 *0.2580.000
Process innovation12−1.504 *0.3150.000
13−1.824 *0.2500.000
14−2.548 *0.1550.000
23−0.3190.3700.823
24−1.044 *0.3140.006
34−0.724 *0.2480.020
* Significant at the 0.05 level.
Table 7. SEM test results.
PathDynamic Market
(n = 162)
Stable Market
(n = 94)
Beta at-Value bBetat-Value
Second-Order Factors (Latent Variables)
SCAProduct innovation0.1121.0490.5734.182
SCAProcess innovation0.6285.2810.1521.193
Process innovationPBR0.3473.7020.3713.486
Product innovationPBR0.6104.6750.3794.198
Process innovationKBR0.6206.2220.5094.629
Product innovationKBR0.2311.8330.5916.120
First-Order Factors (Measure Items)
pd5Product innovation0.846 0.873
pd1Product innovation0.84913.7250.83610.796
pd2Product innovation0.83413.3100.83710.841
pd3Product innovation0.87714.5140.86111.436
pd4Product innovation0.89214.9550.89312.313
pc3Process innovation0.88216.8420.92412.829
pc1Process innovation0.82214.4740.91212.473
pc2Process innovation0.89017.2260.94313.387
pc4Process innovation0.898 0.857
kr5KBR0.76311.5200.7729.140
pr2PBR0.87415.4970.96411.848
kr1KBR0.81312.7060.87411.295
pr6PBR0.869 0.800
pr3PBR0.88415.8810.8629.963
pr1PBR0.90016.4660.96711.907
kr6KBR0.838 0.851
kr2KBR0.83013.1310.90812.145
kr3KBR0.87914.4850.90712.122
kr4KBR0.86814.1640.87011.193
pr5PBR0.85614.8830.7337.967
pr4PBR0.86015.0060.7838.698
Market share growthSCA0.8409.9710.87310.818
Net profit marginSCA0.7789.2810.94912.578
Customer retentionSCA0.710 0.828
Customer satisfactionSCA0.7258.6670.8089.557
Return on assetsSCA0.7559.0160.90611.556
Sale growthSCA0.7298.7150.97113.155
a Standardized factor loading; b Not estimated when loading set to fixed value (i.e., 1.0); SCA = sustainable competitive advantage; KBR = knowledge-based resources; PBR = property-based resources.

