Article

Noise as a Factor of Green Areas Soundscape Creation

by
Małgorzata Sztubecka
1,*,
Marta Skiba
2,
Maria Mrówczyńska
2 and
Michael Mathias
3
1
Faculty of Civil and Environmental Engineering and Architecture, UTP University of Science and Technology, Al. Prof. S. Kaliskiego 7, 85-796 Bydgoszcz, Poland
2
Faculty of Civil Engineering, Architecture and Environmental Engineering, University of Zielona Góra, ul. Prof. Z. Szafrana 1, 65-516 Zielona Góra, Poland
3
Faculty of Engineering, Universidade da Beira Interior, Convento de Sto. António, 6201-001 Covilhã, Portugal
*
Author to whom correspondence should be addressed.
Sustainability 2020, 12(3), 999; https://doi.org/10.3390/su12030999
Submission received: 18 December 2019 / Revised: 24 January 2020 / Accepted: 27 January 2020 / Published: 30 January 2020

Abstract

:
The article’s research subject concerns soundscape acoustic perception and human perception. The article aims to support decision-making processes, based on the subjective assessment of green areas by visitors, allowing modeling of planning strategies in urban green areas. This would allow creating a friendly soundscape and managing it sustainably. The need to create a musical landscape can contribute to finding a new function and attractive form for the studied areas now and in the future. Research carried out for selected city parks in Bydgoszcz (Poland) took into consideration people’s responses in assessing the soundscape. Surveys conducted in selected parks provided information on noise sources and how consumers perceive noise during their stay in the park. A question about feeling described the reception of sound sources’ intensity by respondents (level of feeling: low, medium, high, and very high). The completed studies allow to “translate” subjective sound level responses to the numerical values of the correlation using fuzzy cognitive maps. The implemented scenarios show the possibility of using tools supporting the decision-making process in urban planning, taking into account existing acoustic conditions.

Graphical Abstract

1. Introduction

1.1. Background

Problems related to excessive noise in urban areas are becoming more and more common. Continuous exposure to high-level noise can lead to health and psychological problems that directly threaten public health and well-being [1,2].
Noise is considered as any unwanted, unpleasant, annoying, bothersome, or harmful sounds of excessive intensity (measured in decibels) that affect the hearing organ, other senses, and other parts of the body or the whole body [2]. The acoustic signal’s reception depends on the receiving system’s vulnerability and is as individual as each visitor feature (depending on the state of health, age, genetic predisposition, and exposure factors). Many authors pay attention to the health effects of exposure to excessive noise. The physical impact of an acoustic wave, vibration, and resonance can lead to hearing impairment, neuroendocrine and neurophysiological disorders, and inflammatory reactions [3,4,5]. Basner et al. [4] indicate that noise is a more and more frequent disturbance in the workspace, and there are also threats related to social noise, leading not only to hearing loss but also to employee efficiency reduction and reduction of cognitive ability in children. Additionally, Lercher et al. [5], conducting research related to the noise impact on children, pointed out the negative noise impact on the development of reading skills by children exposed to chronic noise. Sygna et al. [6] conducted studies related to the impact of road noise on mental health and sleep quality of people exposed to it, showing that there is a significant relationship between noise exposure and the level of symptoms indicative of mental disorders.
Sustainable space management in terms of sound distribution affects the comfort of users. Lack of environmental care can lead to a decrease in the attractiveness of the environment and constitute an obstacle to the development of a human-friendly environment. Various approaches and tools are used for creating a pleasant soundscape.
These can be divided into three groups:
  • Objective methods: obtaining information about the soundscape from the analysis of physical parameters or spectrograms;
  • Subjective methods: information about the soundscape is obtained based on questionnaires or interviews, as well as through on-site observation and assessment;
  • Mixed methods: a combination of objective and subjective soundscape analysis techniques [7] (in his article, Bernat [7] developed a form of map visualization—a mapping of reality—expressed in the conventional graphic characters language).
An assessment of the soundscape quality is carried out based on observations and recordings (soundtracks), subjective methods (a semantic difference test, a sound preference test, a mental map, a questionnaire, interviews), and real ones—acoustic measurements. It provides a basis for an acoustic design that should ensure the creation of a human-friendly acoustic climate. It is essential, as noted in [8,9,10], to indicate an effective procedure that allows for aggregation of results obtained from various sources, to specify risk in the subjective perception of external stimuli, and to determine the intention to introduce changes and to make environmentally positive pro-ecological decisions.

1.2. Environmental Noise Policy

The acoustic design process should include site identification and context recognition, setting acoustic goals, defining “desirable” and “undesirable” sounds, and defining criteria for future management and design of the environment. Studies show that street-level noise is one of the primary sources of noise in urban space. It includes various means of transport, human activities, and ambient sounds, as well as sounds of nature [9,10].
Protection against noise and vibration is included in regulations and action programs in the field of environmental protection and development. The current acoustic requirements are formulated as mandatory limit values [11,12,13,14]. The authors of [15] describe a common framework for noise assessment methods as required by the European Union (EU) directives - the assessment and management of environmental noise [16]. The methods presented in the document recommend a harmonized and consistent approach to noise assessment from various sources, which are primarily: road traffic, rail traffic, air traffic, and industry. All EU work and the methods and indications contained in its documents regarding limit values are intended to broaden public knowledge about excessive noise levels [17]. It is essential to set limit values because exposure to traffic noise hurts health and well-being, also in a cultural context—it relates to the global burden of diseases caused by noise [11]. Roswall et al. [12] conducted a study of long-term noise generated by traffic in Denmark. They showed that excessive noise, together with environmental pollution, creates a high risk of heart attacks. However, in [13], they confirmed the relationship between diabetes incidence and noise caused by traffic.
Interestingly, they did not find such a relationship concerning the noise generated by the railway. Licitra et al. [14] also dealt with the impact of rail noise on the health of residents of Pisa (Italy). Their research showed that railway noise is repeatedly enhanced in the subjective feelings of exposed people if vibrations accompany it. Bunn et al. [18] addressed the railway in Brazil, and noticed that this type of noise pollution in urban areas could be reduced by a maximum of 12 dB by introducing noise control (construction of acoustic barriers, deactivation of the horn). Such activities are particularly important in the vicinity of noise-sensitive facilities (e.g., hospitals, schools, kindergartens).
For industrial noise sources, the requirements are stricter than for road or rail noise. This differentiation results from subjective assessment—industrial noise is perceived as more onerous than railway noise with the same level [15,17,18,19,20]. Morel et al. [17], when researching noise, found that the perceived noise caused by traffic is increasing when it is heard in the constant presence of industrial noise. In [20], a method of measuring noise generated by wind turbines was proposed, without switching off the wind farm. As noted, background noise and source noise are associated with wind speed. Whereas Flores et al. [19], who deal with the problem of aviation noise in urban areas, emphasize that the propagation of noise in urban space is affected by its morphology. According to researchers, elevation position and U-shaped buildings and streets are particularly crucial for the propagation of aviation noise in urban areas.
Formal and legal tools used in noise management can be replaced or supplemented with economic tools. The use of this type of mechanism is part of the sustainable development concept. Acoustic maps are a graphic presentation of measurements of equivalent sound levels. They show areas threatened with excessive noise can be determined. That is an objective approach, and on this basis, space is analyzed and protective measures are taken.

1.3. Noise Perception

However, subjective assessment is rarely taken into account in noise studies. Often, the results of surveys differ from the conclusions made based on sound level measurements. Przysucha et al. [21] analyzed four years of noise monitoring of Gdansk from measuring stations located in the vicinity of various environmental noise sources. They concluded that in environmental noise measurements, most distributions of noise indicators could be described by mixtures of two normal distributions. For long-term noise indicators determined based on a small sample, alternative methods should be used, such as the distribution propagation method or interval arithmetic. Gozalo et al. [22] have shown that noise is a statistically significant factor that should be taken into account when designing green areas. He described three basic approaches to studying the acoustic environment and its impact on people’s daily lives, psychology, and health. The first (“physical”) approach aims to objectively assess the acoustic environment and compare it with specific sound level reference values (the approach to noise mapping and the basis of many international regulations and guidelines). The second (“psychophysical”) approach is to examine the relationship between the sound environment and human feelings. It assesses the relationship between physical quantities associated with sound and human responses (the objective variable of “sound level” in terms of “exasperation,” “unpleasantness,” and “interference”). That is done in order to enable the characterization of aspects that negatively affect people’s physical and mental well-being. In the third (“perceptive”) approach, the sound landscape is treated primarily as a source of information and an element of mutual relations between people and their surroundings. This article presents a method enabling the use of a fuzzy cognitive map, in which relationships between “mental soundscape” occurrences can be presented, which in turn can be used to calculate the "impact strength" of these events. Rice at al. [23] investigated the effectiveness of protected areas in preserving soundscapes and management strategies to ensure continuous protection of natural sounds in the park’s surroundings. Kogan at al. [24] defined the Green Soundscape Index (GSI) as a dynamic and complex multidimensional environmental system, which is defined as the ratio of the perceived natural sounds’ range to street noise.
Acoustic space shaping is based on forming acoustic conditions so that sound stimuli do not exceed the permissible values and are optimal for human health needs. They should guarantee the creation of favorable operating conditions and the preservation of so-called acoustic comfort.
The soundscape is defined as the full range of sounds experienced in a given landscape at a given time, and the way in which people respond to these acoustic signals. Unlike environmental noise studies, soundscape studies are designed to gather information about the environment (e.g., sound sources identification, development, spatial arrangement—alleys and their surface, surroundings) and about the subjective perception of sounds that are components of this environment. Studies based on measurements of equivalent sound levels in correlation with feelings can be found in various articles [25,26,27,28,29].
Cassina at al. [26] proposed a linear model that predicts the tranquility seen in different environments based on their visual and acoustic characteristics. The model identifies areas that would have a higher tranquility value than a fixed threshold value and would, therefore, be seen as quiet. The model can be used as a tool supporting cost-benefit analysis to identify the best compromise between noise reduction and urban regeneration, referring to the peace felt by users. Kaymaz [28] described how visual perception affects the perception of the acoustic environment and how the assessment of the sound landscape depends on the assessment of a specific place.
Aletta et al. [30] described that the key to implementing a landscape approach in urban planning and design is choosing the right soundscape descriptor and identifying it—most available soundscape descriptors are perceived as a valid impression. Yang and Moon [31] examined the acoustic properties of water sounds in order to improve the perception of street noise and demonstrated that the sound of water affected not only acoustic perception, but also thermal comfort and the overall comfort of the room environment. A detectable level of water volume was preferred, limiting street noise in the room. Another study conducted by Meng at al. [32] using the method with dynamic results examined the impact of sound perception in an urban environment on facial expressions, measured using software called FaceReader, based on recognizing facial expressions. It can be concluded from this study that traffic noise caused mimic changes twice as fast as natural sound.
Studies on the subjective perception of sounds are essential for spatial planning. Getting to know the opinions of visitors can help in the proper management of space, especially in cities. Hence the aim of the paper: knowing the sources of noise in city parks, based on the subjective assessment of visitors and objective factors (measurements)—their comparison allows the proper development and sustainable management of these areas.

1.4. Soundscape Management

The problem of making decisions in spatial planning can be solved with a full availability of information or with varying degrees of uncertainty. In most cases, in uncertain situations, when monitoring the effects of decisions and actions taken, fuzzy techniques can be used—in particular a method based on fuzzy relational, cognitive maps [33]. This method is a soft calculation method for modeling human knowledge, allowing the aggregation of knowledge from various sources and taking into account many stakeholders. Therefore, it can support the decision-making process and affect the achievement of optimal results of the conducted spatial policy in the field of sustainable socio-economic development [34]. Methods based on fuzzy cognitive maps are used to control and plan the optimal work of engineering structures [35], to design transfer and financial systems [36], design intelligent solutions to reduce energy consumption in buildings [36], or to optimize urban policy development [37]. As emphasized [37,38], Fuzzy Cognitive Maps (FCM) are a method well adapted to solving problems related to sustainable urban development. These problems are uncertain, and the information is usually incomplete and confusing to model and does not lead directly to the optimal solution. Decision support using fuzzy methods is also successfully used in urban policy related to urban regeneration [39]. This solution allows the local community to be involved, increase its awareness, and take into account its expectations. It can be seen that the blurred contribution to the decision system and planning processes drives sustainable urban regeneration and can be used to transform urban green areas (parks).
One of the more frequently used diagnostic tools that allow describing the situation of exposure to noise is noise maps. They have two primary disadvantages: the indicators are used to take into account only one acoustic factor and are not able to indicate connections between the factors. In this context, the approach using fuzzy cognitive maps presented in the article fills the gap in the knowledge of decision support systems used in spatial planning, also carried out in parks, taking into account the noise felt by users of the space. The approach used is innovative because the fuzzy assessment method is used in spatial planning and decision support in green areas. That is particularly important because park users can only express their feelings related to noise in a fuzzy manner. At the same time, the feelings described by users are subjective, which makes it difficult to express them on a numerical scale. The use of fuzzy cognitive maps allows building a mathematical and IT model that can project systemic factors and cause-and-effect implementations between them, taking into account interactions and changes like relationships [33]. The proposed approach aims to support decision-making processes and to better order environmental problems related to noise in the context of future activities allowing modeling of planning strategies and development of green areas in urban areas.

2. Materials and Methods
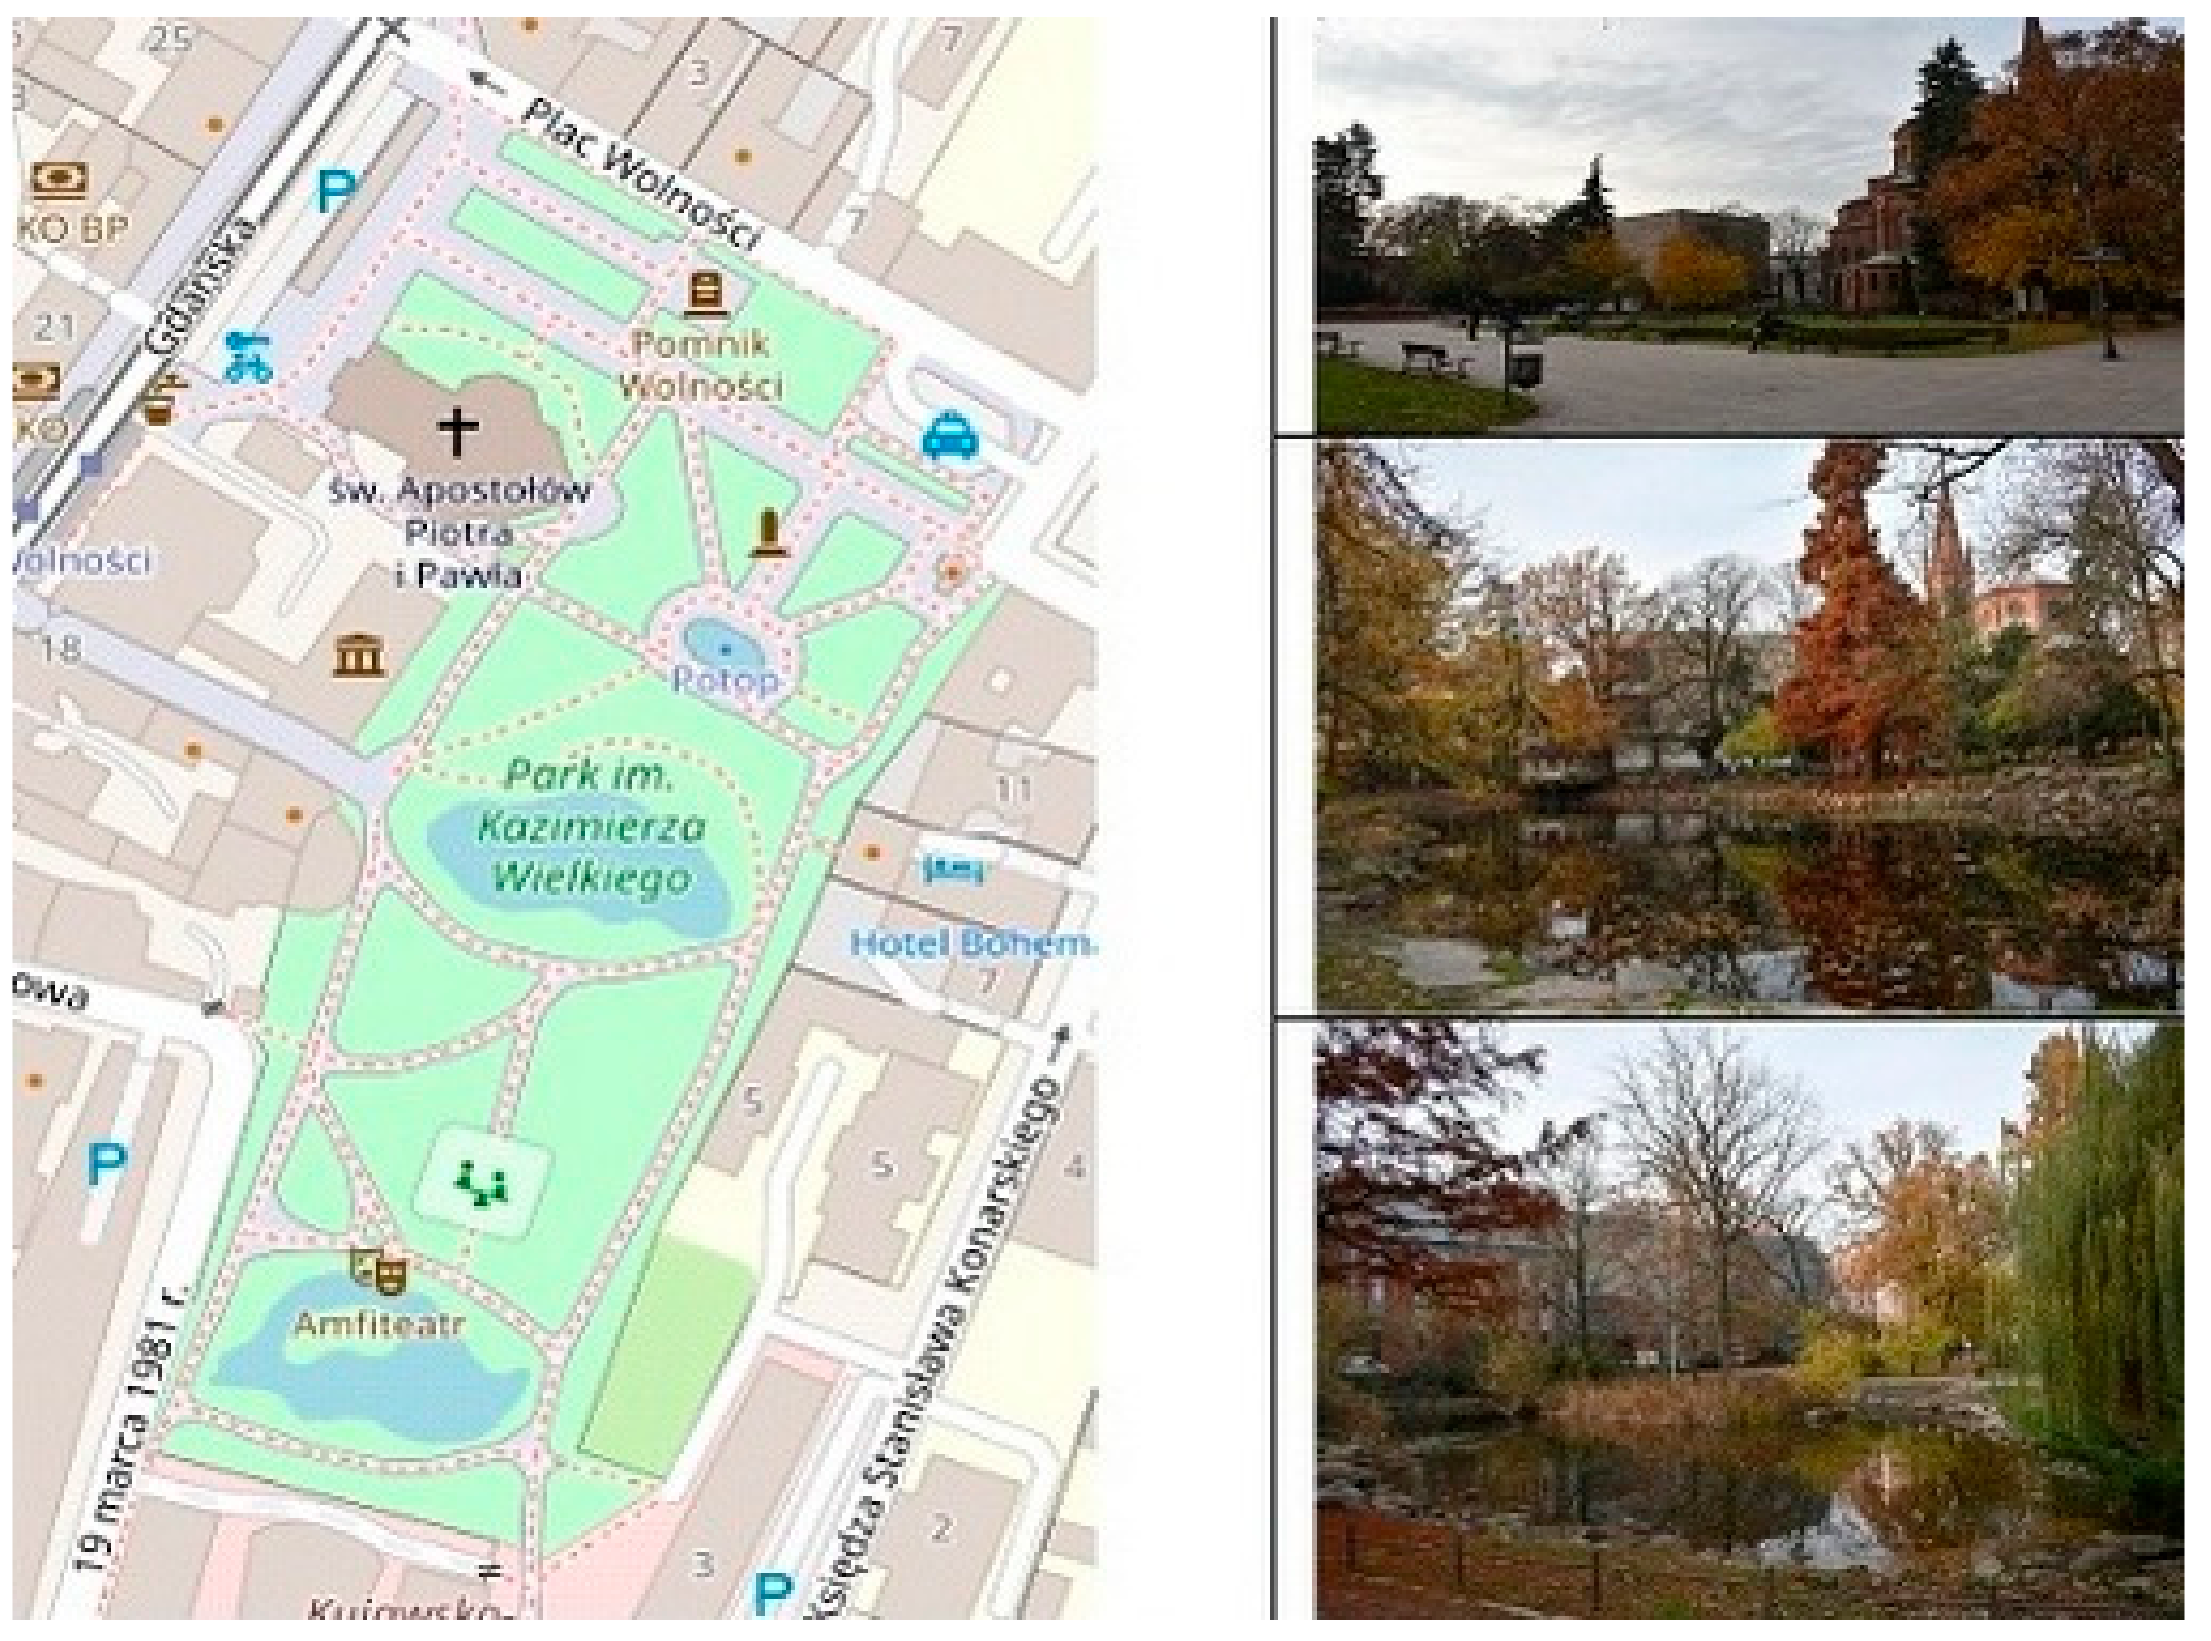
2.1. Materials

Three parks located in the center of Bydgoszcz were selected to assess the soundscape:
  • The Kazimierz Wielki Park (area: 2.24 ha);
  • The Jan Kochanowski Park (area 3.15 ha);
  • The Wincenty Witos Folks Park (area 6.42 ha) (Figure 1).
The first park was created in the 17th century. That is the oldest park in Bydgoszcz. Initially, the park was a part of the Sisters of St. Clare garden. In 1835, the authorities transformed the park into the Regierungs Garten belonging to the Regency headquarters. In the years 1900–1901, the park was made available to residents. In 1945 the park was named in honor of King Kazimierz Wielki (Figure 2).
The sound space in the Kazimierz Wielki Park is primarily influenced by traffic (especially by trams), people (conversations, sounds from the playground), sounds from the nearby church and high school (bell), and natural sounds (fountain, leaf noise). The material of the pavement’s surface is concrete (cobblestone) and stone. Based on the noise map of Bydgoszcz, noise penetration into the park can be noticed only from the north. It is related to the tram traffic on Gdańska Street. The noise level is 55–60 dB—the permissible level for this type of area is 65 dB—therefore there is no exceeding of the permissible standards. The park is surrounded by old brick buildings—tenements that affect the penetration and distribution of noise in the park. Another park, the Jan Kochanowski Park (Figure 3), set up in 1901, is an example of the English style by Konrad Neuman. The park is located in a "music district" of Bydgoszcz, and the concrete pavement (cobblestone) alleys system has a rounded shape.
The following sound sources characterize Jan Kochanowski Park: traffic (cars), people (conversations, sounds from the playground), sounds from the nearby music school, and natural sounds (fountain "Light–Sound", leaf noise). The acoustic map analysis shows penetration of road noise into the park from the northeast and east at a level of 55–65 dB—the limit of the permissible level. Buildings surround the park from the southwest. Further on, the park is bordered by streets with average traffic (about 3000/day) and bus traffic (about 180/day).
The Wincenty Witos Folk Park was founded on the site of an Evangelical United Commune cemetery around 1952. The cemetery, established in 1778, was the oldest and most significant in the city. In 1927, the Polish authorities took the initiative to close the cemetery, which was executed in 1945. Works on closing the cemetery lasted from 1951 to 1952, and following these a city park was created over the area (Figure 4).
Wincenty Witos Folk Park is an area bordering busy streets from the northeast and southwest, with high traffic and public transport (about 13,000 vehicles per day). The noise penetration into the park from the street side is significant (the sound level reaches 70 dB) and covers the whole area. Sound sources in addition to traffic noise are people (conversations, sounds from the playground), a tennis court, and natural sounds (leaf noise). The selected parks have similar features—location, function, and many social activities, as well as landscapes. The differences include their sizes and surroundings: historic buildings, a neighborhood of main streets. A fuzzy cognitive map is an interesting way of representing the relationships between structure and the system’s behavior that comprise this structure itself. The crucial elements of a cognitive map include:
  • Several vertices;
  • Several arches, edges, and loops;
  • Line density—thickness of connections between vertices;
  • The average value of connections (Figure 5).
In the FCM data analysis, methods are based on graph theory. The maps develop intuitively, offering a mapping of the cognitive model of components based on information from both individuals and experts [41].
The park area was assessed using the results of questionnaires and a tool for Fuzzy Cognitive Maps (FCM) generation—Mental Modeler—based on the data from an acoustic map and surveys.
The equivalent sound level measurements were made during the summer season both on workdays and holidays. The acoustic data were collected using an approved sampling technique. In this technique, the total duration of the measurement was part of the reference time range, which was selected to take into account the variability of noise emissions and the intensity of movement of people visiting the park. The measuring stands were located on the park borders. The noise measurements were carried out under conditions not exceeding the following limits:
  • Temperatures from –10 to 40 °C;
  • Humidity from 25% to 98%;
  • Average wind speed of up to 5 m/s;
  • Atmospheric pressure from 940 to 1060 hPa [42].
The received noise values are only referenced values for comparative analyses with the survey results. Surveys were carried out at the same time (parallel with measurement) on a group of 50 people visiting the park (also in the summer season).

2.2. Methods

2.2.1. Surveys: Sounding

Surveys provide information about the subjective perception of heard sounds. Based on sound level measurements in a given area, it is possible to determine possible exceedances of this level with the values contained in the standards. However, if such exceedances are not found, there are no grounds for any protective measures in the studied area. Since the parks are places of rest and recreation, and the visitors can feel the harmful noise occurring there, it becomes expedient to conduct appropriate surveys on this subject. This study should be aimed at finding the answer to the question to what extent noises not included in the standards, but occurring in the park, affect the park’s acoustic climate, and if visitors perceive them as disturbing or insignificant. The main surveys questions concerned:
  • The type of sound sources felt—the respondents chose from the following types of noise: cars, trams, buses, adults, children, fountain, leaf noise, and other (mention which ones);
  • The level of felt noise—low, medium, high, and very high.
The respondents’ particulars contained information on the sex (male, female), age (4 ranges: under 25 years; 25–45 years; 46–65 years; and over 65 years), place of residence (city, village). The survey had an anonymous clause and information about the purpose of the tests. These sources were grouped into four classes, and the results were collected and summarized.

2.2.2. Surveys: Fuzzy Analysis

Emotional states and cognitive (perceptual) functions are closely related and are two inseparable elements of the functioning of the human body. The impact of emotions increases gradually as the connection between cognitive mechanisms and emotional states arise. Based on correlation studies, it is known that the most critical dimensions in the emotional assessment of perception are arousal and pleasure, and affective significance is usually revealed in the use of emotional terms for individual elements of the environment by people [30]. Perez-Martinez and Torija [43] confirmed in their article the hypothesis of the study that regardless of the complexity of sound sources that make up a given acoustic environment, the perceived quality of the soundscape is driven primarily by the subjective assessment of dominant sounds.
To examine the impact of individual audiovisual information sources on the overall satisfaction of urban space in humans and reveal significant audio and visual interactions, Jeon and Jo [44] subjectively assessed several factors, including perceived audiovisual elements, audiovisual semantic attributes, and satisfaction.
The research development on place learning has contributed to the definition of the cognitive map as a perceptual representation of space, arising based on environmental indicators and expectations that are the basis of learning ways and achieving goals. Indeed, all cognitive maps contain errors because most people are not experts in drawing/creating them. So the reflection of reality is neither precise nor too simple. Most of the environment maps are incomplete, most often familiar elements are shown, and the abandoned objects never go unnoticed or are not part of the learning process. Shapes and proportions are deformed. Maps are also often enriched by elements resulting from subjective experience. Therefore, in this study, a Fuzzy Cognitive Map (FCM) was used, which is a mental model represented by a two-way graph of nodes (variables or concepts) and connections between nodes, where the strength of the connection indicates the perception of the impact of two concepts by interested parties [45].
Fuzzy Cognitive Maps (FCM) are a sophisticated form of data collection. They can be a way to assess the qualitative perception of noise/sounds. Fuzzy cognitive maps are used to study the structure and behavior of complex systems and interactions between concepts. They are often the basis for starting the initial stages of integrated assessment, e.g., complex environmental problems, as described by Vasslides and Jensen [46]. For the analysis of data contained in FCM, methods based on graph analysis are used, and the structure of a single FCM can be presented as a square adjacency matrix. The FCM transforms into an adhesion matrix that represents all concepts presented in the conceptual model. The advantage of the used approach is the ability to change the matrix based on changes introduced by experts in the cognitive map.
The use of FCM has a wide range. In [47], the possibility of using the method to assess factors influencing the perception of nuisance caused by mining exploitation is shown. The authors used an expert group that developed a model for the impact of mining on society and the landscape. Researches [48,49] and [50] presented the concept of the FCM network for modeling ecological systems, functions, and services, also combining the opinions of various experts. Skiba [51] presented a similar approach in applying to urban planning. A decision support system based on fuzzy logic was created for planning construction investments and is presented in [51]. Consequently, the assessment of the quality of the soundscape seems to be the assessment where the application of FCM-based modeling, i.e., techniques for human imaging interaction with the environment in socio-ecological systems, seems most suitable [41,51]. This article uses the fuzzy logic model design and prediction tool—the Mental Modeler. The software used allows integrating various types of knowledge from different stakeholders to make decisions and to create and test solution scenarios to determine the results of the proposed solutions [41]. Cognitive mapping is a proven method of studying individual cognition. It is a theoretical graphic representation and analysis technique that has been used to study decisions, organizational cognition, and strategy. Often, cognitive maps can connect with many types of relationships, but “factor maps” are most commonly used because they represent causal relationships between concepts in various converted data. In this case, Mental Modeler was used to analyze users’ feelings, decisions, and environmental behavior in park areas. The Mental Modeler consists of three primary user interfaces. A concept-mapping interface provides space for model building and parameterizes the model structure in the format required for FCM analysis. A matrix interface explains the structural properties of the cognitive map. A scenario interface allows stakeholders to run and compare system changes under various potential scenarios and allows the re-reviewing and validating models in the concept-mapping interface in the view of new information [41].

3. Results

For the analyzed parks, the sound sources are grouped into four groups. The traffic connects the sounds of cars, buses, and trams, and the human factor is the sounds of adults and children; nature is the sound of leaves and the sound of water (fountain) and others (e.g., activities in the park). The structure of responses is collected and summarized in Table 1. It shows the general tendency to feel sounds occurring in a given park.
Figure 6 presents a structural graph of sound perception in selected city parks based on the mean values of the subjective reception of sounds (Table 1).
Because those three parks are comparable and display similar features that shape the soundscape, an aggregated cognitive map based on the survey could be produced. Uncertain causal knowledge is stored in a fuzzy map mark, where the nodes represent variable phenomena, transforming weighted and summed input data into numerical data, analogous to the artificial neuron model (Table 2 and Figure 7).
Scenarios were made for the resulting cognitive maps. Interactions between the factors are presented as negative or positive graphs with variable values. The concepts in FCM are equivalent to neurons and are nonlinear functions that transform activated pathways ("causes") into values in the set [–1.1]. A correct solution for conflicting and no-conflicting interests is to create scenarios presenting the possible effects for various options (even opposite) as support for spatial decisions. Scenarios are a useful tool for assessing the potential consequences of selections [41,45,49]. The bar diagram indicates how components can react in a given scenario.
In building the scenarios, factors influencing the spread of noise in park areas were taken into account. The first scenario shows the changes resulting from the reduction of the communication factor—car, tram, and bus (Figure 8).
Emphasizing the reduction of the traffic factor in the management of urban park space, the effect of noise protection factors—greenery—is strengthened. The attractiveness of the neighborhood—the areas around the parks—is also increasing. And finally, the noise level decreased.
The second scenario (Figure 9) concerns the analysis related to the reduction of the greenery factor.
This situation caused a significant increase in the communication factor. The attractiveness of the park decreased and it affected the neighborhood. The third-factor analysis concerned the strengthening of greenery (Figure 10).
Strengthening the greenery component meant that the impact of traffic significantly decreased. However, the value of the neighborhood increased. An area without excessive noise gains value. Subsequently, other scenarios can be performed, highlighting one or more components. On this basis, planning decisions can be made to improve the quality of the studied areas.

4. Discussion

The shaping of the environment in terms of acoustics is based on forming such acoustic conditions that are optimal for the needs of human health and activity. The methods of combating noise can be divided into administrative–organizational–legal and technical. The former is based on relevant normative acts, and the latter is based on the use of measures to reduce excessive noise (for example, shielding). Proper space modeling can be considered an indispensable component of good management. Environment perception is different than the perception of an individual element as:
  • Elements of the environment are diverse and complex—perception takes time;
  • The size of the environment—a larger system means a more complex system;
  • The environment as a surrounding—perception from the inside;
  • The visitors should have navigational skills in the perception of the environment;
  • Human contact with the environment takes place for a specific aim—spatial information related to the visitor’s aim is selected [52,53].
  • Environmental audience and visual responses can generally be classified as:
  • Cognitive (related to knowledge and understanding);
  • Emotional (related to feelings, attitudes, and emotions);
  • Behavioral (associated with changes in a viewer’s behavior);
  • Physiological (biological or physical effects on the observer’s body) [23,34].
  • Studies [54,55] have shown that landscape features that affect sound perception are:
  • Landform;
  • Vegetation;
  • Proximity to the sound source.
Authors [1,25,26,54,55,56,57,58] have shown that the foreground and background sounds affect the perception of the environment differently. It is the background noise that correlates with space perception. It has also been shown that in the urban environment, sounds’ multitude influences the perception of sounds—if there are a lot, it seems to the users that it is quieter [25], especially in the recreational and leisure areas in the summer season.
Figure 11 below characterizes sound space well in relation to urban and rural areas, in correlation with sound frequency, surroundings, and the human factor.
Emissions of high-frequency noise and accumulation of anthropogenic sources are observed in the urban environment, while they decreasing outside the city and in the natural environment. Additionally, attention should be paid to sound events that disappear in cities and are imperceptible (the sound accumulation of different sound sources), while in the natural environment they are an essential factor in the perception of the soundscape. The subjective feeling and sensitivity of a person to noise depends on their physiological predispositions and the characteristics of the sound. Certain sounds can both create a pleasant or a nuisance experience. That is due to the individual characteristics of each person, such as age, health, mood and sensitivity, and mental resilience. Additionally, the annoyance caused by the noise increases if a sound appears unexpectedly and from an unknown source. A sound is perceived differently by its producer and differently by its visitor. Introducing natural sounds into the sound landscape (e.g., water noise, birdsong) to mask urban sounds can significantly improve their acoustic comfort. This approach should be an essential strategy for designing green areas in urban areas to improve the well-being of those residing there [60,61,62,63]. Also, the authors [64,65] indicate that landscape architects should, in their design work, take into account such aspects as the acoustic properties of materials, the possibility of masking, or introducing elements of small architecture with the functions of "white noise." As was emphasized in [64,65,66], the reduction of noise level only using legal regulations does not always have the expected economic and environmental effect. Therefore, it is imperative that the acoustic environment, especially in urban parks, is properly analyzed [64,65,66,67]. In the analysis of Bydgoszcz parks, it is noteworthy that a human factor appears in the sound perception (visitors disturb other visitors). Each park has a separate playground area. In each of the parks, the respondents noticed the children making noise, and while in smaller parks (Kazimierz Wielki and Jan Kochanowski), it was the leading source of noise, in the Wincenty Witos Folk Park this feature was also noted. In this case, further analysis of surveys based on information on the age of visitors seems to be necessary. Traffic is the leading factor in each of the surveys. It should be remembered, however, that the information obtained from surveys is descriptive, “fuzzy” information. Therefore, the use of the fuzzy cognitive map tool is justified and provides information about the dependencies between perception and measurements. A scenario can be built based on the aggregated models. In the case of the scenario for small parks, it can be seen that the amplification of natural sound factors mostly affects the sound space by its sonic strengthening. However, these are the sounds that cause the so-called “white noise”, which is desirable for the health of visitors. In the second scenario, for a more extensive, popular folk park, the strengthening of nature’s sounds weakens other sound-forming factors. Therefore, in a larger area, sounds from natural sources have a more significant impact on soundscape shaping. The analysis using the FCM tool is practical and can be helpful in discussions on improving the acoustic climate of city parks.

5. Conclusions

Functional zones of the city correspond to various zones of activity of residents. Each of them has different sources, and noise levels are perceived differently in each of them. Parks, as one of the essential components of the natural and cultural environment, are areas of particular importance for satisfying the needs of residents and improving their quality of life. They favor social contacts due to their location and functional and spatial features.
The perception of the sound quality accompanying various phenomena and their characteristics (pitch, tone, intensity, consonance) leads to a sharper perception of the outer world. City parks, despite the concentration of a large number of sound stimuli in their areas, are treated by visitors as a kind of “rest oasis.” This study draws attention to the relationship between the types of sounds and their perception. The relationships between the individual components (communication sounds, human factor, natural factor, and others) were analyzed and visualized using fuzzy cognitive maps. The resulting scenarios provide the basis for effective management of these areas. Space management processes based on people’s preferences give a complete view of the perceived environment. Understanding the sources of noise in an existing park can result in relevant entries in spatial plans. In small parks it is more difficult to separate the quieter areas from the louder ones, but in larger parks it is possible to separate them.
Fuzzy Cognitive Maps (FCM) allow us to study the role and meaning of concepts in the general public’s perception of a soundscape employing dynamic simulations and thus to highlight the factors that cause differences in perception. The construction of scenarios presenting the possible effects for various options (even opposing) as support for spatial decisions seems to be an excellent solution to conflicting interests in the participation process. Understanding the soundscape shaping process means the possibility of using public participation in its planning process. Scenarios are a useful tool for assessing the consequences of potential choices. The soundscape is treated as a multidimensional whole based on a complex interaction between the sound source, the environment, and humans. Complex relationships between objective and subjective quantities (correlation of sound sources with the environment and with the subjective assessment) can take place through a semantic differential test (questionnaire) or psychoacoustic indicators and statistical analysis and cluster analysis. A logistic regression model is also used to study the relationship between objective acoustic indicators and subjective descriptions of the urban soundscape. By using FCM to aggregate subjective noise assessments, this work provides an alternative approach to evaluating the urban acoustic environment [22,68,69,70].
Information about sound level values concerning visitors’ feelings can effectively support spatial development plans so that the local community accepts them. Quoting D.W. Meining: “… space consists not only of what our eyes see but also of what fits our head”. In the case of a soundscape, an auditory impression should also be added to this statement. The claim that noise creates a soundscape is valid, but this creation is primarily associated with its subjective perception. If the park’s architecture is to create an acoustically friendly space, that perception should be investigated and interpreted.
The widely used methodology, classification, and qualitative assessment of the soundscape according to quantitative criteria, seem to be a simplification because they omit the entire sphere of interactions and connections between man and the landscape. Trying to keep up with new perception theories and methods of information development, a method of objectifying perceptual impressions can be found in the form of easily applied cognitive FCM maps. This approach enabling the creation of alternative and predictive scenarios for supporting spatial decisions may prove to be a right and forward-looking approach.

Author Contributions

Conceptualization, M.S. (Małgorzata Sztubecka) and M.S. (Marta Skiba); methodology, M.S. (Małgorzata Sztubecka), and M.S. (Marta Skiba); validation, M.M. (Maria Mrówczyńska) and M.M. (Michael Mathias); formal analysis, M.S. (Marta Skiba) and M.M. (Maria Mrówczyńska); investigation, M.S. (Małgorzata Sztubecka) and M.S. (Marta Skiba); writing—original draft preparation, M.S. (Małgorzata Sztubecka), M.S. (Marta Skiba), M.M. (Maria Mrówczyńska) and M.M. (Michael Mathias); writing—review and editing, M.S. (Małgorzata Sztubecka), M.S. (Marta Skiba), M.M. (Maria Mrówczyńska) and M.M. (Michael Mathias); funding acquisition, M.S. (Małgorzata Sztubecka), M.M. (Michael Mathias). All authors have read and agreed to the published version of the manuscript.

Funding

This article/material has been supported by the Polish National Agency for Academic Exchange under Grant No. PPI/APM/2019/1/00003.

Conflicts of Interest

The authors declare no conflict of interest.

References

  1. Radicchi, A.; Vida, J. Soundscape evaluation of urban social spaces. A comparative study: Berlin-Granada. J. Acoust. Soc. Am. 2018, 144, 1660. [Google Scholar] [CrossRef]
  2. Mrówczyńska, M.; Sztubecka, M.; Skiba, M.; Bazan-Krzywoszańska, A.; Bejga, P. The Use of Artificial Intelligence as a Tool Supporting Sustainable Development Local Policy. Sustainability 2019, 17, 4199. [Google Scholar] [CrossRef] [Green Version]
  3. Engel, Z. Environmental Protection against Vibration and Noise; Wydawnictwo Naukowe PWN: Warsaw, Poland, 2001. [Google Scholar]
  4. Basner, M.; Babisch, W.; Davis, A.; Brink, M.; Clark, C.; Janssen, S.; Stansfeld, S. Auditory and non-auditory effects of noise on health. Lancet 2014, 383, 1325–1332. [Google Scholar] [CrossRef] [Green Version]
  5. Lercher, P.; Evans, G.W.; Meis, M. Ambient noise and cognitive processes among primary schoolchildren. Environ. Behav. 2003, 35, 725–735. [Google Scholar] [CrossRef]
  6. Sygna, K.; Aasvang, G.M.; Aamodt, G.; Oftedal, B.; Krog, N.H. Road traffic noise, sleep and mental health. Environ. Res. 2014, 131, 17–24. [Google Scholar] [CrossRef]
  7. Bernat, S. Sound in landscape: the main research problems. Diss. Cult. Landsc. Comm. 2014, 23, 89–108. [Google Scholar]
  8. Pijanowski, B.C.; Villanueva-Rivera, J.; Dumyahn, S.L.; Farina, A.; Krause, B.L.; Napoletano, B.; Gage, S.H.; Pieretti, N. Soundscape Ecology: The science of sound in the landscape. BioScience 2011, 61, 203–216. [Google Scholar] [CrossRef] [Green Version]
  9. Kang, J.; Aletta, F.; Gjestland, T.T.; Brown, L.A.; Botteldooren, D.; Schulte-Fortkamp, B.; Lercher, P.; Kamp, I.; Genuit, K.; Fiebig, A.; et al. Ten questions on the soundscapes of the built environment. Build. Environ. 2016, 108, 284–294. [Google Scholar] [CrossRef] [Green Version]
  10. Chetoni, M.; Fredianelli, L.; Minichilli, F.; Cori, L.; Licitra, G.; Bianco, F. Correlation between perceived and measured noise, within the Gioconda project. In Proceedings of the 23rd International Congress on Sound and Vibration: From Ancient to Modern Acoustics, Athens, Greece, 10–14 July 2016. [Google Scholar]
  11. Vienneau, D.; Schindler, C.; Perez, L.; Probst-Hensch, N.; Röösli, M. The relationship between transportation noise exposure and ischemic heart disease: a meta-analysis. Environ. Res. 2015, 138, 372–380. [Google Scholar] [CrossRef]
  12. Roswall, N.; Raaschou-Nielsen, O.; Ketzel, M.; Gammelmark, A.; Overvad, K.; Olsen, A.; Sørensen, M. Long-term residential road traffic noise and NO2 exposure in relation to risk of incident myocardial infarction–A Danish cohort study. Environ. Res. 2017, 156, 80–86. [Google Scholar] [CrossRef]
  13. Roswall, N.; Raaschou-Nielsen, O.; Jensen, S.S.; Tjønneland, A.; Sørensen, M. Long-term exposure to residential railway and road traffic noise and risk for diabetes in a Danish cohort. Environ. Res. 2018, 160, 292–297. [Google Scholar] [CrossRef] [PubMed]
  14. Licitra, G.; Fredianelli, L.; Petri, D.; Vigotti, M.A. Annoyance evaluation due to overall railway noise and vibration in Pisa urban areas. Sci. Total Environ. 2016, 568, 1315–1325. [Google Scholar] [CrossRef] [PubMed]
  15. Kephalopoulos, S.; Paviotti, M.; Anfosso Ledee, F.; van Maercke, D.; Shilton, S.; Jones, N. Advances in the development of common noise assessment methods in Europe: The CNOSSOS-EU framework for strategic environmental noise mapping. Sci. Total Environ. 2014, 482, 400–410. [Google Scholar] [CrossRef]
  16. The Publications Office of the European Union. Evaluation of directive 2002/49/EC relating to the assessment and management of environmental noise—EU Law and Publications 2016; The Publications Office of the European Union: Brussels, Belgium, 2016. [Google Scholar]
  17. Morel, J.; Marquis-Favre, C.; Gille, L.-A. Noise annoyance assessment of various urban road vehicle pass-by noises in isolation and combined with industrial noise: A laboratory study. Appl. Acoust. 2016, 101, 47–57. [Google Scholar] [CrossRef]
  18. Bunn, F.; Trombetta Zannin, P.H. Assessment of railway noise in an urban setting. Appl. Acoust. 2016, 104, 16–23. [Google Scholar] [CrossRef]
  19. Flores, R.; Gagliardi, P.; Asensio, C.; Licitra, G. A case study of the influence of urban morphology on aircraft noise. Acoust. Aust. 2017, 45, 389–401. [Google Scholar] [CrossRef]
  20. Fredianelli, L.; Gallo, P.; Licitra, G.; Carpita, S. Analytical assessment of wind turbine noise impact at receiver by means of residual noise determination without the wind farm shutdown. Noise Control Eng. J. 2017, 65, 417–433. [Google Scholar] [CrossRef]
  21. Przysucha, B.; Szeląg, A.; Pawlik, P. Probability distributions of one-day noise indicators in the process of the type A uncertainty evaluation of long-term noise indicators. Appl. Acoust. 2020, 161, 1–9. [Google Scholar] [CrossRef]
  22. Gozalo, G.; Barrigón Morillas, J.; González, D.; Moraga, P. Relationships among satisfaction, noise perception, and use of urban green spaces. Sci. Total Environ. 2018, 624, 438–450. [Google Scholar] [CrossRef]
  23. Rice, W.; Newman, P.; Miller, Z.; Taff, D. Protected areas and noise abatement: A spatial approach. Landsc. Urban Plan. 2020, 194, 1–9. [Google Scholar] [CrossRef]
  24. Kogan, P.; Arenas, J.; Bermejo, F.; Hinalaf, M.; Turra, B. A Green Soundscape Index (GSI): The potential of assessing the perceived balance between natural sound and traffic noise. Sci. Total Environ. 2018, 642, 463–472. [Google Scholar] [CrossRef] [PubMed]
  25. Sztubecka, M.; Skiba, M. Noise level arrangement in determined zones of homogenous development of green areas on the example of the spa park in Inowrocław. Open Eng. 2016, 6, 2391–5439. [Google Scholar] [CrossRef]
  26. Cassina, L.; Fredianelli, L.; Menichini, I.; Chiari, C.; Licitra, G. Audio-Visual Preferences and Tranquillity Ratings in Urban Areas. Environments 2018, 5, 1–17. [Google Scholar] [CrossRef] [Green Version]
  27. Szubecka, M.; Bujarkiewicz, A.; Sztubecki, J. Optimization of measurement points choice in preparation of green areas acoustic map. Civ. Environ. Eng. Rep. 2016, 4, 137–144. [Google Scholar] [CrossRef] [Green Version]
  28. Kaymaz, I.C. Landscape Perception. In Landscape Planning; Murat Ozyavuz, M., Ed.; InTech: Rijeka, Croatia, 2012; pp. 1–28. Available online: http://www.intechopen.com/books/landscape-planning/landscapeperception (accessed on 9 December 2019).
  29. Tse, M.S.; Chau, C.K.; Choy, Y.S.; Tsui, W.K.; Chan, C.N.; Tang, S.K. Perception of urban park soundscape. J. Acoust. Soc. Am. 2012, 131, 2762–2771. [Google Scholar] [CrossRef] [Green Version]
  30. Aletta, F.; Kang, J.; Axelsson, Ö. Soundscape descriptors and a conceptual framework for developing predictive soundscape models. Landsc. Urban Plan. 2016, 149, 65–74. [Google Scholar] [CrossRef]
  31. Yang, W.; Moon, H. Effects of recorded water sounds on intrusive traffic noise perception under three indoor temperatures. Appl. Acoust. 2019, 145, 234–244. [Google Scholar] [CrossRef]
  32. Meng, Q.; Hu, X.; Kang, J.; Wu, Y. On the effectiveness of facial expression recognition for evaluation of urban sound perception. Sci. Total Environ. 2019, 135484. [Google Scholar] [CrossRef]
  33. Jastriebow, A.; Gad, S.; Słoń, G. Fuzzy cognitive maps in technical objects decisional monitoring (in Polish). Biuletyn Wojskowej Akademii Technicznej 2010, 59, 210–219. [Google Scholar] [CrossRef]
  34. Papageorgiou, K.; Singh, P.K.; Papageorgiou, E.; Chudasama, H.; Bochtis, D.; Stamoulis, G. Fuzzy Cognitive Map-Based Sustainable Socio-Economic Development Planning for Rural Communities. Sustainability 2020, 12, 1–31. [Google Scholar] [CrossRef] [Green Version]
  35. Liu, Y.; Zhou, J.; He, Z.; Lu, C.; Jia, B.; Qin, H.; Feng, K.; He, Q.; Liu, G. Causal Inference of Optimal Control Water Level and Inflow in Reservoir Optimal Operation Using Fuzzy Cognitive Map. Water 2019, 11, 1–19. [Google Scholar] [CrossRef] [PubMed] [Green Version]
  36. Ziolo, M.; Filipiak, B.Z.; Bąk, I.; Cheba, K. How to Design More Sustainable Financial Systems: The Roles of Environmental, Social, and Governance Factors in the Decision-Making Process. Sustainability 2019, 11, 1–34. [Google Scholar] [CrossRef] [Green Version]
  37. Behrooz, F.; Yusof, R.; Mariun, N.; Khairuddin, U.; Hilmi Ismail, Z. Designing Intelligent MIMO Nonlinear Controller Based on Fuzzy Cognitive Map Method for Energy Reduction of the Buildings. Energies 2019, 12, 2713. [Google Scholar] [CrossRef] [Green Version]
  38. Pluchinotta, I.; Esposito, D.; Camarda, D. Fuzzy cognitive mapping to support multi-agent decisions in development of urban policymaking. Sustain. Cities Soc. 2019, 46, 1–12. [Google Scholar] [CrossRef]
  39. Doğan, U.; Güngör, M.K.; Bostancı, B.; Bakır, N.Y. GIS Based Urban Renewal Area Awareness and Expectation Analysis Using Fuzzy Modeling. Sustain. Cities Soc. 2020, 54, 1–14. [Google Scholar] [CrossRef]
  40. Open Street Map. Available online: https://www.openstreetmap.org/#map=16/53.1272/18.0114 (accessed on 10 December 2019).
  41. Gray, S.A.; Gray, S.; Cox, L.J.; Henly-Shepard, S. Mental Modeler: A Fuzzy-Logic Cognitive Mapping Modeling Tool for Adaptive Environmental Management. In Proceedings of the 46th Hawaii International Conference on System Sciences, Wailea, HI, USA, 7–10 January 2013; pp. 965–973. [Google Scholar]
  42. Minister of Environment. Regulation of the Minister of Environment of 30.10.2014 on the requirements for measuring emissions and measuring the amount of water consumed. Available online: http://prawo.sejm.gov.pl/isap.nsf/download.xsp/WDU20190002286/O/D20192286.pdf (accessed on 1 September 2019).
  43. Pérez-Martínez, G.; Torija, A.P.; Ruiz, D. Soundscape assessment of a monumental place: A methodology based on the perception of dominant sounds. Landsc. Urban Plan. 2018, 169, 12–21. [Google Scholar] [CrossRef] [Green Version]
  44. Jeon, J.; Jo, H. Effects of audio-visual interactions on soundscape and landscape perception and their influence on satisfaction with the urban environment. Build. Environ. 2020, 169, 1–12. [Google Scholar] [CrossRef]
  45. Özesmi, U.; Özesmi, S. Ecological models based on people’s knowledge: a multi-step fuzzy cognitive mapping approach. Ecol. Model. 2004, 176, 43–64. [Google Scholar] [CrossRef] [Green Version]
  46. Vasslides, J.; Jensen, O. Fuzzy cognitive mapping in support of integrated ecosystem assessments: Developing a shared conceptual model among stakeholders. J. Environ. Manag. 2016, 166, 348–356. [Google Scholar] [CrossRef] [PubMed]
  47. Misthos, L.-M.; Messaris, G.; Damigos, D.; Menegaki, M. Exploring the perceived intrusion of mining into the landscape using the fuzzy cognitive mapping approach. Ecol. Eng. 2017, 101, 60–74. [Google Scholar] [CrossRef]
  48. Solana-Gutiérrez, J.; Rincón, G.; Alonso, C.; García-de-Jalón, D. Using fuzzy cognitive maps for predicting river management responses: A case study of the Esla River basin, Spain. Ecol. Model. 2017, 360, 260–269. [Google Scholar] [CrossRef]
  49. Özesmi, U.; Özesmi, S.L. A participatory approach to ecosystem conservation: fuzzy cognitive maps and stakeholder group analysis in Uluabat Lake, Turkey. Environ. Manag. 2004, 31, 518–531. [Google Scholar] [CrossRef]
  50. Leśniak, A.; Kubek, D.; Plebankiewicz, E.; Zima, K.; Belniak, S. Fuzzy AHP application for supporting contractors’ bidding decision. Symmetry 2018, 10, 1–14. [Google Scholar] [CrossRef] [Green Version]
  51. Skiba, M. The use of fuzzy cognitive maps (FCM) as an instrument facilitating the process of decision-making in spatial planning. Urbanity Archit. Files 2018, XLVI, 557–564. [Google Scholar]
  52. Kaplan, S.; Kaplan, R. Anthropogenic/anthropogenerous: Creating environments that help people create better environments. Landsc. Urban Plan. 2011, 100, 350–352. [Google Scholar] [CrossRef]
  53. Kothencz, G.; Blaschke, T. Urban parks: Visitors’ perceptions versus spatial indicators. Land Use Policy 2017, 64, 233–244. [Google Scholar] [CrossRef]
  54. Yu, L.; Kang, J. Factors influencing the sound preference in urban open spaces. Appl. Acoust. 2010, 71, 622–633. [Google Scholar] [CrossRef] [Green Version]
  55. Dimitrijević, S.M.; García-Chocano, V.M.; Cervera, F.; Roth, E.; Sánchez-Dehesa, J. Sound Insulation and Reflection Properties of Sonic Crystal Barrier Based on Micro-Perforated Cylinders. Materials 2019, 12, 1–25. [Google Scholar] [CrossRef] [Green Version]
  56. Kazak, J.; van Hoof, J. Decision support systems for a sustainable management of the indoor and built environment. Indoor and Built Environ. 2018, 27, 1303–1306. [Google Scholar] [CrossRef] [Green Version]
  57. Watts, G. Tranquillity in the city—building resilience through identifying, designing, promoting and linking restorative outdoor environments. Proc. Meet. Acoust. 2017, 30, 1–8. [Google Scholar] [CrossRef] [Green Version]
  58. Skrzypczak, I.; Kokoszka, W.; Kogut, J.; Oleniacz, G. Methods of Measuring and Mapping of Landslide Areas. OP Conf. Ser.: Earth Environ. 2017, 1–10. [Google Scholar] [CrossRef] [Green Version]
  59. Liu, J.; Kang, J.; Behm, H.; Luo, T. Effects of landscape on soundscape perception: Soundwalks in city parks. Landsc. Urban Plan. 2014, 123, 30–40. [Google Scholar] [CrossRef] [Green Version]
  60. Hong, J.Y.; Lam, B.; Ong, Z.T.; Ooi, K.; Gan, W.S.; Kang, J.; Yeong, S.; Lee, I.; Tan, S.T. The effects of spatial separations between water sound and traffic noise sources on soundscape assessment. Build. Environ. 2020, 167, 1–10. [Google Scholar] [CrossRef]
  61. Hong, J.Y.; Ong, Z.T.; Lam, B.; Ooi, K.; Gan, W.S.; Kang, J.; Feng, J.; Tan, S.T. Effects of adding natural sounds to urban noises on the perceived loudness of noise and soundscape quality. Sci. Total. Environ. 2019, 134571. [Google Scholar] [CrossRef]
  62. Van Renterghem, T.; Vanhecke, K.; Filipan, K.; Sun, K.; De Pessemier, T.; De Coensel, B.; Joseph, W.; Botteldooren, D. Interactive soundscape augmentation by natural sounds in a noise polluted urban park. Landsc. Urban Plan. 2020, 194, 1–13. [Google Scholar] [CrossRef]
  63. Nowogońska, B. The Life Cycle of a Building as a Technical Object. Period. Polytech. Civ. Eng. 2016, 60, 331–336. [Google Scholar] [CrossRef] [Green Version]
  64. Tsaligopoulos, A.; Karapostoli, A.; Radicchi, A.; Economou, C.; Kyvelou, S.; Matsinos, Y.G. Ecological Connectivity of Urban Quiet Areas: The Case of Mytilene, Greece. Cities & Health J. 2019, 1–13. [Google Scholar] [CrossRef]
  65. Cerwén, G.; Kreutzfeldt, J.; Wingren, C. Soundscape actions: A tool for noise treatment based on three workshops in landscape architecture. Front. Archit. Res. 2017, 6, 504–518. [Google Scholar] [CrossRef]
  66. Radicchi, A. Are privately owned public spaces effective design and planning tools that can favor the creation of healthy, open spaces in contemporary cities? Notes from an empirical study in New York. In Proceedings of the La città contemporanea: un gigante dai piedi di argilla/The contemporary city: a giant with feet of clay, Turin, Italy, 15 November 2019. [Google Scholar]
  67. Kang, J. Noise Management: Soundscape Approach. Encycl. of Environ. Health 2019. [Google Scholar] [CrossRef]
  68. Rey Gozalo, G.; Trujillo Carmona, J.; Barrigón Morillas, J.M.; Vílchez-Gómez, R.; Gómez Escobar, V. Relationship between objective acoustic indices and subjective assessments for the quality of soundscapes. Appl. Acoust. 2015, 97, 1–10. [Google Scholar] [CrossRef]
  69. Ozcevik, A.; Can, Z.Y. A field study on the subjective evaluation of soundscape. Proc. Acoust. 2012, 23–27. Available online: https://hal.archives-ouvertes.fr/hal-00810898 (accessed on 1 September 2019).
  70. De la Prida, D.; Pedrero, A.; Ángeles Navacerrada, M.; Díaz, C. Relationship between the geometric profile of the city and the subjective perception of urban soundscapes. Appl. Acoust. 2019, 149, 74–84. [Google Scholar] [CrossRef]
Figure 1. The studied park localization (map - ArcGIS software).
Sustainability 12 00999 g001
Figure 2. Kazimierz Wielki Park (map [40]).
Sustainability 12 00999 g002
Figure 3. Jan Kochanowski Park (map [40]).
Sustainability 12 00999 g003
Figure 4. Wincenty Witos Folks Park (map [40]).
Sustainability 12 00999 g004
Figure 5. The overlapping maps scheme on a grouped background.
Sustainability 12 00999 g005
Figure 6. Average subjective sound perception.
Sustainability 12 00999 g006
Figure 7. Fuzzy cognitive map for the “noise in the city park” conception (own elaboration on the basis of Mental Modeler software).
Sustainability 12 00999 g007
Figure 8. Scenario for the map “noise in the city parks”—with diminution of traffic factors (car, tram, bus) (own elaboration with use Mental Modeler).
Sustainability 12 00999 g008
Figure 9. Scenario for the map “noise in the city parks”—with diminution factor of greenery (own elaboration with use of the Mental Modeler).
Sustainability 12 00999 g009
Figure 10. Scenario for the map “noise in the city parks”—strengthening the factor of greenery (own elaboration with use Mental Modeler).
Sustainability 12 00999 g010
Figure 11. The sound–space dependence (own elaboration based on [59]).
Sustainability 12 00999 g011
Table 1. Subjective visitors’ sound perception.
Sound SourcesKazimierz Wielki Park [%]Jan Kochanowski Park [%]Wincenty Witos Folks Park [%]Mean Value [%]
Traffic47535652
Human factor33242427
Nature8566
Other12181415
Table 2. Subjective visitors’ sound perception (correlation coefficient).
NoiseBusTramCarGreeneryWaterChildrenAdultsNeighborhoodPavement
Noise –0.64–0.53 –0.55
Bus0.79 0.44 –0.24
Tram0.73 0.53 –0.44
Car0.97 0.230.52–0.42–0.42–0.55
Greenery0.39–0.56–0.62–0.29 0.50
Water0.47 –0.39 0.59
Children0.70
Adults0.33
Neighborhood0.35 –0.46–0.26
Pavement–0.41

