Abstract
Industrial development is critical in improving a nation’s economy and in how it consumes energy resources. However, such development often causes environmental problems. Among others, the haze caused by industrial SO2 emissions is particularly prominent. Based on Niche theory and combined with Exploratory Spatial Data Analysis (ESDA, a decoupling index model, and a Logarithmic Mean Divisia Index (LMDI) factor decomposition model, this paper reports a study on the spatio-temporal distribution and the driving factors of industrial development and industrial SO2 emissions of cities in Henan, China between 2005 and 2014. The results showed that over the studied period in Henan: (1) SO2 emissions reduced by 4.56 × 10⁵ tons and showed a slowly decreasing trend, which gradually transitioned to a “green health” industrial structure in Henan cities; (2) studied cities with high and low industrial niche values (0.038–0.139) showed an absolute decoupling relationship between industrial development and industrial SO2 emissions; (3) except for Zhengzhou city and Hebi city, other studied cities showed a trend of gradually increasing industrial output; (4) along with increases in the values of industrial output, studied cities showed increased levels of SO2 emissions but with energy intensity and energy structure showing a fluctuating trend of increases and decreases in their contributions to SO2 emissions; and (5) the energy consumption intensity and environmental technology were critical factors that were conducive to industrial SO2 emissions and the evolving industrial structure. These findings are important for the control of industrial SO2 emissions, though the levels of their influences are different in different cities. The scale of industrial production and the composition of energy structure in a region could lead to further deterioration of industrial SO2 emissions in the future.
1. Introduction
Industrialization and industrial development are important driving forces for the acceleration of the world’s economy. They are also the main carriers of human influence on resources and environment in the regional system of “man–land relationship” [1,2]. While industrial development has made China’s economy grow rapidly, the high pollution level and high energy consumption intensity and its low efficiency have aggravated the restrictive effect on sustainable development and on ecological civilization of city construction [3,4,5]. The haze caused by air pollution, especially by industrial SO2 emission, is particularly prominent on the quality of the environments in urban areas. According to the statistics in China’s Environmental Situation Bulletin in 2015, among the 338 prefecture-level cities, only 73 cities met China’s standards for environmental air quality with 265 cities exceeding the standards [6]. Hazy weather in most cities has become the focus of attention from all walks of life. Therefore, the relationship between urban industrial development and industrial SO2 emissions and its changes play an important role in optimizing China’s industrial structure. Understanding this relationship would help to find ways to effectively improve urban air quality and control the emission of pollutants.
Analyzing the changing trend and influencing factors on industrial SO2 emissions can also provide references for the reduction of other pollutant emissions. Existing studies on the relationship between industrial development and industrial SO2 emissions have focused on the impacts by industrial structures [7,8] and energy structures [9,10], economic development scales [11], and other factors on SO2 emissions. Although there are several conceptual studies on this relationship, there is not yet much work done on corresponding empirical research. Tsurumi [8] used a semi-parametric additive model to analyze the emission of SO2 as an air pollution factor and suggested that SO2 emissions could be reduced by adopting newer and more efficient industrial technology. Freitas [12] believes that industrialization in a region depends on the region’s industrial structure, energy structure and energy intensity to achieve a “decoupling” relationship between energy consumption and industrial economy. This was to alleviate the vulnerability of the world’s total energy resources and energy supply system. There were also scholars who examined these issues from the perspective of energy consumption and other economic aspects. For example, Climent [13] took Spain as a case study and analyzed the relationship between its GDP and energy consumption. That research showed that there was a short-term one-way causal relationship between them. From the same study, energy consumption showed a certain restrictive effect on Spain’s short-term economic growth. On this subject, Luken [14] believes that energy consumption and industrial development tend to grow at the same time but there could be a “link” between the two phenomena.
On these subjects, Chinese scholars mostly focused on the impact that economic scales and industrial structure had on the increase of industrial SO2 emissions [15,16,17,18,19]. These studies seemed to have ignored how energy consumption, technological innovation and other factors might have influenced the increase of industrial SO2 emissions. At the same time, the spatial pattern of changes in industrial SO2 emissions and the associated influencing factors have seldom been combined to analyze the emission patterns and trends. From the perspective of industrial development and based on China’s Iron and Steel Industry, Ma [20] applied Material Flow Analysis and Evaluation Model to analyze the acid rain, which had been argued to be caused by industrial SO2 emission. Ma concluded that the upgrading of industrial technology and the adjustment of industrial structure were the main ways to control SO2 emission. In searching for ways to reduce SO2 emission, Liu [21] analyzed how industrial investments and exports might have influenced the intensity of SO2 emissions in China by using an LMDI model. Furthermore, Lei [22] analyzed the influencing factors of changes in SO2 emissions intensity in Wuxi. Zhao [23] used Spatial Econometric Analysis to examine how industrial SO2 emissions in China changed between 2001 and 2014. Both studies found that SO2 emissions increased first and then decreased over the study period and that there were great differences in emission levels and intensities between those in urban and in rural areas. They concluded that such differences could be mainly affected by different land use and environmental policies among different regions.
In summary, there seems to be a close relationship between industrial development and industrial SO2 emission. However, few studies in the current literature on this relationship documented or decomposed the temporal-spatial effects of coupling the two and incorporated them into one combined framework for analysis. Thus, there is a need for a study of the spatio-temporal coupling effect between industrial development and industrial SO2 emission.
Industrial development is an inevitable result of productivity development. It is possible to study the relationship between industrial development and industrial SO2 emissions by introducing the theory of industrial niche, with which cities at all levels could be divided into different levels to reflect the different characteristics and developmental stages and changes in a city. At the same time, considering also industrial carbon emission as the primary factor of degraded environmental quality, it seems that industrial SO2 emissions have been ignored even though it has become another main factor of environmental degradation. On the potential influencing factors to SO2 emission, scholars mostly analyzed the reasons for the increase of industrial SO2 emissions from the perspectives of economic development and industrial transformation (re-structuring). However, due to the constraints of restructures, changes in scales of industrial productivity, changes in the intensities and consumption structures of energy, changes in pollutant discharges in different cities, and the fact that industrial SO2 emissions have tended to show periodic (cyclical) trends; the impacts of SO2 emissions on the regional environment may also be different.
In this paper, the influencing factors on SO2 emissions that were identified and studied in different fields are coupled and analyzed. In terms of analytical methods used, most existing studies directly analyzed the identified influencing factors of increased industrial SO2 emissions as caused by industrial development while ignoring the spatial-temporal coupling changes and spatial differences between them. On the one hand, based on the levels of spatial autocorrelation measured by Moran’s index, this paper analyzes the effect of industrial development on SO2 emissions and confirms the results by using a decoupling index. On the other hand, on the basis of considering spatial and temporal differences, an LMDI factor decomposition method is used to analyze the different rates by different factors of resources and environment as contributions to economic growth in different regions.
Henan Province is an important agricultural province in China. It is the core province of the Central Plains region and a strong growth pole that drives the economic development of the Central Plains into the future (see Figure 1). However, in the process of industrialization and urbanization, there have been serious problems, such as inefficient utilization of resources and increasing pressure on environmental quality caused by an imperfect industrial system and incomplete industrial transformation. The serious problems of declining air quality and increasing haze as caused by the increases in industrial SO2 emissions are particularly prominent in Henan. Thus, we selected this province as our study area. This study can fill the gaps discussed above, including industrial niche analysis, the spatio-temporal structure, the coupling between industrial development and industrial SO2, and the decomposition analysis of the driving factors of industrial development and industrial SO2 emission. Strong data and new methods will enrich related studies and make references for the subsequent research in other relevant places. In addition, this study can provide references for the adjustment of industrial structures, promoting industrial transformation, and upgrading and regulating environmental pollution reasonably for cities like those in Henan province which focus on agricultural and secondary industry development and urgently need to upgrade their industrial structures. Detailed content of this research includes the following: (1) analysis of industrial niche of studied cities; (2) analysis of spatio-temporal coupling industrial development and industrial SO2 emission; (3) spatial analysis of industrial SO2 emission; and (4) the driving factor decomposition analysis of industrial development and industrial SO2 emission.
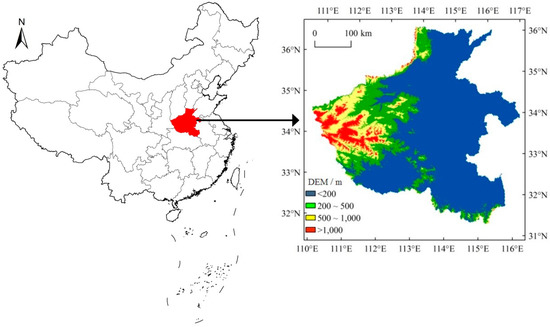
Figure 1.
Location of the study area.
2. Study Areas, Methods and Data Sources
2.1. Study Areas
Henan Province encompasses the middle and lower reaches of Yellow River. From the promulgation of the 2009–2016 Circular on the Construction and Planning of the Core Food Production Zone in Henan Province (2009), Guidance of the State Council on Supporting Henan Province to Accelerate the Construction of Central Plains Economic Zone (2011), Development Planning of Zhengzhou Airport Economic Comprehensive Experimental Zone (2013), Zhengzhou-Luoyang New National Independent Innovation Demonstration Zone (2016), China (Henan) Free Trade Pilot Area (2016), among other sources, there appears to be a rare opportunity for the economic transformation of Henan Province to take place. In that regard, the degradation of environmental quality of Henan province is gradually becoming a hot spot of social concerns.
By the end of 2016, there were 18 prefecture-level cities, 52 municipal districts and 20 county-level cities in Henan Province administratively. From 2005 to 2014, the total values of industrial output of Henan Province increased by 231.64%. At the same time, environmental problems in Henan Province, especially air pollution, have gradually become serious over recent years. With the strengthening of environmental protection efforts as outlined in the 11th and 12th Five-Year Plans, Henan Province has actively responded to the call of desulfurization, denitrification, energy saving and emission reduction. According to government statistics, the scale of industrial SO2 emissions in Henan Province in 2014 was lower than that in 2005, by 456,400 tons. The industrial structure has been constantly optimized, but due to the different industrial systems among different cities, the environmental pressures caused by industrial development remain a concern, though to different degrees among different cities. It was also for this concern that this study investigates the evolution of industrial ecology in Henan with an aim to explore potential directions for green development in the future.
2.2. Methods
2.2.1. Industrial Ecological Niche Theories
The concept of Ecological Niche originated from avian population ecology. It has been widely used in studies of animal ecology. In 1917, Grinnell [24] first proposed the term niche to redefine the spatial units of habitats. Subsequently, in 1936, Park [25] established the classical Chicago human niche theory framework from the perspective of population. In 1958, Hutchinson [26,27] defined niches from the perspective of spatial structure and resource utilization and put forward the concept of multi-dimensional hypervolume niches. With further development of the niche concept, this niche theory has gradually penetrated into research in economic geography, urban development and other fields. Since then, Odum et al. and others [28,29] have enriched niche theory by fine-tuning it from additional perspectives.
Like natural ecosystems, a human social system can also be regarded as an organic community. Cities are the inevitable product of the development of economic productivity. Given that industrial development is a key part of modern economy, it is the inevitable result that industrial development dominates productivity development. The industrial development of any city can be defined according to niche theory. However, the industrial functional grades in different spatial locations would be different.
The increases of industrial SO2 emissions are closely related to the levels of industrial development in different cities. Given this, it is more convincing to elaborate the interaction between industrial development and industrial SO2 emissions based on grade levels of industrial niches in different regions and cities. Thus, this paper introduces industrial development into ecological niche and defines it as the economic status and social status of a city in a regional urban system. In this manner, ecological niche could be formed by considering the process of resource utilization and environmental response in a certain ecosystem.
The advancement of urban economy cannot be separated from industry development. Building on the indicators selected and used by existing studies, this paper classifies the industrial niches in Henan Province by environmental niche and economic niche. The status of urban development in a city and its characteristics can be expressed by the state and potential of ecological niche [30,31]. The Equation for calculating such niches is the following [27,32]:
where, Ni is the niche of unit i=1,2,…,n for n cities; each λ is a weight assigned to an indicator; Si is the state of bio-unit i; Pi is the niche potential of bio-unit i; Sj is the state of bio-unit j; Pj is the potential of bio-unit j; and Ai and Aj are the dimensional conversion coefficients that we define for bio-units i and j. Among them, the molecular term is the absolute niche of the ecological unit, and the denominator is the relative niche of the ecological unit.
In view of relevant references [31,32], local basic conditions in Henan Province, and the availability of data, this paper chose to use 14 evaluation indicators, which are listed in Table 1. After standardizing the numerical values of the indicators using the extreme value method, this paper chose the entropy method to empower the index in order to be more objective.

Table 1.
Index system of industrial niche.
This paper used entropy method to calculate the weight; the calculation is as follows:
- Calculate the specific gravity Pij of the i rating unit under index jIf Pij=0, definewhere: i is the evaluation unit of item i, j is the evaluation index of item j, Yij is the standardized value of the corresponding index.
- Calculate the entropy Ej of item j
- Determine the coefficient of variation
- Determine and assign a suitable weight
2.2.2. ESDA Analysis
The Exploratory Spatial Data Analysis (ESDA) carried out in this study includes the application of the global spatial autocorrelation index and local spatial autocorrelation index. These indexes determine the structure of the model by analyzing the properties of spatial information based on statistical principles and graphical representation of the data [33]. In this paper, Moran’s Index is used to analyze the levels of concentration of the spatial distributions of industrial SO2 emissions in Henan Province. Values of Moran’s I can be positive or negative, with higher absolute values indicating stronger spatial autocorrelation. The positive and negative values indicate spatially clustered or disperse spatial patterns.
Given Moran’s I values, regions with higher positive index values have significant spatial agglomeration. The closer the index value approaches −1/(n−1), the more likely that the spatial distribution of the data values is random or there is no spatial autocorrelation. The more negative the index value is, the more negative spatial autocorrelation (i.e., indicating dispersion or uniform patterns) there is and the weaker the spatial agglomeration is in the distribution with greater overall spatial difference.
The calculation Equation for calculating global spatial autocorrelation is as follows [34,35]:
where, N represents the total number of prefecture-level cities in the study area; Xi, and Xj represent the industrial SO2 emissions of city i and city j; Wij represents the spatial weight, defined as 1 if city i is adjacent to city j, otherwise the weight is 0; and represents the mean of industrial SO2 emission.
Moran’s I is a global statistical index, it only reflects the overall pattern of spatial distribution of industrial SO2 emissions for the entire province. To explore spatial variation of SO2 emission, local Moran’s I, Moran scatter plots and other methods can be used to explain the spatial configurations among the locally adjacent units in order to reflect the change over local areas (i.e., cities).
In this paper, Moran scatter plot method is used to reflect how SO2 emissions of different cities relate to one another. Each plot consists of four quadrants: HH type: It indicates that there is a strong positive spatial autocorrelation between a city’s high industrial SO2 emissions and that of its adjacent cities. With this, the cluster can be regarded as a hot spot; HL type or LH type: It indicates that there is a strong negative spatial autocorrelation between SO2 emissions from industries in a city and that of adjacent cities; and finally LL type: It indicates that there is a strong positive spatial autocorrelation between low SO2 emissions from industries in a city and also low SO2 emissions from industries in its adjacent cities [36]. In this paper, calculations of the global and local Moran’s I index are carried out by using ArcGIS 10.2, and the Moran scatter plot was completed by GeoDa software.
2.2.3. Decoupling Relationship
The “decoupling” index is usually used to reflect the essence of the asynchronous changes in the relationship between economic and material energy consumption. Its purpose is to clarify the uncertain relationship between economic growth and material and energy consumption and the impact of these actions on the ecological environment. This is to characterize the pressure relationship between them [37,38]. Therefore, this paper introduces a decoupling model to analyze the relationship between industrial development and industrial SO2 emission, building on the usage of this method in existing studies [39,40,41]. The Equation is as follows:
where DELY is the decoupling elasticity; EI is the initial emission scale of SO2; Y is the initial industrial output value; ΔEI’ is the change of SO2 emissions scales; ΔY is the change in industrial output values during the evaluation period.; n is the n-th year; EIn is SO2 emissions in the n-th year; EIn-1 is SO2 emissions in n−1 year; Yn is the industrial output value of the n-th year; and Yn−1 is the industrial output value of (n−1)-th year.
All decoupling indicators used in this study are shown in Table 2. Outcomes from calculating values of the decoupling index are presented and discussed in Section 3.
Table 2.
Model of decoupling states.
2.2.4. LMDI Factor Decomposition
Decomposition analysis is a necessary method for studying the mechanism of actions and characteristics of the phenomenon changed by such actions. It has gradually become a widely used method in environmental and economic research [19]. The decoupling model described above can describe the synchronous relationship between industrial output values and industrial SO2 emissions levels. However, it cannot analyze industrial development and industrial SO2 emissions in-depth. For that, an LMDI method, which is a typical method of driving factor analysis with no residual term in the decomposition process, can be used because the analysis can produce convincing results [35].
In view of the above and in order to analyze the contribution of industrial scale, economic structure and technological effect to the changes in decoupling index values spatially and temporally, the decoupling index between industrial development and industrial SO2 emissions scale in Henan Province is decomposed by using an LMDI method on the material relationship as established by a Kaya equation between industrial scale, economic structure and SO2 emission.
According to the decomposition idea of Kaya Identity [35,42], the decoupling index between industrial output values and industrial SO2 emissions can be decomposed as follows [1,19,35]:
where, Et is the total industrial SO2 emissions in year t; Ei is the total industrial SO2 emissions of City i; Yt is the gross industrial output value of year t; Qit is the total energy consumption of i City in year t; Yit is the annual industrial output value of City i in year t; and E’it is the total consumption of coal and fuel oil. Eit is the annual industrial SO2 emissions of City i for year t. Since industrial SO2 emissions in Henan Province were mainly caused by the consumption of coal and fuel oil, the sum of the two can approximately reflect the emission intensity of industrial SO2.
Specifically, Y reflects the scale of output values and the comprehensive impact of SO2 emissions on economic development in terms of GDP; Q reflects energy intensity, expressed in terms of energy consumption per unit output value. The lower the ratio, the higher the energy utilization rate; V reflects the energy structure, expressed in terms of the total consumption of coal and fuel oil per unit energy consumption; M reflects the technological effect of environmental protection and is expressed by SO2 emissions per unit of coal and fuel oil consumption; S reflects the industrial structure, because industrial output values occupy a large proportion of a nation’s economy.
It is also important to assess the impact of industrial development on pollutant emission [43]. Moreover, it is expressed as the proportion of industrial output value of a city in the regional total output value. Therefore, the change of industrial SO2 emissions scale (ΔE) can be expressed as [44]:
where, t is the end of the study period, i is the beginning of the study period, and the other indicators are the same as above.
Given the above, the changes in industrial SO2 emissions caused by a single factor can be further calculated, and the Equations are as follows [1]:
where, ΔY, ΔQ, ΔV, ΔM, and ΔS represent respectively the contribution of output value scale, energy intensity, energy structure, environmental protection technology effect, and industrial structure to industrial SO2 emission. If the index is positive, it indicates that the increase of the index has a positive effect on emissions; otherwise, it has a negative effect.
2.3. Data Sources
The data in this paper was from China Urban Statistical Yearbook (2006–2015), Henan Statistical Yearbook (2006–2015), the annual statistical data of the National Statistical Bureau of the corresponding years, the statistical yearbooks issued by various cities, and the statistical information network of the relevant cities in Henan Province. In the statistical yearbook of Henan Province, some of the data of Jiyuan City were missing. Some of them were obtained by spatial interpolation or by estimation, the rest are obtained by Jiyuan Statistical Yearbook of corresponding years and Jiyuan Statistical Bulletin of National Economic and Social Development. The outliers and missing values were corrected and supplemented by the interpolation method according to the actual situation of the city where they belong. Among them, in order to reflect the energy structure changes, the total energy consumption, coal consumption and fuel oil consumption were converted into standard coal according to the index coal coefficient.
Among the indicators, Sulphur dioxide (SO2) emission of each city was derived from the annual report of environmental statistics of Henan Province in corresponding years. The total retail sales of social commodities were based on urban data; per capita investment in fixed assets was the investment in fixed assets per capita of the whole society, which was divided into urban and rural areas and three industries; the actual utilization of foreign capital per capita was based on the exchange rate of US dollar to RMB in that year.
3. Results
3.1. Industrial Niche of Studied Cities
According to the indices of industrial niche, with 1 year as the time unit, the original data of corresponding years were used to calculate the state index and the annual growth as the potential index. The industrial niche levels of 18 prefecture-level cities (Zhengzhou = 0.139, Luoyang = 0.087, Jinyuan = 0.078, Sanmenxia = 0.069, Jiaozuo = 0.062, Xinxiang = 0.060, Xuchang = 0.058, Anyang = 0.057, Nanyang = 0.055, Pingdingshan = 0.053, Zhumadian = 0.052, Luohe = 0.046, Puyang =0.045, Zhoukou = 0.045, Kaifeng = 0.041, Hebi = 0.041, Shangqiu = 0.040, Xinyang = 0.038) in Henan Province were obtained based on Equation (1), and then the Natural Breakpoint Method in ArcGIS 10.3 was used to show the grade of Industrial niche in Figure 2.
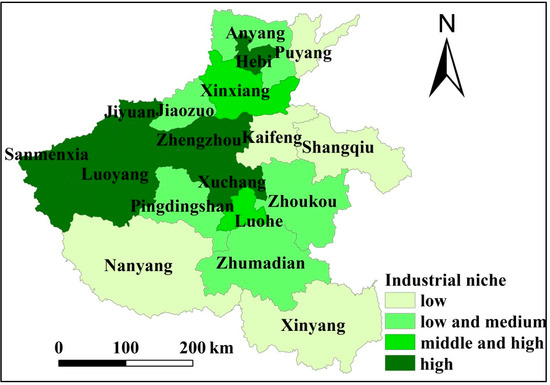
Figure 2.
The grade of Industrial niche.
As can be seen in Figure 2, four types of industrial niche cities showed a ring-like spatial pattern. Among them, five cities with high industrial niche are in the central and western parts of the province. These cities are in the agglomeration of important traffic routes, showing an overall east–west distribution. Another (smaller) agglomeration is Hebi City, which is in the northern part of Henan Province. The middle and high industrial niche cities are concentrated in the middle of Henan Province and distribute along a north–south direction. Low and medium industrial niche cities scatter in the periphery of high and medium industrial cities. In particular, low industrial niche cities are all in the border areas of Henan Province.
3.2. Analysis of Spatio-Temporal Coupling Industrial Development and Industrial SO2 Emissions
The energy consumption structure of Henan Province has been dominated by coal. Due to immature desulfurization technology and low sewage charge standards, using coal to produce energy has resulted in producing excessive SO2 emissions from industries. This puts a lot of pressure on the environment. To better understand the interactions between industrial development and industrial SO2 emission, it is possible to do so by using the statistical data of industrial gross output values. Therefore, this paper chose the corresponding years’ industrial output values and industrial SO2 emissions to analyze the industrial development and changes in spatial patterns of industrial SO2 emissions in Henan Province, providing a basis for the subsequent model analysis.
3.2.1. Spatial Patterns and Evolutional Trends of Industrial Development
Compared with 2005 (Figure 3a), the distribution pattern of Henan’s total industrial output values in 2014 had changed only slightly. Transformed over a 10-year period, Luoyang City had shifted its economic focus from industrial productions to tourism and other tertiary industries. Over this period, its industrial output values had gradually declined. As opposed to this, Zhoukou City and Luohe City had continuously injected industrial elements to fuel cities’ recent growth. The scales of industrial output values of the eastern and western flanks of the province, such as Sanmenxia City and Shangqiu City, had been relatively low as compared to those in other parts of the province (Figure 3b).
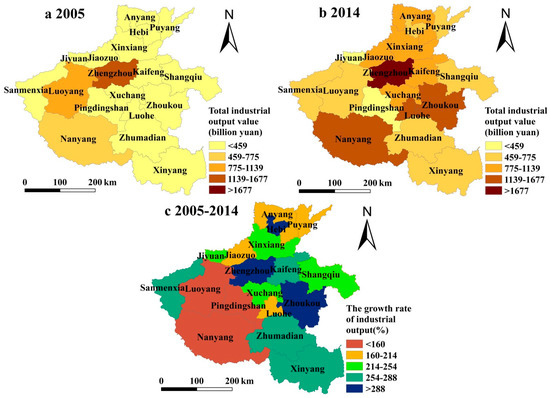
Figure 3.
Distribution of industrial output and growth speed (a) 2005; (b) 2014; (c) 2005–2014.
Overall, there existed a spatial core-periphery pattern of industrial development with Zhengzhou as the core. Figure 3b shows that regions that used to have lower industrial output levels in the eastern and western wings were growing rapidly over the study period. For example, Hebi City had a growth rate of industrial output values that reached 315.99%. The reason for this was that Anyang, as an old industrial base, had been transformed and upgraded from an old industrial base to a regional advanced manufacturing center from 2009 to 2013. In order to improve its economic development, Hebi City undertook an industrial transformation in Anyang City, which saw the industrial output values of the region rise substantially. Furthermore, Zhoukou City was an advanced city of food production in China. With the recent development of their economy, the industrial output values of rural areas had increased significantly through industrialization, industrial transfer and the development of new and high-growth industries.
Secondly, Kaifeng City and Xinyang City were industrial cities. Due to the low industrial niche and weak industrial bases, these cities were able to grow in recent years because of industrial transformation and upgrading and improved market environment. Their growth rates of output values were more than 260% over the study period. Relatively speaking, since the industrial output base of Anyang and Luoyang was higher than that of other cities to begin with, the growth rates of industrial output there were not surprisingly less than 200%.
With the increase in the total economic volume, cities would have the ability to both invest in environmental protection and alleviate the ecological pressure to a certain extent. Comparing the industrial niche grades of different cities (Figure 2), it is obvious that the urban industrial output increased with the gradual decrease of niche grades, except in Zhengzhou and Hebi. The reason is that, as the capital city of Henan Province, Zhengzhou City was able to better use resources, better protect the environment and more effectively use new science and technology than other cities. Therefore, while maintaining a high industrial niche, Zhengzhou’s industrial output value was still rising at high rates. Hebi City had a high industrial niche because it was at a different geographical location and was under different government policies and urban planning practices from those in Zhengzhou City. Because of the different stages of industrialization, urbanization and economic development in other cities, the level of uses of science and technology in Hebi City had been limited. While increasing industrial output values, the pressure on the environment was neglected for the most part in Hebi City.
3.2.2. Spatial Pattern and Evolution of Industrial SO2 Emissions in Henan Province
Between 2005 and 2014, the spatial pattern of industrial SO2 emissions in Henan Province was basically consistent with that of the gross industrial output values. The pattern was that Zhengzhou-Luoyang region functioned as a core. Compared with that in 2005 (Figure 4a), industrial SO2 emissions decreased and the distribution became more concentrated in 2014 (Figure 4b). The spatial pattern of regional industrial SO2 emissions was consistent with that of industrial output values (Figure 4c): The lower the niche grade, the greater the increase, and the more concentrated the cities with lower industrial output value and relatively less industrial SO2 emissions were. For example, the industrial SO2 emissions of cities with high industrial niche grades, such as Zhengzhou, Luoyang and Sanmenxia, accounted for 34.8% of the total emissions in Henan Province. It should be noted, however, that the total emissions decreased by nearly 8 percentage points compared with that in 2005. However, Kaifeng City, Nanyang City, Puyang City and Xinyang City were with low industrial niche. Anyang City and Zhumadian City were with medium and low industrial niche. Xinxiang City and Luohe City were graded as having medium and high industrial niche, which increased significantly over the studied period.
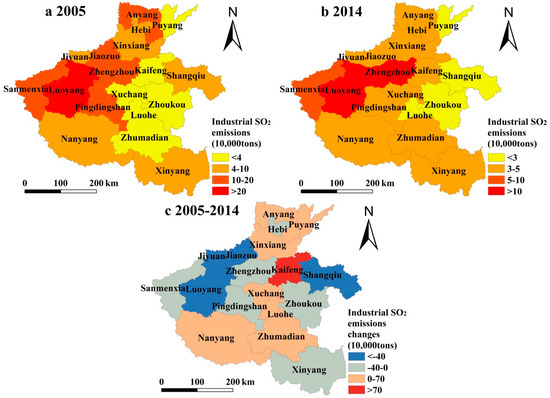
Figure 4.
Distribution of industrial SO2 emissions of Henan Province (a) 2005; (b) 2014; (c) 2005–2014.
3.3. ESDA (Exploratory Spatial Analysis) Analysis of Industrial SO2 Emission
3.3.1. Spatial Variation of Industrial SO2 Emissions
ArcGIS 10.2 software was used to calculate values of Moran’s I (see Table 3). Among the notations, E(I) denotes mathematical expectation of the index value; Variance denotes variance; Z-score denotes standardized difference; and p-value denotes significance level.
Table 3.
Comparison of global Moran’s I index of industrial SO2 emissions in Henan province.
Table 3 shows that, firstly, the Moran’s Index values of Henan Province from 2005 to 2014 were positive, indicating that the industrial SO2 emissions of Henan Province was positively spatially autocorrelated. That means that the SO2 emissions of each city showed a trend of spatial agglomeration of HH (high) or LL (low). From 2005 to 2010, the Moran’s Index values ranged between 0.283 and 0.302, and Z-scores were mostly greater than 2.453, suggesting statistically significant spatial autocorrelation, with p-values significant at 0.05 level. The agglomeration phenomenon in 2005 was the most obvious. It showed that industrial SO2 emissions had become more concentrated during this period, and the spatial correlation between neighboring cities is strong, which indicates that the industrial development of Henan Province may be around several hot spots since 2005.
Secondly, the Moran’s Index values showed a decreasing trend over the studied period but the agglomeration phenomenon was not statistically significant at the 0.05 level from 2011 to 2014. This indicated that the agglomeration phenomenon of industrial SO2 emissions in Henan Province had been gradually becoming less clustered spatially. It might be related to the developmental policy of desulfurization and denitrification in Henan Province in recent years.
Thirdly, the absolute differences in industrial SO2 emissions levels among cities in Henan Province as measured by variance showed a yearly increasing trend. This indicates that the agglomeration of industrial SO2 emissions was separated year by year. It suggested that Henan Province had made some achievements in strengthening environmental protection and promoting ecological civilization construction during the “12th Five-Year” Plan period.
3.3.2. Local Spatial Differences of Industrial SO2 Emissions
Moran’s Index is a statistical index for assessing the global trend of spatial agglomeration of a certain phenomenon. It can only reflect the level of overall spatial clustering of SO2 emissions in the province. This global measurement ignored the local spatial characteristics. In order to further assess and find the key control areas, a Moran scatter plot of SO2 emissions in Henan Province was drawn by using GeoDa software (Figure 5), which enabled the analysis of the local spatial characteristics of industrial SO2 emissions in Henan Province. Year 2005 was the beginning of the research period and the ending time of the Fifteen-Year Plan in Henan Province. According to Moran’s Index values (Table 3), 2011 was the turning point in the research period, which also was the beginning year of the 12th Five-Year Plan. Year 2014 was the end of the research period. Given these, the local spatial characteristics of industrial SO2 emissions in Henan Province in 2005, 2011 and 2014 were further examined and analyzed.
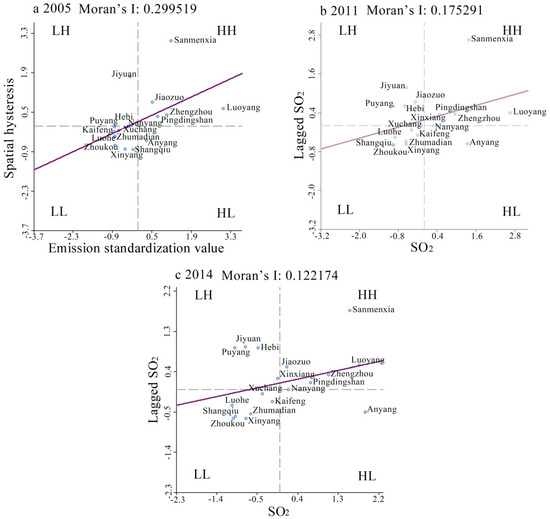
Figure 5.
Moran scatter plot of industrial SO2 emissions in Henan province (a) 2005; (b) 2011; (c) 2014.
Figure 5 shows where HH regions have clustered. These were areas with high and middle-high niche grades. They were in the central and eastern parts of China, most of which were economically developed areas with fast industrial development and high population densities. The LH regions were concentrated in the northern parts of Henan Province. Among them, Jiaozuo City, from 2005 to 2011, was transferred from HH district to LH district through intensified efforts to control air pollution. This was under the influence of the announcement of Notice of Henan People’s Government on Approving and Transferring the Implementation Plan of Henan Province’s Comprehensive Environmental Regulation in 2011.
LL regions were concentrated in areas with low, middle and low niche grades, which had seen slow economic development. Over time, the spatial variation of LL regions was not obvious. HL regions had always been the old industrial base of Anyang City, indicating that its industrial SO2 emissions were always higher than those of surrounding areas. Despite the adoption of regulatory measures and the transfer of some industries, the atmospheric environmental pollution in these regions is still serious. In order to halt the worsening of pollution, it would be necessary to further strengthen the regulations for protecting the atmospheric environment and to improve the restriction on desulfurization and denitrification, energy saving, and emission reduction.
Overall, industrial SO2 emissions of 18 cities in Henan Province gradually shifted to the first quadrant in space (Figure 5), indicating that environmental protection awareness of Henan Province needed to be improved in light of accelerating economic growth and industrial restructuring. Attention should be paid to atmospheric environmental quality to achieve sustainable and coordinated development of “coordination, innovation, green, openness, and sharing”.
3.4. Decoupling Relationship between Industrial Development and Industrial SO2 Emissions
Using Equation (3), the decoupling elasticity coefficient values between industrial output values and industrial SO2 emissions in Henan Province from 2005 to 2014 were calculated and shown in Table 4. Table 4 shows that there were two main decoupling types in Henan Province from 2005 to 2014. They were absolute decoupling and relative decoupling. Among them, 10 cities were in absolute decoupling state. The decoupling index of eight cities in relative decoupling status was below 0.5 except Kaifeng city. This result showed that the environmental pressure of SO2 had been gradually decreasing due to the increase of industrial output values in Henan Province from 2005 to 2014. In terms of the distribution of decoupling status, cities with absolute decoupling status were mostly in the eastern and western wings of Henan Province. Note that the central region was mostly in the relative decoupling status of industrial development and industrial SO2 emissions.
Table 4.
The decoupling index of industrial output and SO2 emissions of Henan province.
As can be seen from Table 4, the industrial output values and SO2 emissions of five cities with high industrial niche are absolutely decoupled. This means the development of industry has not resulted in the increase of industrial SO2 emission. Three cities with middle and high industrial niche grades were in relative decoupling status. They showed a growth rate of emission that was less than that of industrial output values. With this, it seems necessary to take into account the ecological environment while developing the economy by coordinating the two developments. Most cities of middle and low industrial niche cities were in relative decoupling status. Among them, Anyang City, the industrial center of northern Henan Province, and Zhumadian City, which had developed transportation industries in southern Henan Province, were relatively decoupled from industrial SO2 emissions due to their locations and being endowed with resources for industrial activities. Cities graded as low industrial niche were relatively decoupled except Shangqiu City and Xinyang City. On the one hand, it showed that cities located on the edge of provinces were gradually conducting economic development transformation in order to promote economic development. On the other hand, it showed that the ecological environment was affected to a certain extent by economic development.
From the calculation and analysis of the above models, it can be concluded that the association between industrial development and industrial SO2 emissions in Henan Province is not very strong. This indicates that industrial development is probably not the main cause for the increase of industrial SO2 emission. Henan Province is a populous province in China, the urbanization rate reached 45.2% in 2014. However, 14 of the 18 provincial municipalities still have light air pollution, so the situation of atmospheric environment still deserves a lot of attention.
3.5. LDMI Factor Decomposition of Industrial Development and Industrial SO2 Emissions
3.5.1. Trend of Contribution of Total Sub-Indicators
According to the decomposition Equation of an LMDI model, as expressed by Equations (6)–(10), the total contribution of each index to industrial SO2 emissions in Henan Province was calculated and listed in Table 5. Because the industrial structure (ΔS) was expressed by the ratio of the industrial output value of each city and the city’s regional total output value, the value would be a constant (1) in this study. Consequently, this section will not analyze ΔS any further.
Table 5.
The total contribution of each decomposition factor (unit: 104 t).
From a provincial perspective, the scale of output value (ΔY) dominated the increase of SO2 emission. This indicated that the increase of industrial output values promoted regional economic growth. However, at the same time, it also increased the total SO2 emissions. Among the potential influencing factors, the scale of output values contributed the most to SO2 emissions in 2009–2010, reaching 221.588 × 10⁴ t. In terms of energy utilization, energy intensity (ΔQ) and energy structure (ΔV) showed a fluctuating trend, which indicated that economic development and technological progress had impacted on industrial SO2 emission. Before 2012, the increase of energy intensity contributed greatly to emission reduction. Subsequently, the benefits of industrial restructuring and transformation of development modes devoted to energy conservation and emission reduction become increasingly prominent. This led to a significant reduction in emission in 2012–2013 and in 2013–2014; the contribution of technological effects on emission was only relatively small.
3.5.2. Variation of Contribution of Sub-Indicators in Municipalities
In order to further reveal the factors leading to the increase of industrial SO2 emissions in 18 cities in Henan, the contributions of output value scales, energy intensities, energy structures, environmental protection technology effects, and industrial structure to industrial SO2 emissions in each city during the study period were obtained and included in the LMDI model (Figure 6).
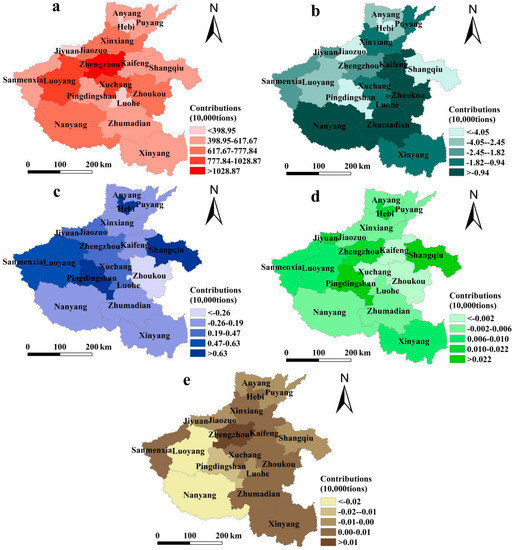
Figure 6.
Spatial distribution of factors to the growth of industrial SO2 emission. (a) output Scale, (b) energy intensity, (c) energy structure, (d) technological factors of environmental protection, (e) industrial structure.
(1) Output Scale
The output value’s size (ΔY) was a significant factor driving the increase of industrial SO2 emission. From 2005 to 2014, changes in the industrial output values of all cities in Henan Province were positive. They were increasing year by year. However, there were also obvious regional differences (Figure 6a). Among them, the peak value of contribution was at the edge of the provincial capital, expanding outward in the form of a “core-edge” spatial pattern. In terms of output values, Zhengzhou contributed the most, Luoyang City and Xuchang City took the second place, while Jiyuan City, Hebi City and Luohe City contributed relatively less. This was because these cities were in the periphery of the study area and the growth rates of industrial output values were relatively low.
(2) Energy intensity
Energy intensity factor (ΔQ) in 2005–2010 drove industrial SO2 emissions in Henan Province into a decreasing trend. In Henan, industrial SO2 emissions increased slowly in 2010–2014. This might have been related to the reduction of energy consumption per unit GDP proposed during the 11th Five-Year Plan period. As shown in Figure 6b, the contribution of industrial SO2 emissions to energy intensity in Henan Province was negative, which meant that the energy consumption per unit output value had decreased year by year. A notable city, Pingdingshan City, had the highest absolute value; with the implementation of the Blue Sky Project and the 1+7 solid implementation program, the proportion of industrial SO2 emissions decreased significantly and the energy intensity decreased from 6.20 in 2005 to 1.27 in 2014, decreasing 79.51% over the study period.
Next were Jiaozuo, Hebi and Shangqiu, which were on the edge of the province. With the transformation and upgrading of industrial structures, their contributions of energy intensities to SO2 emissions in recent years were second to only Pingdingshan. The high value of energy intensity was mostly concentrated in the eastern part of Henan Province. The large-scale development of industrial enterprises in Kaifeng City, Zhoukou City, Zhumadian City, and Nanyang City had resulted in a greater contribution to industrial SO2 emission.
(3) Energy structure
According to Figure 6c, the energy structure of Pingdingshan City, Shangqiu City and Hebi City contributed more to industrial SO2 emissions than that by energy intensity (Figure 6c). The reason was that the energy structure was expressed as the total consumption of coal and fuel oil per unit of energy consumption. The results showed that the total SO2 emissions in Pingdingshan, Shangqiu and Hebi cities decreased from 2005 to 2014 but the total coal and fuel oil consumption increased yearly, with growth rates of 150.01%, 59.99% and 147.80%, respectively. Therefore, economic development effectively dictated the total amount of discharged pollutants. However, to a certain extent, it increased the unit energy consumption, which was also the main reason for the frequent occurrences of foggy and hazy weather in recent years.
The energy structures of Sanmenxia City, Luoyang City, Jiaozuo City, and Xuchang City along the edge of the provincial capital had some controlling effects on industrial SO2 emission. Reduction of coal and fuel oil emissions in Zhoukou City was the most obvious. Its energy structure value was the smallest. On the one hand, there was a lack of coal resources in Zhoukou City, whose economic development was mainly in food processing, textile, clothing, pharmaceutical, and chemical industries. On the other hand, they had responded positively to the call of Blue-Sky Project and achieved certain success in improving air pollution prevention and control.
(4) Technological factors of environmental protection
Environmental protection technology was an important factor for controlling industrial SO2 emission. Affected by energy saving, emission reduction, desulfurization, denitrification, and other atmospheric pollution controls during the 11th and 12th Five-Year Plan period, industrial SO2 emissions in Henan Province showed a slowly decreasing trend from 2005 to 2014. The contribution rates of industrial SO2 emissions in each city sometimes increased positively but negatively at other times. However, the positive values were smaller than the negative ones (Figure 6d). Corresponding to the contribution rates of energy intensity, environmental protection measures such as those in Pingdingshan City, Shangqiu City and Zhengzhou City achieved remarkable results. In recent years, the blind pursuit of industrial economy in Zhoukou, Kaifeng and Xuchang has led to the deterioration of atmospheric quality. The environmental protection efforts in these cities need to be improved.
(5) Industrial structure
Industrial structures, as a potential factor influencing SO2 emission, have shown significant spatial variation among the studied cities. Figure 6e shows the contribution rates of industrial structure factors in seven prefecture-level cities (concentrated in Western Henan). As these values are negative, they indicate that SO2 emissions in the industrial output value of this region has been decreasing. In order to develop the industrial economy in the central and eastern region, the construction and expansion of factories and the receipt of industrial transfers has made a large number of energy-consuming and highly polluting industries settle down there. This seems to have made the environmental impacts caused by the increase of industrial output more and more obvious.
4. Discussion
Different from previous studies, this study first applied the niche method to the research of SO2 pollution and explored the spatio-temporal distribution and the driving factors of industrial development and industrial SO2 emission. It enriches the literature related to industrial SO2 emissions and provides references for upgrading industrial structures and green development [45].
From the perspective of the research methods, the niche method was first employed into the analysis of the relationship of SO2 emissions and industrial development. It showed the effects of the changing laws of urban industrial development. In addition, from the research content, this paper discussed the industrial SO2 emissions and the driving factors in Henan Province from different perspectives in combination with various spatial analytical methods. The results show that, in general, the increase of industrial output values promoted regional economic growth. It also suggested that economic development could be the main driver of the changes in the levels of SO2 emissions [46,47]. The distribution pattern of SO2 emissions among the studied cities is basically consistent with that of industrial output values. This is in accordance with the previous studies [48]. Through the coupling analysis, it was found that the development of the industrial economy in the central region of Henan province did not result in the same degree of growth of SO2 emissions. In the meantime, the cities with high industrial niche might lead to an increase of industrial SO2 emissions to a certain extent. This could be explained by the high levels of output values and the structures of energy consumption. The cities with middle, high and low industrial niche grades in the central region were mostly in the relative decoupling status. In addition, the decoupling index values were below 0.3 for most other cities. This suggested that the industrial economy in the central region did not cause the same degree of growth in industrial SO2 emissions while developing their economies.
Aside from the aforementioned research findings, there are also some limitations in this study. Due to the restriction of data availability, this study paid attention only to the consumption of coal and fuel oil when analyzing driving factors of the structures of energy consumption. It should be noted, however, that this paper has not discussed the increase of industrial SO2 emissions by other energy consumption in depth. In addition, due to the limitation of the LMDI method, the impact of adjusting industrial internal structures on industrial SO2 emissions has not been fully explored. Further analysis and improvement will be made in our future research.
In this paper, industrial niche analysis, spatial-temporal structure and coupling analysis of industrial development and industrial SO2, and the decomposition analysis of the driving factors for industrial development and industrial SO2 emissions were carried out to provide references for environmental pollution control, industrial transformation and upgrading of similar cities in Henan Province in the future.
Few studies in the current literature have been conducted on the relationship between industrial development and industrial SO2 emissions or on recording or decomposing the spatiotemporal coupling effect of the two. In this paper, Henan Province was selected as the study area. Through the coupling analysis of SO2 emissions factors, this study provides needed references for other pollutant research and emission reduction. At the same time, this study provides references for potential outcomes from adjusting industrial structure, promoting industrial transformation and upgrading and regulating environmental pollution.
5. Conclusions
This paper discussed industrial SO2 emissions and its driving factors in Henan Province. The study was carried out from different perspectives in combination with various spatial analytical methods. From the spatial and temporal patterns of industrial development and SO2 emission, except for Zhengzhou and Hebi, the growth rates of industrial output values of other cities were found to have increased with the gradual decrease of industrial niche grades. The effects that output value scale, energy intensity, energy structure, level of environmental protection technology, and industrial structure had on the increase of industrial SO2 emissions were analyzed by using the LMDI factor decomposition method. The results showed that the increase of industrial SO2 emissions was influenced by the factors.
In general, the increase of industrial output values promoted regional economic growth, however, that may also be the cause of the increase of the total SO2 emissions. The distribution pattern of SO2 emissions in each city was found to be basically consistent with that of industrial output values. Through the coupling analysis, it was found that the development of industrial economy in the central region of Henan province had not resulted in the same degree of growth of SO2 emissions. It was also found that cities with high industrial niche grades might be coupled with the increase of industrial SO2 emissions to a certain extent. This could be explained by the high scale of output values and their energy structures. With the government’s attention paid to environmental protection in Henan Province, the SO2 emissions of all cities in Henan Province decreased, but only at a low speed. Hopefully the province can gradually change into having a “green and healthy” industrial structure.
Author Contributions
All authors conceived, designed, and implemented the study. P.Z., B.L. and J.L. designed and carried out the study. Y.L. (Yanyan Li), J.Y. and W.G. participated in the analysis and presentation of analytic results. Y.L. (Ying Liu) and T.R. collected and analyzed data. J.S. contributed the data used in this study. All authors have read and agreed to the published version of the manuscript.
Funding
This research was funded by the National Natural Science Foundation of China, grant number 41601175, 41801362, the key scientific research project of Henan province, grant number 16A610001, the 2018 Young Backbone Teachers Foundation from Henan Province, grant number 2018GGJS019, the Program for Innovative Research Talent in University of Henan Province, grant number 20HASTIT017, Key R&D and extension projects in Henan Province in 2019 (agriculture and social development field), grant number 192102310002, the Innovation Team Cultivation Project of The First-class Discipline in Henan University, grant number 2018YLTD16.
Conflicts of Interest
All authors declare no conflict of interest.
References
- Ma, L.; Zhang, B.; Yang, Y. The spatio-temporal coupling relationship between industrial development with SO2 emission of northeast China. Sci. Geogr. Scinica 2016, 36, 1310–1319. [Google Scholar]
- Wang, Q.S.; Yuan, X.L.; Lai, Y.H.; Ma, C.Y.; Ren, W. Research on interactive coupling mechanism and regularity between urbanization and atmospheric environment: A case study in Shandong Province, China. Stoch. Environ. Res. Risk Assess. 2012, 26, 887–898. [Google Scholar] [CrossRef]
- Chen, R.J.; Wang, X.; Meng, X.; Hu, J.; Zhou, Z.J.; Chen, B.H.; Kan, H.D. Communicating air pollution related health risks to the public: An application of the air quality health index in Shanghai, China. Environ. Int. 2013, 51, 168–173. [Google Scholar] [CrossRef]
- Zhang, P.Y.; He, J.J.; Hong, X.; Zhang, W.; Qin, C.Z.; Pang, B.; Li, Y.Y.; Liu, Y. Carbon sources/sinks analysis of land use changes in China based on Data Envelopment Analysis. J. Clean. Prod. 2018, 204, 702–711. [Google Scholar] [CrossRef]
- Chen, Z.H.; Leizhu, J.H. The spatial-temporal characteristics and economic drivers of environmental pollution changes in China. Geogr. Res. 2015, 34, 2165–2178. [Google Scholar]
- Ministry of Environmental Protection of the People’s Republic of China China’s Environmental Situation Bulletin in 2015. Available online: http://www.mep.gov.cn/hjzl/zghjzkgb/lnzghjzkgb/201606/P020160602333160471955.pdf (accessed on 20 May 2016).
- De Bruyn, S.M. Explaining the environmental Kuznets curve: Structural change and international agreements in reducing sulphur emission. Environ. Dev. Econ. 1997, 2, 485–503. [Google Scholar] [CrossRef]
- Tsurumi, T.; Managi, S. Decomposition of the environmental Kuznets curve: Scale, technique, and composition effects. Environ. Econ. Policy Stud. 2010, 11, 19–36. [Google Scholar] [CrossRef]
- Selden, T.M.; Song, D. Environmental quality and development: Is there a Kuznets curve for air pollution emission. J. Environ. Econ. Manag. 1994, 27, 147–162. [Google Scholar] [CrossRef]
- Davis, I.S. Explaining changes in global sulfur emissions: An econometric decomposition approach. Ecol. Econ. 2002, 42, 201–220. [Google Scholar]
- Antweiler, W.; Copeland, B.R.; Taylor, M.S. Is Free Trade Good for the Environment? Am. Econ. Rev. 2001, 91, 877–908. [Google Scholar] [CrossRef]
- Freitas, L.C.D.; Kaneko, S. Decomposing the decoupling of CO2, emission and economic growth in Brazil. Ecol. Econ. 2011, 70, 1459–1469. [Google Scholar] [CrossRef]
- Climent, F.; Pardo, A. Decoupling factors on the energy–output linkage: The Spanish case. Energy Policy 2007, 35, 522–528. [Google Scholar] [CrossRef]
- Luken, R.A.; Piras, S. A critical overview of industrial energy decoupling programs in six developing countries in Asia. Energy Policy 2011, 39, 3869–3872. [Google Scholar] [CrossRef]
- Hu, Z.Q.; Miao, J.M.; Miao, C.H. Agglomeration characteristics of industrial pollution and their influencing factors on the scale of cities in China. Geogr. Res. 2016, 35, 1470–1482. [Google Scholar]
- Fan, J.T.; Li, J.S.; Luo, J.W.; Hu, L.L.; Xiao, N.W.; Quan, Z.J. Spatial patterns of environmental pollution and economic development in China. Res. Environ. Sci. 2009, 22, 742–746. [Google Scholar]
- Liu, H.; Zhao, J.F.; Wu, H. The heterogeneity of the decoupling of Chinese industries discharging densely different pollutants and industrial transformation. China Popul. Resour. Environ. 2012, 22, 150–155. [Google Scholar]
- Liu, J.R.; Zhang, Z.H. Study on the trend of sulfur dioxide emission and its influencing factors in China. Environ. Pollut. Control. 2012, 34, 100–104. [Google Scholar]
- Gao, C.L.; Gao, G.; Feng, A.Y. Decomposition analysis of regional SO2 emission in China based on LMDI method. Ecol. Environ. Sci. 2012, 21, 470–474. [Google Scholar]
- Ma, S.H.; Wen, Z.G.; Chen, J.N. Scenario Analysis of Sulfur Dioxide Emission Reduction Potential in China’s Iron and Steel Industry. J. Ind. Ecol. 2012, 16, 506–517. [Google Scholar] [CrossRef]
- Liu, Q.L.; Wang, Q. Pathways to SO2, emission reduction in China for 1995–2010: Based on decomposition analysis. Environ. Sci. Policy 2013, 33, 405–415. [Google Scholar] [CrossRef]
- Cheng, L.; Yin, C.B.; Mi, J. Decomposition analysis on spatial features and determinants of changes in industrial pollution: A case study on industrial SO2 emission of Wuxi city. China Popul. Resour. Environ. 2008, 18, 128–132. [Google Scholar]
- Zhao, X.F.; Deng, C.L.; Huang, X.J.; Kwan, M.P. Driving forces and the spatial patterns of industrial sulfur dioxide discharge in China. Sci. Total. Environ. 2017, 577, 279–288. [Google Scholar] [CrossRef] [PubMed]
- Grinnell, J. The niche relationships of the California Thrasher. Auk 1916, 34, 427–433. [Google Scholar] [CrossRef]
- Park, R.E. Human ecology. Am. J. Sociol. 1936, 42, 1–15. [Google Scholar] [CrossRef]
- Hutchinson, G.E. Concluding Remarks. Cold Spring Harbor Symp. Quant 1957, 22, 66–77. [Google Scholar]
- Zhu, M.Q. The niche ecostate-ecorole theory and expansion hypothesis. Acta. Ecol. Sin. 1997, 17, 324–332. [Google Scholar]
- Zhang, G.M.; Xie, S.C. Development of niche concept and its perspectives: A review. Chin. J. Ecol. 1997, 16, 46–51. [Google Scholar]
- Leibold, M.A. The niche concept revisited: Mechanistic models and community context. Ecology 1995, 76, 1371–1382. [Google Scholar] [CrossRef]
- Hu, C.L.; Xiao, L. The pilot application of the niche theories and methods in the research of city. Areal Res. Dev. 2004, 23, 13–16. [Google Scholar]
- Guo, R.M.; Huai, Q.S.; Zhang, L.; Li, M.X. The interactive mechanism of urban expansion and economic development in the different niche of urban: A case study of Guangdong province. J. Nat. Resour. 2016, 31, 800–811. [Google Scholar]
- Li, S.J.; Chen, J. The cooperation-competition model on regional tourism cities of Shandong based niche theory. Econ. Geogr. 2014, 34, 179–185. [Google Scholar]
- Li, J.B.; Zhang, Z.Q.; Qu, J.S.; Xiong, Y.L. Analysis of China’s province carbon dioxide emission spatiotemporal pattern. Econ. Geogr. 2014, 34, 158–165. [Google Scholar]
- Song, M.L.; Wang, S.H.; Huang, B.; Hu, B.H. Analysis of industrial agglomeration and diffusion with spatial econometrics for six provinces in Central China. Geogr. Res. 2012, 31, 534–542. [Google Scholar]
- Zhang, P.Y.; He, J.J.; Hong, X.; Zhang, W.; Qin, C.Z.; Pang, B.; Li, Y.Y.; Liu, Y. Regional-Level carbon emissions modelling and scenario analysis: A STIRPAT case study in Henan Province, China. Sustainability 2017, 9, 2342. [Google Scholar] [CrossRef]
- Shen, H.T.; Lu, Y.Q. Regional disparities and spatial-temporal evolution of China’s provincial and investment. Resour. Environ. Yangtze Basin 2015, 24, 917–924. (In Chinese) [Google Scholar]
- OECD. Indicators to Measure Decoupling of Environmental Pressure from Economic Growth [EB/OL]. Available online: http://www.olis.oecd.org/olis.2002doc.nsf/LinkTo/sg-sd(2002)1-final (accessed on 26 September 2008).
- Zhang, Y.J.; Da, Y.B. The decomposition of energy-related carbon emission and its decoupling with economic growth in China. Renew. Sustain. Energy Rev. 2015, 41, 1255–1266. [Google Scholar] [CrossRef]
- Xia, Y.; Zhong, M.C. Relationship between EKC hypothesis and the decoupling of environmental pollution from economic development: Based on China prefecture-level cities’ decoupling partition. China Popul. Resour. Environ. 2016, 26, 8–16. [Google Scholar]
- Jia, S.J.; Chen, Y.; Zhang, R.Z.; Pei, T.T. Relationship among energy footprint, urban expansion and economic development in Henan province. Areal Res. Dev. 2015, 34, 117–122. [Google Scholar]
- Liu, A.D.; Zeng, H.X.; Liu, W.J. Empirical study of decoupling relationship between carbon emission and export trade in China. China Popul. Resour. Environ. 2014, 24, 73–81. [Google Scholar]
- Geng, Y.; Wang, M.L.; Sarkis, J.; Xue, B.; LinZhang, L.; Fujit, T.; Yu, X.M.; Ren, W.X.; Zhang, L.M.; Dong, H.J. Spatial-temporal patterns and driving factors for industrial waste water emission in China. J. Clean. Prod. 2014, 76, 116–124. [Google Scholar] [CrossRef]
- Shi, Y.L.; Cui, S.H.; Xu, S.; Lin, J.Y.; Huang, W. Factor decomposition of nitrogen oxide emission of China industrial energy consumption. Environ. Sci. Technol. 2014, 37, 355–362. [Google Scholar]
- Duan, X.M.; Tong, Z.W. Decomposition analysis of carbon emission from energy consumption in Zhejiang province based on LMDI method. J. Beijing Univ. Posts Telecommun. (Soc. Sci. Ed.) 2011, 13, 68–75. (In Chinese) [Google Scholar]
- Lu, Q.; Zheng, J.Y.; Ye, S.Q.; Shen, X.L.; Yuan, Z.B.; Yin, S.S. Emission trends and source characteristics of SO2, NOx, PM10 and VOCs in the Pearl River Delta region from 2000 to 2009. Atmos. Environ. 2013, 76, 11–20. [Google Scholar] [CrossRef]
- Shi, X. China’s attempts to minimize non-CO2 emissions from coal: Evidence of declining emission intensity. Environ. Dev. Econ. 2011, 16, 573–590. [Google Scholar] [CrossRef]
- Lyu, W.N.; Li, Y.; Guan, D.B.; Zhao, H.Y.; Zhang, Q.; Liu, Z. Driving forces of Chinese primary air pollution emissions: An index decomposition analysis. J. Clean. Prod. 2016, 133, 136–144. [Google Scholar] [CrossRef]
- Qian, Y.; Cao, H.; Huang, S.M. Decoupling and decomposition analysis of industrial sulfur dioxide emissions from the industrial economy in 30 Chinese provinces. J. Environ. Manag. 2020, 260, 110142. [Google Scholar] [CrossRef] [PubMed]


© 2020 by the authors. Licensee MDPI, Basel, Switzerland. This article is an open access article distributed under the terms and conditions of the Creative Commons Attribution (CC BY) license (http://creativecommons.org/licenses/by/4.0/).