1. Introduction
Urban transportation is an important support for the economic development of the cities, which profoundly affects the living quality of citizens, the efficiency of logistics, as well as other factors related with transport. With the increase of population and the continuous expansion of the urban city, urban traffic is increasing rapidly and this massive traffic puts enormous pressure on road networks. Traffic congestion has become more serious due to the imbalance between infrastructure capacity and travel demands. Due to their high-capacity, speed and reliability, metro systems can effectively alleviate the problems of urban traffic congestion. Therefore, how to understand the spatial and temporal distribution of passengers deeply and accurately, so as to provide theoretical support for the planning and operation of the metro network, is an urgent issue of wide concern.
As an essential part of the public transportation systems in big cities, metro systems can address the massive travel demand of citizens thanks to their low price and arrival accuracy. Recently, a large amount of works have focused on passenger forecasting [
1,
2,
3], network planning [
4] and human travel analysis [
5,
6,
7] in metro systems. The fast development of information technology has enabled researchers to obtain data reflecting travels through various means, such as GPS [
8,
9], mobile phones [
10], and smart card systems [
11,
12,
13,
14]. The emergence of large-scale data brings us new opportunities to better understand the characteristic of individual movement. Specifically, some scholars have explored human activity patterns by analyzing the spatial-temporal characteristic of travel [
15,
16,
17,
18,
19]. Zhang et al. [
15] applied a density-based method for identifying so-called temporal areas of interest (TAI), and found that there are four major types of TAIs on weekdays, namely work-like, morning, afternoon and nightlife TAIs, and three on weekends, namely work-like, day activity and nightlife TAIs. Using visualization techniques, Sun et al. [
16] demonstrated the spatial and temporal distributions of passenger flows in a holistic manner, as well as the flow directional imbalances. Zhao et al. [
17] used statistical-based and unsupervised clustering-based methods to understand the hidden regularities and anomalies of travel patterns and classify passengers in terms of the similarity of their travel patterns.
Furthermore, the prediction of passengers’ future trajectories [
20,
21,
22,
23,
24] is also an important issue in transit systems. Yang et al. [
20] argued that future movements of different types of groups can be predicted with high confidence based on previous records. Truong et al. [
21] effectively predicted the in- and outflow of passengers at a station over time based on the patterns of passenger flow with respect to time and stations. In the study [
22], Shanghai was taken as a case study to discuss the location choice of after-work activities, passengers are more likely to choose a station even closer to home in terms of network distance. Based on previous research, we can draw the conclusion that passengers’ behavior has a high potential to be recognized, categorized as well as predicted [
24]. Besides, the study of individual mobility patterns has been paid much attention from researchers [
25,
26,
27,
28,
29,
30]. Sun et al. [
25] utilized a data-driven approach to characterize the collective mobility patterns from high dimensional structured datasets. Taking Shanghai as a case study, Du et al. [
26] adopted a dual-perspective on passengers’ activity patterns to investigate the spatial and temporal dimensions of individuals travelling decision making. However, the appearance of new metro lines may significantly affect individual mobility in the metro network. Kim et al. [
27] studied the changes of metro passenger flow and travel time due to the operation of new metro line. Liu et al. [
29] evaluated the impact of new lines on passenger flow of existing stations in urban metro system and found new transfer stations attracted more passengers than other existing stations.
Although many scholars have studied the passenger behavior of metro systems, there still exist some challenges in current works. The data collected from smart cards in metro systems is huge and complicated, and traditional methods find it difficult to deal with the issues concerning the multi-dimensional features of original data. Principal component analysis (PCA) and non-negative matrix factorization (NMF) [
31] usually expand the original data into a two-dimensional matrix in the data process, which loses the structure information of the original data and the solution often appears unreasonable. Given its strength in retrieving and storing information from large datasets, tensor decomposition [
32] has also attracted more and more attention in the field of transportation data analysis. By using tensor storage strategy, the smart card data from metro systems can retain the original structure information, so we can analyze the information of different dimensions at the same time. Some scholars have proposed the use of non-negative CANDECOMP/PARAFAC (NCP) factorization [
33,
34], which adds non-negative constraints to the tensor decomposition process to reduce the ambiguity of the decomposition results.
Negative values are difficult to explain in the matrix elements of tensor decomposition, so we apply NCP decomposition [
35] with alternating Poisson regression on a two-dimensional tensor constructed from smart card data to analyze the spatial-temporal characteristics of passengers’ travel. The urban mobility discussed in this study refers to a specific travel mode, and this paper is dedicated to explore passengers’ travel patterns based on smart card data from an urban metro network. We also want to introduce a framework using a tensor-based model to understand travel behaviors. The travel behavior discussed in this paper refers to the trips of passengers with different travel purposes using the urban metro network. We applied NCP decomposition to uncover the characteristic of travel patterns from temporal and spatial dimension in the metro network of Shenzhen City. Then, utilizing correlation analysis, we establish a correlation among different days and extract some stable components from the individual mobility. Excluding the occasional factors such as weather and activity, the characteristics of the stable mobility patterns can be explored both in the temporal and spatial dimension. Next, based on the POI data collected in Shenzhen City, the function of the station is set and then we further analyze the spatial distribution characteristics of different travel patterns. Furthermore, we explored the distribution of travel time classified according to the distribution characteristics based on the three basic stable patterns in the temporal and spatial dimension. The individual records are classified into different patterns and the most likely travel time is analyzed by category.
The remainder of this study is organized as follows: In
Section 2, we describe the data sources for the study. In
Section 3, we introduce the framework of probabilistic factorization based on NCP decomposition and construct the tensor model. In
Section 4, we analyze the spatial and temporal characteristics of the daily collective mobility patterns based on the tensor decomposition results. In
Section 5, we use correlation analysis to identify stable basic patterns for the spatio-temporal distribution under the stable basic patterns. Finally,
Section 6 summarizes the key findings.
3. Methodology
As the amount of data collected from smart cards in metro systems is huge, and the complexity of the data increases with the dimensions of its contents, it is difficult for traditional and basic statistical methods to deal with this data source. The tensor-based model we applied in this study can extract multi-dimensional features from an original dataset. The passengers’ spatio-temporal characteristics of different travel patterns can be quantified based on tensor decomposition. Tensor decomposition is a high-dimensional generalization of singular value decomposition (SVD) and principal component analysis (PCA), which includes two types of tensor decomposition techniques: Tucker decomposition and CP decomposition. Tucker decomposition is a high-order principal component analysis method that decomposes a tensor into a core tensor multiplied by a corresponding factor matrix along each dimension. The CP decomposition decomposes a high-dimensional tensor into a sum of component rank-one tensors. The rank one tensor is a special tensor type. If an N-way tensor can be expressed by the outer product of N vectors, then this is a rank one tensor. In this study, we apply the CP decomposition to analyze the spatial-temporal characteristics of urban travels.
The CP decomposition process can be explained by a third-order tensor X ∈ R
I×J×K show in
Figure 3, where I, J, K are the dimension along the
pth way (
p ∈ {1,2,3}). The approximate decomposition of a three-dimensional tensor X can be defined [
32] as follows:
where R is a positive integer and
∈ R
I,
∈ R
J,
∈ R
K, r = 1,……,R. The symbol
means vector outer product and
is a rank-one tensor. The CP decomposition of a tensor is a sum of R rank-one component tensors (we call R the rank of tensor X).
The element of the tensor X can be expressed as:
where i = 1,...,I, j = 1,...,J, k = 1,...,K, we use i, j, k to denote the index of each dimension and we denote by
the value of the element of the tensor X.
Fibers [
32] are the higher order analogue of matrix rows and columns. A fiber is defined by fixing every index but one. Third-order tensors have column, row, and tube fibers, denoted by
,
and
, respectively. Slices are two-dimensional sections of a tensor, defined by fixing all but two indices. Third-order tensors have the horizontal, lateral, and frontal slides, denoted by
,
and
, respectively. The kth frontal slice
of a third-order tensor may also be denoted as
.
The factor matrix refers to the combination of the vectors from the rank-one component, A = [a
1 a
2 … a
R], B = [b
1 b
2 …b
R], C = [c
1 c
2 … c
R]. Matricization is the process of recording the elements of a multi-dimension tensor into a matrix. Using the factor matrix, the three matricized versions on one per dimension are:
where
denotes the Khatri-Rao product. Given matrices A ∈
and B ∈
, their Khatri-Rao product is denoted by
B. The result is a matrix of size (IJ) × K.
The columns of A, B and C are normalized to length one with the weights of lambda. Where λ ∈ R
R, X can be approximately decomposed into Equation (6):
The three-dimensional tensor can be extended to N-dimensional tensor [
32] and written as:
However, the matrix elements of tensor decomposition can be positive or negative. The existence of negative values in the decomposition results is correct from the point of view of mathematical operation, but negative values are difficult to explain in practical problems. We apply NCP decomposition [
35] with alternating Poisson regression to uncover the characteristic of travel patterns in the Shenzhen metro network. The method we applied is appropriate for nonnegative integer values used in smart card data, which adds non-negative constraints to the tensor decomposition process.
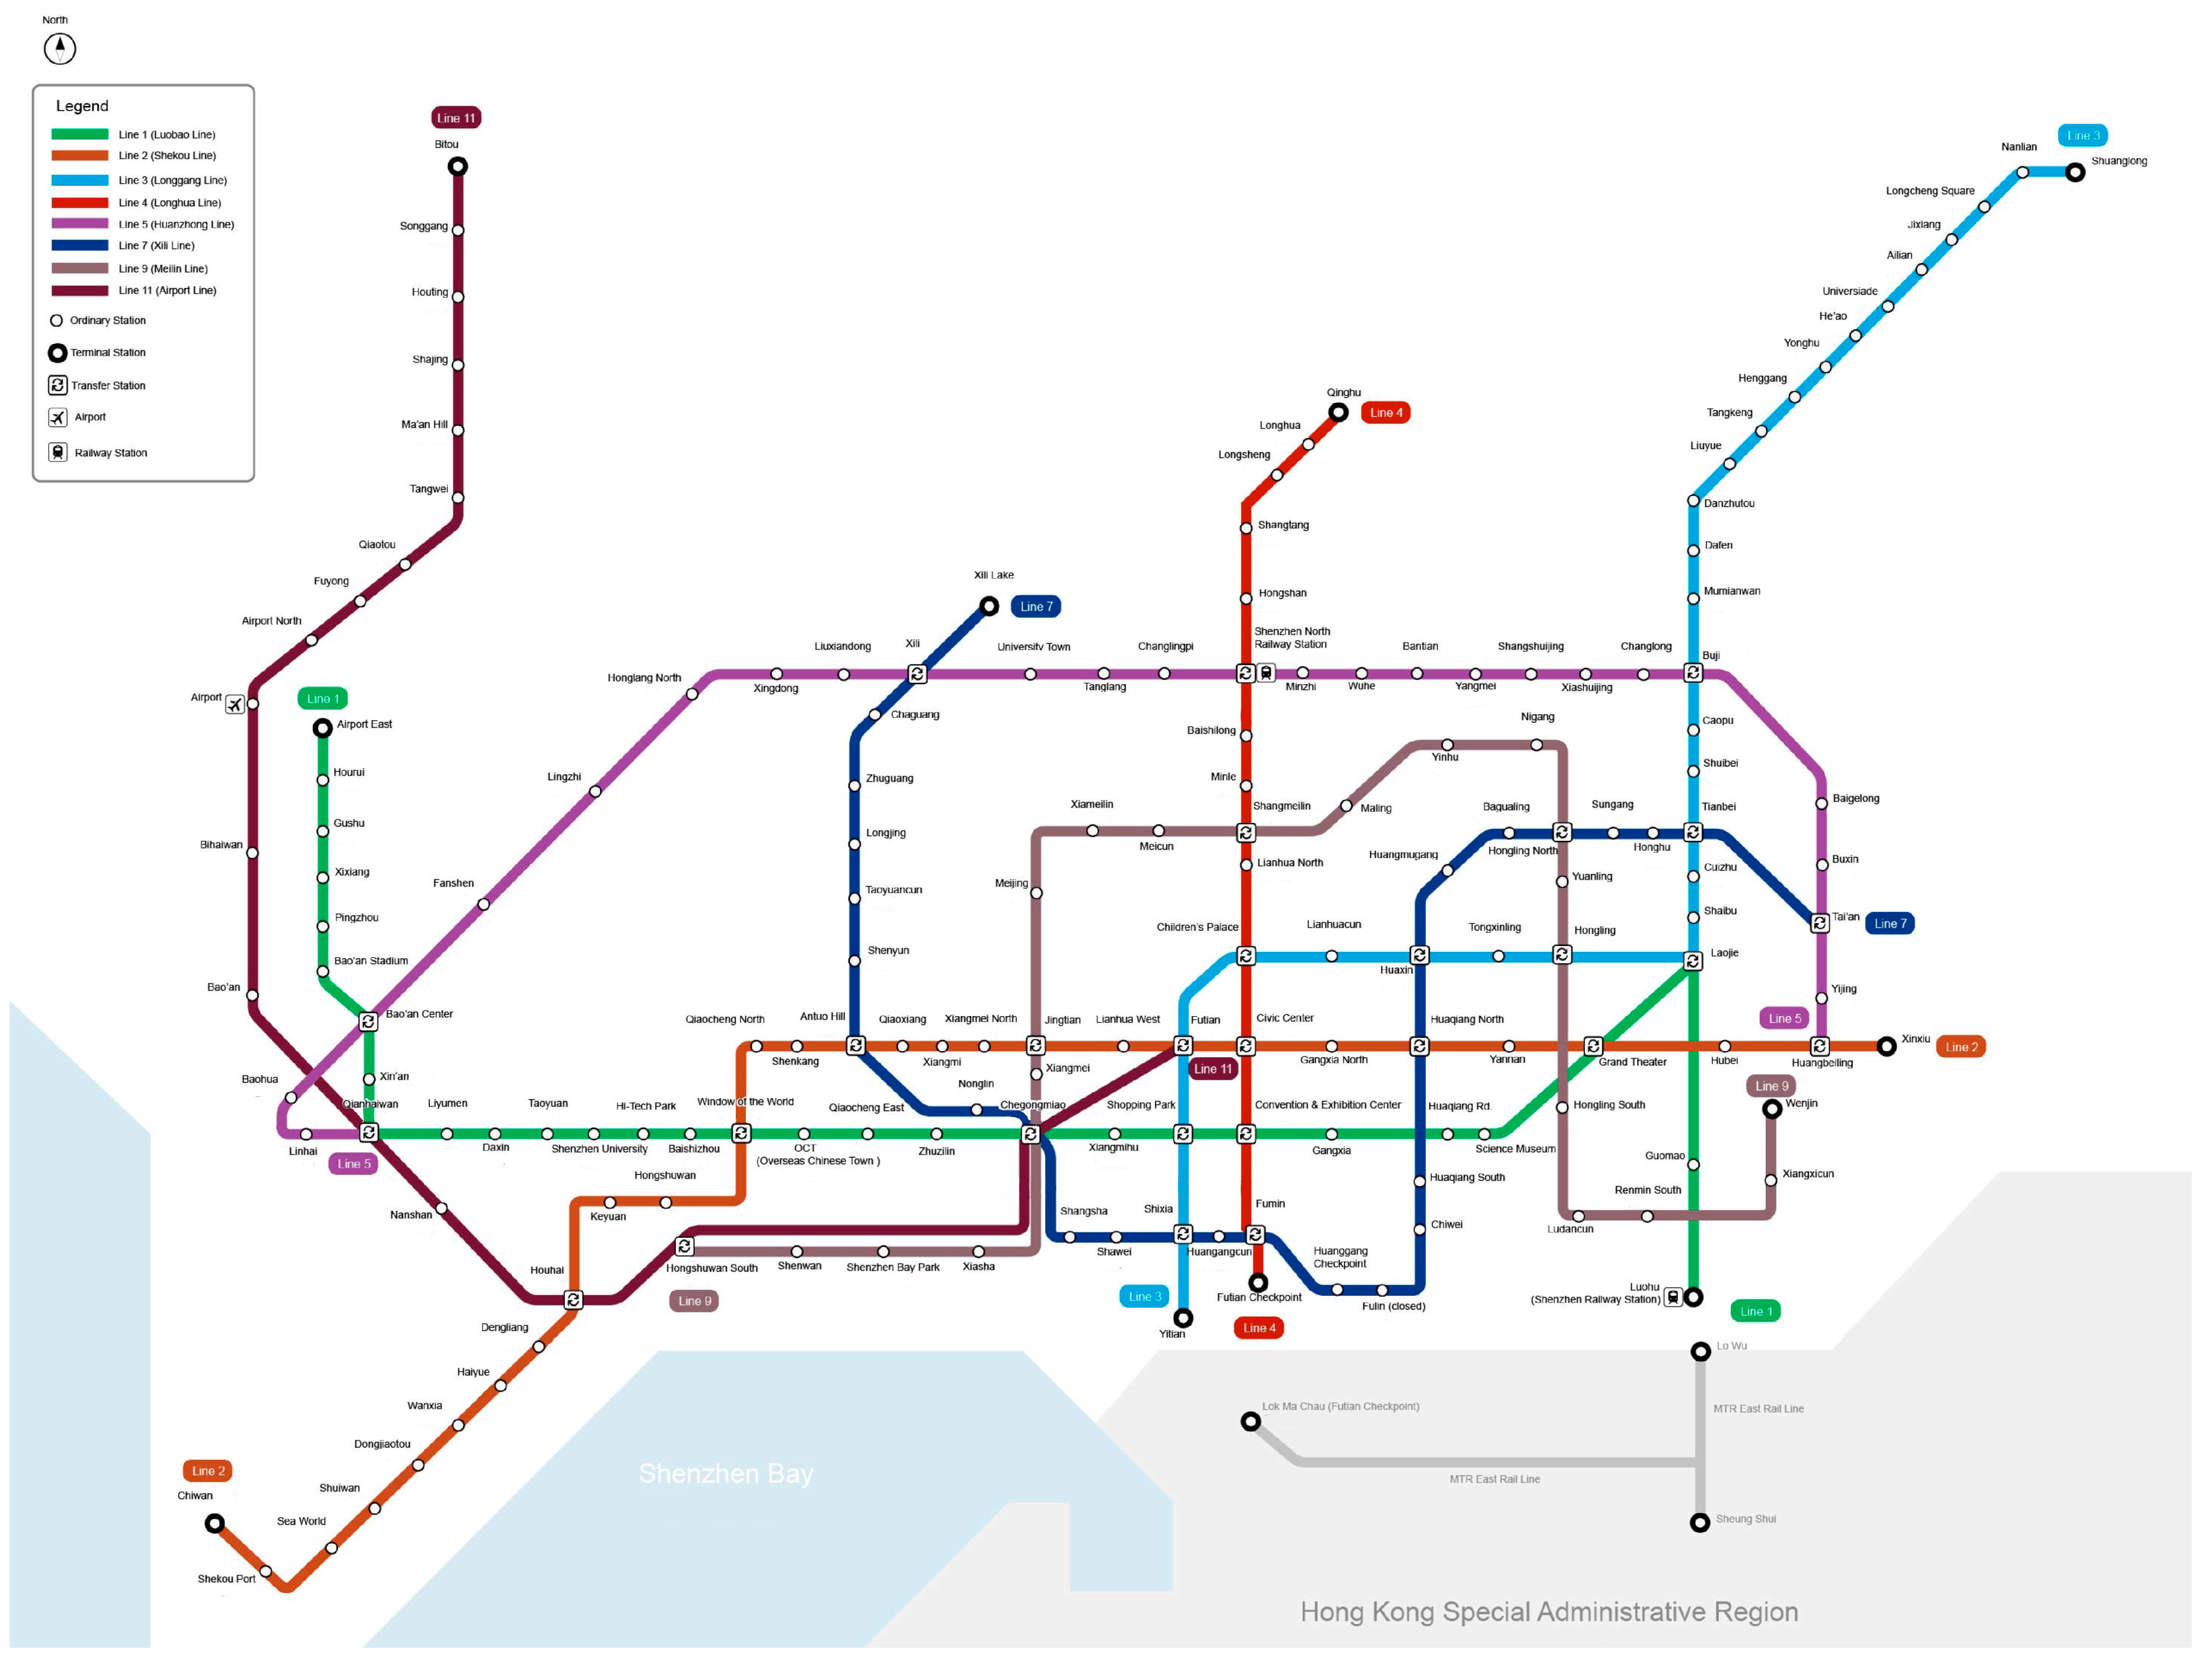
We have extracted a total of 167 metro stations from eight metro lines, and the original data collected from 5:00 to 23:00 is divided into 18 time periods of one hour. Meanwhile, the passenger volumes were collected at entry and exit stations in the metro system at different time periods. Therefore, the departure station tensor Mo = (departure station, time slot) and arrival station tensor Md = (arrival station, time slot) are constructed, and its collective mode is M ∈ R+
167×18. The collective mobility is decomposed into a linear combination of several basic modes of movement by NCP decomposition:
Equation (8) decomposes the matrix M ∈ R+m×n into R components, each component i includes one eigenvalue and two vectors, ∈ R+m×1 and ∈ R+n×1. In this study, the collective mobility patterns M ∈ R+167×18 are decomposed into several basic patterns. ∈ R+18×1 represents the temporal distribution. ∈ R+167×1 represents the corresponding spatial information, which indicates the probability of arriving or leaving the metro stations. Therefore, we obtain the components representing the basic mobility patterns from the collective mobility patterns through NCP decomposition.
Taking the departure station tensor Mo = (departure station, time slot) in a specific day as example, its mobility patterns can be expressed as Mo ∈ R
+167×18. We define the NCP decomposition of the departure station tensor Mo as Equation (9):
This can be further expressed as Equation (10):
4. The Spatial-Temporal Characteristics Analysis of Travel Patterns
Using the tensor toolbox [
35] in MATLAB, we performed NCP decomposition to explore the number of basic mobility patterns. Through repeated experiment and analysis of tensor composition results, we found that when the number of basic mobility patterns R=3, the extracted travel modes expressed obvious differences in spato-temporal dimension. If we set R = 4 or more, the travel modes extracted from tensor decomposition are unreasonable and cannot be in accordance with daily travel regularity. The three basic mobility patterns have been confirmed by scholars [
31,
37] to be appropriate for understanding the spatial-temporal characteristics of travel patterns.
The collective model is decomposed into three components, and the characteristics of travel behavior of the three components in the temporal dimension show in
Figure 4a,c,e. Departure-1 indicates the temporal distribution in the morning peak hours of passengers traveling in Shenzhen metro system during the weekday. Departure-2 indicates the temporal distribution in the evening peak hours during the weekday. Departure-3 indicates the temporal distribution of the daily hours in weekday. All the results shown in
Figure 4 are the average calculating results from three weeks.
According to the decomposition result, the spatial distribution characteristics of travel behavior corresponding to the temporal distribution of the three components can be analyzed simultaneously. In the spatial dimension, we use a thermodynamic chart to show the spatial distribution of each metro station. The right part of
Figure 4b,d,f shows the spatial distribution of travel behavior.
The Shenzhen metro network covers most areas from the city center to the suburbs. The network structure of the route makes travel in Shenzhen City become more convenient. The results in
Figure 4 show that Departure-1 has obvious peak traffic during the morning period, the peak hours range between 7:30 and 9:00, and the value reaches peak at 8:00. At this time, passenger trip is mainly distributed in the surrounding areas and scattered in the downtown areas of the city, specifically Pengzhou, Wuhe, Buji, Qinghu and Minzhi are the main stations. According to the extracted POI data of Shenzhen City,
Figure 5 shows that most of the residential areas in Shenzhen are located in the surrounding areas and scattered downtown areas of the city. We can find that traffic travel is mainly distributed in residential areas during the morning peak hours on weekdays.
Departure-2 expresses peak passenger volume during the evening hours, and the peak hours range between 17:00 and 20:00, and the value reaches maximum at 18:00. At this time, traffic travel is mainly distributed in the downtown area of the city, with Chegongmiao, Shenda, Gaoxinyuan, Convention and Exhibition Center and Huaqiang North being the main stations. According to the extracted POI data of Shenzhen city,
Figure 5 shows that companies are mostly distributed around the center of the city. We can find that traffic travel is mainly distributed in companies’ areas during the evening peak hours on weekdays. So, on weekdays, passengers leave the residential area around the city during the morning peak hours, and return to the residential areas from the work area of the city center during the evening peak hours.
Departure-3 shows a significant decline in the proportion of passenger volume in each period, and there is no obvious peak volume. The urban travel is mainly distributed in the central area and scattered around city, which belongs to the daily transition mode between Departure-1 and Departure-2.
5. Analysis of Travel Characteristics Combined with POI Data
We have decomposed the departure station tensor Mo = (departure station, time slot) into several basic patterns in
Section 4. However, for the components of the basic patterns, some are stable, and others are occasional due to specific reasons (such as weather and activities). Utilizing correlation analysis, we establish correlation among different days and extract some stable components from the collective mobility to analyze the temporal distribution in stable basic mobility patterns in
Section 5.1. Next, the functions of the station are set based on the POI data collected in Shenzhen City, and then we further analyze the spatial distribution characteristics in stable basic mobility patterns in
Section 5.2. Furthermore, we classify individual records into different patterns and the travel time is analyzed for each category in
Section 5.3.
5.1. Analysis of the Correlation Among Daily Travels
After constructing the departure station tensor Mo = (departure station, time slot) and arrival station tensor Md = (arrival station, time slot), through the process of nonnegative CP decomposition, different mobility patterns are explored. Next, in order to compare the basic patterns of daily travels, it is necessary to establish correlations among different days so that we can examine the changes in passenger flow at the stations on different days. For all the stations, we used the average of passenger volume in one specific day (from Monday to Sunday) of several weeks, and use correlation coefficients to describe the similarity of each basic pattern. In order to establish correlation between day m and day n, the tensor decomposition results are as shown in Equations (11) and (12):
Then, we calculate the correlation coefficient of the spatial distribution of the
component of day m and the
component of day n by:
In this formula, denotes the element of the component of day m, and denotes the element of the component of day n. We set that if the correlation coefficient is greater than the threshold, then the component of day m and the component of day n are considered to be the same basic pattern. If for all n, there is j, the correlation coefficient is greater than the threshold, then the component of day m and the component of day n are considered to be a stable basic pattern. If, for all n, all j makes the correlation coefficient less than the threshold, then the component of day m and the component of day n are considered to be an occasional basic pattern.
We decompose the departure station tensor Mo = (departure station, time slot) and arrival station tensor Md = (arrival station, time slot) constructed from the Shenzhen Metro smart card data for three weeks. The specific days (from Monday to Sunday) in the three weeks have similar spatial and temporal distribution based on tensor decomposition results. According to the correlation coefficient formula, the correlation coefficients between the components of average Mo and Md in specific days of three weeks were calculated respectively. Take Monday as an example,
and
are constructed from the average of passenger volume of Monday in three weeks. The calculation results are shown in the
Table A1 and
Table A2 of
Appendix A. The threshold of correlation coefficient is set at 0.8. The positions with correlation coefficient greater than 0.8 are marked in red in the tables.
According to the calculation results of the correlation coefficient, the stable patterns appear almost every day. We extract the data of the stable basic patterns of the departure station tensor Mo and the arrival station tensor Md, and take the average value of each component as the departure and arrival stable mobility pattern.
Figure 6 shows the temporal distribution of stable departure and arrival patterns for Metro passengers on weekdays and weekends. We find the stable basic patterns of weekdays and weekends have different characteristics for travel departure and arrival.
As can be seen from
Figure 6, during the weekday, in the departure station, passenger volume reaches the peak at 8:00, the probability accounts for nearly 0.3. On the weekend, the peak volume is expressed at 8:00, but the proportion of the trip numbers greatly reduced. The trips are mainly concentrated during the 7:00–9:00 period. During the weekday, passenger volume in arrival station has obvious evening peak at 18:00. While trip in arrival station during weekends is mainly concentrated between 17:00–22:00, and the time is relatively scattered.
There are still some differences in the temporal distribution. During peak hours on weekdays, whether it is departing or arriving at the metro station, urban trips mainly occur at 8:00 am and 6:00 pm. The peak value is relatively high and the duration of the relatively high capacity is short. This means that passenger volume is generated in the morning and evening peak hours on weekdays, and a large number of people take the metro network as the first choice for commute in a short time. However, during the weekends, the peak hours appear slightly later than on weekdays. The peak value is lower and duration of the relatively high capacity is longer. Since passengers are not limited by rigid working timetables on weekends, the change of passenger flow over time is slower than that of weekdays.
5.2. Analysis of Travel Spatial Characteristics
The analysis of the temporal distribution of travel is studied in
Section 5.1. In order to further understand the stable movement pattern of passengers’ travel in Shenzhen Metro, the analysis of spatial distribution of travel will be studied in this section. We extracted more than 21,000 point-of-interest information from APIs in the Baidu map and classified them into seven major categories: R, C, L, T, F, M and E. Based on the extracted POI information, one primary function is assigned to each metro station using following method: we firstly search all the POIs within a radius of 1000 m for each metro station, then the specific category that covers the largest proportion of POIs is set to be the primary function for the station. For example, the station“ShenZhenBeiZhan” is described as transportation hub (T) and the station“ShaoNianGong” is assigned as the function of leisure and entertainment (L). Furthermore, the 30 metro stations with highest visiting frequency are identified for each mode based on the result of tensor decomposition, and then set their primary functions as the feature of the mode.
Table 2 shows the spatial distribution of the stable departure and arrival patterns of urban travel on weekdays and weekends. From the
Table 2, we can see Weekday-Departure is decomposed into three basic modes. For Mode-1, we extracted the 30 stations with high visiting frequency in the spatial dimension and found that the passenger source comes from residential areas and leisure and entertainment. The spatial distribution characteristic of Mode-1 is composed of 40% [R] +16.7% [L] + 13.3% [C] +13.3% [T] +10% [F] + 3.3% [M] +3.3% [E], then the feature of Mode-1 can be defined as [R] for its highest proportion. For the Mode-2, in the stations with high visiting frequency, ten of them belong to the corporate companies, six stations belong to the residential area, five stations belong to leisure and entertainment, four stations belong to transportation hub, three stations belong to gourmet restaurant, one station belongs to medical institution and one station belongs to education institution. The spatial distribution characteristic of Mode-2 is composed of 33.3% [C] +20% [R] + 16.7% [L] +13.3% [T] +10% [F] + 3.3% [M] + 3.3% [E], then the feature of Mode-2 can be identified as [C]. Similarly, the spatial distribution characteristic of Mode-3 is composed of 30% [L] +20% [R] + 16.7% [C] +13.3% [F] +10% [T] + 6.7% [E] + 3.3% [M], then the feature of Mode-3 can be identified as [L]. For the weekday, passengers travel from the residential area to the corporate area at the morning peak, and go to the residential area from the corporate area at the evening peak. For the weekend, passengers travel from the residential area to the entertainment area and corporate area at the morning peak, and from the entertainment area, corporate area to the residential area at the evening peak. Most of the metro trips do not provide door-to-door service, so it may be necessary to transfer by other means in the transportation hub area.
5.3. Analysis of Travel Time Distribution
We extract the records of different modes based on the tensor decomposition results and then analyze their statistical characteristics. The travel time distribution of passengers is a key factor to evaluate the operating efficiency of a metro network. Taking the travel time as an example, the daily record data is divided into three categories according to their departure/arrival time and the metro station. Millions of passengers’ records of the specific weekday (6 April 2017) and the weekend (8 April 2017) were extracted by category, and the travel time of each passenger was calculated. The distribution characterization of travel time on weekday and weekend was analyzed according to different classes.
Class-1 corresponds to the early peak period represented by mode-1. On weekdays, we extracted the records from 7:00 to 8:00, the departure station function is R, and the arrival station function is C. On weekends, we extracted the records from 7:00 to 8:00, the departure station function is R, and the arrival station function is L. Class-2 corresponds to the early peak period represented by mode-2. On weekdays, we extracted the records from 17:00 to 18:00, the departure station function is C, and the arrival station function is R. On weekends, we extracted the records from 17:00 to 18:00, the departure station function is L, and the arrival station function is R. Class-3 corresponds to the daily period represented by mode-3, its travel time distribution becomes more stable, there is no obvious peak time, and its spatial distribution characteristics have no obvious statistical rules, so we did not perform further analysis for Class-3. Based on the classification, the proportion of travel time at one minute’s intervals is calculated. The fitting degree results of four function distribution are shown in
Table 3. We can see that the Gaussian mixture model has the best fitting results, whose probability density obeys the distribution
.
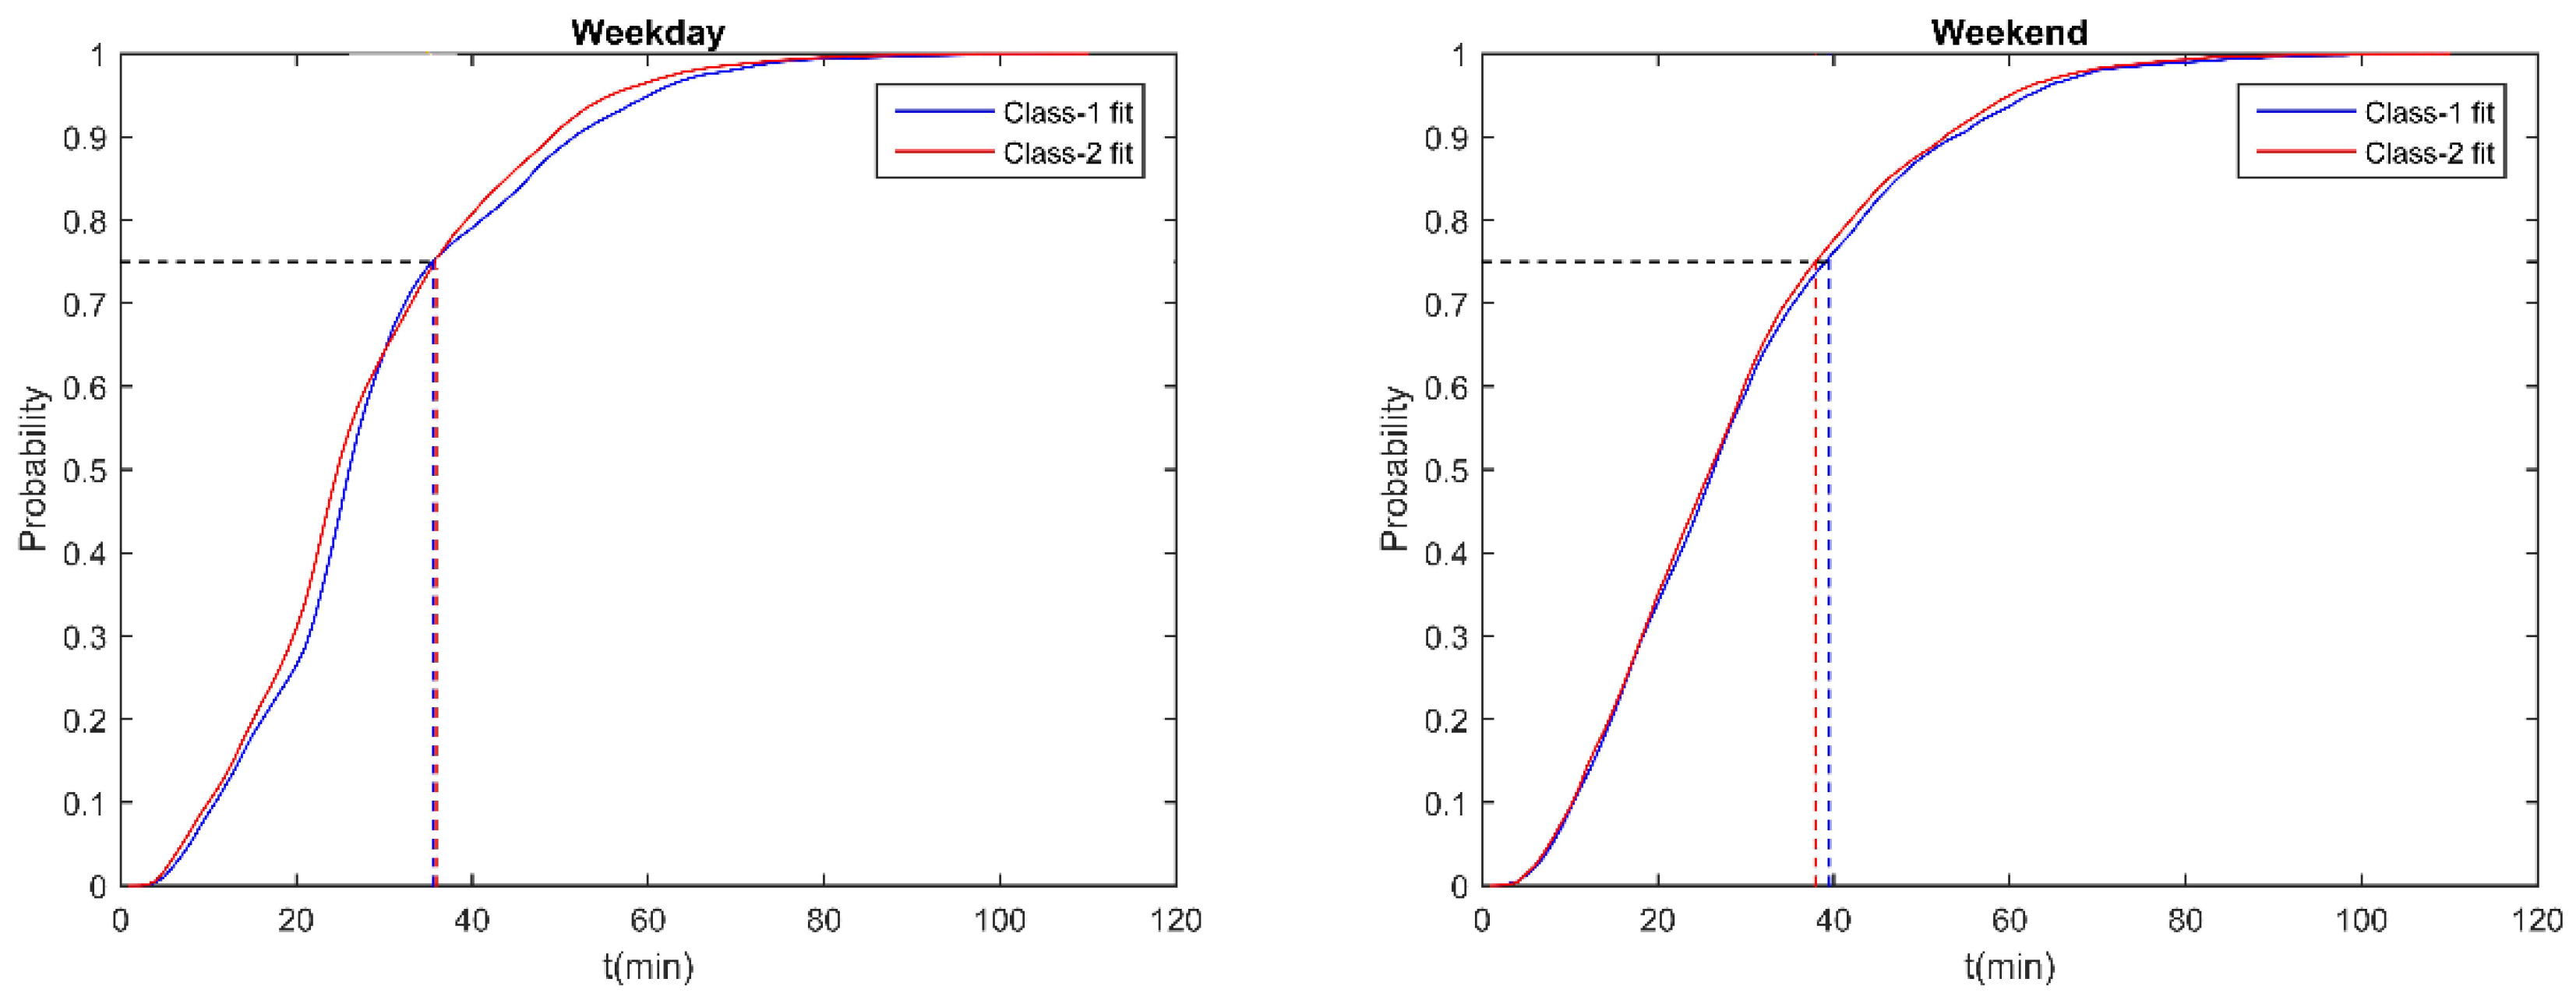
Figure 7 expresses the proportion of travel volume in five minutes’ interval in travel records of the class. We found that the probability distribution of travel time of different classes had slight differences, which may be caused by the travel of the same station function (R & C in weekday, R & L in weekend). The cumulative probabilistic distribution of travel time is similar between weekdays and weekends in the
Figure 8. We obtained the position of the third-quartile t
0, which represent high travel probability within the travel time t
0. On weekdays, for Class-1, t
0 is 35.5 min; for Class-2, t
0 is 35.6 min. On weekends, for Class-1 and Class-2, t
0 is 37.9 min and 39.5 min.
6. Conclusions
The smart card data collected from a metro system were used to analyze the characteristics of urban metro passenger flow, urban spatial functional structure and travel behaviors. The whole mobility is considered as a combination of several basic patterns. Applying tensor decomposition and correlation analysis, stable components are extracted from collective movement data, and each pattern is analyzed according to the primary function of the metro station by using POI information. The main conclusion of this study can be summarized as follows:
- (1)
The departure and arrival mobility of weekdays and weekends can be decomposed into several stable basic modes by tensor decomposition. For example, it can be decomposed into morning peak hours, evening peak hours and daily pattern.
- (2)
Based on the tensor decomposition results and correlation analysis, stable and occasional patterns are distinguished.
- (3)
On weekdays, passengers’ travel broke out in the morning and evening peak hours. However, on weekends, the peak hours are slightly later than on weekdays. The peak period lasted for a long time, and the passengers’ travel in the peak period decreased significantly. Since passengers are not limited by rigid work requirements on weekends, liquidity is more random and uniform and the change of passengers’ flow is slower than that of weekdays.
- (4)
The typical stable patterns on weekdays mainly involve travel between residential and workplace. The typical stable patterns on weekends mainly involve travel between residential and entertainment.
- (5)
The travel time of passengers is calculated based on the classification. We find the travel time distribution is similar between different classes, which mainly caused by the travel of stations with same function, and the metro travel time with highest travel probability is within 35–40 min. Above all, we try to apply a tensor decomposition perspective to depict the spatial-temporal characteristic of passenger flow on the metro network.
What we found in this study has important reference value for the planning and operation of metro networks, which contributes to a better understanding travel behavior. Identifying the spatial-temporal characteristic of trips can help administrations strengthen the management and operations of stations so that the service level and quality of safety can be improved in the public traffic system. Meanwhile, the departure interval of metros can be specifically adjusted in all directions and metro ridership can be improved efficiently.
This study could be extended in the following ways: (1) The research based on metro smart card data does not fully reflect all aspects of urban public transport travel, such as bicycle trips, private cars, taxis, buses and other travel behavior, so we could further study the spatial-temporal interplay between different mass transit modes in the future; (2) We only used smart card data for three consecutive weeks on normal conditions, in the next step, the spatial-temporal characteristic of travel patterns is necessary to be explored under different conditions, such as severe weather, large-scale activities, emergencies and so on; (3) The tensor can be further constructed a multi-dimensional model, which not only includes spatial-temporal information but also information about transport mode and different types of public transport passengers and so on; (4) Travel behavior is affected by many factors, such as passengers’ income level, personal preference, age and so on, so travel behavior characteristics under the influence of multiple factors can be further explored.

