Challenge for Planning by Using Cluster Methodology: The Case Study of the Algarve Region
Abstract
1. Introduction
1.1. Tourism and Sustainability Indicators
1.2. Data Analysis of Sustainability Indicators
1.3. Aim of This Study
2. Methodology
2.1. Area of Study: Algarve Region
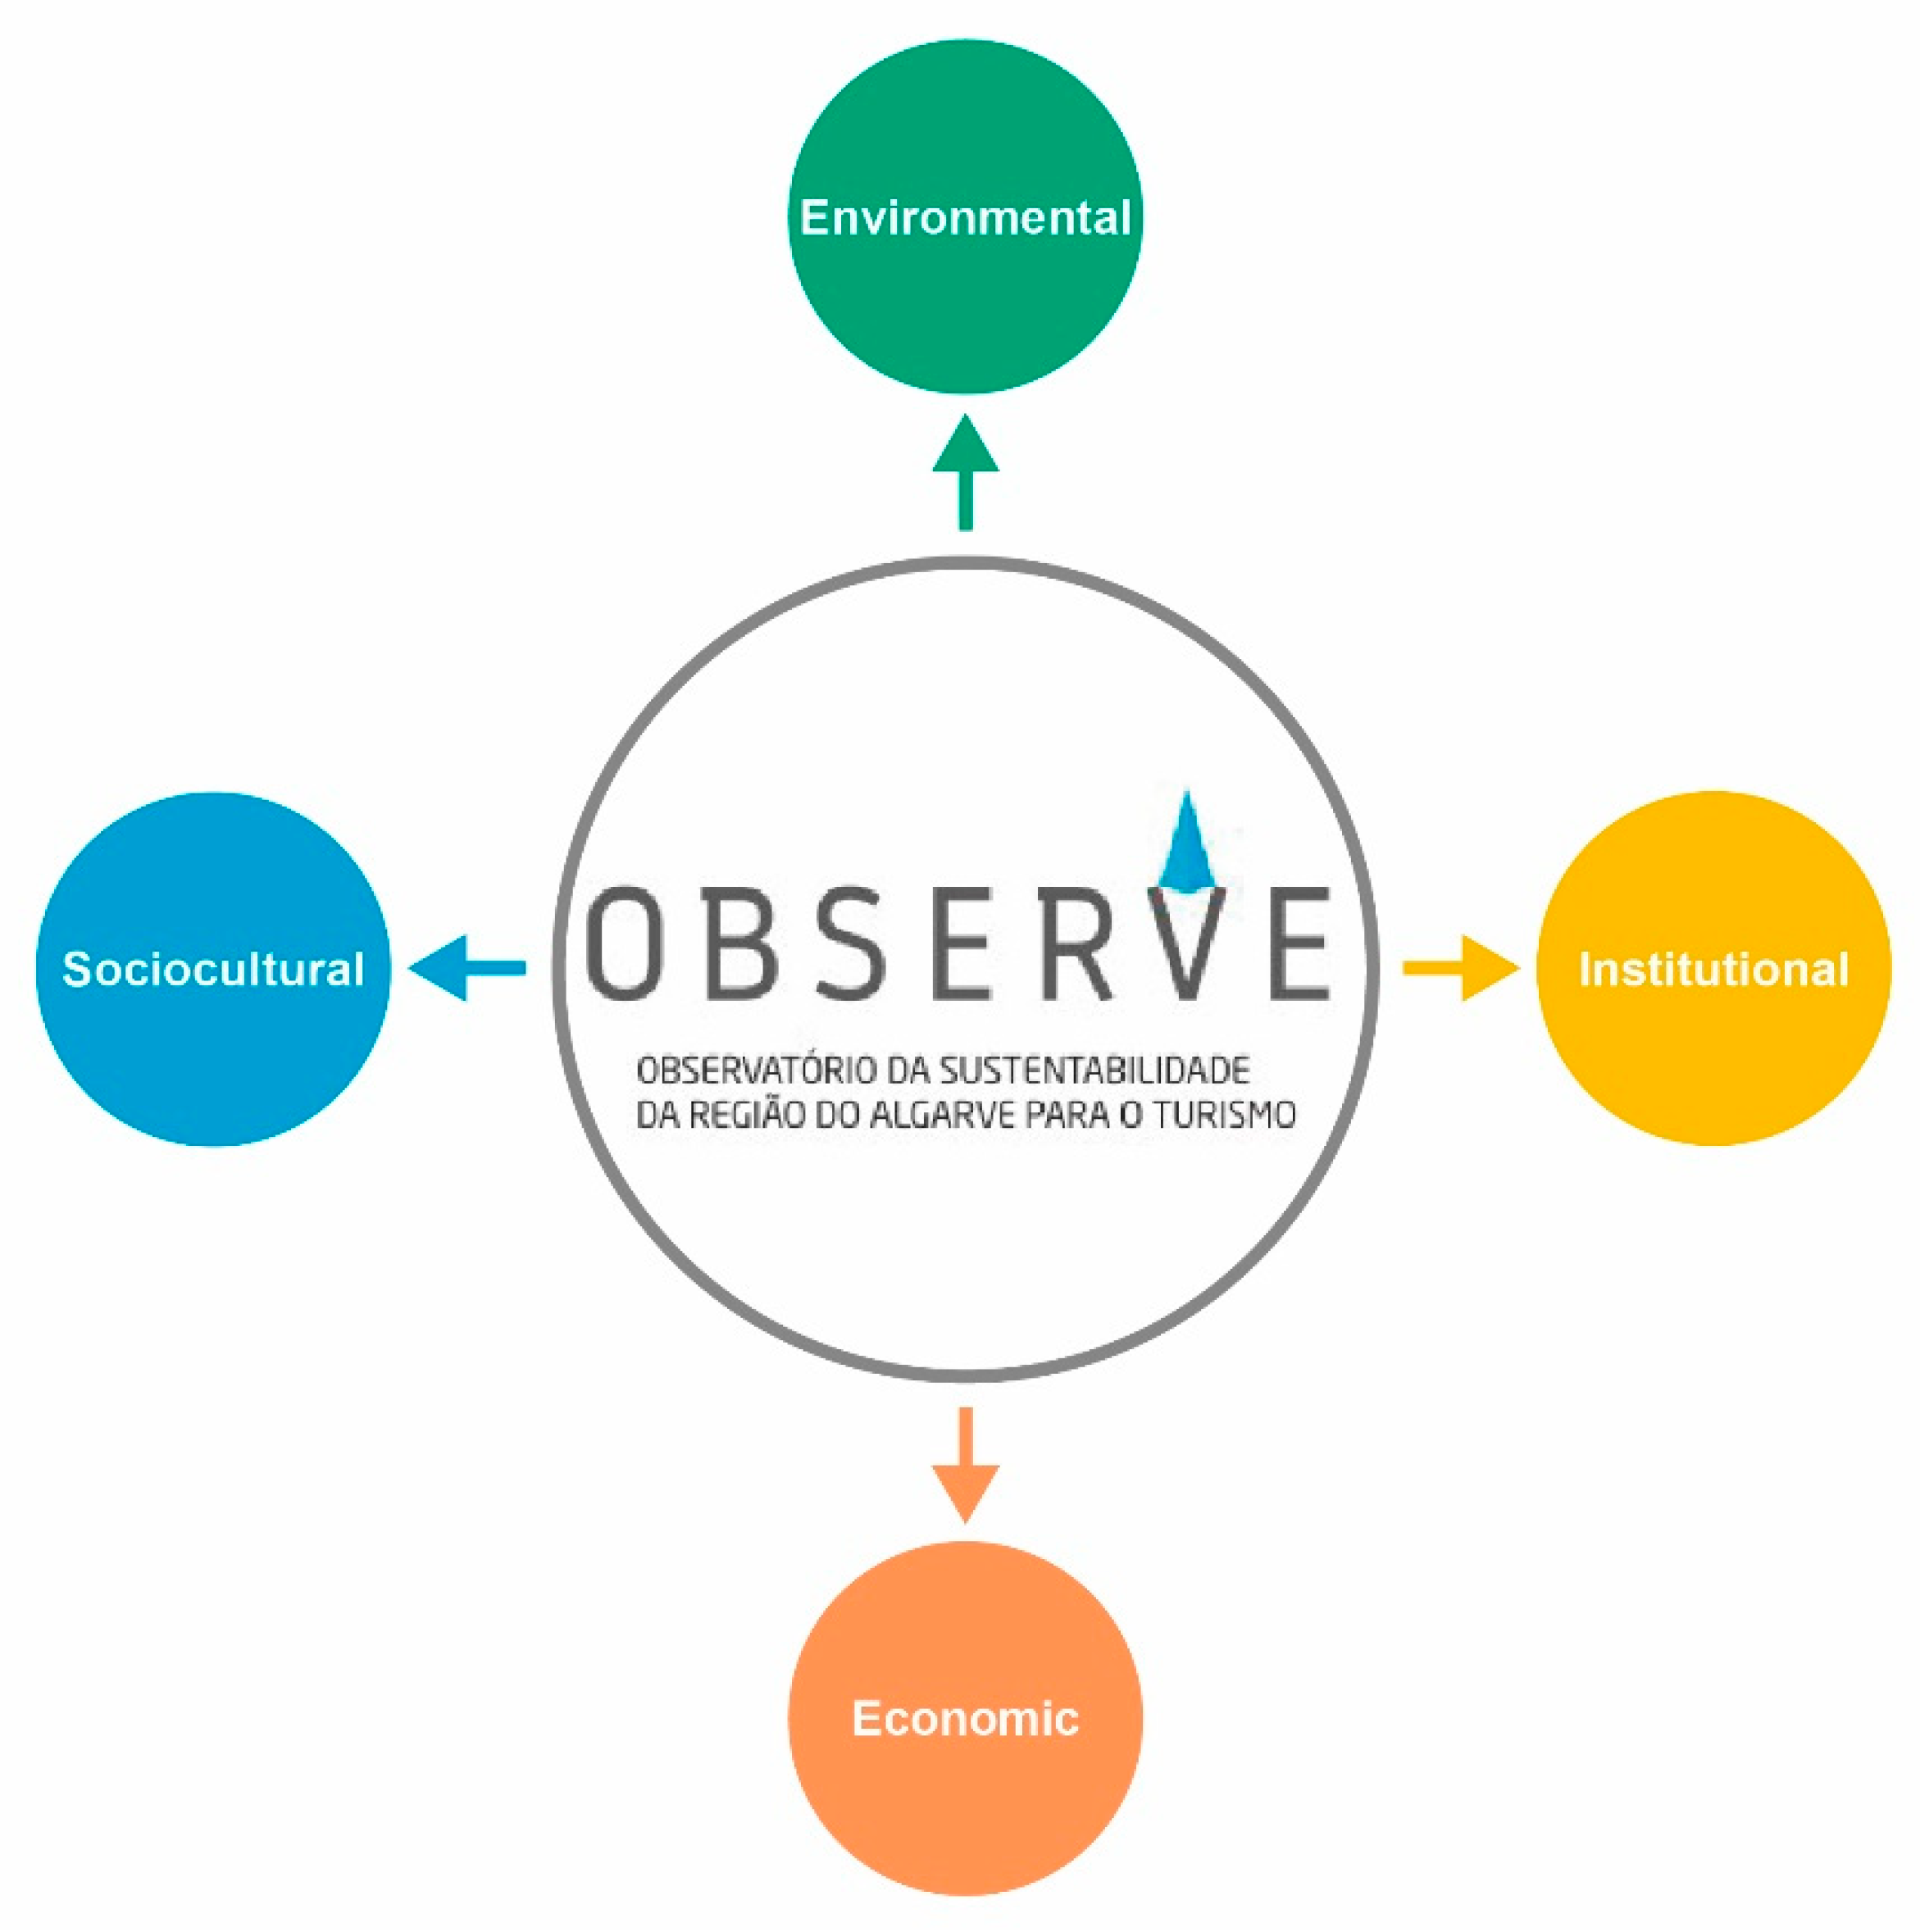
2.2. OBSERVE Platform
2.3. Group Approaches
2.4. k-Means
- Step 1: the number of groups is identified to carry out the analysis.
- Step 2: individuals from the dataset are randomly selected, constituting the initial centroids.
- Step 3: by using the association measurement chosen, the distance of each individual to each centroid is calculated.
- Step 4: groups are created by allocating each individual to the closest centroid.
- Step 5: the new centroids of each group are identified.
- Step 6: steps 3 and 4 are repeated. This step could lead to two situations: (i) going to step 5 if in step 4 some of the individuals change the group, thus repeating the cycle; and (ii) the cluster analysis process is finished when no individual changes the group in step 4.
- -means is applied for different values of .
- For each , WSS is calculated:where is the set of instances grouped in the -th cluster, and is the j-th variable of the cluster center for the -th cluster.
- The WSS curve is plot with respect to the number of groups.
- The location of the elbow in the graphic is generally considered as an indicator of the optimal number of groups (see Figure 3).
3. Results and Discussion
4. Conclusions
Author Contributions
Funding
Acknowledgments
Conflicts of Interest
References
- Akande, A.; Cabral, P.; Gomes, P.; Casteleyn, S. The Lisbon ranking for smart sustainable cities in Europe. Sustain. Cities Soc. 2019, 44, 475–487. [Google Scholar] [CrossRef]
- Asmelash, A.G.; Kumar, S. Assessing progress of tourism sustainability: Developing and validating sustainability indicators. Tour. Manag. 2019, 71, 67–83. [Google Scholar] [CrossRef]
- Cernat, L.; Gourdon, J. Paths to success: Benchmarking cross-country sustainable tourism. Tour. Manag. 2012, 33, 1044–1056. [Google Scholar] [CrossRef]
- Moussiopoulos, N.; Achillas, C.; Vlachokostas, C.; Spyridi, D.; Nikolaou, K. Environmental, social and economic information management for the evaluation of sustainability in urban areas: A system of indicators for Thessaloniki, Greece. Cities 2010, 27, 377–384. [Google Scholar] [CrossRef]
- Tao, Y.; Li, F.; Crittenden, J.; Lu, Z.; Ou, W.; Song, Y. Measuring urban environmental sustainability performance in China: A multi-scale comparison among different cities, urban clusters, and geographic regions. Cities 2019, 94, 200–210. [Google Scholar] [CrossRef]
- Recuero Virto, L. A preliminary assessment of the indicators for Sustainable Development Goal (SDG) 14 “Conserve and sustainably use the oceans, seas and marine resources for sustainable development”. Mar. Policy 2018, 98, 47–57. [Google Scholar] [CrossRef]
- Borsato, E.; Tarolli, P.; Marinello, F. Sustainable patterns of main agricultural products combining different footprint parameters. J. Clean. Prod. 2018, 179, 357–367. [Google Scholar] [CrossRef]
- Devereux, P.; Holmes, K. Voluntourism and the sustainable development goals. In Collaborations for Sustainable Tourism Development.; Goodfellow Publishers: Oxford, UK, 2018; pp. 93–111. [Google Scholar]
- Adshead, D.; Thacker, S.; Fuldauer, L.I.; Hall, J.W. Delivering on the Sustainable Development Goals through long-term infrastructure planning. Glob. Environ. Chang. 2019, 59, 101975. [Google Scholar] [CrossRef]
- Higgins-Desbiolles, F. Sustainable tourism: Sustaining tourism or something more? Tour. Manag. Perspect. 2018, 25, 157–160. [Google Scholar] [CrossRef]
- Lane, B. Will sustainable tourism research be sustainable in the future? An opinion piece. Tour. Manag. Perspect. 2018, 25, 161–164. [Google Scholar] [CrossRef]
- Crouch, G.I. Destination competitiveness: An analysis of determinant attributes. J. Travel Res. 2011, 50, 27–45. [Google Scholar] [CrossRef]
- Pulido-Fernández, J.I.; Cárdenas-García, P.J.; Espinosa-Pulido, J.A. Does environmental sustainability contribute to tourism growth? An analysis at the country level. J. Clean. Prod. 2019, 213, 309–319. [Google Scholar] [CrossRef]
- Verma, P.; Raghubanshi, A.S. Urban sustainability indicators: Challenges and opportunities. Ecol. Indic. 2018, 93, 282–291. [Google Scholar] [CrossRef]
- Hermans, F.L.P.; Haarmann, W.M.F.; Dagevos, J.F. Evaluation of stakeholder participation in monitoring regional sustainable development. Reg. Environ. Chang. 2011, 11, 805–815. [Google Scholar] [CrossRef]
- Manning, T. What Tourism Managers Need to Know: A Practical Guide to the Development and Use of Indicators of Sustainable Tourism; World Tourism Organization Pubns: Madrid, Spain, 1996. [Google Scholar]
- Michael, F.L.; Noor, Z.Z.; Figueroa, M.J. Review of urban sustainability indicators assessment—Case study between Asian countries. Habitat Int. 2014, 44, 491–500. [Google Scholar] [CrossRef]
- Kristjánsdóttir, K.R.; Ólafsdóttir, R.; Ragnarsdóttir, K.V. Reviewing integrated sustainability indicators for tourism. J. Sustain. Tour. 2018, 26, 583–599. [Google Scholar] [CrossRef]
- Miller, G. The development of indicators for sustainable tourism: Results of a Delphi survey of tourism researchers. Tour. Manag. 2001, 22, 351–362. [Google Scholar] [CrossRef]
- Liu, C.R.; Lin, W.R.; Wang, Y.C.; Chen, S.P. Sustainability indicators for festival tourism: A multi-stakeholder perspective. J. Qual. Assur. Hosp. Tour. 2019, 20, 296–316. [Google Scholar] [CrossRef]
- Blancas, F.J.; González, M.; Lozano-Oyola, M.; Pérez, F. The assessment of sustainable tourism: Application to Spanish coastal destinations. Ecol. Indic. 2010, 10, 484–492. [Google Scholar] [CrossRef]
- Blancas, F.J.; Lozano-Oyola, M.; González, M. A European Sustainable Tourism Labels proposal using a composite indicator. Environ. Impact Assess. Rev. 2015, 54, 39–54. [Google Scholar] [CrossRef]
- Nesticò, A.; Maselli, G. Sustainability indicators for the economic evaluation of tourism investments on islands. J. Clean. Prod. 2020, 248. [Google Scholar] [CrossRef]
- Castellani, V.; Sala, S. Sustainable performance index for tourism policy development. Tour. Manag. 2010, 31, 871–880. [Google Scholar] [CrossRef]
- Eustachio, J.H.P.P.; Caldana, A.C.F.; Liboni, L.B.; Martinelli, D.P. Systemic indicator of sustainable development: Proposal and application of a framework. J. Clean. Prod. 2019, 241. [Google Scholar] [CrossRef]
- Hély, V.; Antoni, J.P. Combining indicators for decision making in planning issues: A theoretical approach to perform sustainability assessment. Sustain. Cities Soc. 2019, 44, 844–854. [Google Scholar] [CrossRef]
- Palmisano, G.O.; Govindan, K.; Boggia, A.; Loisi, R.V.; De Boni, A.; Roma, R. Local Action Groups and Rural Sustainable Development. A spatial multiple criteria approach for efficient territorial planning. Land Use Policy 2016, 59, 12–26. [Google Scholar] [CrossRef]
- Huang, L.; Zheng, W.; Hong, J.; Liu, Y.; Liu, G. Paths and strategies for sustainable urban renewal at the neighbourhood level: A framework for decision-making. Sustain. Cities Soc. 2020. [Google Scholar] [CrossRef]
- Ma, J.; Harstvedt, J.D.; Jaradat, R.; Smith, B. Sustainability driven multi-criteria project portfolio selection under uncertain decision-making environment. Comput. Ind. Eng. 2020, 140, 106236. [Google Scholar] [CrossRef]
- Yi, P.; Dong, Q.; Li, W. Evaluation of city sustainability using the deviation maximization method. Sustain. Cities Soc. 2019, 50, 101529. [Google Scholar] [CrossRef]
- Dang, X.; Zhang, Y.; Feng, W.; Zhou, N.; Wang, Y.; Meng, C.; Ginsberg, M. Comparative study of city-level sustainability assessment standards in China and the United States. J. Clean. Prod. 2020, 251, 119622. [Google Scholar] [CrossRef]
- Neri, L.; D’Agostino, A.; Regoli, A.; Pulselli, F.M.; Coscieme, L. Evaluating dynamics of national economies through cluster analysis within the input-state-output sustainability framework. Ecol. Indic. 2017, 72, 77–90. [Google Scholar] [CrossRef]
- Budeanu, A.; Miller, G.; Moscardo, G.; Ooi, C.S. Sustainable tourism, progress, challenges and opportunities: An introduction. J. Clean. Prod. 2016, 111, 285–294. [Google Scholar] [CrossRef]
- United Nations General Assembly. Resolution Adopted by the General Assembly on 25 September 2015: Transforming Our World: The 2030 Agenda for Sustainable Development; United Nations General Assembly: New York, NY, USA, 2015. [Google Scholar]
- Do Valle, P.O.; Pintassilgo, P.; Matias, A.; André, F. Tourist attitudes towards an accommodation tax earmarked for environmental protection: A survey in the Algarve. Tour. Manag. 2012, 33, 1408–1416. [Google Scholar] [CrossRef]
- Estatística, I.N. De Estatísticas. Available online: https://ine.pt (accessed on 2 September 2019).
- Araújo, L. Portuguese tourism strategy 2027 Leading the tourism of the future. Worldw. Hosp. Tour. Themes 2017, 9, 646–652. [Google Scholar] [CrossRef]
- Farinha, F.; Oliveira, M.J.; Silva, E.M.J.; Lança, R.; Pinheiro, M.D.; Miguel, C. Selection process of sustainable indicators for the Algarve region-OBSERVE project. Sustainability 2019, 11, 444. [Google Scholar] [CrossRef]
- Andraz, J.M.; Rodrigues, P.M.M. Monitoring tourism flows and destination management: Empirical evidence for Portugal. Tour. Manag. 2016, 56, 1–7. [Google Scholar] [CrossRef]
- Correia, A.; Kozak, M. Tourists’ shopping experiences at street markets: Cross-country research. Tour. Manag. 2016, 56, 85–95. [Google Scholar] [CrossRef]
- Costa, C. Turismo e cultura: Avaliação das teorias e práticas culturais do sector do turismo (1990–2000). Análise Soc. 2005, 175, 279–295. [Google Scholar]
- Instituto Nacional de Estatistica. Estatisticas do Turismo 2015; Instituto Nacional de Estatistica Lisboa: Lisboa, Portugal, 2016.
- Barreira, A.P.; Cesário, M.; de Noronha, M.T. Pull attributes of the Algarve: The tourists’ view. Tour. Plan. Dev. 2017, 14, 87–109. [Google Scholar] [CrossRef]
- Oliveira, R.; Pedro, M.I.; Marques, R.C. Efficiency and its determinants in Portuguese hotels in the Algarve. Tour. Manag. 2013, 36, 641–649. [Google Scholar] [CrossRef]
- Oliveira, R.; Pedro, M.I.; Marques, R.C. Efficiency performance of the Algarve hotels using a revenue function. Int. J. Hosp. Manag. 2013, 35, 59–67. [Google Scholar] [CrossRef]
- Barros, C.P.; Butler, R.; Correia, A. The length of stay of golf tourism: A survival analysis. Tour. Manag. 2010, 31, 13–21. [Google Scholar] [CrossRef]
- Pereira, R.L.G.; Correia, A.H.; Schutz, R.L.A. Towards a taxonomy of a golf-destination brand personality: Insights from the Algarve golf industry. J. Destin. Mark. Manag. 2015, 4, 57–67. [Google Scholar] [CrossRef]
- Lopes, I.C.; Soares, F.; Silva, E.C. e Tourism demand in the Algarve region: Evolution and forecast using SVARMA models. AIP Conf. Proc. 2017, 1836, 20075. [Google Scholar] [CrossRef]
- Oliveira, M.J.; Farinha, F.; da Silva, E.; Lança, R. Observatory of Sustainability of the Algarve Region for Tourism -Overview and outset. In Proceedings of the 2nd UNWTO World Conferences on Smart Destinations, 25–27 June 2018, Oviedo, Spain; Volume 13, pp. 1237–1244.
- Hartigan, J.A.; Wong, M.A. Algorithm AS 136: A k-means clustering algorithm. J. R. Stat. Soc. Ser. C 1979, 28, 100–108. [Google Scholar] [CrossRef]
- Ketchen, D.J.; Shook, C.L. The application of cluster analysis in strategic management research: An analysis and critique. Strateg. Manag. J. 1996, 17, 441–458. [Google Scholar] [CrossRef]
- Kaufman, L.; Rousseeuw, P.J. An Introduction to Cluster Analysis; John Wiley and Sons: Hoboken, NJ, USA, 1990. [Google Scholar]
- Hintze, J.L.; Nelson, R.D. Violin Plots: A Box Plot-Density Trace Synergism. Am. Stat. 1998, 52, 181–184. [Google Scholar] [CrossRef]


| Pillar | Subject Area | Indicator |
|---|---|---|
| Environmental | Air quality index | Air quality index |
| Energy management | Consumption of electric energy by inhabitant | |
| Consumption of motor fuel by inhabitant | ||
| Production of electric energy using renewable sources | ||
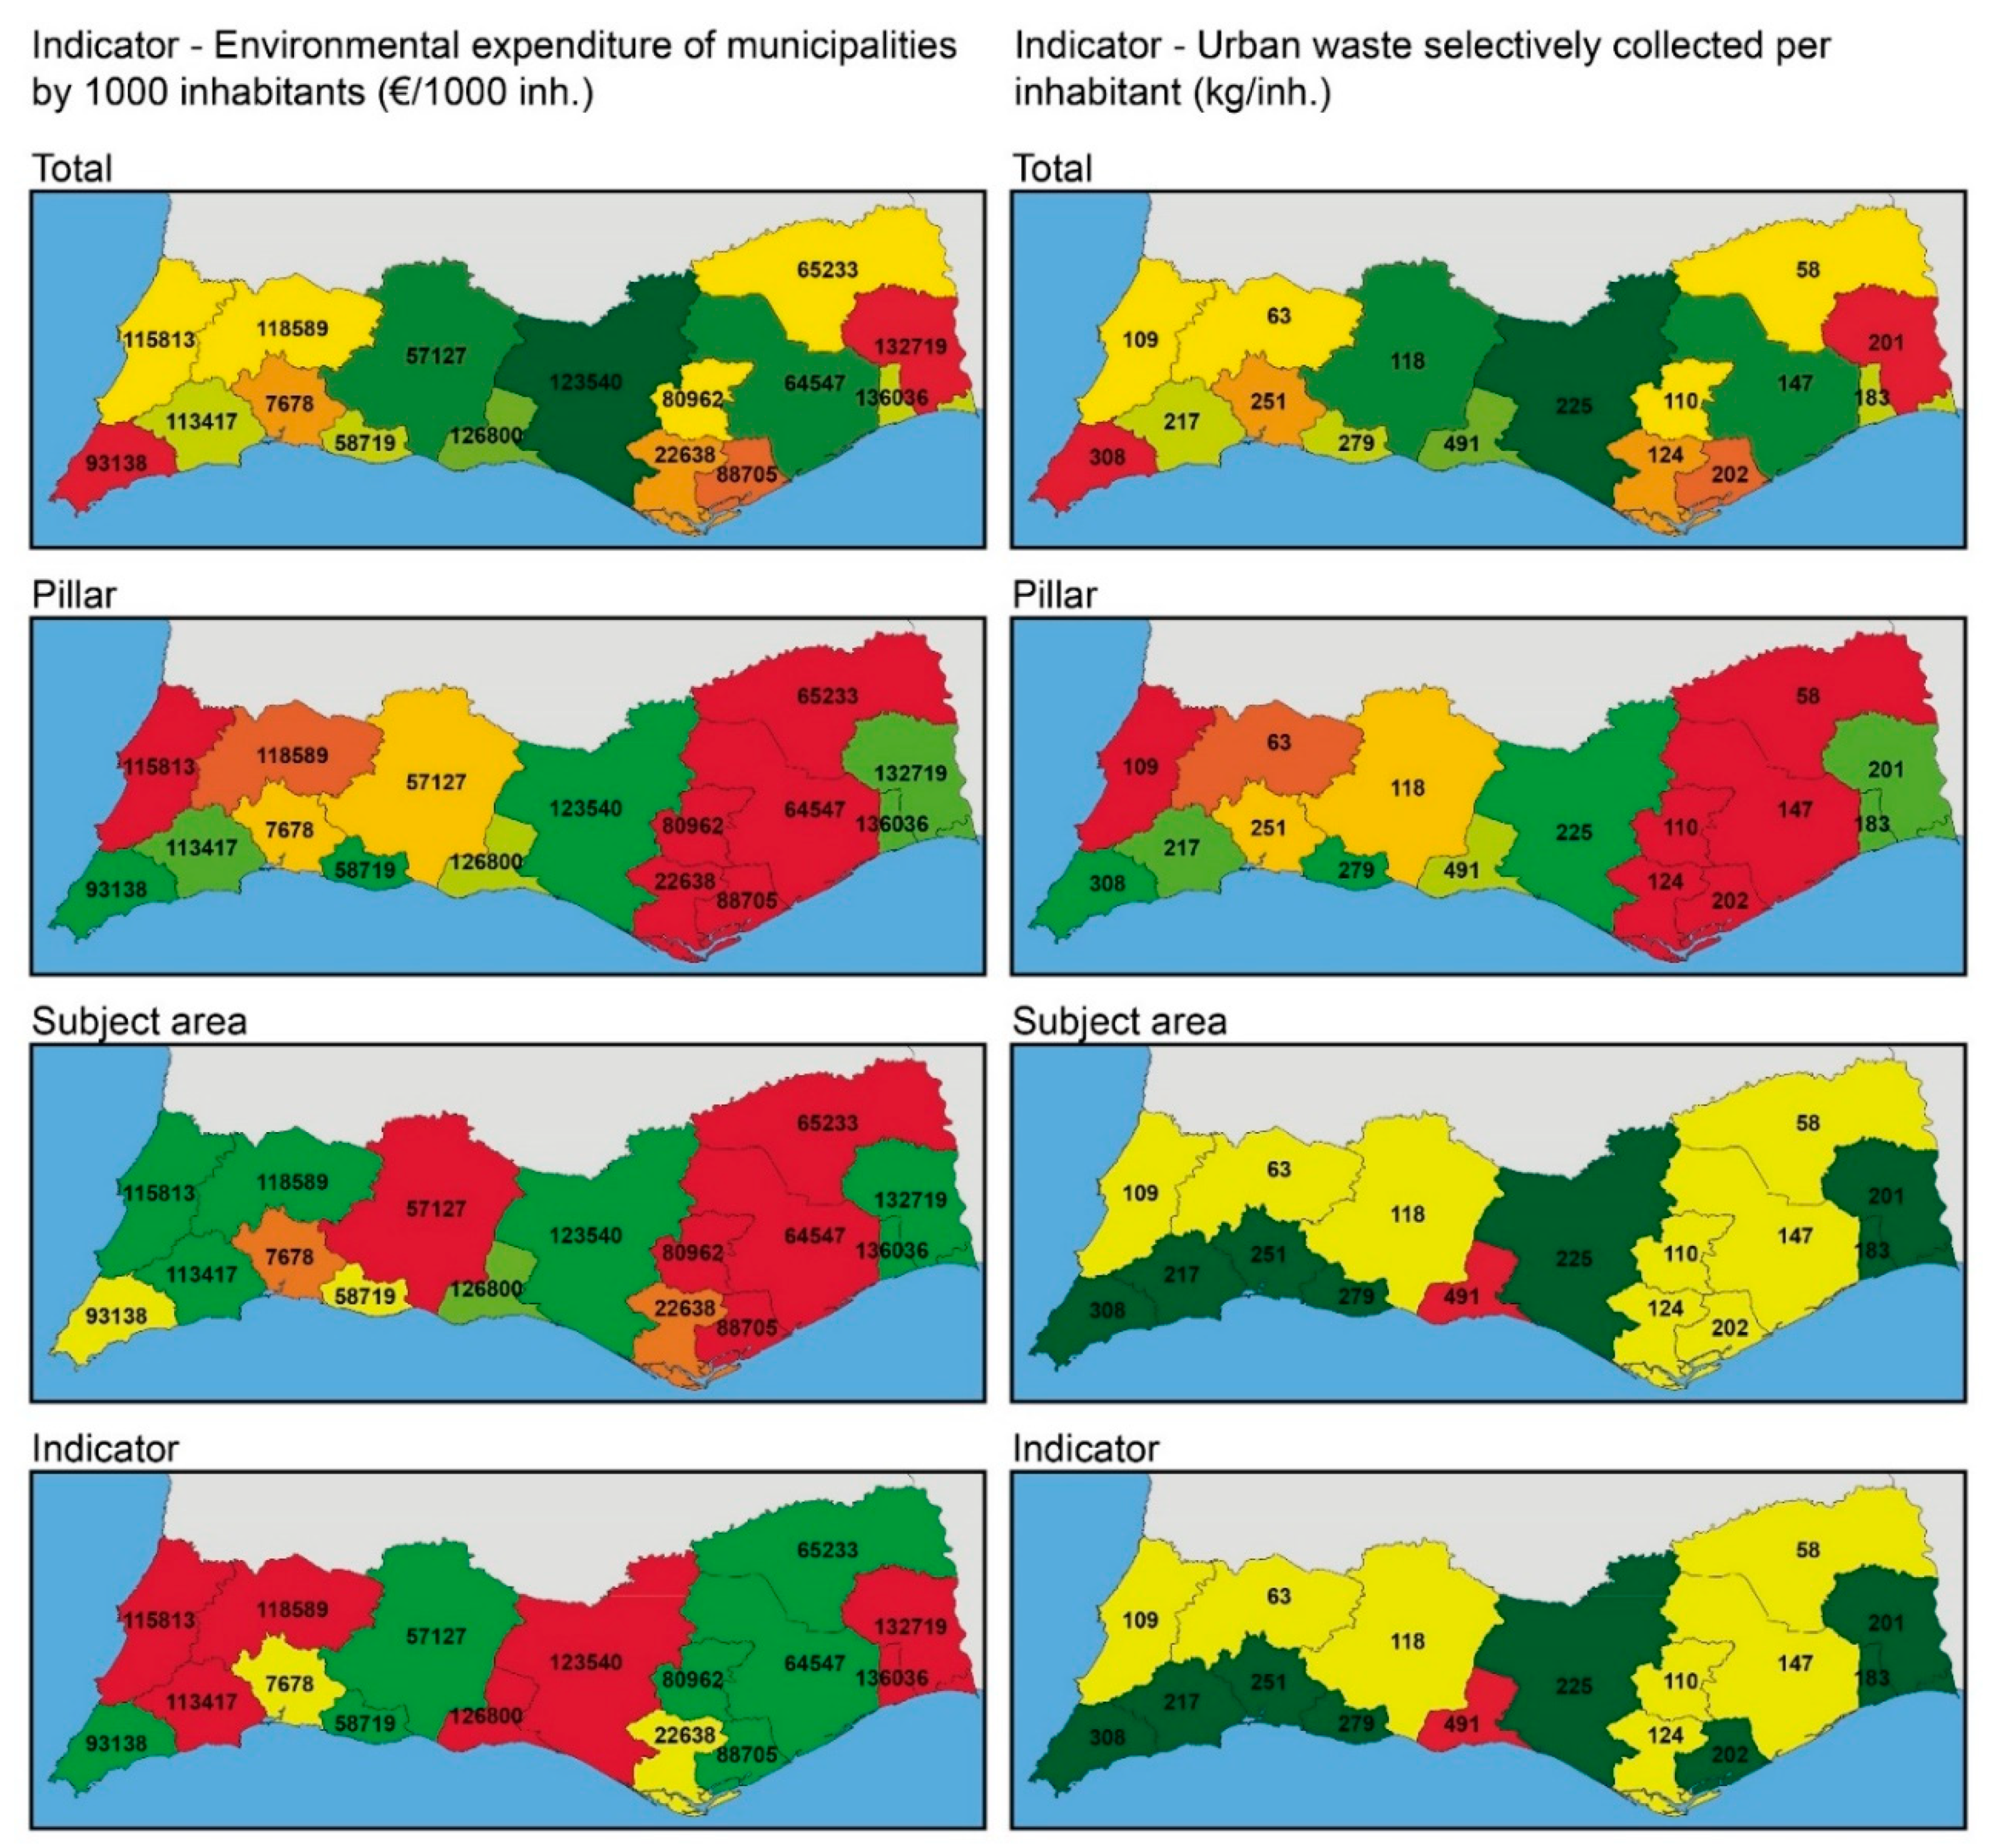
| Environmental management | Environmental expenditure of municipalities by 1000 inhabitants | |
| Number of blue flags, beaches and marinas | ||
| Number of bathing waters and quality classes | ||
| Materials and waste management | Percentage of municipal waste prepared for reuse and recycling | |
| Urban waste selectively collected per inhabitant | ||
| Urban waste collected per capita | ||
| Mobility | Number of embarked and disembarked passengers in Faro Airport | |
| Number of passengers per kilometre carried by enterprises exploring inland transportation | ||
| Movement of passengers in inland waterways | ||
| Number of embarked and disembarked passengers of cruise ships in Portimão Port | ||
| Charging stations for electric vehicles | ||
| Average daily traffic on main roads and secondary roads | ||
| Walking and cycling routes | ||
| Natural capital management | Burnt area | |
| Investments on protection of biodiversity and landscapes of municipalities | ||
| Water cycle management | Percentage of safe water | |
| Fresh water supplied per inhabitant | ||
| Wastewater sewerage per capita | ||
| Institutional | Governance and citizenship | Abstention rate |
| Percentage of capital expenditure | ||
| Broadband internet access per 100 inhabitants | ||
| Innovation and knowledge | Gross expenditure on research and development of institutions and enterprises | |
| Gross expenditure on research and development as percentage of gross domestic product | ||
| Economic | Economic impact | Gross value added of enterprises |
| Apparent labour productivity in establishments, food and beverage service activities | ||
| Inflation | ||
| Per capita purchasing power | ||
| Number of establishments and economic activity | ||
| Persons employed of establishments and economic activity | ||
| Turnover of establishments and economic activity | ||
| Relative contribution of establishments, food and beverage service activities to the Algarve Economy (GVA of Enterprises) | ||
| Job | Employment by gender and economic sector | |
| Seasonality | Seasonal employees | |
| Establishments open all year | ||
| Tourist occupation | Lodging capacity in hotel establishments | |
| Nights in hotel establishments | ||
| Revenue per available room (Rev Par) of hotel establishments | ||
| Average stay in hotel establishments | ||
| Accessibility | Number of accessible beaches | |
| Culture | Number of cultural properties | |
| Municipalities’ expenditures on cultural heritage | ||
| Sociocultural | Demography | Annual population balances: natural and migratory |
| Resident population | ||
| Foreign population with status of resident | ||
| Education | Population education level with 15 and more years | |
| Health care | Health Care | |
| Pressure | Lodging capacity in hotel establishments by 1000 inhabitants | |
| Tourist intensity | ||
| Regional tourist density | ||
| Municipal tourist density | ||
| Safety | Crime rate | |
| Number of registered crimes | ||
| Social cohesion | Regional development composite index (cohesion) | |
| Beneficiaries of social integration income, of social security per 1000 inhabitants in active age | ||
| Number of secondary houses per 100 houses |
| Year | Approach | |||
|---|---|---|---|---|
| TA | PA | SAA | IA | |
| 2011 | 1 | 4 | 14 | 105 |
| 2012 | 1 | 4 | 14 | 105 |
| 2013 | 1 | 4 | 14 | 105 |
| 2014 | 1 | 4 | 14 | 105 |
| 2015 | 1 | 4 | 14 | 105 |
| Year | TA | PA | SAA | IA | |||
|---|---|---|---|---|---|---|---|
| BSS/TSS | BSS/TSS | Percentage Deviation with Respect to the TA [%] | BSS/TSS | Percentage Deviation with Respect to the TA [%] | BSS/TSS | Percentage Deviation with Respect to the TA [%] | |
| 2011 | 88.9 | 82.85 | −6.81% | 84.84 | −4.57% | 94.59 | 6.40% |
| 2012 | 91 | 83.25 | −8.52% | 87.64 | −3.69% | 94.41 | 3.75% |
| 2013 | 83.7 | 88.65 | 5.91% | 89.53 | 6.97% | 94.45 | 12.84% |
| 2014 | 86.2 | 88.08 | 2.18% | 90.34 | 4.80% | 95.08 | 10.30% |
| 2015 | 88.4 | 87.6 | −0.90% | 91.97 | 4.04% | 95.39 | 7.91% |
| Year | TA | PA | SAA | IA | |||
|---|---|---|---|---|---|---|---|
| Percentage deviation with respect to the TA [%] | Percentage deviation with respect to the TA [%] | Percentage deviation with respect to the TA [%] | |||||
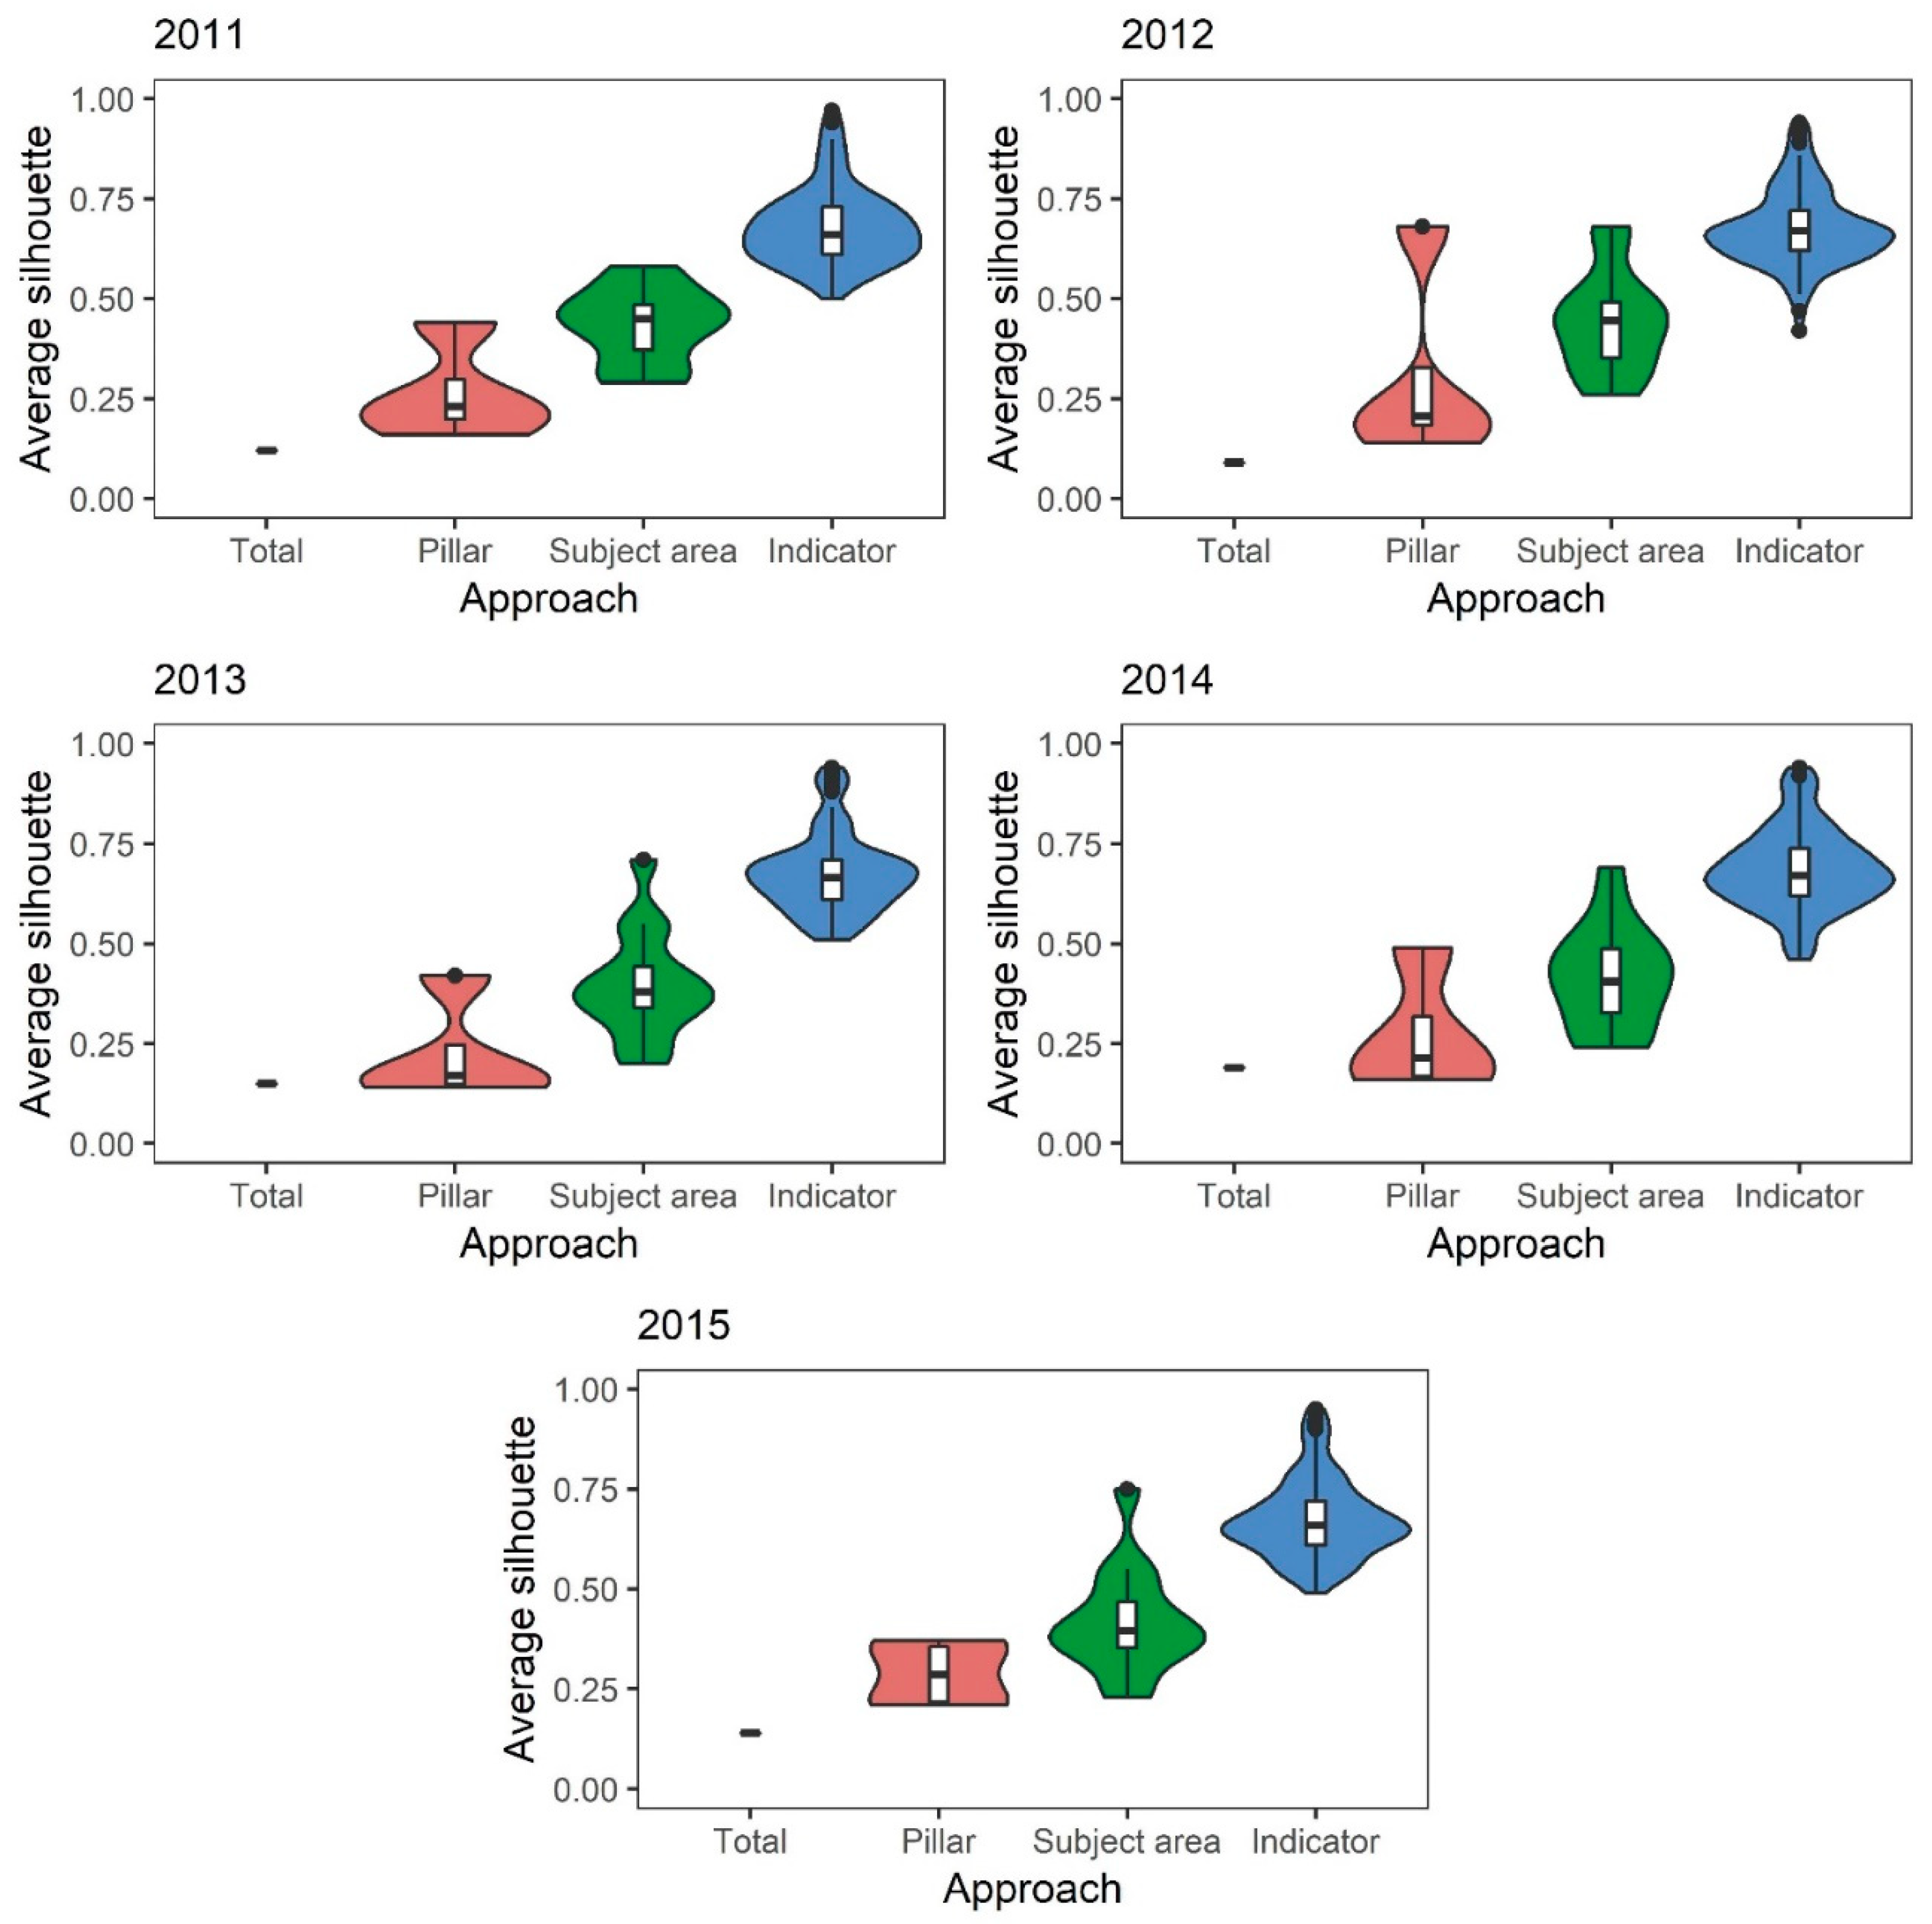
| 2011 | 0.12 | 0.25 | 108.33% | 0.44 | 266.67% | 0.68 | 466.67% |
| 2012 | 0.09 | 0.31 | 244.44% | 0.44 | 388.89% | 0.60 | 566.67% |
| 2013 | 0.15 | 0.23 | 53.33% | 0.40 | 166.67% | 0.68 | 353.33% |
| 2014 | 0.19 | 0.27 | 42.11% | 0.41 | 115.79% | 0.69 | 263.16% |
| 2015 | 0.14 | 0.29 | 107.14% | 0.42 | 200.00% | 0.68 | 385.71% |
| Year | Percentage of Cases Incorrectly Grouped [%] | |||
|---|---|---|---|---|
| TA | PA | SAA | IA | |
| 2011 | 43.00 | 33.04 | 28.01 | 0.00 |
| 2012 | 39.56 | 30.90 | 28.87 | 0.00 |
| 2013 | 37.21 | 36.38 | 33.63 | 0.00 |
| 2014 | 39.43 | 31.01 | 30.61 | 0.00 |
| 2015 | 37.03 | 31.19 | 25.06 | 0.00 |
© 2020 by the authors. Licensee MDPI, Basel, Switzerland. This article is an open access article distributed under the terms and conditions of the Creative Commons Attribution (CC BY) license (http://creativecommons.org/licenses/by/4.0/).
Share and Cite
Bienvenido-Huertas, D.; Farinha, F.; Oliveira, M.J.; Silva, E.M.J.; Lança, R. Challenge for Planning by Using Cluster Methodology: The Case Study of the Algarve Region. Sustainability 2020, 12, 1536. https://doi.org/10.3390/su12041536
Bienvenido-Huertas D, Farinha F, Oliveira MJ, Silva EMJ, Lança R. Challenge for Planning by Using Cluster Methodology: The Case Study of the Algarve Region. Sustainability. 2020; 12(4):1536. https://doi.org/10.3390/su12041536
Chicago/Turabian StyleBienvenido-Huertas, David, Fátima Farinha, Miguel José Oliveira, Elisa M. J. Silva, and Rui Lança. 2020. "Challenge for Planning by Using Cluster Methodology: The Case Study of the Algarve Region" Sustainability 12, no. 4: 1536. https://doi.org/10.3390/su12041536
APA StyleBienvenido-Huertas, D., Farinha, F., Oliveira, M. J., Silva, E. M. J., & Lança, R. (2020). Challenge for Planning by Using Cluster Methodology: The Case Study of the Algarve Region. Sustainability, 12(4), 1536. https://doi.org/10.3390/su12041536


