Abstract
Environmental noise and vibration induced by building construction are increasingly prominent in daily life. If the noise and vibration level exceeds the corresponding standard limits stipulated by the country, humans’ normal life, working, or studying efficiency would be interfered. This paper aims to explore how residents respond to noise and vibration mainly induced by the building construction. The noise and vibration measurements, as well as a questionnaire survey, were conducted. Through analysis and comparisons, it is shown that the noise impacts were concentrated in the area near the construction site. For the noise and vibration transmission within the building, the noise levels were amplified in the lower floors and gradually attenuated with floors, and the vibration levels decayed with the floors. The noise impact was much greater than the vibration impact. Building construction was found to be one of the most annoying noise and vibration sources, while the subway operation has little impact on residents according to either subjective or objective evaluation. The ratio of noise and vibration dissatisfaction was less than that of annoyance, which demonstrated that the residents’ psychological capacity was high toward the impact of noise and vibration. The proposed dose-response relationship can apply in a similar community environment. Once the noise levels within the building obtained, the residents’ noise annoyance can then be estimated.
1. Introduction
Environmental pollution occurs when noise and vibration levels exceed the standard limits stipulated by the country, interfering with humans’ normal life, work, and study activities [1]. Noise or vibration pollution has certain characteristics. Noise and vibration phenomena are temporary, and will disappear when their sources stop. The distribution of environmental noise and vibration sources is dispersive, and their range of influence is limited [2]. The energy of noise and vibration decreases with the increase of distance to the sources. Unlike air pollution, noise and vibration pollution is not sensitive to meteorological conditions and acts as a kind of instantaneous energy pollution [3]. Noise and vibrations are transmitted through the physical medium and gradually disappear with distance. In practical engineering, noise and vibrations are inevitable. The research on noise and vibrations can be summarized into three parts: the source, the transmission path, and the receiver [4].
Excessive noise and vibration are harmful to human health with no doubt, while the evaluation of their impacts can be subjective [5,6]. It not only affects hearing but also has adverse effects on the cardiovascular system, nervous system, and endocrine system [7,8,9]. The effects of noise and vibrations on human beings were discussed by studying different urban areas or different types of noise and vibration sources. Typical urban areas affected by noise and vibrations include schools [10,11,12,13], offices [14,15], markets [16], airports [17,18], and metro stations [19,20]. Major sources of urban noise and vibrations include construction [21,22], road traffic [23,24,25], rail traffic [26,27] and industry [28].
According to the China environmental noise and control annual report in 2018 [29], noise reports accounted for 35.3%, and ranked the second, just behind the air pollution. In the report of noise problems, building construction noise disturbed the public with a proportion of 43.0%. From noise pollution complaints, they mainly focus on construction and industrial noise, while those from social life, entertainment, and traffic systems accounting for less.
On a construction site, multiple activities, such as the pile drilling, the collapse of old buildings, people shouting, can cause noise and vibration. Therefore, noise and vibration sources are diverse and often changeable. Due to the construction machines are mostly operated with no shielding around them, and the fact some of them often need to be moved, lifted, and installed, the construction-induced noise and vibrations have the characteristics of suddenness and discontinuity, easily causing annoyance and discomfort to humans. Based on the construction of a light rail transit system, the non-exposure factors that affect the relationship between the vibration and noise were analyzed by Wong-McSweeney et al. [30]. In order to minimize the impact of building vibration and noise on the community, the policies should take into account the attitude factors of humans. Hong et al. [31] established a prediction model on the environmental costs of engineering noise and vibration. The model predicted the construction noise and vibration levels based on the noise and vibration levels of equipment and estimated the environmental cost. Vogiatzis et al. [32] put forward two different case studies to express the need of using appropriate tools to predict the environmental noise and vibration induced by construction. These two case studies involved the new Brussels region express network and the new Athens metro line 3 extension to the port of Piraeus.
Noise and vibrations can also be generated by the contact between wheels and rails from the operation of subways. This type of noise mainly includes: (1) the screeching of the train as it moves along curved rails with small radius; (2) crashs as the wheels roll over the rail joints; (3) the rumbling caused by track irregularities. Mouzakis et al. [33] proposed a method ensuring a high precision estimation of the expected vibration and ground-borne noise. Vogiatzis et al. [34] presented a method to determine the subway-induced noise and vibration levels along with the height of a building with a particular construction type and demonstrated how to calculate the attenuation and amplification parameters. Within this building, vibrations were significantly amplified due to floors’ and other structural components’ resonances, and the vibration and radiated noise levels were similar from the 1st floor to the upper.
Recently, urban life pace is speeding up, and people’s working pressure is increasing, which leads to the requirement of a better and quieter living and working environment. However, noise and vibration pollution caused by building construction and other potential sources are also increasing along with urbanization. Against this background, this paper aims to explore the humans’ responses to environmental noise and vibrations mainly induced by building construction. The noise and vibration measurements, as well as a questionnaire survey, were conducted and analyzed. Some concluding remarks are drawn and can provide references for noise and vibration control in similar community environments.
2. Methodology
The adopted assessing methodology for the impacts of environmental noise and vibration on residents consists of both objective and subjective evaluation. Vibration and noise measurements and a questionnaire survey were carried out in this research to obtain statistics for analysis.
2.1. Description of Evaluated Building
A 31-story residential building with 270 households located in Guangzhou, China, was selected to conduct the evaluations of vibration and noise impacts.
The building was built in 2017. The 1st and 2nd floors are for commercial use, the 3rd floor is a hanging garden, and the 4th floor and above are for residential use. The building is located 20 m away from a construction site, as shown in Figure 1. There is also an underground operating subway line below the building. The relative positions of the construction site, subway line, and selected residential building are shown in Figure 2. The main noise and vibration sources affecting this residential building include building construction, subway operation, road traffic, and potential people activities. The schedule of the construction site and subway operation are 6 a.m.–10 p.m. and 6 a.m.–12 p.m., respectively. For subway operation, each train pass-by event lasts typically 15 s with a train speed of 40 km/h. By comparison, the noise and vibrations induced by building construction last much longer.
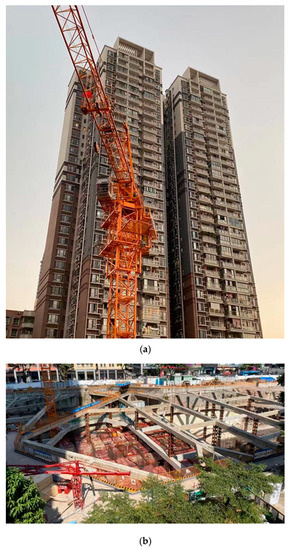
Figure 1.
Residential building and construction site; (a) 31-story residential building; (b) construction site.
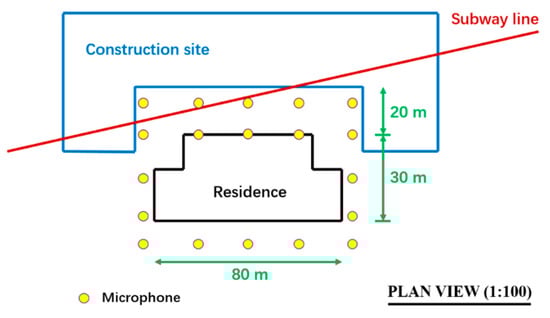
Figure 2.
Plan view of the residential building, construction site, and subway line.
2.2. Noise Measurements
EMM-6 Electret microphones (Dayton Audio, Springboro, OH, USA), as shown in Figure 3, were used in the noise measurements [35]. The microphones were calibrated before the measurements based on the requirements of the International Electrotechnical Commission [36].
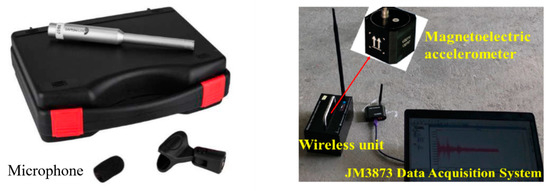
Figure 3.
Instruments for the noise and vibration measurements.
In order to explore the noise distribution around the residential building at the ground level, within the building on different floors as well as within different apartments on the same floor, three setups were designed for noise measurements. Setup 1 was for ground-level noise measurements. Setup 2 was for noise measurements within the building. Microphones were mounted in selected rooms on the 4th, 7th, 11th, 15th, 19th, 23rd, 27th, and 31st floor. Setup 3 was for noise measurements at different positions on the same floor. Microphones were mounted in different rooms on the 15th floor.
Due to the limited number of microphones used, the measurements could not be carried out simultaneously. At each measured location, 30-minute noise data was recorded, and its equivalent A-weighted sound pressure level (LAeq) was calculated. Both day- and night-time configurations were considered, where day-time was from 6 am to 10 pm, and night-time was from 10 pm to 6 am [37]. In the open field, microphones were set at least 3.5 m away from reflecting structure, such as walls, and 1.5 m above the ground surface. In the room, microphones were set 1.5 m away from the walls and windows and 1.5 m away from the floor surface [37]. The weather during the measurements was sunny with wind speed below 5 m/s.
2.3. Vibration Measurements
In order to explore the vibration impacts on residents, accelerations were set on different floors, including the 4th, 7th, 11th, 15th, 19th, 23rd, 27th, and 31st floor. Thus, the vertical vibration transmission within the building from the lower floors to upper floors can be obtained. The instrumentation used in the vibration measurements includes the wireless unit with the built-in magnetoelectric accelerometer, and a JM3873 Data Acquisition System (Yangzhou Jingming, Yangzhou, China) [38], as shown in Figure 3. Each wireless unit has a time synchronizer with the accuracy of 1 ms and a gigabyte storage card. The sampling frequency was set to be 512 Hz. It was enough for assessments of building floor vibrations’ impacts on human comfort, where dominant frequencies were below 80 Hz [38]. All the wireless units were mounted at the center of each measured room. Acceleration time history data were downloaded from wireless units and read through MatLab scripts to calculate the spectrum, which were obtained by performing a Fast Fourier Transform on the recorded vibration acceleration signal [38]. The vibration levels at 1/3 octave band center frequencies were also synthesized from the corresponding spectrum.
2.4. Questionnaire
A questionnaire survey was conducted to evaluate residents’ annoyance on noise disturbance and to determine the main noise and vibration sources. The statistical data were presented both in absolute (n) and relative (%) ways. All the questions were concisely and unambiguously designed based on the studies by Silva et al. [39,40]. The subjective evaluation mainly involved individual information and personal feelings towards noise and vibration impacts. A total of 218 residents was involved in the survey, with 39.4% (n = 86) males and 60.6% (n = 132) females, ranged from 16 to 75 years old, as shown in Table 1. They were all living in the building for more than one year. It is a pity that no resident over the age of 75 could be found in this new building for the survey.

Table 1.
Age distribution.
The questionnaire on noise impacts was divided into two parts. In the first part, some questions related to an ordinal scale value of 1, 2, 3, 4, or 5 that based on the recommendations of the International Commission on Biological Effects of Noise (ICBEN) were proposed to evaluate residents’ noise sensitivities. The respondents were required to select an ordinal scale value for each question, which represents the level of “not at all”, “slightly”, “moderately”, “very”, or “extremely”, respectively. These questions include: “(1) When you at home, how often do you feel annoyed or disturbed by the environmental noise?” and “(2) During the period you lived here, to what extent are you dissatisfied with the noise impacts?”. All questions were required to be answered based on the overall impacts during the last 12 months. The other part was related to the types of noise sources. The potential noise sources were listed for respondents’ selection, containing building construction, subway operation, car horns and sirens, people on the street, neighbors, and others. The questions include: “(3) Which kind of noise do you hear the most frequently in your home?” and “(4) If you have heard noises at home, which do you think is the most disturbed or annoyed?”.
The design of the questionnaire on vibration impacts was quite similar to that on noise impacts. For the 1st part, the respondents were asked to select an ordinal scale value for the questions: “(5) When you at home, how often do you feel annoyed or disturbed by the environmental vibration?”, “(6) During the period you lived here, to what extent are you dissatisfied with the vibration impacts” and “(7) Have you ever worried about the vibration that may damage the building structure, your home decoration or furniture, etc.?”. The other part was related to the types of vibration sources. The potential vibration sources were also listed for respondents’ selection, including building construction, subway operation, road traffic, and other activities. Questions in this part include: “(8) Which kind of vibration do you feel the most frequently in your home?”, and “(9) If you have felt vibrations at home, which do you think is the most disturbed, or annoyed kind”.
2.5. Dose-Response Relationship for Noise Annoyance
To obtain the dose-response relationship between the noise exposure and annoyance of the residents, the noise measurements were conducted, and the respondents were asked to give the most authentic feeling about the noise by selecting the 11-point categorical scale from 0 to 10 at the end of the measurements. The respondents were randomly selected, and the corresponding noise measurements were conducted in their apartments. Windows open or close depended on whether respondents usually keep their windows open or closed during the day. Thus, the noise responses of residents were related to the noise level measured within their apartment. Due to the wide distribution of noise levels, they were divided into different segments with an increment of 2 dB (A). The average scores were calculated for each segment based on the respondents’ answers. According to the DELTA [41], the average scores can be represented by a logistic function, which is defined as:
where A is annoyance response; u is the upper limit of A (10 for absolute score, 100 for relative percentage); s is the unknown constant; E is the measured noise exposure; f is the mean value of the normally distributed E. By the fitting calculation, the unknown parameter s, as well as the dose-response relationship, can be obtained. It provides a simple method for noise annoyance evaluation.
A = u/(1 + e−s(E−f))
It is a common practice to express noise annoyance using highly annoyed (%HA), annoyed (%A), and little annoyed (%LA). The %HA is the percentage of people give a score of 8, 9 and 10, the %A is the percentage of people give a score above 5, and %LA is the percentage of people give a score above 3.
3. Results
3.1. Noise Exposure
3.1.1. Noise Variation at the Ground Level
The ground-level noise levels were measured by setting measured points at the different locations around the building in both day-time and night-time. Assuming the southwest side was the origin of coordinates, the measured noise maps around the residence were shown in Figure 4.
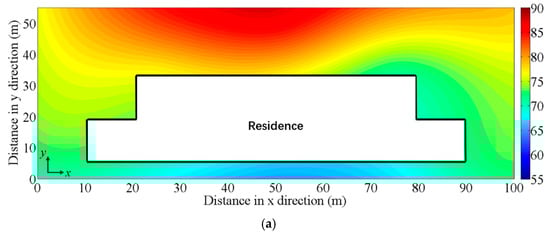
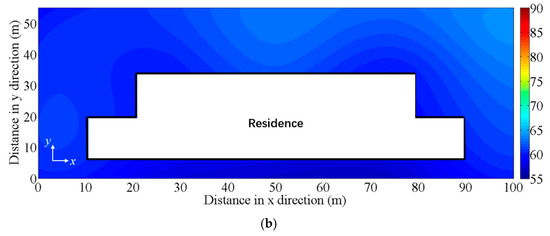
Figure 4.
Measured noise maps around the residence. (a) Day-time; (b) Night-time.
The day-time noise levels were higher than those at night. The day-time noise levels in the north of the building were more significant due to the vicinity to the construction site, and the range was between 64.9 dB (A)–86.2 dB (A). During the night-time, the distribution of the noise levels around the building was relatively uniform, and the range was 57.3 dB (A)–64.5 dB (A). The noise levels at the northern side were slightly larger due to being closer to the road. It can be seen from the measured noise maps that the outdoor environment around the building cannot always maintain quiet.
3.1.2. Noise Variation along with the Building Height
The selection of rooms for measurements was based on the main noise sources and their relative location to the building. The main noise sources for this building include building construction, subway operation, and road traffic, which were all located in the north of the building. The measured noise levels at different floors along the building height are shown in Table 2, representing the maximum noise exposure of each floor. The noise level variation can reveal the noise propagation law along with the building height to some extent.
Table 2.
Noise levels variation along with the building height (LAeq, dB (A)).
The day-time and night-time limit on noise levels for residence are 55 dB (A) and 45 dB (A), respectively [37,42]. For the open-window scenario, measured noise levels (LAeq) exceeded the limitation either during the day or in the evening. However, if the room windows were kept closed, the noise levels decreased rapidly and were below the standard limit. Although the noise levels during the day were close to the limit on the lower floors, they were still within the acceptable range.
Besides, the day-time noise levels showed a generally decreasing trend along with the building height for both measured conditions. Due to the impacts of the building construction, noise levels at lower floors were higher than those at upper floors, up to 10 dB (A). When the construction activities stopped in the evening, noise level differences between lower and upper floors were reduced. Because of the existence of multiple noise sources, it was hard to explicitly identify the noise impacts from the subway operation during the measurement.
3.1.3. Noise Variation in Apartments on the Same Floor
Noise levels were measured in all apartments on the 15th floor to ascertain the most significant noise impact within the different rooms, as shown in Figure 5. All measurements were conducted keeping the room windows open.
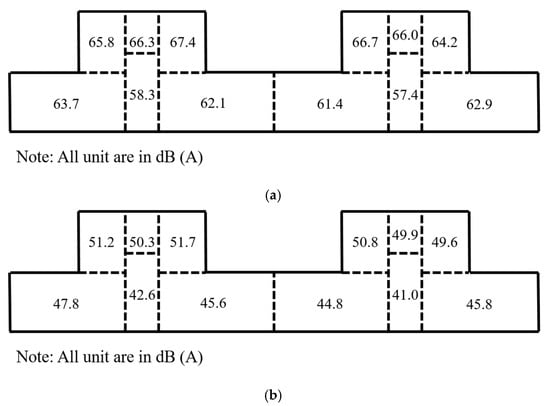
Figure 5.
Measured noise levels in different rooms on the 15th floor. (a) Day-time measurements; (b) Night-time measurements.
Figure 5 is the plan view of the 15th floor, together with the measured noise levels, and each box represents an individual apartment. There are several rooms in an apartment. To specify the most severe noise impact, measured noise levels shown in Figure 5 were the maximum value measured within each apartment. It is seen from Figure 5 that noise levels at the top of the plan view were higher than those at the bottom, no matter measured in the day or at night. This noise distribution was similar to that at ground level as depicted in Figure 4. Noise levels at the side closer to the construction site and the road were higher. From Figure 5, it is also found that noise levels related to the staircase and elevator shaft were the lowest because of their enclosed configurations.
3.2. Vibration Exposure
The acceleration level variation along the building height was shown in Figure 6. The acceleration level for each floor was obtained by selecting the maximum value in the corresponding 1/3 octave band spectra.
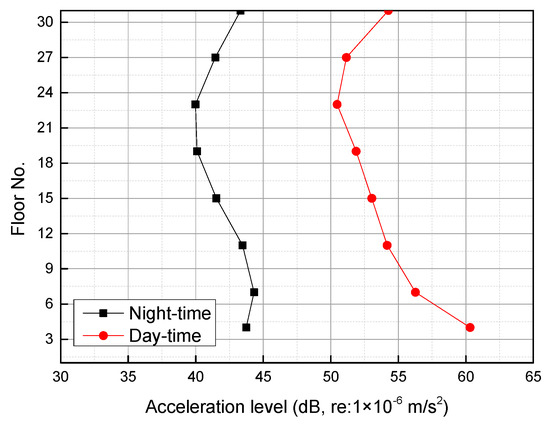
Figure 6.
Acceleration levels variation along with the building height.
The day- and night-time range of measured maximum vertical acceleration levels were 50.5–60.3 dB and 40.0–44.3 dB, respectively. These measurements were well below their corresponding limitation, where the day-time limit is 70 dB and the night-time limit is 67 dB. It is seen that the night-time acceleration levels were more than 10 dB lower than day-time measurements, which implied the primary vibration sources of the building came from the construction site with day-time activities.
As shown in Figure 6, the vibration gradually decayed from lower floors to middle floors, while amplifications were seen on the upper floors. The possible reason is that there are no vertical supporting structures above the top floor for continuous vibration transmission. When vibration energy arrived at the top floor, part of them will spread out from structural intersections into floor slabs and gradually dissipates while other of them may act as standing waves enhancing the building vibration [43,44].
Figure 7 shows a typical day-time and night-time acceleration time histories within the building. Lots of instantaneous vibration peaks can be observed in the day-time acceleration time histories because of the discontinuous construction equipment operation from the construction site.
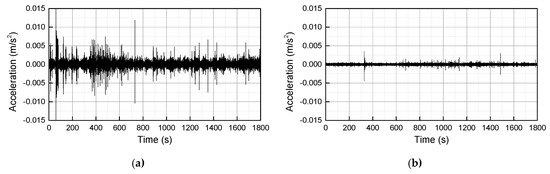
Figure 7.
Typical measured acceleration time histories within the building. (a) Day-time; (b) Night-time.
Accelerations during the day were much higher than those at night. The maximum acceleration in the day was 0.015 m/s2, and most of the day-time measurements were below 0.005 m/s2. According to ISO standard, the human cannot feel vibrations where the root mean square of acceleration below 0.315 m/s2, which indicated the vibration impacts on human comfort within this building could be ignored.
Figure 8 shows the typical 1/3 octave band spectra within the building for both the day- and night-time scenarios. The difference between day- and night-time vibrations showed up from 25 Hz, especially at higher frequencies between 63–200 Hz. The more considerable discrepancies in higher frequencies can be attributed to the vibration impacts from instantaneous and irregular mechanical equipment operations of the construction activities. As construction activities stopped at night, acceleration levels at higher frequencies were also reduced. Vibration components below 25 Hz are more likely related to the natural frequencies of the building rather than external vibration sources.
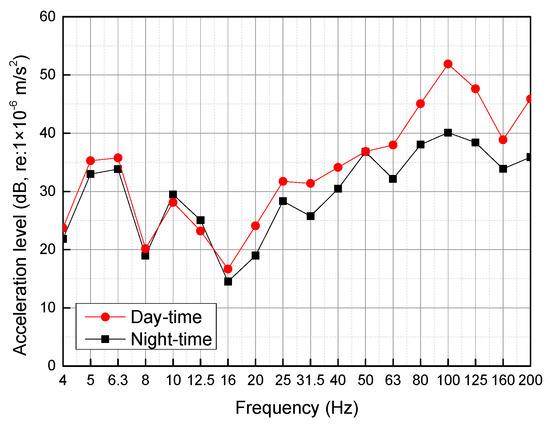
Figure 8.
Typical 1/3 octave band spectra within the building.
3.3. Questionnaire
3.3.1. Noise and Vibration Annoyance
There are individual differences in how people perceive environmental noise and vibration. Figure 9 summarizes the noise and vibration annoyance responses from the residents of the building. A five-point ordinal scale, from 1 = ”not at all” to 5 = “extremely”, was used for the rating.
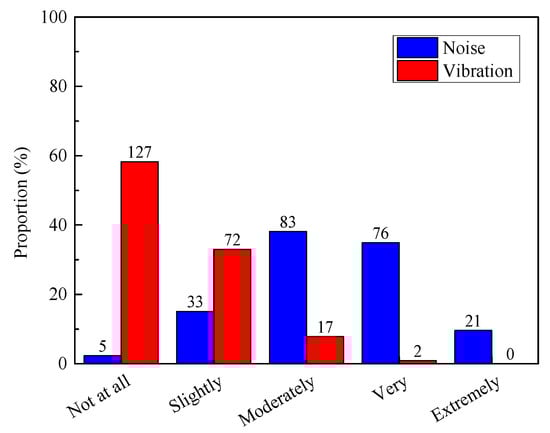
Figure 9.
Annoyance from surrounding environmental noise and vibration.
As shown in Figure 9, 97.7% (n = 213) of respondents were more or less annoyed by environmental noise, and 44.5 % (n = 97) of respondents felt high (extremely and very) affected. The average rate on noise annoyance was 3.34, which indicated the noise has severely affected residents’ normal life. However, respondents’ responses to environmental vibration were more relaxed. Only 41.7% (n = 91) of respondents felt the vibrations and depicted their impacts as slightly and moderately. The average rate on vibration annoyance was just 1.36, which was much lower than that of noise. It is believed that the impact of noise is much more apparent than that from vibration.
3.3.2. Noise and Vibration Dissatisfaction
Figure 10 plots the residents’ dissatisfaction responses to surrounding environmental noise and vibration. In terms of dissatisfaction evaluation, less than 15% of the respondents were satisfied with the surrounding noise environment, but on the contrary, the satisfaction proportion toward the living vibration environment was close to 80%.
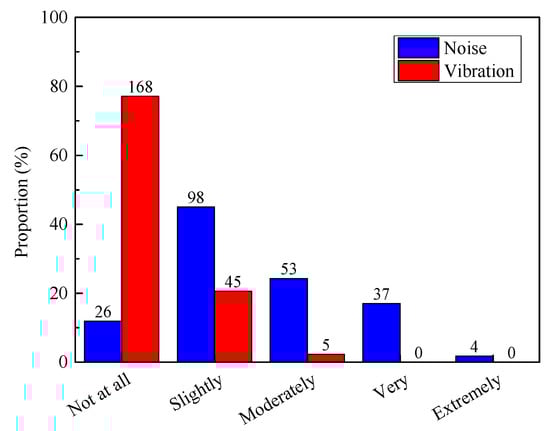
Figure 10.
Dissatisfaction from surrounding environmental noise and vibration.
It is seen from Figure 10 that about 85% and 25% of respondents are dissatisfied with the noise and vibration environment. Nevertheless, compared with the survey on annoyance, the average dissatisfaction rates were decreased both for noise and vibration impacts, which were 2.52 and 1.25, respectively. The proportions of respondents who felt no noise and vibration annoyance at all are 2.3% and 58.3%, while the proportions of whom felt no noise and vibration dissatisfaction at all are 11.9% and 77.1%. The statistical analysis indicates that the threshold for annoyance is lower than that for dissatisfaction. The possible reason for this phenomenon is that people have developed an adaptation to the noise and vibration which they are often suffered from. As time goes on, such adaptability leads to acceptance to some extent. Thus, although many residents thought noise and vibration were disturbing, they psychologically tolerated the impacts. However, this does not mean the impacts of noise and vibration on residents’ health can be ignored.
Figure 11 shows the respondents’ concerns about the vibration impacts on property damage. The statistics were inconsistent with those of vibration annoyance. Only about 40% of respondents felt annoyed by the vibration, but 73.8% (n = 161) of respondents worried about the property damage caused by the vibration. The average rate over damage concerns was 2.19, which was 0.83 higher than that on vibration annoyance.
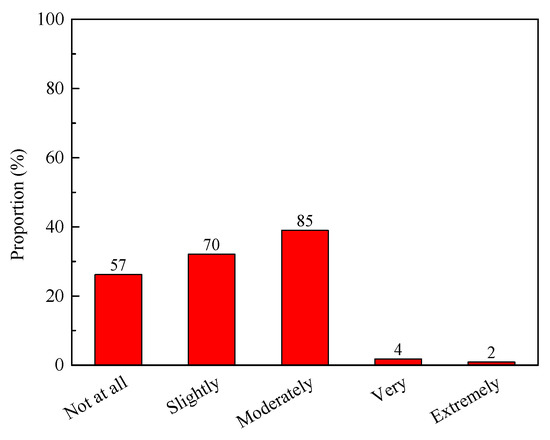
Figure 11.
Respondents’ concerns about vibration-induced damage.
3.3.3. Perceived Noise and Vibration Sources.
The possible noise sources affecting the building residents include building construction, car horns and sirens, people on the street, and neighborhood. It is seen from Figure 12 that the subway operation-induced noise barely has any impact. The noise impact from building construction was apparently dominant, with 69.7% (n = 152) perceived percentage and 83.9% (n = 183) annoyed percentage. For the type of construction noise, the annoyed percentage was 14.2% higher than the perceived percentage, which implies this type of noise has the characteristic of high annoyance.
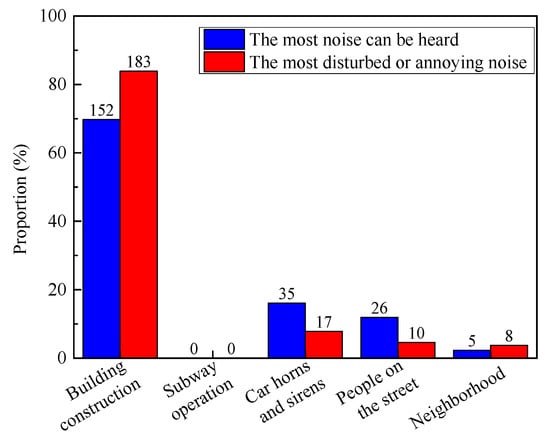
Figure 12.
Impact proportions of different noise sources.
The possible vibration sources affecting the building residents include building construction, road traffic, and other activities. It is seen from Figure 13 that the subway operation-induced vibration barely has an impact. Like the noise impact, the vibration impact from building construction was dominant, with 85.8% (n = 187) perceived percentage and 91.7% (n = 200) annoyed percentage. For the type of construction vibration, the annoyed percentage was just 5.9% higher than the perceived percentage. This discrepancy was narrower than that from construction noise.
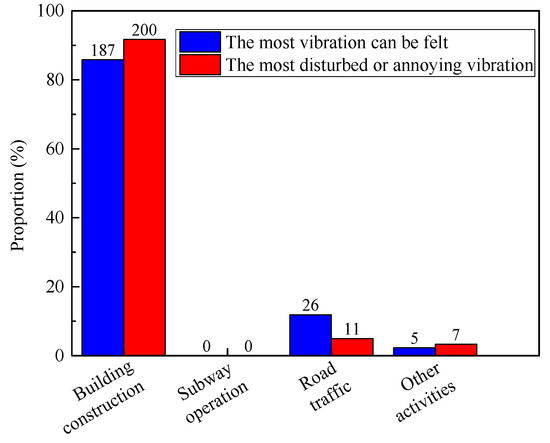
Figure 13.
Impact proportions of different vibration sources.
3.4. Dose-Response Relationship for Noise Annoyance Induced by Building Construction
According to DELTA [39], the dose-response curve represents the relationship between noise exposure and annoyance. The dose-response curve for vibration is not discussed in this research because the vibration impacts in this building were negligible. Figure 14 shows the measured day-time noise levels together with subjective annoyance scores obtained from corresponding questionnaire surveys. A fitting curve is also drawn, which matches the average subjective annoyance scores well. The solid black dots in Figure 14 correspond to the annoyance score at each measured noise level. The total range of 41–73 dB (A) is divided into 14 sections from 41–43 dB (A) to 71–73 dB (A). Then, the average score for each section was calculated based on individual events located in it, as shown with red solid rectangular dots in Figure 14. Generally, the annoyance increased with increased noise levels.
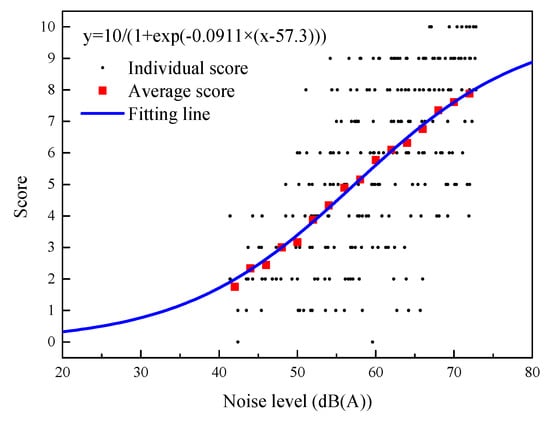
Figure 14.
Measured noise levels and corresponding subjective annoyance scores.
Figure 15 shows the relationships between day-time noise levels (LAeq) and corresponding values of %HA, %A, and %LA. It is found in Figure 15, the annoyed percentage increased rapidly in the range of 46–70 dB (A). When the day-time noise level increased from 50 dB(A) to 70 dB (A), %HA varied from below 10% to near 70%, which indicated that the people are sensitive to noise levels above 50 dB (A).
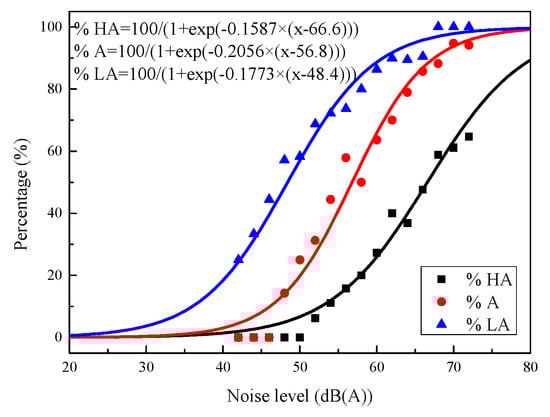
Figure 15.
The dose-response relationship for noise.
In general, the logistic equations of %HA, %A, and %LA match the data well and have the ability of noise annoyance estimation. The parameters of each equation were listed in Table 3.
Table 3.
Parameters of the dose-response relationship.
The proposed dose-response relationships can be applied in similar community environments to evaluate residents’ noise annoyance. If the noise level is determined, corresponding residents’ responses on noise annoyance can be estimated.
4. Discussion
The noise measurements revealed the most impacted apartments or rooms within the residential building were on the north facade close to a construction site. Noise levels within the building were slightly amplified from lower floors to middle floors and then gradually attenuated with increasing height. Generally, a building received noises from all directions, and the noise levels in the lower floors were relatively smaller than that on the middle floors because there are noise barriers around lower floors, such as trees and walls. This explains why the measured noise level on the 7th floor was consistently higher than that on the 4th floor. This phenomenon is also confirmed by Wu et al. [42]. All measured noise levels exceeded the corresponding day-time limit of 55 dB (A) and night-time limit of 45 dB (A) when the room windows kept opened. However, the noise levels in the room were largely reduced and below the corresponding limits when the windows were closed. This probably helped increase the residents’ tolerance towards noise impacts because they could manage to control the noise levels to some extent.
Different from noise transmission, vibration levels decayed with the increasing floors, and amplification was shown on the upper floors. Vibration transmitted upwards within the building along with solid media like columns and walls. Because of material and structural damping, the vibration energy will dissipate, and decayed vibration levels are shown. At upper floors, vibration amplification exists because of the standing wave, and there is no vertical component above the top floor for vibration transmission. Measured vibration levels within the building did not exceed the corresponding standard limits, and the amplitude of the vibration accelerations indicated they were not feelable.
It is hard to identify the main noise and vibration source from the measurements alone. Together with the questionnaire survey, it is found that the construction site is the dominant noise and vibration source for this building. Both noise and vibration impacts from subway operations can be ignored. There is consistency between the results of measurements and the questionnaire survey. In this case, possible effective measures could be taken to reduce noise impacts rather than vibration impacts.
Due to individual differences coming from factors such as gender, age, living habits, socio-economic conditions, and others, each person’s tolerance towards noise and vibration was also different. It is not adequate to evaluate noise and vibration impacts just using the measured levels. The subjective survey from the questionnaire is a complementary method. It was also found in the questionnaire survey that the vibration impact was very limited in this building while construction noise was more problematic.
Although the respondents barely felt the vibration, most of them concerned about potential property damage the vibration may bring. During the investigation, it was found that many respondents could not tell the difference between the noise and the vibration. They roughly thought the louder the noise they heard, the higher the vibration was. This explained why they worried about potential property damage from the vibration they even could not feel. From another point of view, the concepts of noise and vibration need to be popularized in our society.
In order to construct the dose-response relationship, noise measurements were conducted, and the respondents were asked to give the most authentic feeling about the noise by selecting the 11-point categorical scale from 0 to 10. Although the proposed dose-response relationship matches the current data well, it was still limited because of the limitations on samples. Therefore, the proposed logistic equations need to be further studied and validated by applying them to other communities in the future.
Considering the construction noise control, a reasonable selection of low-noise construction machinery and advanced construction technology is necessary. It is also essential to pay attention to the maintenance of construction equipment since equipment degradation could result in higher noise levels. The schedule shall be reasonably arranged for construction activities, which may cause high noise levels, such as pile drilling, concrete pouring. They should be arranged in the day to avoid disturbing the sleeping quality of residents nearby. Night-time construction should be prohibited, especially in the noise-sensitive area. Advanced construction techniques are encouraged to be adopted [45]. Relevant regulations of local government are also of great significance.
5. Conclusions
This research conducted noise and vibration measurements as well as a questionnaire survey to explore the residents’ responses towards the noise and vibration environment. The dominant noise and vibration source for the studied residential building is a construction site nearby, which is also the main analyzing target of this paper.
The noise impact is found much higher than the vibration impact. Construction noise shows a characteristic of high annoyance. From statistical analysis, the threshold for dissatisfaction is higher than that for annoyance, indicating residents have psychological tolerance toward noise and vibration impacts to some extent. Compared to annoyance, residents have more concerns about the possible property damage caused by the vibration.
The proposed dose-response relationship curves correlate the objectively measured noise levels and subjective residents’ responses well. We conclude that the proposed dose-response relationship can be applied in a similar community environment to evaluate residents’ noise annoyance. If the noise level is determined, corresponding residents’ responses on noise annoyance can be estimated. Future researches on further verification of the proposed dose-response relationship are necessary.
Author Contributions
Conceptualization, C.Z. and Y.C.; methodology, C.Z.; software, R.Z.; validation, C.Z., Y.C. and Z.T.; data curation, R.Z. and D.O.; writing—original draft preparation, C.Z.; writing—review and editing, D.O. and Z.T.; supervision, Y.C.; funding acquisition, C.Z. All authors have read and agreed to the published version of the manuscript.
Funding
This research was funded by the National Natural Science Foundation of China, grant number 51908139, and the Science and Technology Project of Guangdong province, China, grant number 2015B090901054.
Conflicts of Interest
The authors declare no conflict of interest.
References
- Jarosińska, D.; Héroux, M.È.; Wilkhu, P.; Creswick, J.; Verbeek, J.; Wothge, J.; Paunović, E. Development of the WHO environmental noise guidelines for the European region: an introduction. IJERPH 2018, 15, 813. [Google Scholar] [CrossRef]
- Wang, H.; Gao, H.; Cai, M. Simulation of traffic noise both indoors and outdoors based on an integrated geometric acoustics method. Build. Environ. 2019, 160, 106201. [Google Scholar] [CrossRef]
- Ma, M.; Liu, W.; Qian, C.; Deng, G.; Li, Y. Study of the train-induced vibration impact on a historic Bell Tower above two spatially overlapping metro lines. Soil Dyn. Earthq. Eng. 2016, 81, 58–74. [Google Scholar] [CrossRef]
- Ma, M.; Jiang, B.; Gao, J.; Liu, W. Experimental study on attenuation zone of soil-periodic piles system. Soil Dyn. Earthq. Eng. 2019, 126, 105738. [Google Scholar] [CrossRef]
- Lee, P.J.; Park, S.H.; Jeong, J.H.; Choung, T.; Kim, K.Y. Association between transportation noise and blood pressure in adults living in multi-story residential buildings. Environ. Int. 2019, 132, 105101. [Google Scholar] [CrossRef] [PubMed]
- Park, S.H.; Lee, P.J.; Jeong, J.H. Effects of noise sensitivity on psychophysiological responses to building noise. Build. Environ. 2018, 136, 302–311. [Google Scholar] [CrossRef]
- Sung, J.H.; Lee, J.; Jeong, K.S.; Lee, S.; Lee, C.; Jo, M.W.; Sim, C.S. Influence of transportation noise and noise sensitivity on annoyance: a cross-sectional study in South Korea. IJERPH 2017, 14, 322. [Google Scholar] [CrossRef]
- Stansfeld, S.; Clark, C. Health effects of noise exposure in children. Curr. Environ. Health Rep. 2015, 2, 171–178. [Google Scholar] [CrossRef]
- Duarte, M.L.M.; de Brito, P.M. Vision influence on whole-body human vibration comfort levels. Shock Vib. 2006, 13, 367–377. [Google Scholar] [CrossRef]
- Xie, H.; Kang, J.; Tompsett, R. The impacts of environmental noise on the academic achievements of secondary school students in Greater London. Appl. Acoust. 2011, 72, 551–555. [Google Scholar] [CrossRef]
- Woolner, P.; Hall, E. Noise in schools: a holistic approach to the issue. IJERPH 2010, 7, 3255–3269. [Google Scholar] [CrossRef] [PubMed]
- Sarantopoulos, G.; Lykoudis, S.; Kassomenos, P. Noise levels in primary schools of medium sized city in Greece. Sci. Total Environ. 2014, 482, 493–500. [Google Scholar] [CrossRef] [PubMed]
- Ko, Y.Y.; Chen, C.H. Soil–structure interaction effects observed in the in situ forced vibration and pushover tests of school buildings in Taiwan and their modeling considering the foundation flexibility. Earthq. Eng. Struct. Dyn. 2010, 39, 945–966. [Google Scholar] [CrossRef]
- Wu, W.H.; Wang, S.W.; Chen, C.C.; Lai, G. Assessment of environmental and nondestructive earthquake effects on modal parameters of an office building based on long-term vibration measurements. Smart Mater. Struct. 2017, 26, 055034. [Google Scholar] [CrossRef]
- Pierrette, M.; Parizet, E.; Chevret, P.; Chatillon, J. Noise effect on comfort in open-space offices: development of an assessment questionnaire. Ergon. 2015, 58, 96–106. [Google Scholar] [CrossRef]
- Bréchet, T.; Picard, P.M. The economics of airport noise: How to manage markets for noise licenses. Transp. Res. Part D: Transp. Environ. 2012, 17, 169–178. [Google Scholar] [CrossRef]
- Netjasov, F.T. A model of air traffic assignment as a measure for mitigating noise at airports: the Zurich Airport case. Transp. Plan. Technol. 2008, 31, 487–508. [Google Scholar] [CrossRef]
- Fu, Y.; Li, Y.; Tan, Y.; Zhang, C. Dynamic response analyses of snow-melting airport rigid pavement under different types of moving loads. Road Mater. Pavement Des. 2019, 20, 943–963. [Google Scholar] [CrossRef]
- Wang, P.; Wang, Y.; Zou, C.; Guo, J. A preliminary investigation of noise impact within metro stations in the urban city of Guangzhou, China. Environ. Sci. Pollut. Res. 2017, 24, 11371–11382. [Google Scholar] [CrossRef]
- Sü, Z.; Çalışkan, M. Acoustical design and noise control in metro stations: case studies of the Ankara metro system. Build. Acoust. 2007, 14, 203–221. [Google Scholar] [CrossRef]
- Zhang, H.; Pei, Y. Simulation-based prediction of equivalent continuous noises during construction processes. IJERPH 2016, 13, 818. [Google Scholar] [CrossRef] [PubMed]
- Newmark, M.S.; Zapfe, J.A.; Wood, E.W. Monitoring construction vibrations at sensitive facilities. Sound Vibr. 2011, 45, 15–18. [Google Scholar] [CrossRef]
- Xiong, W.; Cai, C.; Kong, B.; Zhang, X.; Tang, P. Bridge Scour Identification and Field Application Based on Ambient Vibration Measurements of Superstructures. JMSE 2019, 7, 121. [Google Scholar] [CrossRef]
- Hao, H.; Ang, T.C.; Shen, J. Building vibration to traffic-induced ground motion. Build. Environ. 2001, 36, 321–336. [Google Scholar] [CrossRef]
- Li, F.; Lin, Y.; Cai, M.; Du, C. Dynamic simulation and characteristics analysis of traffic noise at roundabout and signalized intersections. Appl. Acoust. 2017, 121, 14–24. [Google Scholar] [CrossRef]
- Song, X.; Li, Q.; Wu, D. Investigation of rail noise and bridge noise using a combined 3D dynamic model and 2.5 D acoustic model. Appl. Acoust. 2016, 109, 5–17. [Google Scholar] [CrossRef]
- Cheng, G.; Feng, Q.; Sheng, X.; Lu, P.; Zhang, S. Using the 2.5 D FE and transfer matrix methods to study ground vibration generated by two identical trains passing each other. Soil Dyn. Earthq. Eng. 2018, 114, 495–504. [Google Scholar] [CrossRef]
- Olayinka, O.S.; Abdullahi, S.A. An overview of industrial employees’ exposure to noise in sundry processing and manufacturing industries in Ilorin metropolis, Nigeria. Ind. Health 2009, 47, 123–133. [Google Scholar] [CrossRef]
- China environmental noise and control annual report. Available online: http://www.gov.cn/guoqing/2018-10/01/content_5380692.htm (accessed on 13 November 2019).
- Wong-McSweeney, D.; Woodcock, J.; Waddington, D.; Peris, E.; Koziel, Z.; Moorhouse, A.; Redel-Macías, M.D. Effect of attitudinal, situational and demographic factors on annoyance due to environmental vibration and noise from construction of a light rapid transit system. IJERPH 2016, 13, 1237. [Google Scholar] [CrossRef]
- Hong, T.; Ji, C.Y.; Park, J.; Leigh, S.B.; Seo, D.Y. Prediction of environmental costs of construction noise and vibration at the preconstruction phase. J. Manag. Eng. 2014, 31, 04014079. [Google Scholar] [CrossRef]
- Vogiatzis, K.E.; Kouroussis, G. Environmental ground-borne noise and vibration from urban light rail transportation during construction and operation. Curr. Pollut. Rep. 2017, 3, 162–173. [Google Scholar] [CrossRef]
- Mouzakis, C.; Vogiatzis, K.; Zafiropoulou, V. Assessing subway network ground borne noise and vibration using transfer function from tunnel wall to soil surface measured by muck train operation. Sci. Total Environ. 2019, 650, 2888–2896. [Google Scholar] [CrossRef] [PubMed]
- Vogiatzis, K.; Mouzakis, H. Ground-borne noise and vibration transmitted from subway networks to multi-storey reinforced concrete buildings. Transport 2018, 33, 446–453. [Google Scholar] [CrossRef]
- Tao, Z.; Wang, Y.; Zou, C.; Li, Q.; Luo, Y. Assessment of ventilation noise impact from metro depot with over-track platform structure on workers and nearby inhabitants. Environ. Sci. Pollut. Res. 2019, 26, 9203–9218. [Google Scholar] [CrossRef]
- International Electrotechnical Commission. Electroacoustics-Sound Level Meters-Part 1: Specifications (IEC 61672–1); International Electrotechnical Commission: Geneva, Switzerland, 2013. [Google Scholar]
- GB 3096–2008. Environmental Quality Standard for Noise; China’s State Environmental Protection Administration: Beijing, China, 2008.
- Tao, Z.; Wang, Y.; Sanayei, M.; Moore, J. Experimental study of train-induced vibration in over-track buildings in a metro depot. Eng. Struct. 2019, 198, 109473. [Google Scholar] [CrossRef]
- Magalhães, B.; Silva, L.T. The noise impact in the learning-teaching process in an elementary school. In Proceedings of the 8th WSEAS International Conference on Environment, Ecosystems and Development (EED’10), Atheens, Greece, 29–31 December 2010; pp. 37–42. [Google Scholar]
- Silva, L.T.; Oliveira, I.S.; Silva, J.F. The impact of urban noise on primary schools. Perceptive evaluation and objective assessment. Appl. Acoust. 2016, 106, 2–9. [Google Scholar] [CrossRef]
- DELTA, (Danish Electronics, Light and Acoustics) The “Genlyd” noise annoyance model. Dose-response relationships modelled by logistic functions. Available online: http://assets.madebydelta.com/docs/share/Akustik/The_Genlyd_Noise_Annoyance_Model.pdf (accessed on 20 March 2007).
- Wu, J.; Zou, C.; He, S.; Sun, X.; Yu, Z.; Wang, X. Traffic noise exposure of high-rise residential buildings in urban area. Environ. Sci. Pollut. Res. 2019, 26, 8502–8515. [Google Scholar] [CrossRef]
- Zou, C.; Moore, J.A.; Sanayei, M.; Wang, Y. Impedance model for estimating train-induced building vibrations. Eng. Struct. 2018, 172, 739–750. [Google Scholar] [CrossRef]
- Zou, C.; Wang, Y.; Moore, J.A.; Sanayei, M. Train-induced field vibration measurements of ground and over-track buildings. Sci. Total Environ. 2017, 575, 1339–1351. [Google Scholar] [CrossRef]
- Xu, X.; Huang, Q.; Ren, Y.; Zhao, D.Y.; Zhang, D.Y.; Sun, H.B. Condition evaluation of suspension bridges for maintenance, repair and rehabilitation: a comprehensive framework. Struct. Infrastruct. Engin. 2019, 15, 555–567. [Google Scholar] [CrossRef]


© 2020 by the authors. Licensee MDPI, Basel, Switzerland. This article is an open access article distributed under the terms and conditions of the Creative Commons Attribution (CC BY) license (http://creativecommons.org/licenses/by/4.0/).