Article

Sustainable Masonry Made from Recycled Aggregates: LCA Case Study

1
University Centre for Energy Efficient Buildings of Czech Technical University in Prague, Czech Technical University in Prague, 273 43 Buštěhrad, Czech Republic
2
Department of Environmental Chemistry, Faculty of Environmental Technology, University of Chemistry and Technology, 166 28 Prague, Czech Republic
*
Author to whom correspondence should be addressed.
Sustainability 2020, 12(4), 1581; https://doi.org/10.3390/su12041581
Submission received: 10 January 2020 / Revised: 11 February 2020 / Accepted: 17 February 2020 / Published: 20 February 2020
(This article belongs to the Section Sustainable Engineering and Science)

Abstract

:
For a sustainable building industry, reusable construction with a low demand for primary resources is needed. Moreover, if we want to reduce the amount of construction and demolition waste, construction with recycled aggregate should be considered. To investigate the environmental impacts of such concrete construction, life cycle assessment (LCA) was used to compare the following types of concrete construction: Reusable blocks with recycled brick aggregate, reusable blocks with recycled concrete, reusable blocks with natural aggregate, and regular concrete wall. Firstly, the properties of new concrete with recycled aggregate were measured, such as physical, mechanical, and thermal properties. Then, different constructions were designed and assessed using the method of Institute of Environmental Sciences (CML2001) and the method of National Institute for Public Health and the Environment (ReCiPe 2016) as characterization methods. Unsurprisingly, the regular concrete wall had a higher impact on most of the impact categories, e.g., 113 kg CO2 eq. (in the first scenario, using CML2001). In accordance with the circular principles, the reusability of blocks and recycling of aggregate are the main factors that affect the environmental impact of the constructions. Thus, the global warming potential (GWP) of construction with reusable recycled concrete blocks was only 53 kg CO2 eq. (in the second scenario). Moreover, we show differences in the results of CML2001 and ReCiPe 2016, e.g., in the Photochemical Oxidant Creation category.

1. Introduction

The main sustainability hierarchy goes through three ‘Rs’: First, reduction, reuse, and finally, recycling. The utilization of reusable blocks with recycled aggregate meet all three ‘Rs’. These reusable blocks, which have been used in previous construction, can be reused in new construction. Furthermore, it is possible to reduce primary sources and construction and demolition waste through recycling. The research about the utilization of recycled aggregate for concrete was started in the 1940s [1].
The utilization of recycled aggregate (RA) from construction and demolition waste (CDW) as a partial or full replacement of natural aggregate (NA) in concrete mixtures mostly negatively influences its mechanical and durability properties. However, RA has a positive impact on thermal properties [2,3]. The RA from waste concrete (RCA) is mostly used for constructing base layers in road structures and RA from waste masonry (RMA), as backfill layers or as layers to make landfills safe. The properties of recycled aggregate concrete (RAC) are influenced by the replacement rate of RA, as well as by its quality and composition [4]. The properties of RA are mostly influenced by the unwanted impurities, which are materials usually contained in the CDW, such as soil, dust, plastics, paper, textile, etc. However, these impurities are able to separate during selective demolition and the two-phase recycling process, which leads to the higher quality of RA. In previous studies [5,6,7], the maximal possible replacement rate of NA by RCA without the decline of properties has been found to be 30% or 50%, which is also defined in the European Standard [8]. In the case of recycled masonry aggregate concrete (RMAC), it was found that the coarse natural aggregate (NA) can be replaced by up to 15% without the decline of properties. Further, the compressive strength decrease of concrete with the full replacement of natural gravel by coarse RMA is 35% [9]. The conclusions from the studies of the replacement of natural sand by fine RA are still not clear. In some studies, it has been found that natural sand can be replaced by fine RA up to a level of 30% without significant effects on the mechanical properties of concrete [10]. On the contrary, the results of another study showed the increase of compressive strength of concrete with the full replacement of natural sand by fine RA [11]. RMA containing high amounts of waste masonry and fine RA has not found adequate utilization yet due to the fact that these types of RA cannot be used as an aggregate for concrete according to European standards [8].
The reusable structural elements made of concrete with RA originating from CDW can, at the same time, reduce the amount of landfilled waste and decrease the consumption of primary resources. For sustainable management, both of these aspects should be considered. There have been many studies published in which concrete including different recycled materials is used for structural elements, for instance, RCA [12,13,14,15,16,17,18], RMA [2,19,20,21,22,23,24,25,26,27], glass waste [28,29,30,31], crumb rubber waste [32,33,34], ceramic and tile industry waste [35], marble waste [36,37], plastic waste [38], and concrete slurry waste [39,40]. The use of RA as a partial or full replacement of aggregate in structural concrete was examined for manufacturing precast prestressed beams [41], paving with precast concrete [23], paving blocks or hollow tiles [25], concrete masonry blocks for indoor applications [19,20], or concrete wall blocks for mortarless masonry [2]. The utilization of RA for reinforced concrete structural elements is limited due to the inferior durability properties of RAC [42,43].
There have been many studies published that have compared the environmental impacts of RAC and NAC for structural use [44,45,46,47,48,49,50,51,52,53,54,55,56,57,58,59,60,61,62]. The environmental impacts of concrete structural elements can be assessed, for instance, by the life cycle assessment method (LCA) [63]. The environmental impacts of the lower-grade concrete with RA were assessed and compared with NA [47]. The life cycle assessment of different types of aggregate (e.g., river NA, crushed NA, and coarse RA) used for structural concrete and their comparisons have been published in a few studies. Furthermore, the importance of different types of transportation and transport distances has been assessed in these studies [47,48,51,54,60,61]. It has been also published that the decline of RAC properties could be compensated for with additional cement, which slightly influences the environmental impacts of this material [44,62]. The environmental impacts of CDW recycling could also be affected by special types of recycling, such as separating the attached cement mortar from the aggregate surface from waste concrete by heat treatment and abrasion or separation by microwave heating [64,65].
In the abovementioned LCA studies, the environmental impacts are assessed using different characterization methods. One of the used methods is the the characterization method of Institute of Environmental Sciences (CML2001). The characterization factors of this method are used also for environmental assessment of construction products according to EN 15 804 + A1. In this study, the results were performed using CML2001—January 2016. Nevertheless, this method uses characterization models, which insufficiently describe the environmental impacts in some categories, such as the Photochemical Ozone Creation category. Therefore, this study also used the method of National Institute for Public Health and the Environment (ReCiPe 2016 v1.1) as characterization method and both sets of results were interpreted together.
This paper presents a comparison of the four wall systems with the same utility characteristics, as well an environmental evaluation of the systems using the LCA method. The following constructions were compared: (1) Reusable masonry blocks made of RMAC with full replacement of NA by RMA; (2) reusable masonry blocks made of RCAC with full replacement of natural gravel and partial replacement of natural sand by RCA; (3) reusable masonry blocks made of NAC with only NA; (4) conventional concrete wall system with only NA. These constructions were compared in four scenarios with the different time scales of use and other assumptions. All of the compared solutions have the same utility properties, such as concrete strength class, thermal properties, and methods of use. The different thermal conductivity of concretes is compensated for by the various thicknesses of thermal insulation to reach the same heat transfer coefficient. The functional unit of comparison was 1 square meter of a wall system.

2. Materials and Methods

2.1. Materials

Three different concrete mixtures with different aggregate types and ordinary Portland cement (OPC) were designed for the same utility properties and structural use with:
  • RMAC: Recycled aggregate concrete with RMA (100% replacement ratio) and OPC;
  • RCAC: Recycled aggregate concrete with coarse RCA (100% replacement ratio), fine RCA (75% replacement ratio), and OPC;
  • NAC: Natural aggregate concrete made entirely with NA and OPC.

2.1.1. Recycled Aggregate Properties

The RA originated from waste concrete and masonry and was produced by the recycling center in the Czech Republic. The concrete or masonry fragments were crushed in the mobile recycling plant to the fractions 0/128 and sieved to fractions 0/4, 4/16, and 16/128 mm. In the next step, the fraction 16/128 was crushed again and sieved to fractions 0/4, 4/8, and 8/16 mm. The aggregate was treated in the natural air humidity. In the case of concrete mixtures containing RA, the higher water absorption of RA was compensated by the additional water amount, which was calculated on the basis of the water absorption of RA after 10 min.
It is generally known that the RA has higher water absorption and lower density than NA, which has been verified in the previous research. It has been established that the water absorption of coarse RMA ranges from 10% to 19% [9,66,67,68], and fine RMA from 12% to 15%, [9,69,70]. The dry density of coarse RMA ranges between 1800 and 2700 kg/m3 and fine RMA between 2000 and 2500 kg/m3 [9,66,67,68,69,71]. The water absorption of coarse RCA ranges between 0.5% and 14.75%, and the dry density of coarse RCA ranges from 1900 to 2700 kg/m3 [6]. The water absorption of fine RCA ranges between 4.3% and 13.1% and the dry density of fine RCA ranges from 1900 to 2360 kg/m3 [72]. The pycnometric method according to the CSN EN 1097-6 standard was used for the verification of water absorption and density of aggregate. Water absorption of RMA after 24 h of fraction 4/8 mm ranges from 11.5% to 12.5% and of fraction 8/16 mm varied from 10.0% to 11.0%. The oven-dried density of fraction 4/8 mm was 2000 kg/m3 and 2100 kg/m3 for fraction 8/16 mm. Water absorption of RCA after 24 h of fraction 4/8 mm was 7.0% and of fraction 8/16 mm varies from 6.0%. The oven-dried density varied from 2400 kg/m3 for both fractions. The results of the RCA and RMA properties correlate with the results of previous studies.

2.1.2. Concrete Mixes

The composition of RAC mixtures was designed according to the Czech standard [8] and the granular skeleton was established according to the Bolomey particle size distribution curve. The parameter A was equal to 16 for the design of RAC mixtures, due to particle shape and roughness [20]. The aim of the mixture design was to reach the compressive strength class of concrete (C20/25) by the optimization of the amount of cement (CEM I 42.5 R) and effective water/cement ratio. The cement content was various due to the mechanical properties of concretes. The cement content in RAC mixtures was 320 kg/m3 and in NAC was 300 kg/m3. The effective water/cement (w/c) ratio refers to the free water content, excluding the amount of additional water, which was added due to the high water absorption of RA. The additional water quantity was calculated on the basis of RA water absorption after 10 min and added to saturate the RA before or during mixing to obtain the desired RAC workability. The properties of aggregates were used for mixture design. No water-reducing admixtures were used. The mixture proportions, given in cubic meters, are shown in Table 1.
The properties of all concretes were tested in laboratory on Controls MCC8 50-C8422/M (CONTROLS S.p.A., Milan, Italy) according to the following standards to obtain the target values: Compressive strength EN 12390-3 (2003); flexural strength EN 12390-5 (2009); static modulus of elasticity EN 12390-13 (2014); dynamic modulus of elasticity EN 12504-4 (2005). For each concrete mix, three samples were tested, and the target concrete strength class was determined according to Eurocode and ISO 12,491, in which the number of tested samples is taken into consideration for strength class determination to exclude their impact. The average values of concrete properties and target strength classes are shown in Table 1.
According to the study [52], the decline of concrete compressive strength with the full replacement of coarse NA by RCA ranges up to 25%. However, the highest decline was mostly examined for modulus of elasticity, which was up to 45% [53]. It was found that the declines of mechanical properties for a full replacement of NA by RA could be compensated for by 8.3% of additional cement and a lower effective water/cement ratio [73]. In this case study, the decline of mechanical properties was compensated for by the addition of 6% of cement and a lower effective water/cement ratio of the RAC mixtures.
The durability of recycled aggregate concrete, which is key for its use in structural applications, was not notably affected in this case; the replacement rate of aggregate by RCA was less than 30% [42]. Nevertheless, in this study, the replacement rate of NA by RCA was almost 100%. For this reason, it was predicted that the durability of the reusable concrete blocks is unsatisfactory. Therefore, the analysis was limited to a structural element for which non-aggressive environmental conditions with protection by thermal insulation were applied.

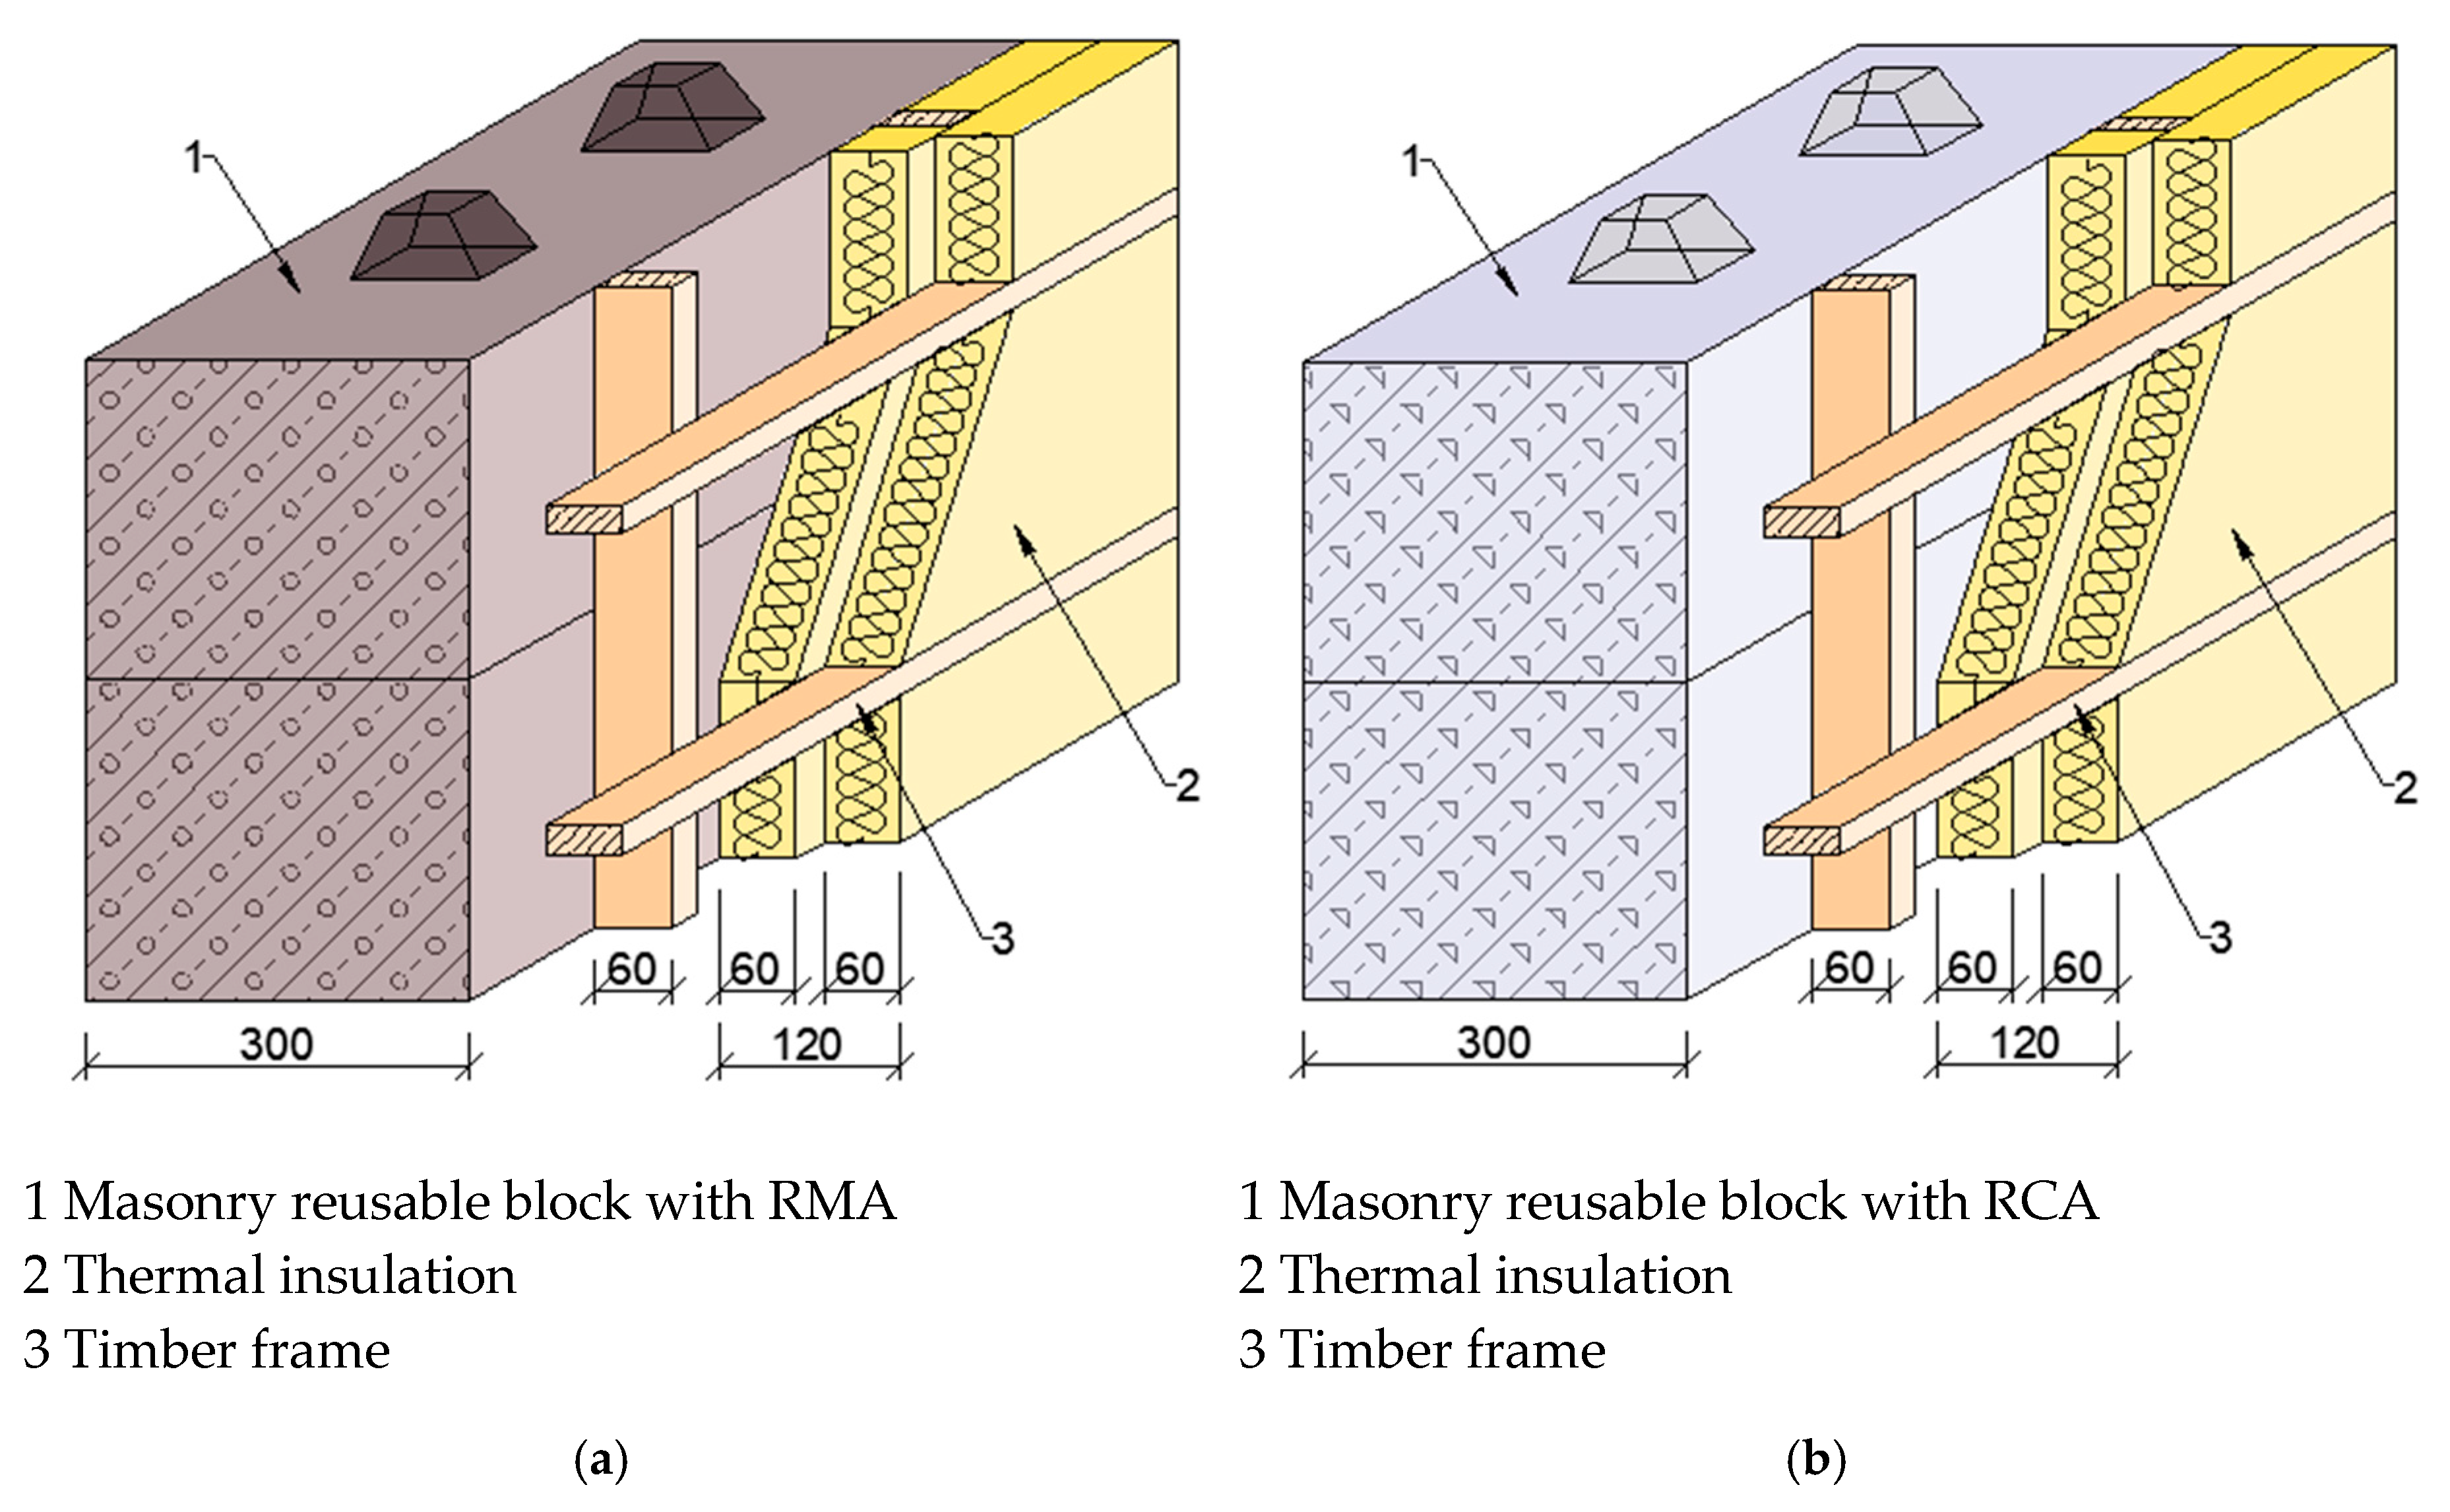
2.2. Description of Assessed Systems

In this study, four construction types were marked as Plan 1, Plan 2, Plan 3, Plan 4. The first construction (Plan 1) combined regular insulation and reusable blocks, which were made of the concrete mixture with recycled brick aggregate. Similarly, Plan 2 construction consisted of reusable blocks made of recycled concrete aggregate. Reusable blocks with thermal insulation were also used in Plan 3, but for this construction, a concrete from primary resources was used. Plan 4 was a regular reinforced concrete wall system with thermal insulation and adhesive. Constructions with reusable blocks included timber frames. All of the constructions had similar thermal insulation properties. The heat transfer coefficient for all Plans was 0.29 W/m2K. The overview of plans is in the Table 2.
The compared constructions were designed to find the answers to questions from the field of civil engineering in the Czech Republic. In the very first step of this study, these questions were used as a background for the choice of the compared concrete wall systems. The first plan was a regular concrete wall system, used as a reference and to represent an ordinary system. To compare the influence of reusable construction, other systems were made of reusable blocks. Moreover, next to a reusable block with natural aggregate, blocks with brick and concrete recycled aggregates were also suggested to test the influence of recycled aggregates. After this choice of wall systems, the constructions were designed. Their detailed description is in Figure 1.

2.3. Goal and Scope of the Study

Constructions were compared using the methodology in accordance with LCA standards (ISO 14040:2006 standard, EN 16757:2017) [74]. LCA was performed in four steps: Goal and scope definition, Life cycle inventory analyses, Life cycle impact assessment, and Interpretation. The goal of this study was to compare the environmental impacts of four concrete constructions in four scenarios to see the influence of blocks’ reusability, end of life processes, and aggregate recycling. The functional unit was 1 m2 of wall construction with similar thermal conductivity (the heat transfer coefficient was 0.29 W/m2K). In the first scenario, the assumed service life was 50 years. It is assumed that 50 years is a typical time scale for one building, and after this time, the building is refurbished or demolished. On the other hand, the typical life span of a concrete block is 100 years. Thus, in the second scenario, it is assumed that while the reusable concrete blocks can be reused, the reinforced concrete wall must be removed and rebuilt. Therefore, in the second scenario, different life spans for construction were assumed: 100 years for construction from reusable blocks and 50 years for the reference reinforced concrete wall system. The same assumption was also made for the third and fourth scenarios. These scenarios were different only at the end of life (EoL) phase. In Scenario 3, the second built wall is demolished and CDW is recycled to produce new concrete aggregates, and the separated wood is incinerated in a waste wood incineration plant to produce electricity and thermal energy. The end-of-life phase for CDW from the second built wall is different in Scenario 4, where CDW including waste wood is just removed to landfill.
In each scenario, the entire life cycle of construction was considered (a cradle-to-grave scale). The following phases were considered: Production (primary resources extraction, secondary raw materials production, transport, manufacturing), use phase (manipulation on construction site, deconstruction), and end of life (demolition, transport, waste removal). A more detailed description of the scenarios is in Table 3.
The system boundaries of the considered scenarios included the following processes: Electricity production (Czech grid mix), recycling of construction and demolition waste (production recycled aggregates), mineral wool production, cement production (CEM I 42,5), lime plaster production, lightweight plaster production, water drawing, construction timber (softwood) production, diesel production (EU-28 mix), transport of materials using truck (Euro 3, up to 28 t gross weight/12.4 t payload capacity), manipulation on the site, construction assembling and disassembling, separating the materials from construction, unspecific construction waste removal on landfill, waste incineration of wood products, credit for energy from wood incineration, and transport of waste materials using a truck (Euro 3, up to 28 t gross weight/12.4 t payload capacity).

2.4. Life Cycle Inventory

The total amount of materials for each construction is shown in Table 4. Every construction was designed with a different type of concrete. Concrete containing recycled concrete aggregate was used in Plan 1 and brick aggregate for concrete was used in Plan 2. Plan 3 and Plan 4 were designed using regular concrete with a natural aggregate.
GaBi 9 software (thinkstep, Leinfelden-Echterdingen, Germany) was used to obtain data about the production systems. As a priority, specific data for the Czech Republic were used, but generic data from the Ecoinvent database were also used.

2.5. Life Cycle Impact Assessment

The impact assessment was carried out using two characterization methods: CML2001—January 2016 and ReCiPe 2016 v1.1. The impact category indicators, which were used in this study, are shown in Table 5. CML2001, as the characterization method, is very often used for environmental assessment in the building industry. For example, the CML2001 midpoint indicators are described for assessment of construction products according to EN 15804+A1 and for concrete products according to EN 16757 [75,76].
ReCiPe 2016 combines CML 2001 and Eco-indicator 99 [77]. In ReCiPe, it is possible to determine 18 midpoint indicators and 3 endpoint indicators. These indicators contain factors according to the three cultural perspectives: Individualist, Hierarchist, Egalitarian. In this study, the Hierarchist set of characterization factors was used. This consensus model is used as a default in scientific models and is based on medium timeframe of impacts. By combining ReCiPe and CML, we are able to more fully describe the environmental impacts of the assessed forms of construction. Different types of methodologies have been reviewed by Bogacka [78]. In this study, seven ReCiPe midpoint indicators were used for impact assessment. These seven indicators were chosen because they describe environmental impact in same categories, which are assessed according to EN 15804+A1 and EN 16757 [75,76] using CML2001.
The results of environmental assessment for these scenarios are presented in Section 3, Results. To show typical contribution of process and phases, the results are more fully described in Section 4, Discussion. The scenarios 3 and 4 were modelled to describe the influence of End of Life in the production system for construction. Therefore, the results of scenario 3 and 4 are considered in Section 4, Discussion.

3. Results

In this study, we present the results of four constructions in four scenarios. The results are marked with a combination of a number of plans and a scenario number. According to this, the results, which are marked as Plan 1 s1, belong to construction Plan 1, and these results were performed in Scenario 1.

3.1. Plans in Scenario 1

Table 6 shows the demand for selected resources in the case of basic scenarios. There were no important differences among the amount of non-renewable energy resources, which were used for the life cycle of the considered construction. On the other hand, construction with recycled aggregates in concrete mixtures (Plan 1, Plan 2) had smaller primary consumption in most of the flows, and moreover, they were beneficial in the flow of Natural Aggregate. This beneficiation was caused by recycling processes of construction and demolition waste (CDW), which are tied up with the production of other aggregate fractions.
Plan 1 and Plan 2 construction also had smaller water consumption, mainly due to the amount of water that was saved by the recycling of CDW.
All of the elementary flows were characterized, and the results of the impact indicators are shown in Table 7 and Table 8. The results of Plan 2 were affected by the recycling of concrete CDW, which also included the recycling of iron scraps. Recycling of this admixture in the conditions of the Czech Republic provided impact beneficiation in the ADP impact category, but also had a negative influence on the ODP impact category. Nevertheless, Plan 2 had the smallest environmental impact, as shown in Figure 2.
Recycled brick aggregates in Plan 1 came from the recycling of brick CDW, which did not contain such a large amount of steel scraps like in Plan 2. Therefore, these recycling processes did not significantly affect the environmental impact of Plan 1. In these basic scenarios, Plan 3 and Plan 4 were almost similar, hence their environmental impacts were almost equal, too. The only exception was in the ODP category. This difference was caused by the process of incineration of the construction wood, which was used only in the other three plans.
Each of the plans had a beneficial impact on the POCP category. The main effect on this category was caused by transport processes, which were modeled as diesel trucks (Euro 3). After combustion in the diesel engine, emissions of NOx were generated. This flow can be split into two emissions; NO and NO2. Nitrogen monoxide, which is in many cases dominating, reduced under certain conditions, when produced O3 converted back to O2 and NO2. Therefore, the flow of NO had a potentially beneficial impact on the POCP category. A similar effect can be caused by benzaldehyde, which is also a product of combustion [79]. The results of this indicator were based on potential impact and the actual reaction depended on local aspects, such as an abundance of O3 and NO or intensity of daylight. It cannot be concluded that more transport leads to fresher air.
In the comparison of the results, according to CML2001 (Table 7) and ReCiPe 2016 (Table 8), there were some differences. For example, Plan 4 (regular wall) had the smallest impact. On the other hand, according to ReCiPe 2016, Plan 1 caused the smallest impact in Stratospheric Ozone Depletion. Similarly, the impact in the Photochemical Ozone Potential category can be performed with different conclusions. Nevertheless, the indicators of Global warming had almost the same results, and in addition, the Acidification Potential and categories describing resource scarcity produced similar results for their indicators. Other indicators described the impact differently.
To compare the overall impacts of constructions in scenario 1, normalization and weighing were performed (Figure 2). The normalization was carried out with data from CML2001—January 2016, World, year 2000, including biogenic carbon (global equivalents) and the weighing was carried out according to thinkstep LCIA Survey 2012, Global, CML 2016, including biogenic carbon (global equivalents weighted). No data for the normalization and weighing according to ReCiPe 2016 were available.

3.2. Scenario with a Longer Service Life of Reusable Blocks

In the second scenario, the possibility of reusing the blocks was considered, hence a longer service life was assumed (100 years for blocks). Alternatively, Plan 4 (regular concrete wall system) had the same assumed moral life expectancy as in the first scenario (50 years) and so, for comparable function, twice as much material was needed than in the first case. Even a well-functioning construction was demolished after some time due to outdated design or inappropriate other properties. This time period is called moral life expectancy.
Table 9 and Table 10 show that Plan 2 s2 was still the most favorable scenario. In comparison with other scenarios, it had a more negative impact, only in the ODP category. The worst construction was Plan 4 s2, which potentially caused almost double the impact than in the first scenario.
There were some differences among results according to CML2001 and ReCiPe 2016. For example, in the category of photochemical ozone, Plan 4 s2 was the most beneficial construction according to CML2001 and Plan2 s2 had the smallest impact according to ReCiPe 2016. According to ReCiPe 2016, Plan 1 s2 caused the smallest total impact but on the other hand, the smallest total impact according to CML2001 was caused by Plan 4 s2.

4. Discussion

4.1. Service Life and Influence of Blocks’ Reusability

To explain the environmental advantages of the reusable blocks, it is possible to compare the relative results for all categories in scenario 1 and scenario 2 (Figure 3 and Figure 4). Typically, the influence of a life span as an assumption can be considered in different scenarios [80]. Some authors consider only the cradle-to-grave approach for new building elements [81,82].
Figure 3 and Figure 4 show all results except ODP, because there is an inappropriate difference in the results of this category according to CML2001. The results in these pictures confirm that designing for reuse is a way to reduce the environmental impact of construction. The impact of Plan 4 s1 is the biggest among most of the categories, and the differences with other plans are even greater in scenario 2. The almost doubled impact of Plan 4 s2 is mainly caused by higher resource production, the higher amount of transported materials, and also the higher amount of landfilled waste.
We only used one type of insulation, and the constructions were designed with almost the same thermal insulating properties. Another approach is to assess the different types of insulation materials [83].
On the other hand, the results in the ODP category of the various scenarios were significantly higher for other plans than they were for Plan 4 s2. This impact is caused by the recycling of the iron scraps and incineration of wood. According to ReCiPe 2016, the assessment of impact in the Stratospheric Ozone Depletion category leads to different conclusions. Plan 4 s2 has the biggest impact on this indicator.
The result in the POCP category is influenced mainly by iron scrap recycling in Plan 2 s2. The influence of iron scrap recycling was also investigated in a case study of earth-retaining walls [84]. In other plans, results in this category are mainly influenced by transport, as it is described in Results.

4.2. Overview of Contributions Caused by Phases and Processes

To investigate the influence of phases and processes, the relative contributions are shown in Figure 5, in relation to the results of the all of the plans in scenario 1. The figure shows relative contribution in the GWP category. For GWP mitigation, the main contributor is the cement production and processes in the EoL phase. On the other side of the figure, aggregate production in Plan 2 causes a beneficial impact. Another point of view on using aggregates in concretes for beam-floor systems was investigated by Dossche [85]. The impact in this category is influenced by the iron scrap recycling. Another beneficial impact is caused by the wood production. Optimization of concrete mix and block design was also investigated [86].
Manipulation consists of the deconstruction and rebuilding of blocks, hence is mentioned only for plans 1–3. Transport and EoL are significant contributors in Plan 2 but are rather minor contributors to other plans.
The relative contributions of phases in the case of the block with recycled aggregate is in Figure 6. The GWP and ADP (elements and fossils) categories are influenced significantly by the production phase. The ODP category is affected mainly by the EoL.
Plan 2 represents the most beneficial type of considered construction, and in scenario 1 is mostly influenced by production (cement, recycled concrete aggregate). By focusing on the same plan in scenario 2, it is possible to see that the relative influence of the production can be reduced by the influence of other phases, as shown in Figure 7. For example, the use of recycled aggregates is a beneficial process, but its relative beneficiation is reduced by processes in the EoL and Use phase.
According to Figure 6 and Figure 7, the use phase is a minor contributor in all categories, hence changes in calculations and estimations of these processes (deconstruction, rebuilding, manipulation on site, etc.) would not play a significant role in conclusions of the study. On the contrary, the main contributors are EoL and the production phase. The influence of the initial manufacturing phase contribution was investigated in the case of designing bridges [87].

4.3. Transport

Figure 5 shows the influence of transport for plans in scenarios with shorter time scales (scenario 1). Transport effects on the GWP indicator depend on the plan and can cause approximately 13–26% of the plan impact in this category. Therefore, the change in transport parameters can affect the results. The main parameter is distance. To investigate the influence of distance on the results of the study, plans with local transport were modeled to have distance parameters set at 50 km instead of 100 km. Figure 8 shows that the differences between plans and this local variation are 7–29%. These differences are too small to transform the conclusions of the study. On the one hand, transport is a minor contributor in GWP for our scenario, but in other cases, the transport could make an important contribution, for example in the case of the manufacturing of bridge [88].

4.4. End of Life Phase

Figure 5 shows the influence on the impact caused by EoL, which depends on the plan and can be 22%–45% in the GWP category. Therefore, the method of waste removal was changed in scenario 3. In this scenario, constructions are deconstructed and then concrete is crushed and sorted. The recycled aggregates are used as a replacement for natural gravel. FU was 1 m2 of construction with a service life 100 years. Another different approach to the assessment of the End of life phase was investigated by Penades-Pla [89].
In comparison with scenario 2, plans of scenario 3 have a smaller environmental impact, except the ODP category, which is not influenced by this change, as shown in Table 11. Plan 2 s3 is still the most favorable construction, and in the ADP category, is even beneficial. Similarly, Table 12 shows that Plan 2 s3 caused the smallest impact in most categories except Stratospheric Ozone Depletion. Nevertheless, the results according to ReCiPe 2016 do not confirm the beneficial impact in the Fossil Depletion category, but it confirms that this plan is the best variant for this category.
Figure 9 shows the relative impacts of scenarios 2 and 3. The most significant relative difference is in the ADP fossil category, where Plan 2 s3 reaches a positive impact on the environment. However, the difference between the results of the two scenarios for one plan is smaller than 24% for most of the impact indicators.
This decrease in impacts confirms the positive impact of deconstruction and recycling processes of aggregates. According to CML2001, the only increase in impacts is in the POCP category. In contrast to this, the impacts of scenario 3 in the Photochemical Ozone Formation category are lower than the impacts of scenario 2, according to ReCiPe 2016.
Another possible way to change EoL was performed in scenario 4, which modelled a situation in which waste wood is not incinerated but is removed to the landfill as an admixture of CDW; hence, in comparison to scenario 2, the only change is in EoL of wood. Plan 4 is not included in scenario 4 because this plan does not contain any construction wood. Dossche considered the different waste scenarios for wood [85]. Also, the environmental impacts of disposal of building materials were assessed [90]. The results of other plans are shown in Table 13 and Table 14.
Changes in this process take a minority effect in the results and therefore have no influence on the assessment of construction types. The only noticeable difference between scenarios 2 and 4 is in the ODP indicator, where plans 1 and 3 have a smaller impact.

5. Conclusions

Life Cycle Assessment has been used to compare the environmental impacts of four concrete constructions containing different types of aggregate in four scenarios over two time scales. Our results strongly suggest that the key factors in reducing the environmental impacts of concrete constructions are the use of recycled concrete aggregate in the concrete mixture and the reusability of the blocks used. At the shortest time scale, the construction containing recycled concrete aggregate had a lower impact than the other constructions, due to the positive impact of steel scrap recycling. Conversely, block reusability appears to become more important over time. Although we have shown that the environmental impacts of such constructions are also influenced by cement production, transportation, and disposal, their influence was not as significant as those of block reusability and aggregate type. Because the CML2001 and ReCiPe 2016 results can be interpreted differently in categories such as ozone depletion and photochemical oxidant formation, we used both characterization methods in order to obtain a fuller and more accurate picture. While CML2001 is the industry standard, it has limitations in the assessment of the impact in the Photochemical Oxidant Creation category. This leads us to recommend the use of ReCiPe for assessing the sustainability of concrete constructions.

Author Contributions

Investigation, J.P.; methodology, V.K.; resources, T.P. and K.F.; supervision, V.K.; writing—original draft, J.P. and T.P. All authors have read and agreed to the published version of the manuscript.

Funding

This work has been supported by the Ministry of Industry and Trade MPO TRIO FV 10397—RENCO Recycled Environmental Concrete for Building Construction and Ministry of Education, Youth and Sports within National Sustainability Programme I, project No. LO1605 and by financial support from specific university research (MSMT No 21-SVV/2019) and by student grant SGS18/108/OHK1/2T/11—Environmental aspects of high performance cement composites and concrete with recycled aggregate including their durability and service life.

Conflicts of Interest

The authors declare no conflict of interest.

References

  1. Hansen, T.C. Recycling of Demolished Concrete and Masonry: Report of Technical Committee 37-DRC, Demolition and Reuse of Concrete; Spon Press: London, UK, 1992. [Google Scholar]
  2. Pavlu, T.; Fortova, K.; Divis, J.; Hajek, P. The Utilization of Recycled Masonry Aggregate and Recycled EPS for Concrete Blocks for Mortarless Masonry. Materials 2019, 12, 1923. [Google Scholar] [CrossRef] [PubMed] [Green Version]
  3. Šefflová, M.; Volf, M.; Pavlů, T. Thermal Properties of Concrete with Recycled Aggregate. Adv. Mater. Res. 2014, 1054, 227–233. [Google Scholar] [CrossRef]
  4. Etxeberria, M.; Vázquez, E.; Marí, A.; Barra, M. Influence of amount of recycled coarse aggregates and production process on properties of recycled aggregate concrete. Cem. Concr. Res. 2007, 37, 735–742. [Google Scholar] [CrossRef]
  5. Tam, V.W.Y.; Tam, C.M. Assessment of durability of recycled aggregate concrete produced by two-stage mixing approach. J. Mater. Sci. 2007, 42, 3592–3602. [Google Scholar] [CrossRef] [Green Version]
  6. Verian, K.P.; Ashraf, W.; Cao, Y. Properties of recycled concrete aggregate and their influence in new concrete production. Resour. Conserv. Recycl. 2018, 133, 30–49. [Google Scholar] [CrossRef]
  7. Kou, S.-C.; Poon, C.-S.; Agrela, F. Comparisons of natural and recycled aggregate concretes prepared with the addition of different mineral admixtures. Cem. Concr. Compos. 2011, 33, 788–795. [Google Scholar] [CrossRef]
  8. CSN EN 206+A1 Concrete: Specification, Performance, Production and Conformity, Prague. Available online: https://infostore.saiglobal.com/preview/98704302873.pdf?sku=878211_SAIG_NSAI_NSAI_2087062 (accessed on 19 February 2020).
  9. Debieb, F.; Kenai, S. The use of coarse and fine crushed bricks as aggregate in concrete. Constr. Build. Mater. 2008, 22, 886–893. [Google Scholar] [CrossRef]
  10. Evangelista, L.; de Brito, J. Mechanical behaviour of concrete made with fine recycled concrete aggregates. Cem. Concr. Compos. 2007, 29, 397–401. [Google Scholar] [CrossRef]
  11. Fortova, K.; Pavlu, T. The Utilization of the Finest Fraction of Recycled Aggregate from CDW for Concrete. IOP Conf. Ser. Earth Environ. Sci. 2019, 290, 012013. [Google Scholar] [CrossRef]
  12. Matar, P.; Dalati, R.E. Strength of masonry blocks made with recycled concrete aggregates. Phys. Procedia 2011, 21, 180–186. [Google Scholar] [CrossRef] [Green Version]
  13. Matos, A.M.; Sousa-Coutinho, J. Durability of mortar using waste glass powder as cement replacement. Constr. Build. Mater. 2012, 36, 205–215. [Google Scholar] [CrossRef]
  14. Rao, A.; Jha, K.N.; Misra, S. Use of aggregates from recycled construction and demolition waste in concrete. Resour. Conserv. Recycl. 2007, 50, 71–81. [Google Scholar] [CrossRef]
  15. Sabai, M.M.; Cox, M.G.D.M.; Mato, R.R.; Egmond, E.L.C.; Lichtenberg, J.J.N. Concrete block production from construction and demolition waste in Tanzania. Resour. Conserv. Recycl. 2013, 72, 9–19. [Google Scholar] [CrossRef] [Green Version]
  16. Xuan, D.; Zhan, B.; Poon, C.S. Assessment of mechanical properties of concrete incorporating carbonated recycled concrete aggregates. Cem. Concr. Compos. 2016, 65, 67–74. [Google Scholar] [CrossRef]
  17. Zhan, B.J.; Xuan, D.X.; Poon, C.S.; Shi, C.J. Effect of curing parameters on CO2 curing of concrete blocks containing recycled aggregates. Cem. Concr. Compos. 2016, 71, 122–130. [Google Scholar] [CrossRef]
  18. Zhu, L.; Dai, J.; Bai, G.; Zhang, F. Study on thermal properties of recycled aggregate concrete and recycled concrete blocks. Constr. Build. Mater. 2015, 94, 620–628. [Google Scholar] [CrossRef]
  19. Boehme, L. RecyMblock-application of recycled mixed aggregates in the manufacture of concrete construction blocks. In Proceedings of the SB11 HELSINKI World Sustainable Building Conference, Helsinky, Finland, 18–21 October 2011. [Google Scholar]
  20. Joseph, M. ValReCon20: Valorisation of Recycled Concrete Aggregates in Concrete C20/20 & C25/30. Available online: https://core.ac.uk/download/pdf/34622522.pdf (accessed on 19 February 2020).
  21. Bonet-Martinez, E.; Perez-Villarejo, L.; Eliche-Quesada, D.; Castro, E. Manufacture of Sustainable Clay Bricks Using Waste from Secondary Aluminum Recycling as Raw Material. Materials 2018, 11, 2439. [Google Scholar] [CrossRef] [Green Version]
  22. Ganjian, E.; Jalull, G.; Sadeghi-Pouya, H. Using waste materials and by-products to produce concrete paving blocks. Constr. Build. Mater. 2015, 77, 270–275. [Google Scholar] [CrossRef] [Green Version]
  23. Juan-Valdés, A.; García-González, J.; Rodríguez-Robles, D.; Guerra-Romero, M.I.; López Gayarre, F.; De Belie, N.; Morán-del Pozo, J.M. Paving with Precast Concrete Made with Recycled Mixed Ceramic Aggregates: A Viable Technical Option for the Valorization of Construction and Demolition Wastes (CDW). Materials 2019, 12, 24. [Google Scholar] [CrossRef] [Green Version]
  24. Poon, C.S.; Chan, D. Paving blocks made with recycled concrete aggregate and crushed clay brick. Constr. Build. Mater. 2006, 20, 569–577. [Google Scholar] [CrossRef]
  25. Rodríguez, C.; Miñano, I.; Aguilar, M.Á.; Ortega, J.M.; Parra, C.; Sánchez, I. Properties of Concrete Paving Blocks and Hollow Tiles with Recycled Aggregate from Construction and Demolition Wastes. Materials 2017, 10, 1374. [Google Scholar] [CrossRef] [PubMed] [Green Version]
  26. Xiao, Z.; Ling, T.-C.; Kou, S.-C.; Wang, Q.; Poon, C.-S. Use of wastes derived from earthquakes for the production of concrete masonry partition wall blocks. Waste Manag. 2011, 31, 1859–1866. [Google Scholar] [CrossRef] [PubMed]
  27. Xiao, Z.; Ling, T.-C.; Poon, C.-S.; Kou, S.-C.; Wang, Q.; Huang, R. Properties of partition wall blocks prepared with high percentages of recycled clay brick after exposure to elevated temperatures. Constr. Build. Mater. 2013, 49, 56–61. [Google Scholar] [CrossRef]
  28. Chen, Z.; Li, J.S.; Poon, C.S. Combined use of sewage sludge ash and recycled glass cullet for the production of concrete blocks. J. Clean. Prod. 2018, 171, 1447–1459. [Google Scholar] [CrossRef]
  29. Lee, G.; Poon, C.S.; Wong, Y.L.; Ling, T.C. Effects of recycled fine glass aggregates on the properties of dry–mixed concrete blocks. Constr. Build. Mater. 2013, 38, 638–643. [Google Scholar] [CrossRef]
  30. Ling, T.-C.; Poon, C.-S. Use of recycled CRT funnel glass as fine aggregate in dry-mixed concrete paving blocks. J. Clean. Prod. 2014, 68, 209–215. [Google Scholar] [CrossRef]
  31. Turgut, P.; Yahlizade, E.S. Research into Concrete Blocks with Waste Glass. Int. J. Civ. Environ. Eng. 2009, 3, 7. [Google Scholar]
  32. Ling, T.-C. Prediction of density and compressive strength for rubberized concrete blocks. Constr. Build. Mater. 2011, 25, 4303–4306. [Google Scholar] [CrossRef]
  33. Mohammed, B.S.; Anwar Hossain, K.M.; Eng Swee, J.T.; Wong, G.; Abdullahi, M. Properties of crumb rubber hollow concrete block. J. Clean. Prod. 2012, 23, 57–67. [Google Scholar] [CrossRef]
  34. Sodupe-Ortega, E.; Fraile-Garcia, E.; Ferreiro-Cabello, J.; Sanz-Garcia, A. Evaluation of crumb rubber as aggregate for automated manufacturing of rubberized long hollow blocks and bricks. Constr. Build. Mater. 2016, 106, 305–316. [Google Scholar] [CrossRef] [Green Version]
  35. Sadek, D.M.; El Nouhy, H.A. Properties of paving units incorporating crushed ceramic. HBRC J. 2014, 10, 198–205. [Google Scholar] [CrossRef] [Green Version]
  36. Gencel, O.; Ozel, C.; Koksal, F.; Erdogmus, E.; Martínez-Barrera, G.; Brostow, W. Properties of concrete paving blocks made with waste marble. J. Clean. Prod. 2012, 21, 62–70. [Google Scholar] [CrossRef]
  37. Uygunoğlu, T.; Topcu, I.B.; Gencel, O.; Brostow, W. The effect of fly ash content and types of aggregates on the properties of pre-fabricated concrete interlocking blocks (PCIBs). Constr. Build. Mater. 2012, 30, 180–187. [Google Scholar] [CrossRef]
  38. Chowdhury, S.; Maniar, A.T.; Suganya, O. Polyethylene terephthalate (PET) waste as building solution. Int. J. Chem. Environ. Biol. Sci. 2013, 1, 308–312. [Google Scholar]
  39. Hossain, M.U.; Xuan, D.; Poon, C.S. Sustainable management and utilisation of concrete slurry waste: A case study in Hong Kong. Waste Manag. 2017, 61, 397–404. [Google Scholar] [CrossRef]
  40. Kou, S.-C.; Zhan, B.-J.; Poon, C.-S. Properties of partition wall blocks prepared with fresh concrete wastes. Constr. Build. Mater. 2012, 36, 566–571. [Google Scholar] [CrossRef]
  41. González, J.S.; Gayarre, F.L.; Pérez, C.L.-C.; Ros, P.S.; López, M.A.S. Influence of recycled brick aggregates on properties of structural concrete for manufacturing precast prestressed beams. Constr. Build. Mater. 2017, 149, 507–514. [Google Scholar] [CrossRef]
  42. Arredondo-Rea, S.P.; Corral-Higuera, R.; Gómez-Soberón, J.M.; Gámez-García, D.C.; Bernal-Camacho, J.M.; Rosas-Casarez, C.A.; Ungsson-Nieblas, M.J. Durability parameters of reinforced recycled aggregate concrete: Case study. Appl. Sci. 2019, 9, 617. [Google Scholar] [CrossRef] [Green Version]
  43. Singh, N.; Singh, S.P. Carbonation and electrical resistance of self compacting concrete made with recycled concrete aggregates and metakaolin. Constr. Build. Mater. 2016, 121, 400–409. [Google Scholar] [CrossRef]
  44. Braunschweig, A.; Kytzia, S.; Bischof, S. Recycled Concrete: Environmentally Beneficial Over Virgin Concrete? Available online: https://books.google.com.ph/books?id=UNqMDwAAQBAJ&pg=PA601&lpg=PA601&dq=44.%09Braunschweig,+A.;+Kytzia,+S.;+Bischof,+S.+Recycled+Concrete:+Environmentally+Beneficial+Over+Virgin+Concrete?&source=bl&ots=i6XOM-hjbh&sig=ACfU3U2_1ROZeFTak9AwByFUeCrGKK-AdQ&hl=zh-CN&sa=X&ved=2ahUKEwiu1IPX0dznAhUFQd4KHQr8ARMQ6AEwAXoECAoQAQ (accessed on 19 February 2020).
  45. Evangelista, L.; De Brito, J. Environmental life cycle assessment of concrete made with fine recycled concrete aggregates. In Proceedings of the Portugal SB07-Sustainable Construction, Materials and Practices, Lisbon, Portugal, 12–14 September 2007. [Google Scholar]
  46. Evangelista, L.; Guedes, M.; de Brito, J.; Ferro, A.C.; Pereira, M.F. Physical, chemical and mineralogical properties of fine recycled aggregates made from concrete waste. Constr. Build. Mater. 2015, 86, 178–188. [Google Scholar] [CrossRef]
  47. Hossain, M.U.; Poon, C.S.; Lo, I.M.C.; Cheng, J.C.P. Comparative environmental evaluation of aggregate production from recycled waste materials and virgin sources by LCA. Resour. Conserv. Recycl. 2016, 109, 67–77. [Google Scholar] [CrossRef]
  48. Jullien, A.; Proust, C.; Martaud, T.; Rayssac, E.; Ropert, C. Variability in the environmental impacts of aggregate production. Resour. Conserv. Recycl. 2012, 62, 1–13. [Google Scholar] [CrossRef] [Green Version]
  49. Knoeri, C.; Sanyé-Mengual, E.; Althaus, H.-J. Comparative LCA of recycled and conventional concrete for structural applications. Int. J. Life Cycle Assess. 2013, 18, 909–918. [Google Scholar] [CrossRef] [Green Version]
  50. Marinković, S.; Dragaš, J.; Ignjatović, I.; Tošić, N. Environmental assessment of green concretes for structural use. J. Clean. Prod. 2017, 154, 633–649. [Google Scholar] [CrossRef]
  51. Marinković, S.; Radonjanin, V.; Malešev, M.; Ignjatović, I. Comparative environmental assessment of natural and recycled aggregate concrete. Waste Manag. 2010, 30, 2255–2264. [Google Scholar] [CrossRef]
  52. Marinković, S.B. 3-Life cycle assessment (LCA) aspects of concrete. In Eco-Efficient Concrete; Pacheco-Torgal, F., Jalali, S., Labrincha, J., John, V.M., Eds.; Woodhead Publishing: Philadelphia, PA, USA, 2013. [Google Scholar]
  53. Marinković, S.B.; Ignjatović, I.; Radonjanin, V. 23-Life-cycle assessment (LCA) of concrete with recycled aggregates (RAs). In Handbook of Recycled Concrete and Demolition Waste; Pacheco-Torgal, F., Tam, V.W.Y., Labrincha, J.A., Ding, Y., de Brito, J., Eds.; Woodhead Publishing: Philadelphia, PA, USA, 2013. [Google Scholar]
  54. Marinković, S.B.; Malešev, M.; Ignjatović, I. 11-Life cycle assessment (LCA) of concrete made using recycled concrete or natural aggregates. In Eco-Efficient Construction and Building Materials; Pacheco-Torgal, F., Cabeza, L.F., Labrincha, J., de Magalhães, A., Eds.; Woodhead Publishing: Philadelphia, PA, USA, 2014. [Google Scholar]
  55. Nayana, A.Y.; Kavitha, S. Evaluation of CO2 emissions for green concrete with high volume slag, recycled aggregate, recycled water to build eco environment. Int. J. Civ. Eng. Technol. 2017, 8, 703–708. [Google Scholar]
  56. Pacheco Torgal, F.; Cabeza, L.F.; Labrincha, J.A. Eco-Efficient Construction and Building Materials: Life Cycle Assessment (Lca), Eco-Labelling and Case Studies; Woodhead Pub: Philadelphia, PA, USA, 2014. [Google Scholar]
  57. Pacheco Torgal, F.; Jalali, S. Eco-Efficient Construction and Building Materials; Springer: Berlin/Heidelberg, Germany, 2011. [Google Scholar]
  58. Park, W.-J.; Kim, T.; Roh, S.; Kim, R. Analysis of Life Cycle Environmental Impact of Recycled Aggregate. Appl. Sci. 2019, 9, 1021. [Google Scholar] [CrossRef] [Green Version]
  59. Serres, N.; Braymand, S.; Feugeas, F. Environmental evaluation of concrete made from recycled concrete aggregate implementing life cycle assessment. J. Build. Eng. 2016, 5, 24–33. [Google Scholar] [CrossRef]
  60. Tam, V.W.Y.; Soomro, M.; Evangelista, A.C.J. A review of recycled aggregate in concrete applications (2000–2017). Constr. Build. Mater. 2018, 172, 272–292. [Google Scholar] [CrossRef]
  61. Tošić, N.; Marinković, S.; Dašić, T.; Stanić, M. Multicriteria optimization of natural and recycled aggregate concrete for structural use. J. Clean. Prod. 2015, 87, 766–776. [Google Scholar] [CrossRef]
  62. Weil, M.; Jeske, U.; Schebek, L. Closed-loop recycling of construction and demolition waste in Germany in view of stricter environmental threshold values. Waste Manag. Res. 2006, 24, 197–206. [Google Scholar] [CrossRef] [PubMed]
  63. Gámez-García, D.C.; Gómez-Soberón, J.M.; Corral-Higuera, R.; Almaral-Sánchez, J.L.; Gómez-Soberón, M.C.; Gómez-Soberón, L.A. LCA as comparative tool for concrete columns and glulam columns. J. Sustain. Archit. Civ. Eng. 2015, 11, 21–31. [Google Scholar] [CrossRef] [Green Version]
  64. Choi, H.; Lim, M.; Choi, H.; Kitagaki, R.; Noguchi, T. Using Microwave Heating to Completely Recycle Concrete. J. Environ. Prot. 2014, 5, 583–596. [Google Scholar] [CrossRef] [Green Version]
  65. Shima, H.; Tateyashiki, H.; Matsuhashi, R.; Yoshida, Y. An advanced concrete recycling technology and its applicability assessment through input-output analysis. J. Adv. Concr. Technol. 2005, 3, 53–67. [Google Scholar] [CrossRef] [Green Version]
  66. Cachim, P.B. Mechanical properties of brick aggregate concrete. Constr. Build. Mater. 2009, 23, 1292–1297. [Google Scholar] [CrossRef]
  67. Uddin, M.T.; Mahmood, A.H.; Kamal, M.R.I.; Yashin, S.M.; Zihan, Z.U.A. Effects of maximum size of brick aggregate on properties of concrete. Constr. Build. Mater. 2017, 134, 713–726. [Google Scholar] [CrossRef]
  68. Yang, J.; Du, Q.; Bao, Y. Concrete with recycled concrete aggregate and crushed clay bricks. Constr. Build. Mater. 2011, 25, 1935–1945. [Google Scholar] [CrossRef]
  69. Alves, A.V.; Vieira, T.F.; de Brito, J.; Correia, J.R. Mechanical properties of structural concrete with fine recycled ceramic aggregates. Constr. Build. Mater. 2014, 64, 103–113. [Google Scholar] [CrossRef]
  70. Khatib, J.M. Properties of concrete incorporating fine recycled aggregate. Cem. Concr. Res. 2005, 35, 763–769. [Google Scholar] [CrossRef]
  71. Chen, H.-J.; Yen, T.; Chen, K.-H. Use of building rubbles as recycled aggregates. Cem. Concr. Res. 2003, 33, 125–132. [Google Scholar] [CrossRef]
  72. Evangelista, L.; de Brito, J. Concrete with fine recycled aggregates: A review. Eur. J. Environ. Civil Eng. 2014, 18, 129–172. [Google Scholar] [CrossRef]
  73. Etxeberria, M.; Marí, A.R.; Vázquez, E. Recycled aggregate concrete as structural material. Mater. Struct. 2007, 40, 529–541. [Google Scholar] [CrossRef]
  74. Guinee, J. Handbook on life cycle assessment—Operational guide to the ISO standards. Int. J. Life Cycle Assess. 2001, 6, 255. [Google Scholar] [CrossRef]
  75. EN ISO 14040:2006. Environmental management-Life Cycle Assessment—Principles and Framework (ISO 14040:2006). Available online: https://www.iso.org/standard/37456.html (accessed on 19 February 2020).
  76. EN 16757. Sustainability of Construction Works–Environmental Product Declarations–Product Category Rules for Concrete and Concrete Elements (EN 16757). Available online: https://shop.bsigroup.com/ProductDetail/?pid=000000000030339218 (accessed on 19 February 2020).
  77. Verbitsky, O.; Pushkar, S. Eco-indicator 99, ReCiPe and ANOVA for evaluating building technologies under LCA uncertainties. Environ. Eng. Manag. J. 2018, 17, 2549–2559. [Google Scholar] [CrossRef]
  78. Bogacka, M. Best practice in environmental impact evaluation based on LCA-methodologies review. In Proceedings of the 14th International Multidisciplinary Scientific GeoConference, Geoconference on Ecology, Economics, Education and Legislation, Sofia, Bulgaria, 19–25 June 2014. [Google Scholar]
  79. Kupfer, T.; Colodel, C.M.; Kokborg, M.; Schöll, S.; Rudolf, M.; Thellier, L.; Bos, U.; Bosch, F.; Gonzalez, M.; Schuller, O.; et al. GaBi Database and Modelling Principles; thinkstep AG: Leinfelden-Echterdingen, Germany; Available online: https://www.gabi-software.com/fileadmin/gabi/Modeling_Principles_2019.pdf (accessed on 20 December 2019).
  80. Bovea, M.D.; Ibanez-Fores, V.; Perez-Belis, V. Repair vs. replacement: Selection of the best end-of-life scenario for small household electric and electronic equipment based on life cycle assessment. J. Environ. Manag. 2020, 254. [Google Scholar] [CrossRef]
  81. Özkan, A.; Günkaya, Z.; Tok, G.; Karacasulu, L.; Metesoy, M.; Banar, M.; Kara, A. Life Cycle Assessment and Life Cycle Cost Analysis of Magnesia Spinel Brick Production. Sustainability 2016, 8, 662. [Google Scholar] [CrossRef] [Green Version]
  82. Lozano-Miralles, J.A.; Hermoso-Orzaez, M.J.; Martinez-Garcia, C.; Rojas-Sola, J.I. Comparative Study on the Environmental Impact of Traditional Clay Bricks Mixed with Organic Waste Using Life Cycle Analysis. Sustainability 2018, 10, 2917. [Google Scholar] [CrossRef] [Green Version]
  83. Contarini, A.; Meijer, A. LCA comparison of roofing materials for flat roofs. Smart Sustain. Built Environ. 2015, 4, 97–109. [Google Scholar] [CrossRef]
  84. Zastrow, P.; Molina-Moreno, F.; Garcia-Segura, T.; Marti, J.V.; Yepes, V. Life cycle assessment of cost-optimized buttress earth-retaining walls: A parametric study. J. Clean. Prod. 2017, 140, 1037–1048. [Google Scholar] [CrossRef]
  85. Dossche, C.; Boel, V.; De Corte, W. Comparative material-based life cycle analysis of structural beam-floor systems. J. Clean. Prod. 2018, 194, 327–341. [Google Scholar] [CrossRef]
  86. Huang, H.; Wang, T.; Kolosz, B.; Andresen, J.; Garcia, S.; Fang, M.X.; Maroto-Valer, M.M. Life-cycle assessment of emerging CO2 mineral carbonation-cured concrete blocks: Comparative analysis of CO2 reduction potential and optimization of environmental impacts. J. Clean. Prod. 2019, 241, 14. [Google Scholar] [CrossRef]
  87. Du, G.L.; Safi, M.; Pettersson, L.; Karoumi, R. Life cycle assessment as a decision support tool for bridge procurement: Environmental impact comparison among five bridge designs. Int. J. Life Cycle Assess. 2014, 19, 1948–1964. [Google Scholar] [CrossRef]
  88. Penadés-Plà, V.; García-Segura, T.; Martí, J.V.; Yepes, V. An Optimization-LCA of a Prestressed Concrete Precast Bridge. Sustainability 2018, 10, 685. [Google Scholar] [CrossRef] [Green Version]
  89. Penades-Pla, V.; Marti, J.V.; Garcia-Segura, T.; Yepes, V. Life-Cycle Assessment: A Comparison between Two Optimal Post-Tensioned Concrete Box-Girder Road Bridges. Sustainability 2017, 9, 1864. [Google Scholar] [CrossRef] [Green Version]
  90. Abd Rashid, A.F.; Idris, J.; Yusoff, S. Environmental Impact Analysis on Residential Building in Malaysia Using Life Cycle Assessment. Sustainability 2017, 9, 329. [Google Scholar] [CrossRef] [Green Version]
Figure 1. Description of Plans: (a) Plan 1, (b) Plan 2, (c) Plan 3, (d) Plan 4.
Sustainability 12 01581 g001aSustainability 12 01581 g001b
Figure 2. Comparison of the constructions in scenario 1 from CML after normalization and weighing.
Sustainability 12 01581 g002
Figure 3. Relative comparison of assessed blocks in the scenario with 50-year-long life span, the reusability was not considered (scenario 1) [%, the result of Plan 4 is 100%, except the ODP indicator].
Sustainability 12 01581 g003
Figure 4. Relative comparison of assessed blocks in the scenario with reuse of blocks (scenario 2) (%, the result of Plan 4 is 100%, except the ODP indicator), according to CML2001.
Sustainability 12 01581 g004
Figure 5. Relative contributions of processes related to the whole impact of plans in the scenario with 50-year-long life span, the reusability was not considered (scenario 1) (for GWP indicator, %), according to CML2001.
Sustainability 12 01581 g005
Figure 6. Relative contributions of phases (production, use, EoL) for assessment of the construction with recycled brick aggregate in case of the scenario with reuse of blocks (Plan 1 s2) (all indicators, %), according to CML2001.
Sustainability 12 01581 g006
Figure 7. Relative contributions of phases (production, use, EoL) for assessment of the construction with recycled concrete aggregate in case of the scenario with reuse of blocks (Plan 2 s2) (all indicators, %), according to CML2001.
Sustainability 12 01581 g007
Figure 8. Comparison of local transport (distance parameter is 50 km) and default transport (distance parameter 100 km) in scenario 1, impact in Global Warming Potential (GWP 100 years) (kg CO2 eq.), according to CML2001.
Sustainability 12 01581 g008
Figure 9. Comparison of plans in the scenario with the reuse of blocks (scenario 2) and in the scenario with the reuse of blocks and recycling of blocks after their second use (scenario 3) (%, results of scenario 2 are 100%), according to CML2001.
Sustainability 12 01581 g009
Table 1. Mix proportions and properties of used concrete mixtures.
Type of Concrete RMACRCACNAC
Mix proportion
CEM I 42.5 R(kg/m3)320320300
Water(kg/m3)185190165
Natural aggregate 0/4 mm(kg/m3)0143700
Natural aggregate 4/8 mm(kg/m3)00538
Natural aggregate 8/16 mm(kg/m3)00601
Recycled aggregate 0/4 mm(kg/m3)5294400
Recycled aggregate 4/8 mm(kg/m3)1883480
Recycled aggregate 8/16 mm(kg/m3)7726060
Effective water/cement ratio 0.500.500.55
Properties of concretes
Density(kg/m3)190021002300
Thermal conductivity(W/mK)0.901.002.80
Compressive strength(MPa)33.335.431.2
Flexural strength(MPa)6.505.304.40
Static elastic modulus (GPa)14.023.525.7
Dynamic elastic modulus(GPa)21.532.736.2
Target strength classC25/30C25/30C25/30
Recycled masonry aggregate concrete (RMAC); Concrete containing coarse recycled concrete aggregate (RCAC); Natural aggregate concrete (NAC).
Table 2. Overview of plans.
PlansWall SystemInsulation
Plan 1reusable concrete blocks made of RMACtimber frames and 120 mm of thermal insulation
Plan 2reusable concrete blocks made of RCACtimber frames and 120 mm of thermal insulation
Plan 3reusable concrete blocks made of NACwith timber frames and 130 mm of thermal insulation
Plan 4conventional solution—the precast concrete hollow wall blocks monolitic with concrete130 mm of thermal insulation fasten by adhesive
Table 3. Overview of scenarios.
Scenario 1Scenario 2Scenario 3Scenario 4
DescriptionOne use of block
One use of wall
Use and reuse of blocks
Doubled wall production
Assumptions Longer life span of blocks
End of life (EoL)Aggregate removed to landfillAggregate removed to landfillAggregate recycledAggregate removed to landfill
Wood removed to landfill
Functional unit (FU)1 m2 of wall construction
Service life: 50 years
1 m2 of wall construction
Two life cycles of wall, life span of one wall: 50 years
Table 4. Composition of the considered constructions.
Material Inputs per 1 m2 (kg)Types of Constructions
Plan 1Plan 2Plan 3Plan 4
Cement (I 42.5R)96968484
Aggregate (brick/concrete/natural)446.7418.2551.4551.4
Mineral wool 4.84.85.25.2
Wood for construction9.69.69.60
Plaster (lime, interior)24242424
Plaster (lightweight, exterior)6666
Water64.857.64242
Total weight of construction651.9616.2722.2712.6
Table 5. Impact category midpoint indicators.
CML 2001 IndicatorsUnitReCiPe 2016 (H) IndicatorsUnit
Abiotic Depletion (ADP elements)(kg Sb eq.)Metal depletion(kg Cu eq.)
Abiotic Depletion (ADP fossil)(MJ)Fossil depletion(kg oil eq.)
Acidification Potential (AP)(kg SO2 eq.)Terrestrial Acidification(kg SO2 eq.)
Eutrophication Potential (EP)(kg Phosphate eq.)Freshwater Eutrophication(kg P eq.)
Global Warming Potential (GWP 100 years)(kg CO2 eq.)Climate change, incl biogenic carbon(kg CO2 eq.)
Ozone Layer Depletion Potential (ODP, steady state)(kg R11 eq.)Stratospheric Ozone Depletion(kg CFC-11 eq.)
Photochemical Ozone Creation Potential (POCP)(g Ethene eq.)Photochemical Ozone Formation, Ecosystems(kg NOx eq.)
CO2—carbon dioxide, Cu—copper, NOx—nitrogen oxides, P—phosphorus, R11 (CFC-11)—trichlorofluoromethane, Sb—antimony, SO2—sulphur dioxide.
Table 6. Selected results of Life Cycle Inventory Analysis.
Plan 1 s1Plan 2 s1Plan 3 s1Plan 4 s1
Non-renewable energy resources
Crude oil (resource), kg8.9311.729.238.73
Hard coal (resource), kg0.44−27.181.603.62
Lignite (resource), kg2.673.445.486.72
Natural gas (resource), kg2.413.782.982.90
Peat (resource), kg0.00614−0.002930.006520.00600
Uranium (resource), mg 4.447.856.774.2
Non-renewable resources
Clay, kg22.822.632.532.5
Inert rock, kg60.4−128.8109.2129.7
Limestone (calcium carbonate), kg191.5193.4172.6172.4
Quartz sand (silica sand; silicon dioxide), kg12.912.220.020.0
Natural Aggregate, kg−7054−6601612612
Renewable resources
Water, m312.728.236.735.1
Table 7. Results of the impact indicators for the life cycle of constructions in Scenario 1, according to the CML2001 method.
IndicatorPlan 1 s1Plan 2 s1Plan 3 s1Plan 4 s1
Abiotic Depletion (ADP elements) (g Sb eq.)0.2210.04340.2190.219
Abiotic Depletion (ADP fossil) (MJ)520−20625668
Acidification Potential (AP) (kg SO2 eq.)0.2360.1280.2580.258
Eutrophication Potential (EP) (kg Phosphate eq.)0.04780.0420.05010.0477
Global Warming Potential (GWP 100 years) (kg CO2 eq.)10648.5108113
Ozone Layer Depletion Potential (ODP, steady state) (kg R11 eq.)2.84 × 10−83.73 × 10−72.84 × 10−83.90 × 10−10
Photochem. Ozone Creation Potential (POCP) (g Ethene eq.)−1640.0−41.9−29.2−28.2
Table 8. Results of the impact indicators for the life cycle of constructions in Scenario 1, according to the ReCiPe 2016 method.
IndicatorPlan 1 s1Plan 2 s1Plan 3 s1Plan 4 s1
Metal depletion (kg Cu eq.)5.432.735.815.8
Fossil depletion (kg oil eq.)12.30.85415.416.6
Terrestrial Acidification (kg SO2 eq.)0.1830.09240.2010.202
Freshwater Eutrophication (g P eq.)0.1050.09220.1780.171
Climate change, incl biogenic carbon (kg CO2 eq.)10645.6109114
Stratospheric Ozone Depletion (g CFC-11 eq.)0.01510.01680.01620.0155
Photochemical Ozone Formation, Ecosystems (kg NOx eq.)0.3330.2910.3410.323
Table 9. Results of the impact indicators for the scenario with a longer service life of reusable blocks (scenario 2), according to CML2001.
IndicatorPlan 1 s2Plan 2 s2Plan 3 s2Plan 4 s2
Abiotic Depletion (ADP elements) (g Sb eq.)0.2220.04380.2160.439
Abiotic Depletion (ADP fossil) (MJ)58642.46981.34E+03
Acidification Potential (AP) (kg SO2 eq.)0.2630.1530.2880.517
Eutrophication Potential (EP) (kg Phosphate eq.)0.05450.04840.05760.0955
Global Warming Potential (GWP 100 years) (kg CO2 eq.)11153113226
Ozone Layer Depletion Potential (ODP, steady state) (kg R11 eq.)2.84 × 10−83.73 × 10−72.84 × 10−87.79 × 1010
Photochem. Ozone Creation Potential (POCP) (kg Ethene eq.)−0.0266−0.0515−0.0404−0.0565
Table 10. Results of the impact indicators for the scenario with a longer service life of reusable blocks (scenario 2), according to ReCiPe 2016.
IndicatorPlan 1 s2Plan 2 s2Plan 3 s2Plan 4 s2
Metal depletion (kg Cu eq.)5.432.735.8111.6
Fossil depletion (kg oil eq.)13.92.3217.233.3
Terrestrial Acidification (kg SO2 eq.)0.2030.1110.2230.403
Freshwater Eutrophication (g P eq.)0.1290.1150.2050.343
Climate change, incl biogenic carbon (kg CO2 eq.)11150.2114227
Stratospheric Ozone Depletion (g CFC-11 eq.)0.01650.01820.01780.0311
Photochemical Ozone Formation, Ecosystems (kg NOx eq.)0.3820.3370.3950.646
Table 11. Results of the impact indicators for scenario 3, according to CML2001.
IndicatorPlan 1 s3Plan 2 s3Plan 3 s3Plan 4 s3
Abiotic Depletion (ADP elements) (g Sb eq.)0.2190.0410.2160.432
Abiotic Depletion (ADP fossil) (MJ)491−475801100
Acidification Potential (AP) (kg SO2 eq.)0.2230.1160.2390.419
Eutrophication Potential (EP) (kg Phosphate eq.)0.0500.0440.0520.085
Global Warming Potential (GWP 100 years) (kg CO2 eq.)10446.5105208
Ozone Layer Depletion Potential (ODP, steady state) (kg R11 eq.)2.84 × 1083.73 × 1072.84 × 1087.77 × 1010
Photochem. Ozone Creation Potential (POCP) (kg Ethene eq.)−0.029−0.054−0.044−0.063
Table 12. Results of the impact indicators for scenario 3, according to ReCiPe 2016.
IndicatorPlan 1 s3Plan 2 s3Plan 3 s3Plan 4 s3
Metal depletion (kg Cu eq.)3.991.384.048.05
Fossil depletion (kg oil eq.)11.50.11614.327.4
Terrestrial Acidification (kg SO2 eq.)0.1720.08190.1840.327
Freshwater Eutrophication (g P eq.)0.110.09680.1810.295
Climate change, incl biogenic carbon (kg CO2 eq.)10443.6105210
Stratospheric Ozone Depletion (g CFC-11 eq.)0.01510.01680.01600.0274
Photochemical Ozone Formation, Ecosystems (kg NOx eq.)0.350.3080.3570.568
Table 13. Results of the impact indicators for scenario 4, according to CML2001.
IndicatorPlan 1 s4Plan 2 s4Plan 3 s4
Abiotic Depletion (ADP elements) (g Sb eq.)0.2230.04490.221
Abiotic Depletion (ADP fossil) (MJ)677133788
Acidification Potential (AP) (kg SO2 eq.)0.2770.1670.302
Eutrophication Potential (EP) (kg Phosphate eq.)0.05520.0490.0583
Global Warming Potential (GWP 100 years) (kg CO2 eq.)10546.7107
Ozone Layer Depletion Potential (ODP, steady state) (kg R11 eq.)3.76 × 10103.45 × 1073.90 × 1010
Photochem. Ozone Creation Potential (POCP) (kg Ethene eq.)−0.0251−0.050−0.039
Table 14. Results of the impact indicators for scenario 4, according to ReCiPe 2016.
IndicatorPlan 1 s4Plan 2 s4Plan 3 s4
Metal depletion (kg Cu eq.)5.472.775.85
Fossil depletion (kg oil eq.)16.44.819.6
Terrestrial Acidification (kg SO2 eq.)0.2140.1220.234
Freshwater Eutrophication (g P eq.)0.1390.1250.215
Climate change, incl biogenic carbon (kg CO2 eq.)10544.1108
Stratospheric Ozone Depletion (g CFC-11 eq.)0.01820.01980.0195
Photochemical Ozone Formation, Ecosystems (kg NOx eq.)0.3860.3410.4

