Article

Environmental Impact Assessment of Food Waste Management Using Two Composting Techniques

1
Division of Sustainable Development, College of Science and Engineering, Hamad Bin Khalifa University, Doha P.O. Box 34110, Qatar
2
Division of Engineering Management and Decision Sciences, College of Science and Engineering, Hamad Bin Khalifa University, Doha P.O. Box 34110, Qatar
*
Author to whom correspondence should be addressed.
Sustainability 2020, 12(4), 1595; https://doi.org/10.3390/su12041595
Submission received: 18 December 2019 / Revised: 21 January 2020 / Accepted: 27 January 2020 / Published: 20 February 2020

Abstract

:
Food waste is a significant contributor to greenhouse gas emissions (GHG) and therefore global warming. As such, the management of food waste can play a fundamental role in the reduction of preventable emissions associated with food waste. In this study, life cycle assessment (LCA) has been used to evaluate and compare the environmental impact associated with two composting techniques for treating food waste using SimaPro software; windrow composting and the hybrid anaerobic digestion (AD) method. The study, based on a 1 tonne of food waste as a functional unit for a case study in the State of Qatar, concludes that anaerobic digestion combined composting presents a smaller environmental burden than windrow composting. The majority of the emissions generated are due to the use of fossil fuels during transportation, which correspond to approximately 60% of the total impact, followed by the impact of composting with 40% of the impact especially in terms of global warming potential. Environmental assessment impacts were the highest in windrow composting for the acidification impact category (9.39 × 10 − 1 kg SO2 eq). While for AD combined composting the impact was highest for the human toxicity impact category (3.47 × 10 kg 1,4 − DB eq).

1. Introduction

In a world that is resource constrained, larger quantities of food are produced in order to meet the demand from an increasing and more affluent population. As the population increases to 9 billion by 2050, it is expected that the demand for food will increase accordingly. In fact, it is suggested that global food production will need to increase by 15% resulting in 5% more food produced per capita to meet the demand of the growing population [1]. As a consequence, food waste generation will also increase, which in turn creates further sources for pollution generation. Proper management of waste is fundamental for avoiding environmental pollution; otherwise, contamination of air, water and land will occur. An example of water contamination is eutrophication, and for atmospheric pollution there is the ozone layer depletion or global warming potential. In fact, food waste may account for 50% of the total solid waste produced in some countries [2]. Consequently, food waste needs to be properly managed in order to reduce the amount of waste going to landfills and the impact that food waste can impose on our environment. Being able to choose the best method of waste management can be a challenge. Hence the aim of this research is to highlight the environmental impacts and benefits of two types of composting techniques, the ultimate benefit of which will result in better food and agriculture sustainability.
The energy, water and food (EWF) nexus refers to the interdependencies that inherently exist between EWF resources [3]. For instance, food production (i.e., cultivation) requires the mobilization of energy and water resources. Food waste is a challenging predicament because it implies that energy and water resources have been wasted. However, from an EWF nexus perspective, the management of food waste is important as it may in turn reduce requirements of energy and water resources. There are different food waste treatment options that can be adopted, such as pyrolysis [4] which produces solid biochar and biogas, anaerobic digestion, which produces digestate water and biogas, and gasification which produces syngas [5]. In addition to other methods of solid waste treatment, including landfilling, incineration and conversion to animal feedstock, composting is a common method used to treat food waste, since its conversion to compost and subsequent application to soils can improve the condition of soils and reduce the need for chemical fertilizers. The composting process aids in transforming linear food systems into circular and closed-loop systems in line with the principles of industrial ecology [6]. The efficient utilization of by-products could lead to economic benefits in addition to environmental savings, whilst the non-utilization or underutilization of by-products will lead to increasing the cost of disposal as well as a loss of potential income [7]. These two types of composting, hybrid aerobic digestion combined composting and windrow, were selected, because windrow composting is widely performed and it is well known for being capable of treating large amounts of waste [8,9].
The use of compost has several additional benefits, such as monetary savings, resources, improving soil conditions and reducing of environmental impacts [10]. The economic benefits are due to the reduction in the requirement of chemical fertilizers, implying a reduction in embodied energy and water resources and associated emissions [10]. Composting contributes to the conservation of natural resources as it enhances the moisture retention capabilities in the soil, which implies a reduction in irrigation requirements [10]. From an environmental perspective, composting reduces greenhouse gas emissions (GHG), as food waste is no longer landfilled and can generate more air emissions than composting with no environmental benefits. Composting produces compost, which is useful and will reduce the need for producing artificial fertilizer whose production consumes energy and generates emissions. Furthermore, the reduction in the use of chemical fertilizers may also result in reduced environmental impacts in the form of runoff from chemical fertilizers, which can generate algal blooms in rivers, lakes and streams. From the perspective of the EWF nexus, food waste can also be used as a source of energy. Bio-conversion technologies, such as anaerobic digestion, which produce biogas (i.e., methane) are considered more suitable than thermochemical conversion technologies including combustion and gasification for the processing of food waste due to their high moisture content [11].
Considering the various treatment processes that can be utilized to treat food waste, it is important to ascertain the environmental costs and benefits for each process in order to make informed waste management decisions. This study aims to contribute towards this objective by evaluating the environmental impact of two food waste management options using life cycle assessment (LCA) for a State of Qatar case study. This research is novel as it is the first of its kind comparing two composting techniques, including windrow composting and anaerobic digestion combined composting, from an environmental perspective within the boundaries of a cradle-to-grave system in the State of Qatar. The study can offer an insight into the benefits of composting over other environmentally-unfriendly waste management techniques such as landfilling.

Life Cycle Assessment of Food Waste

Many food waste-related studies using LCA have been conducted over the years. Most of these studies have compared composting, anaerobic digestion and incineration food waste management techniques. The studies, listed in Table 1, differ in terms of the impact categories considered, system boundaries, functional unit used and the country where the study has been conducted. The studies reviewed have considered different impact categories, including: global warming potential (GWP), acidification potential (AP), eutrophication potential (EP), ozone depletion potential (ODP), photochemical ozone formation (POF), abiotic depletion potential (ADP), energy use (EU), human toxicity potential (HTP), human toxicity (HT), human health (HH), water use (WU) and land use (LU). The majority of the studies published are related to food waste management using anaerobic digesters. It is often the case that LCA studies utilize comparative approaches by considering the various food waste management options as outlined in this study. Interestingly, most LCA studies include landfill without computing the environmental impact. Instead, there is a growing and overarching tendency among researchers in this field to consider landfill as the least beneficial and most harmful management option in terms of environmental impacts and the use of output products such as biogas. Hence, quantified findings about the impact of landfill are rarely reported unless on presumed values based on previous literature.
This review demonstrates that most studies used some kind of environmental assessment as a means to evaluate different food waste management options in terms of performance and efficiency. However, such an assessment is usually confined to GWP rather than a broad assessment using a range of impact categories. Based on the LCA studies reviewed, anaerobic digesters emerged as the most preferred and most beneficial option for managing food waste compared to landfilling, animal feedstock and composting. Yet the cost estimates for investment in anaerobic digestion seemingly carry more operational costs than composting and landfilling. However, it is noteworthy that data from LCA studies concerning animal feedstock as a management option for food waste are considerably scarce. Thus, it is not possible to guarantee empirical or experimental support to substantiate how animal feedstock compares to landfill, anaerobic digestion and composting in terms of environmental impact.

2. Materials and Methods

The LCA methodology was used to conduct an environmental comparison of the proposed waste management options in accordance with the two international Standards Organization guidelines, ISO 14040 (2006) and ISO 14044 (2006). The LCA methodology, developed during the 1990s, is especially useful when comparing two or more alternative options in terms of their potential environmental impacts [33]. It consists of four stages: (1) goal and scope definition, (2) life cycle inventory, (3) life cycle impact and assessment and (4) interpretation. The environmental impact assessment method of calculation that will be considered in this study is the CML 2 baseline 2000 (v 2.03), developed by the Institute of Environmental Science of Leiden University, which is the database of the SimaPro7 software (version 7.1.0).

2.1. Goal and Scope Definition

The Goal of this LCA study is to quantify and evaluate the total environmental impacts and benefits of the windrow composting system and anaerobic digestion with composting system, including the production of compost products, transport and application of composted products to agriculture as an option for managing compostable organic materials generated. Windrow composting was chosen because it is the most frequent composting method used, and the anaerobic digestion combined composting system was chosen as it is currently applied in Qatar.

2.2. Functional Unit

It is necessary to provide a reference through which the process inputs and outputs are correlated. In this study, 1 tonne of food waste was established as the functional unit. Details and characteristics of the food waste used in the modeling will be described below.

2.3. Assumptions

Although transportation has been included in the system boundary in this study, it should be highlighted that the estimated travel distances are approximately the same (15–20 km) from waste collection points to all waste processing centers. The different biogas utilization pathways include: direct use in internal reciprocating combustion engines (ICEs), gas turbine, organic Rankine cycle, fuel cells and indirect use through a preliminary upgrade to bio-methane for transport fuel or injection into the public natural gas grid. As far as direct use is concerned, biogas combustion in ICE is the most widespread alternative at the international level, also offering the possibility of combined heat and power (CHP) production.
According to the Environmental Protection Agency (US EPA) and the United States Composting Council (USCC), aerobic composting does not contribute to CO2 emissions, the main contributors to greenhouse gas response and global warming. Any emissions from aerobic composting are considered part of the natural carbon cycle [34]. In addition, the importance of GHG emissions generated during the biological treatment of wastes has also been stated by several authors, for example Saer et al. CO2 emissions coming from biological processes are not considered as contributing to global warming since this carbon has a biogenic origin, i.e., this carbon has been previously fixed biologically.
According to the guidelines compiled by the Intergovernmental Panel on Climate Change (IPCC) of 2007, biogenic emissions must not be included because the emission from bioenergy sources is already fully included in agriculture, forestry and other land-use [35]. Therefore, bioenergy is always referred to as a carbon-neutral source of energy and promoted as a substitute for fossil fuels. Due to the assumption of zero climate change potential of biomass combustion, the methods for assessing its global-warming impact in environmental analysis tools (e.g., SimaPro, GaBi) usually do not include the biogenic CO2 emission and even treat biogenic CO2 emission as a negative impact.
Well-managed composting operations produce very little methane or nitrous oxide. However, GHG emissions are otherwise released through the combustion of fossil fuels for vehicles and equipment and indirectly through the consumption of electricity generated at fossil fuel-burning power plants. It should be noted that increased fuel-use efficiency and the use of renewable fuels and energy could reduce these emissions. Furthermore, whilst it is theoretically possible for methane to be generated in a poorly managed compost pile, the EPA has concluded that there is little evidence that this actually happens, and therefore considers any releases negligible [36]. The system has minimal water usage and as a result, it is assumed that the water is recycled from the process and it is not considered. Adding to that, the treated sewage effluent water is free of charge, which is another reason for why it has not been accounted for in the analysis.
Notably, in the life cycle of anaerobic digestion combined composting scenario, during the composting phase the food waste is digested aerobically, however the steps for digestion are different from windrow composting because it is considered a closed system. In this study, the total amount of energy for grinding, mixing and screening was added as an input for composting in the combined system. The system has minimal water usage, and as a result it is assumed that the water is recycled from the process and it is not considered. Adding to that, the treated sewage effluent water is free of charge, which is another reason why it has not been accounted for in the analysis. In the windrow composting process the effluent produced is recirculated back to aid the composting process, while in the AD combined composting process the effluent water produced is treated and discharged.

2.4. Life Cycle Inventory

The data used in the development of the life cycle inventory (LCI) was collected from previous studies [37,38,39]. Other data inputs such as the emissions from the use of fossil fuels, transportation, and effluent treatment were obtained from the Ecoinvent 3 database in the SimaPro7 software (version 7.1.0). Assumptions were made in the absence of data availability. In this study the electricity used was generated using natural gas and the same is applied during the production of diesel used during transportation and windrow composting. The aforementioned methodology will be applied to windrow composting (Scenario 1) and anaerobic digestion with composting (Scenario 2) which will be detailed in the proceeding sections.
Transport distances were determined based on specific country locations and estimated distances within the State of Qatar. For this study, the 20 km distance considered was between an assumed farm located in the Mesaieed industrial area where the compost will be used and the compost-treatment plant or facility. The waste is transported by trucks with a load capacity of 1 tonne. The study assumed a distance of 55 km from the collection center to a waste treatment center, located in Mesaieed as illustrated in Table 2. The trucks are assumed to have low fuel consumption, travelling 3.54 km/L diesel consumed [39]. Table 2 illustrates the distances related to the transport of the waste to the solid waste treatment center and the distance the compost travels to the final use destination.
Defining the energy mix is very important especially when computing GHG, NOx, SOx and other emissions, which are classified into their respective LCA impact categories. For instance, China has an energy mix dominated by coal in which approximately 66% of the electricity generation comes from coal and 22% from hydropower. As such, emissions from power generation in China are considered one of the highest globally with an emission factor of 920 kg CO2 per MWh. By contrast, Germany’s energy mix consists of predominantly renewable energy sources. In 2013, whilst coal generation represented 46% of the energy mix, renewable energy sources represented 24%. With this relatively large participation of renewable energy, Germany’s CO2 emission rate was 670 kg CO2 per MWh [39]. Natural gas is considered a premium fuel for electricity and heat generation because burning gas produces less than half the CO2 emissions per unit of generated electricity compared to conventional fuels [40]. Considering that Qatar’s electricity is derived from natural gas, this study will utilize natural gas power generation as an input to the study.

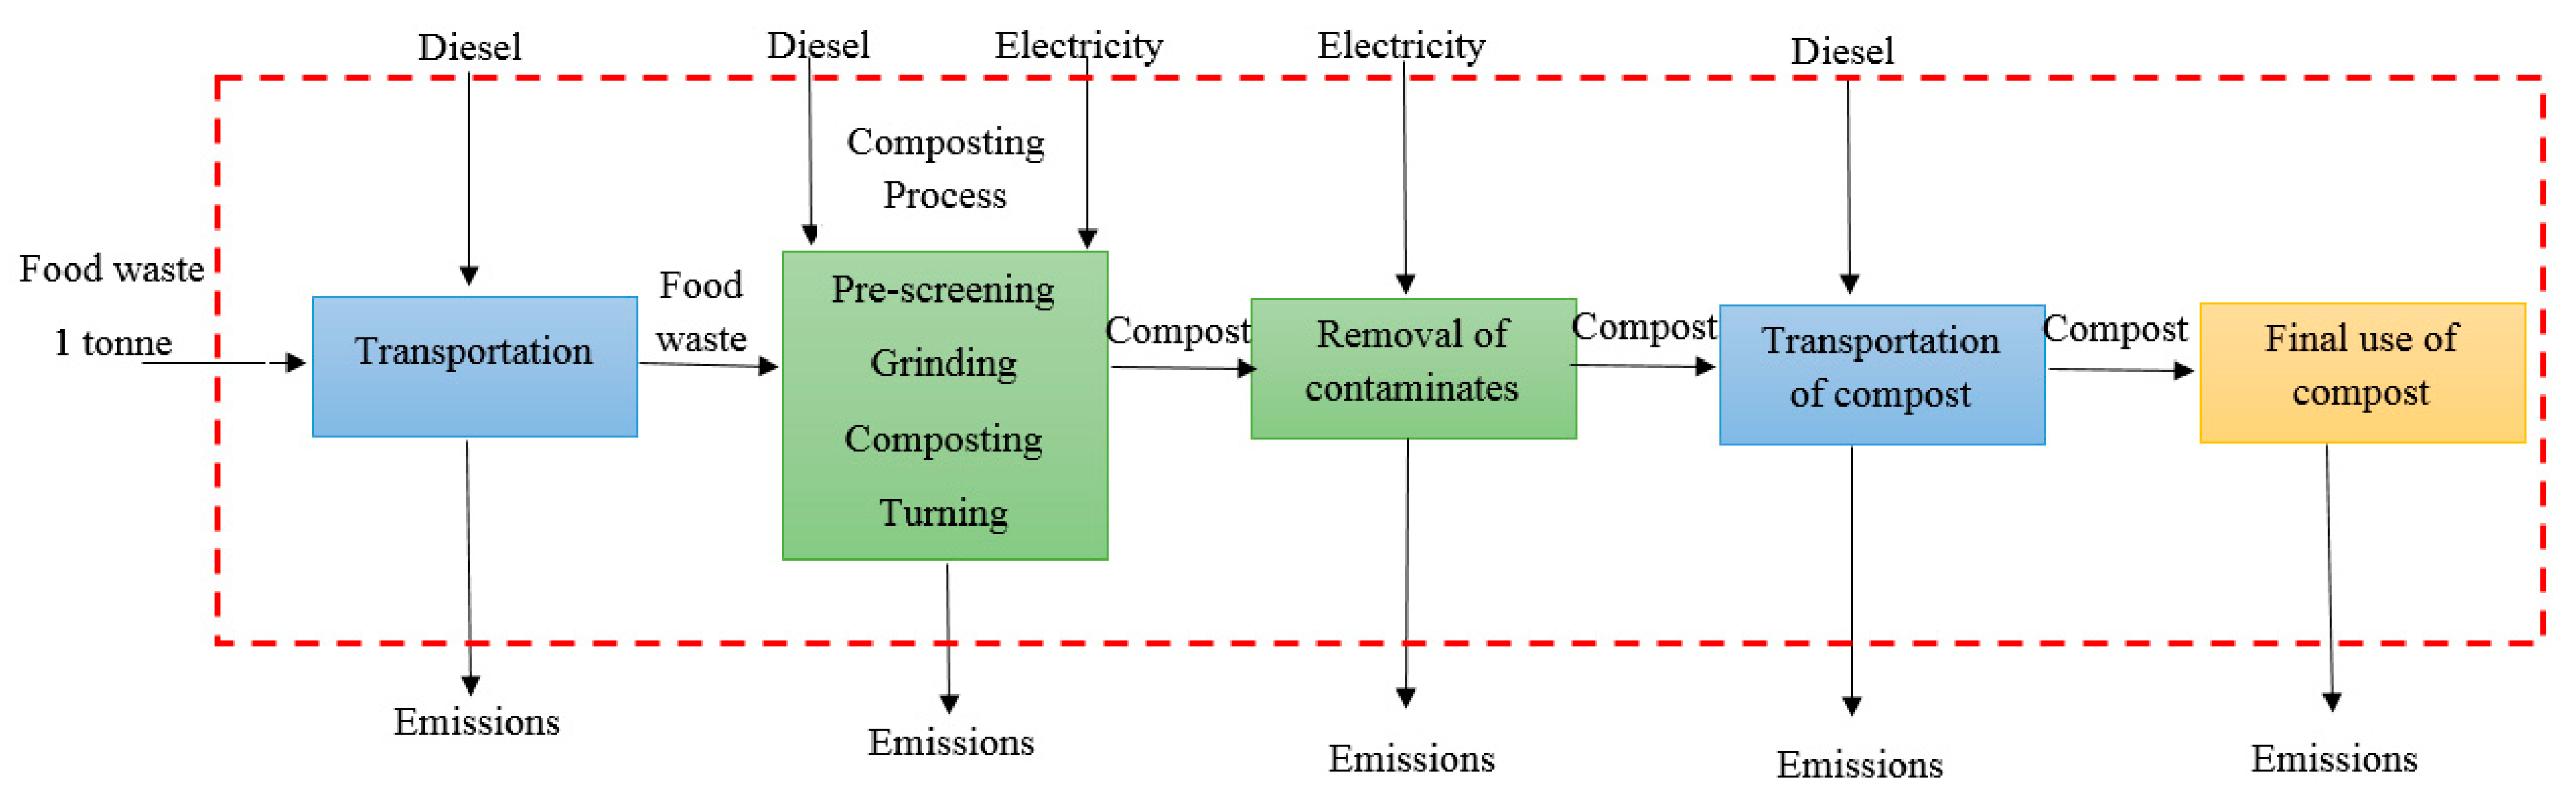
2.4.1. Scenario 1: Windrow Composting Inventories

The system boundary for the windrow composting system analyzed in this study is illustrated in Figure 1. It includes the production of composted products, transport, application to agricultural production systems and post-application impacts.
A windrow composting system begins with waste collection and transportation to the solid waste treatment center. Upon receipt of the food waste at the facility, it is blended with other types of materials to acquire the perfect recipe including moisture content (60%), carbon to nitrogen ratio (27:1), porosity (bulk density of 400–600 kg/m3 and a free air space of 50–60%,) and particle size (1/8–2 inches) for the composting process [9]. After obtaining the desired blend the waste is transferred to the windrow composting facility where it will be covered for the first phase of the composting process. During a certain time period (around a few weeks), the windrow will undergo an intensive composting process until the cover is removed and the windrow is moved to phase 2 of the system.
In phase 2, the windrow will be covered once again for two weeks, after which the compost will undergo a curing process, then entering phase 3 where it will be left uncovered on an aerated pad for an additional 2 weeks. Once removed from phase 3, the compost will continue curing in a large storage windrow before it is screened for the appropriate particle size. Prior to releasing the compost to the market, a sample is usually taken to test the quality of the compost and ensure that it complies with the necessary regulations. This includes laboratory tests to measure the levels of heavy metals, fecal coliform, salmonella, and nutrient content including nitrogen, phosphorus, potassium and sodium to ensure a good compost quality for the consumers [41,42]. Figure 2 illustrates the process flow diagram of each phase during composting.
The LCI of windrow composting systems as detailed in Table 3, including post application impacts, has identified relevant environmental issues (impact categories), and quantified data for production and application of composted products. Life cycle inventory data suggests that most environmental issues arising from the production and transportation to application sites and application on agricultural land are related to the production and consumption of diesel fuel required during all stages of these processes. Equipment used in windrow composting operations consumes fuel that needs to be accounted for, and includes windrow turning machines and shredding and screening equipment. Turning procedures used in mechanically turned windrows help to [43]:
  • Distribute materials more evenly throughout the composting mass;
  • Mix materials;
  • Rebuild the porosity of the windrow;
  • Release trapped heat, water vapor and gases;
  • Replenish oxygen levels.
Emissions from equipment used in the processes were excluded from the study, however the combustion and emissions of diesel used to operate the machinery was considered. Table 3 illustrates all the inputs and the outputs from the windrow composting life cycle for the functional unit designated for this study.
Four main gases are released from feedstock decomposition during the composting stage: carbon dioxide (CO2), methane (CH4), nitrous oxide (N2O) and ammonia (NH3). Emissions of CO2 occur when microorganisms decompose organic matter. Following the recommendation of the Intergovernmental Panel on Climate Change (IPCC) which considers CO2 emissions from degradation of organic material as biogenic, CO2 emissions were not included in the global warming potential accounting. Table 4 presents the emission indices of the decomposition.
After the composting stage is complete, the product is distributed and utilized as a soil conditioner in agricultural applications. During this stage, the following are considered: production and use of diesel and bio-fertilizer as replacements for mineral fertilizers. Bio-fertilizers contain nutrients that can replace the use of multi-nutrient/chemical fertilizers that are produced in industrial processes. Most often, chemical fertilizers applied to soils contain two or more nutrients as in this case N, P and K as illustrated in Table 5. This assumes, however, that the compound is used rationally as part of a fertilizer application plan.
There are multiple environmental benefits when inorganic fertilizers are replaced with compost [46]. Table 6 illustrates the comparison of the environmental impact between the use of compost and inorganic fertilizer taken [47]. Most of the benefits are in reducing the production of nitrogen required for the mineral/inorganic fertilizer and in avoiding the subsequent application, in which nitrogen oxides will be emitted into the atmosphere. In the application of inorganic fertilizers, and because of the nitrification and denitrification processes, in addition to valorization, about 10% of the ammonia in the fertilizer will be oxidized into nitrous oxide (NOx), which is released into the atmosphere, contributing to acidification. In addition, the use of fertilizer produces N2O emissions during nitrification and denitrification in the soil which will contribute to the GWP. Furthermore, the aquatic eutrophication potential can be increased due to any phosphorus and nitrogen leaching into the aquatic ecosystem. Furthermore, excessive application of fertilizer can also negatively affect the crop production efficiency [46].
Finally, the composting process will result in wastewater as an effluent, which is discharged into a treatment station and then recycled back into the composter. It is crucial to calculate the efficiency of contaminants removal from the influent wastewater, as pollution tends to decrease with increasing efficiency. Table 7 illustrates the inventory for the aquatic effluent and the efficiency of contaminants removal. The following definitions are utilized [44]:
  • Influent: water, wastewater or other liquid flowing into a reservoir, basin or treatment plant;
  • Effluent: an outflowing of water or gas to a natural body of water;
  • Removal efficiencies: mean influent/effluent loading, the following equation was used to calculate this index:
RE = ( I E ) ( I )
where RE is the removal efficiency, I is the influent, and E is the effluent.

2.4.2. Scenario 2: Anaerobic Digestion with Composting

Anaerobic digestion is a complex series of reactions where organic material is degraded by microorganisms in the absence of oxygen. The process generates biogas, which is a mixture of methane and CO2, and a residual biodigestate that may be used as fertilizer. Anaerobic digestion and composting are separate systems but when combined together they can enhance the performance of both systems and yield environmental benefits. Some of the waste product from digestion will become an input for the composting process and vice versa. As such, the adoption of the integrated system will result in more useful products and the generation of less waste [37]. Figure 3 illustrates the system boundary of the integrated anaerobic digestion combined composting and windrow composting evaluated in this study.
The solid material produced by the anaerobic digestion, known as the digestate, undergoes an aerobic process to produce the compound that will be used by the conventional composting process, to substitute the inorganic fertilizer [52]. The other output is the biogas, naturally created in the sealed tanks, and which is used as a fuel in a CHP (combined heat and power) unit, where the biogas enters the gas engine system to generate renewable energy, i.e., electricity and heat, and this is called gas utilization. In this study, it is considered that 149 m3 of biogas is produced per 1 tonne of solid waste (SW) treated [53,54]. In the first system (digester), water, food waste feedstock, air and energy enter as inputs and the resulting outputs include biogas, effluent and digestate. The biogas contains ammonia and hydrogen and other compounds as illustrated in Table 8 below.
The energy entering the digester is usually used for heating and feedstock preparation. During the whole process 60% of methane and around 40% of CO2 will be produced from anaerobic digestion [55]. The biogas naturally created in the sealed tanks is used as a fuel in a CHP (combined heat and power) unit where the biogas enters a gas engine system to generate renewable energy, i.e., electricity and heat, and this is called a ‘gas utilization unit’.
The electricity generated from biogas will be used to handle the digestate and to aerate the compost in the composter, and the heat generated will be recycled back to the digester. The remaining energy and heat will be used for other purposes. The next step of the process is the aerobic digestion stage to produce compost. The energy required by the turners will be obtained from the AD and an addition of leaves and yard waste for increasing the carbon content [39]. The effluent from AD will be fed into the composter after it has been treated as illustrated in Figure 4.
The resulting output of the system includes compost, residuals, which are landfilled, and air emissions from the use of turners and from the composting process. Considering the quantity of compost produced, it will be 300 kg/tonne of waste processed, based on data provided by the Domestic Solid Waste Management Centre in Qatar (DSWMC). Table 9 below illustrates the input data for the integrated anaerobic digestion with composting for the functional unit designated for this study.
The anaerobic degradation is carried out inside the fermenters. Emissions from the batch fermenters occur when the fermenters are opened to be refilled. Table 10 below illustrates the emission data of the anaerobic digestion process.
The combustion of biogas in an internal combustion engine (ICE) is the most widely utilized pathway for biogas, also offering the possibility for the production of combined heat and power (CHP) [58]. The demand for the quality of the biogas in gas burners is low, only requiring a gas pressure of 8 to 25 mbar and maintaining H2S levels to below 100 ppm in order to achieve a dew point of 150 °C. The use of biogas in turbines requires the removal of both H2S (to below 100 ppm) and water vapor. For applications that require the gas to be used in ICEs, boilers or fuel cells, the biogas will probably need to be pretreated in order to remove corrosive or dangerous contaminants. The primary contaminant of biogas is hydrogen sulfide as shown in Table 11.
This chemical will also react with water to form corrosive acids that can attack metals and plastics. Hydrogen sulfide is also toxic and sufficient quantities will present a possible health hazard if not treated [59].

2.5. Life Cycle Impact Assessment (LCIA)

In the third stage the of LCA the assessment of the environmental impact of the specific product will be determined taking into account the entire impact of each process in the life cycle [60]. Life cycle impact assessment (LCIA) is used to characterize and assess the effects of resource consumption and environmental loadings identified in the inventory stage. The following description of LCIA is based on the AS/NZS ISO 14042 [61].
Impact assessment is carried out in three different phases:
  • Classification;
  • Characterization;
  • Valuation.
When all the impact categories have been selected, the contribution of each input and output in the system in terms of environmental loads needs to be assigned to each impact category and to be converted into indicators that will represent its potential impact on the environment. As illustrated in Equation (2) below, this can be achieved by multiplying the classification phase with the characterization factor for each impact category presented by Karim [62].
Category   Indicator = s Characterization   factor   ( s )   ×   Emission   inventory   ( s )
where subscript s donates the chemical or material/component.
The characterization factor (CF) is determined by the impact assessment method; in this example the CML midpoint is used. The analysis of the incremental system was carried out with the help of SimaPro7 software (version 7.1.0). The impacts of different parts of the system on each midpoint category are first characterized in terms of percent contributions. Total impact (positive or negative) in each category is taken as 100% and the contributions of system components are allocated as a percentage of the total impact. The impact categories that will be evaluated as part of this study are described in following section.

3. Results

The results of the LCA impact assessment for the two processes are presented in Figure 5, Figure 6 and Figure 7. Figure 5 illustrates the comparison between the two food waste management methods evaluated in this study in terms of the full range of impact categories assessed. The negative values observed in the results represent environmental benefits in the analyzed impact categories, while positive values refer to the negative environmental impacts. The ranking varies greatly between the assessed techniques. The impact categories for the integrated anaerobic digestion and composting system have been ranked. Evidently, it is the food waste management option that has the smallest contribution to the ADP, ADP–FF (from fossil fuels), ODP and GWP impact categories. By contrast, the windrow composting is identified as the food waste management option with the larger environmental burden as represented by the impact categories (Figure 5).
Trends for the increasing of photochemical oxidation, acidification and eutrophication impact categories for both food waste management options are illustrated in Figure 5. It is important to note that the environmental benefits from the final use of compost for windrow composting helped to decrease the impact of abiotic depletion. The integrated anaerobic digestion and composting system is particularly important as the configuration results in positive environmental benefits, primarily due to fossil fuel replacement, in addition to the substitution of inorganic fertilizer with compost. Results reported have shown that an integrated treatment of food waste based on AD and composting demonstrated 80% lower impacts for global warming potential than the windrow composting method.
Although the use of anaerobic digestion to treat food waste results in environmental impacts across all categories, the degree of environmental burden is coincidentally reduced due to the potential for energy generation when using biogas as a fuel and the substitution of digestate for mineral fertilizers. The results illustrated in Figure 6 indicate that the utilization of biogas with heat and electricity generated in the AD–CHP system (yellow) leads to a significant reduction in most impacts including abiotic depletion, global warming potential and ozone layer depletion. Larger savings are achieved for fossil fuel depletion and ozone layer depletion, with an almost 100% reduction.
On the other hand, the windrow composting system results in relatively larger environmental impacts across most impact categories considered. As illustrated in Figure 7 the impacts are particularly large in the composting, collection and transportation phases causing fuel depletion by 60%, ozone depletion and human toxicity with a contribution of 50%. Notably the abiotic depletion is reduced by almost 100% in the final use phase of compost, because the utilization of new resources and energy to manufacture the artificial fertilizers would be avoided. The high percentage of the ozone depletion, human toxicity and abiotic depletion impact categories is due to the use of diesel during the collection and transportation and the use of machinery such as mixers.

4. Sensitivity Analysis

Pianosi et al. (2016) define sensitivity analysis (SA) as an investigation of how the variation in the output of a numerical model can be attributed to variations of its input factors. Within this broad definition, the type of approach, level of complexity andz purposes of a SA vary quite significantly depending on the modeling domain and the specific application aims [63]. A sensitivity analysis of these factors is not only critical to model validation and understanding but also serves to guide future research efforts [64]. The sensitivity analysis was conducted to find out the effect of the following factors on the energy use and electricity and heat avoidance on global warming potential. The analyses for the two scenarios under study are presented below.

4.1. Electricity Use in Processes

For the sensitivity analysis, the following variations were considered: increase in energy consumption in processes by 10% and 30%, and reductions in energy consumption by 10% and 30%.

4.1.1. Windrow Composting

The phases of the windrow composting that use electricity are: pre-screening, post-screening and removal of contaminants. However, these phases have a low consumption of electricity, so even with large variations in energy use, the global warming potential had a small percentage of variation. The results show that for a 30% increase in energy use, global warming increased by 0.25%, while for a 10% increase in electricity use there was an increase of 0.085%. For a reduction of this use by –10%, the impact potential decreased by 0.085% and for a reduction of 30% in energy use, the total impact decreased by 0.25%. Table 12 shows the total values of the global warming potential, as well as the sensitivity in percentage in relation to the reference scenario. Figure 8 presents the results of the sensitivity analysis for global warming potential for the windrow composting scenario.

4.1.2. Anaerobic Digestion with Composting

For the Anaerobic digestion with composting scenario, the sensitivity analysis with respect to the use of energy was performed in the anaerobic digestion stage. The results show that with a 30% increase in energy use, global warming had an increase of 6.75%, and for a 10% increase in electricity use there was an increase of 2.25%. For a reduction of this use by 10%, the impact potential decreased by 6.25% and for a 30% reduction in energy use, the total impact decreased by 2.25%. Table 13 shows the total values of the global warming potential, as well as the sensitivity in percentage in relation to the reference scenario. Figure 9 presents the results of the sensitivity analysis for global warming potential.

4.2. Electricity and Heat Avoidance in Anaerobic Digestion Combined Composting System

The amount of electricity and heat produced from biogas could avoid the production of an equivalent amount of heat from a non-renewable source such as natural gas. In the same way, it could be considered that the amount of electricity generated from the biogas could replace the same amount of electricity produced in the Qatar grid. The most important assumption concerns the quantity and quality of the energy substituted by that produced from biogas. In this study, electricity and heat production are modeled by expanding the system to evaluate the burdens avoided by substituting the energy input in the system by biogas generated from the digester. Because avoided electricity and heat have positive results for the environment, a bigger amount of electricity and heat avoided produce greater benefits to the environment, in the same way that a decrease in them causes an increase in the impact. Therefore, the results show that with a 30% increase in heat and electricity avoided, the impact on global warming decreases by 109.28%, and with a 10% increase, the impact decreases by 36.43%. A decrease of 10% in electricity and heat avoidance increases the global warming potential by 36.43%, and a decrease by 30% increases the global warming potential by 109.8%. Table 14 illustrates the total values of the global warming potential, as well as the sensitivity in percentage in relation to the reference scenario. Figure 10 presents the results of the sensitivity analysis for global warming potential.
Parameter identification is a delicate task due the potentially large number of parameters and the importance it exerts in the processes. However, for the specific variation range in this study, it was concluded that the electricity used in windrow composting did not contribute much (less than 1%) to the global warming potential. For anaerobic digestion with composting, it was more sensitive (less than 7%), due to the larger amount of energy used in the process. Therefore, it was concluded that the higher the energy consumption for the phases, the global warming potential would be more sensitive to changes. The anaerobic digestion is a very complex process, as well as the energy produced through biogas. However, for more energy avoidance, the results for global warming potential are better, since the emissions of electricity from natural gas will be avoided.

5. Discussion

Food waste treatment by the anaerobic digestion combined composting process results in an environmental impact across all impact categories. However, the environmental burden is compensated through the power generated when biogas is used as a fuel and when synthetic/chemical fertilizer is replaced by compost. In addition, the energy demand during the composting process in the integrated AD combined and composting system is sourced from the heat generated by CHP. The use of a fossil-fuel system with heat and electricity generated in the AD–CHP system causes a significant reduction in most LCA impact categories. Furthermore, significant savings are achieved for fossil fuel depletion and ozone layer depletion for an almost 100% reduction.
Although the energy demand during the composting step in the anaerobic digestion pathway was sourced from the heat generated by the CHP, different parameters could potentially affect the impacts significantly. These are related to the use of different feedstocks for biogas production and the efficiency of energy generation in the CHP plant. Notably, the key driver for ADP is reduced by almost 100% in the final end-use phase. This reduction is because minerals extraction is avoided when compost replaces commercial fertilizer. Due to the risks for human health from toxic materials, handling and processing of food waste via AD must be highly regulated. For instance, the use of reactive adsorption technology for the removal of H2S from biogas produced in anaerobic digesters [65]. Gaseous emissions from the composting and anaerobic digestion process represent the main contribution to eutrophication, acidification and photochemical oxidation potentials. The values of these potentials can be drastically decreased at a plant by designing and implementing an efficient gaseous emissions treatment in the composting facilities. For example, emissions of nitrogen oxides and sulfur dioxide can be reduced by treating the flue gases. For instance, the flue gases can be mixed with ammonia, converting the nitrogen oxides into nitrogen and water. A process called activated carbon process reduces NO2 produced during combustion to NO via a reaction with carbon at about 80 °C. Ammonia can then be added to N2 and water in order to reduce the NO. NOX removal can be in the region of 40–60% [66]. Volatile organic compounds (VOCs) emitted during the composting process are the main pollutants responsible for EP, AP and POP (Photochemical Oxidation Potential).
Composting organic material reduces the carbon/nitrogen ratio, while sanitizing and improving its physical properties. However, the biggest challenge in composting is the loss of nitrogen, mainly as NH3 and to a lesser extent as N2O, which contributes to GWP. NH3 depositions have been linked to soil acidification, soil water eutrophication, smog formation and the reduction in air quality. Nitrogen oxides, which can be generated during biogas combustion, typically refer to the mono-nitrogen oxides nitric oxide (NO) and nitrogen dioxide (NO2), and their precursors nitric and nitrous acid, respectfully. Sulfur dioxide (SO2) is a major constituent of SOx and is formed when biogas containing hydrogen sulfide is combusted. Saer et al. (2013) suggested several methods that can be used to control gaseous emissions generated during composting. Emissions can be controlled when having a C:N ratio above 25 to decrease the emissions of both NH3 and N2O. Under anaerobic conditions when there is insufficient oxygen, methane gas can be generated. As a result, anaerobic digestion conditions will occur, so the main solution is to constantly mix the waste piles in order to aerate them so as to prevent the formation of anaerobic pockets in the pile [37]. Moreover, Amlinger et al. (2008) recommended that the initial moisture content be between 65–70% and 50–60% during subsequent stages [67]. Furthermore, nitrous oxide formation can be suppressed by maintaining the temperature range between 40–60 °C. Finally, technologies can be used to reduce emissions; for instance, placing the organic mixture of waste in slabs of perforated concrete and injecting it with air facilities oxygen transfer to encourage microbial activities, which will reduce the occurrence of anaerobic conditions and as a result reduce the formation of CH4.
Based on previous literatures and results provided in this study Table 1, both scenarios are almost identical in terms of emission sources. In terms of environmental benefits, it is evident that in both methods this is due to the use of compost as a fertilizer. When specifically looking at the method, the AD combined composting has many benefits both environmentally and economically [9]. For instance, it reduces effluent treatment from the digester and pathogen restriction due to thermophilic composting, which treats the effluent from the digester, resulting in a higher digestate value. Moreover, it will reduce the cost of electricity generation when replacing it with electricity generated from biogas. Additionally, the integrated system will potentially maximize plant capacity, resulting in a low footprint. The fact that the food waste is processed in a completely closed system helps in reducing odors and controlling biogenic emissions generated from the composter and digester, unlike the windrow composting method [38]. All waste treatment methods are odor associated; however, odors from landfill are the worst and resulting in many adverse effects to humans including health impacts. Those odors are created due to the release of hydrogen sulfide (H2S) during waste decomposition [9].

6. Conclusions

Through the LCA methodology, the study has investigated the environmental impacts and benefits of two treatment scenarios for food waste management—anaerobic digestion combined with composting and windrow composting. Environmental assessment impacts were the highest in windrow composting for acidification (9.39 × 10 − 1 kg SO2 eq) and abiotic depletion of fossil fuel (9.24 × 10 + 2 MJ) impact category. While for AD combined composting the impact was highest under human toxicity (3.47 × 10 + 1 kg 1.4 DB eq) and the eutrophication impact category (4.55 × 10 − 1 kg PO4 eq). In most categories the anaerobic digestion with composting system provides larger benefits in terms of environmental performance than the utilization of windrow composting, especially when considering GWP. Despite these advantages, the implementation of AD systems has been slow, due to the high investment and maintenance costs. The majority of environmental impacts in the LCA impact categories considered for both management options are mainly associated with collection, feedstock and products transportation from the use of diesel. Incidentally, these impacts are avoided when electricity is produced in the AD–CHP system. Furthermore, benefits to the ODP, HTP and ADP impact categories are evident when the production of synthetic fertilizer production can be avoided by the use of digestate produced during the AD treatment system.
The results of a sensitivity analysis in the LCA are important because they can be used to identify parameters that can considerably change the result, and which might need further investigation. As such, a sensitivity analysis approach has been developed for this project, which enables apportioning the results variability of the SimaPro model for different energy source inputs. Parameter variability is quantitatively evaluated by the calculation in the model, with important impact results in the AFD, ADP (Abiotic depletion potential), GWP (Global warming potential), ODP (Ozone depletion potential) and POP (Photochemical Oxidation Potential) categories. The analysis demonstrated that the GWP impact is lower when photovoltaic energy is used. Evidently, this is an important conclusion, especially when considering the aspirations by the State of Qatar to increase the utilization of solar energy as part of its electricity production portfolio. Considering the study limitations; the main limitation is related to the fact that the majority of the data utilized for inventory development has been sourced from literature. Furthermore, the computed performance does not necessarily reflect the level of performance that could be realized from the appropriate application methods, which are tailored to Qatar conditions. Though trends identified for these impacts in this study will most likely be similar for Qatar, quantitative impacts may not be entirely appropriate for specific Qatar conditions. However, as the model has been developed as part of this study, it can be updated with Qatar-specific data once available.
Due to the level of impurities in the produced biogas, the gas would need to be subjected to some treatment processes before being of a sufficient purity to be injected into the grid pipeline system. These processes could include drying to remove moisture; silica gel or activated carbon treatment to remove siloxanes and sulfides; iron oxide/iron sponge/bioscrubbing to remove hydrogen sulfide; and membrane/pressure swing adsorption/amine scrubbing to remove carbon dioxide. As this study did not to incorporate these process factors in the impact assessment due to time constraints, it will be part of future studies.
Going forward, the main recommendations for future studies is to quantify the net energy gains and fate of nutrients of potential biogas pathways that consider different variables: i) biomass feedstock, ii) technology choices and management practices and iii) uses of the produced biogas (e.g., compressed biogas for transportation and upgraded biogas for pipeline injection) and digestate. This comprehensive analysis is important in order to identify the most desirable pathways based on established priorities and to propose improvements to the currently available pathways. Further development of the model will involve expansion of the model to include the impacts of wastewater return and sludge nutrient benefits. Furthermore, it is recommended to conduct further LCA comparisons with other food waste treatment scenarios, such as pyrolysis or other composting techniques including vermicomposting.

Author Contributions

A.A.-R.: Student carrying out the research and acquiring the data contributed in methodology, investigation, writing—original draft preparation, writing—review and editing. G.M.: editing and overseeing the final paper contributed in writing—review and editing. H.R.M.: checking and advising on the context of the written text contributed in writing—review and editing. T.A.-A.: main supervisor and technical guide during the project contributed in conceptualization, methodology, resources, writing—review and editing, supervision, and project administration. All authors have read and agreed to the published version of the manuscript.

Funding

This research received no external funding.

Conflicts of Interest

All the authors declare that they have no conflict of interest in the project in any way.

References

  1. Food and Agriculture Organization of the United Nations. The State of Food Insecurity in the World: The Multiple Dimensions of Food Security; Food and Agriculture Organization of the United Nations: Rome, Italy, 2003. [Google Scholar]
  2. Adema, S. EcoMENA—Ecoing Sustainability. 2016. Available online: www.ecomena.org/food-waste-in-qatar/ (accessed on 17 April 2018).
  3. Al-Ansari, T.; Korre, A.; Nie, Z.; Shah, N. Development of a life cycle assessment tool for the assessment of food production systems within the energy, water and food nexus. Sustain. Prod. Consum. 2015, 2, 52–66. [Google Scholar] [CrossRef]
  4. Elkhalifa, A.; Al-Ansari, T.; Mackey, H.; Mckay, G. Food waste to biochars through pyrolysis: A review. Resour. Conserv. Recycl. 2019, 144, 310–320. [Google Scholar] [CrossRef]
  5. AlNouss, A.; Mckay, G.; Al-Ansari, T. A techno-economic-environmental study evaluating the potential of oxygen-steam biomass gasification for the generation of value-added products. Energy Convers. Manag. 2019, 196, 664–676. [Google Scholar] [CrossRef]
  6. Niutanen, V.; Korhonen, J. Industrial ecology flows of agriculture and food industry in Finland: Utilizing by-products and wastes. Int. J. Sustain. Dev. World Ecol. 2003, 10, 133–147. [Google Scholar] [CrossRef]
  7. Banar, M.; Cokaygil, Z.; Ozkan, A. Life cycle assessment of solid waste management options for Eskisehir, Turkey. Waste Manag. 2009, 29, 54–62. [Google Scholar] [CrossRef]
  8. Martinez-Blanco, J.; Colón, J.; Gabarrell, X.; Font, X.; Sánchez, A.; Artola, A.; Rieradevall, J. The use of life cycle assessment for the comparison of biowaste composting at home and full scale. Waste Manag. 2010, 30, 983–994. [Google Scholar] [CrossRef] [PubMed] [Green Version]
  9. Saer, A.; Lansing, S.; Davitt, N. Life cycle assessment of a food waste composting system: Environmental impact hotpots. J. Clean. Prod. 2013, 52, 234–244. [Google Scholar] [CrossRef]
  10. Elmore, D. Why Should I Compost. 2011. Available online: https://greenactioncentre.ca/reduce-your-waste/why-should-i-compost/ (accessed on 17 April 2018).
  11. Duveskog, D.; Nyagaka, D.; Mweri, B.; Shiribwa, M.; Kaumbutho, P. Soil and water conservation: With a focus on water harvesting and soil moisture retention. In A Study Guide for Farmer Field Schools and Community-Based Study Groups; The Farm Level Applied Research Methods for East and Southern Africa (FARMESA): Harare, Zimbabwe, 2003. [Google Scholar]
  12. Zhang, C.; Zeng, G.; Yuan, L.; Yu, J.; Li, J.; Huang, G.; Xi, B.; Liu, H. Aerobic degradation of bisphenol A by Achromobacter xylosoxidans strain B-16 isolated from compost leachate of municipal solid waste. Chemosphere 2007, 68, 181–190. [Google Scholar] [CrossRef] [PubMed]
  13. Hirai, Y.; Murata, M.; Sakai, S.; Takatsuki, H. Life Cycle Assessment for Food Waste Recycling and Management. In Proceedings of the 4th International Conference on EcoBalance Methodologies for Decision Making in a Sustainable 21st Century, Tsukuba, Japan, 31 October–2 November 2000. [Google Scholar]
  14. Baky, A.; Eriksson, O. Systems Analysis of Organic Waste Management in Denmark. Environmental Project; No. 822; Danish Environmental Protection Agency: Copenhagen, Denmark, 2003.
  15. Diggelman, C.; Ham, R. Household food waste to wastewater or to solid waste? That is the question. Waste Manag. Res. 2003, 21, 501–514. [Google Scholar] [CrossRef] [PubMed]
  16. Aye, L.; Widjaya, E.R. Environmental and economic analyses of waste disposal options for traditional markets in Indonesia. Waste Manag. 2005, 26, 1180–1191. [Google Scholar] [CrossRef]
  17. Karrman, E.; Baky, A.; Edström, M.; Magnusson, Y.; Malmqvist, P.-A.; Palm, O.; Rogsrand, G. Systems Study of Collection and Treatment of Organic Waste in Malmö; ECOLOOP: Stockholm, Sweden, 2005. (In Swedish) [Google Scholar]
  18. Guereca, L.P.; Gassó, S.; Baldasano, J.M.; Jimenez-Guerrero, P. Life cycle assessment of two biowaste management systems for Barcelona, Spain. Resour. Conserv. Recycl. 2006, 49, 32–48. [Google Scholar] [CrossRef]
  19. Borjesson, P.; Berglund, M. Environmental systems analysis of biogas systems—Part II: The environmental impact of replacing various reference systems. Biomass Bioenergy 2007, 31, 326–344. [Google Scholar] [CrossRef]
  20. Lee, S.-H.; Choi, K.-I.; Osako, M.; Dong, J.-I. Evaluation of environmental burdens caused by changes of food waste management systems in Seoul, Korea. Sci. Total Environ. 2007, 387, 42–53. [Google Scholar] [CrossRef] [PubMed]
  21. Boldrin, A.; Andersen, J.K.; Moller, J.; Christensen, T.H.; Favoino, E. Composting and compost utilisation: Accounting of greenhouse gases and global warming contributions. Waste Manag. Res. 2009, 27, 800–812. [Google Scholar] [CrossRef] [PubMed] [Green Version]
  22. Moller, J.; Boldrin, A.; Christensen, T.H. Anaerobic digestion and digestate use: Accounting of greenhouse gases and global warming contribution. Waste Manag. Res. 2009, 27, 813–824. [Google Scholar] [CrossRef] [PubMed] [Green Version]
  23. Khoo, H.H.; Lim, T.Z.; Tan, R.B.H. Food waste conversion options in Singapore: Environmental impacts based on an LCA perspective. Sci. Total Environ. 2010, 408, 1367–1373. [Google Scholar] [CrossRef]
  24. Kim, M.-H.; Kim, J.-W. Comparison through a LCA evaluation analysis of food waste disposal options from the perspective of global warming and resource recovery. Sci. Total Environ. 2010, 408, 3998–4006. [Google Scholar] [CrossRef]
  25. Izumi, K.; Okishio, Y.K.; Niwa, C.; Yamamoto, S.; Toda, T. Effects of particle size on anaerobic digestion of food waste. Int. Biodeterior. Biodegrad. 2010, 64, 601–608. [Google Scholar] [CrossRef]
  26. Fruergaard, T.; Astrup, T. Optimal utilisation of waste-to-energy in an LCA perspective. Waste Manag. 2011, 31, 572–582. [Google Scholar] [CrossRef]
  27. Elbeshbishy, E.; Nakhla, G.; Hafez, H. Biochemical methane potential (BMP) of food waste and primary sludge: Influence of inoculum pre-incubation and inoculum source. Bioresour. Technol. 2012, 110, 18–25. [Google Scholar] [CrossRef]
  28. Ma, J.; Duong, T.H.; Smits, M.; Verstraete, W.; Carballa, M. Enhanced biomethanation of kitchen waste by different pretreatments. Bioresour. Technol. 2011, 102, 592–599. [Google Scholar] [CrossRef] [PubMed]
  29. Vandermeersch, T.; Alvarenga, R.A.F.; Ragaert, P.; Dewulf, J. Environmental sustainability assessment of food waste valorization options. Resour. Conserv. Recycl. 2014, 87, 57–64. [Google Scholar] [CrossRef]
  30. Yong, Z.; Dong, Y.; Zhang, X.; Tan, T. Anaerobic co-digestion of food waste and straw for biogas production. Renew. Energy 2015, 78, 527–530. [Google Scholar] [CrossRef]
  31. Eriksson, M.; Strid, I.; Hansson, P. Carbon footprint of food waste management options in the waste hierarchy—A Swedish case study. J. Clean. Prod. 2015, 93, 115–125. [Google Scholar] [CrossRef]
  32. Li, Y.; Jin, Y. Effects of thermal pre-treatment on acidification phase during two-phase batch anaerobic digestion of kitchen waste. Renew. Energy 2015, 77, 550–557. [Google Scholar] [CrossRef]
  33. Levis, J.W.; Barlaz, M.A. What is the most environmentally beneficial way to treat commercial food waste? Environ. Sci. Technol. 2011, 45, 7438–7444. [Google Scholar] [CrossRef]
  34. US Composting Council. USCC Factsheet: Composting, Global Climate Change and Carbon Trading; The United States Composting Council: Bethesda, MD, USA; US Composting Council: Raleigh, NC, USA, 2008. [Google Scholar]
  35. Intergovernmental Panel on Climate Change. Report of Nineteenth Session of the Intergovernmental Panel on Climate Change (IPCC); IPCC: Geneva, Switzerland, 2002. [Google Scholar]
  36. USA Environmental Protection Angency. Turning a liability into an asset: A landfill gas-to-energy project development handbook. In Landfill Methane Outreach Program; United States Environmental Protection Agency: Washington, DC, USA, 2002. [Google Scholar]
  37. United States Environmental Protection Agency. Waste Reduction Model (WARM); United States Environmental Protection Agency: Washington, DC, USA, 2015.
  38. Kraemer, T.; Gamble, S. Integrating anaerobic digestion with composting. BioCycle 2014, 55, 32. [Google Scholar]
  39. Schumacher, L.G.; Borgelt, S.C.; Fosseen, D.; Goetz, W.; Hires, W.G. Heavy-duty engine exhaust emission tests using methyl ester soybean oil/diesel fuel blends. Bioresour. Technol. 1996, 57, 31–36. [Google Scholar] [CrossRef]
  40. Diaz, A.C. Energy Life Cycle Assessment (LCA) of Silicon-Based Photovoltaic Technologies and the Influence of Where It Is Manufactured and Installed. Master’s Thesis, University of Bacelona, Barcelona, Spain, 2014. Available online: http://diposit.ub.edu/dspace/bitstream/2445/57523/1/TFM_MERSE_AlejandroCalderon.pdf (accessed on 27 April 2018).
  41. BP. Statistical Review of World Energy; BP: London, UK, 2002; Available online: http://www.bp.com/centres/energy2002 (accessed on 17 April 2018).
  42. Sánchez, Ó.J.; Ospina, D.A.; Montoya, S. Compost supplementation with nutrients and microorganisms in composting process. Waste Manag. 2017, 69, 136–153. [Google Scholar] [CrossRef]
  43. Sharma, G.; Campbell, A. Life Cycle Inventory and Life Cycle Assessment for Windrow Composting Systems; Recycled Organics Unit, Department of Environment and Conservation, The University of New South Wales for the New South Wales: Sydney, Australia, 2003. [Google Scholar]
  44. Skowronska, M.; Filipek, T. Life cycle assessment of fertilisers: A review. Int. Agrophys. 2014, 28, 101–110. [Google Scholar] [CrossRef]
  45. Boldrin, A.; Christensen, T.H.; Körner, I.; Krogmann, U. Composting: Mass balances and product quality. Solid Waste Technol. Manag. 2010, 1–2, 569–582. [Google Scholar]
  46. Sanscartier, D.; MacLean, H.L.; Saville, B. Electricity production from anaerobic digestion of household organic waste in Ontario: Techno-economic and GHG emission analyses. Environ. Sci. Technol. 2012, 46, 1233–1242. [Google Scholar] [CrossRef] [PubMed]
  47. Goedkoop, M.; De Schryver, A.; Oele, M.; Durksz, S.; de Roest, D. Introduction to LCA with SimaPro 7; PRé Consultants: Amersfoort, The Netherlands, 2008. [Google Scholar]
  48. Von Sperling, M. Introduction to Water Quality and Sewage Treatment; Publisher UFMG: Belo Horizonte, Brazil, 1996; Volume 1. [Google Scholar]
  49. Rodriguez-Iglesias, J.; Marañón, E.; Castrillón, L.; Riestra, P.; Sastre, H. Life cycle analysis of municipal solid waste management possibilities in Asturias. Waste Manag. Res. 2003, 21, 535–548. [Google Scholar] [CrossRef] [PubMed] [Green Version]
  50. Leite, V.D.; de Sousa, J.T.; Lopes, W.S.; de Oliveira, E.G.; Campos, A.R.C.; de Oliveira, A.G. Conjugate treatment of leachate from landfill and sewage in domestic stabilization ponds. J. Urban. Environ. Eng. 2016, 10, 155–161. [Google Scholar] [CrossRef]
  51. Punzi, F. Production of Renewable Energy and Recovery of Waste Material by Anaerobic Digestion of the Organic Fraction. LCA Analysis of Some Treatment Scenarios. Master’s Thesis, Polytechnic of Milan, Milan, Italy, 2009. (In Italian). [Google Scholar]
  52. Finnveden, G.; Johansson, J.; Lind, P.; Moberg, A. Life cycle assessment of energy from solid waste—Part 1: General methodology and results. J. Clean. Prod. 2005, 13, 213–229. [Google Scholar] [CrossRef]
  53. Berglund, M.; Borjesson, P. Assessment of energy performance in the lifecycle of biogas production. Biomass Bioenergy 2006, 30, 254–266. [Google Scholar] [CrossRef]
  54. Gomez, A.; Zubizarreta, J.; Rodrigues, M.; Dopazo, C.; Fueyo, N. Potential and cost of electricity generation from human and animal waste in Spain. Renew. Energy 2010, 35, 498–505. [Google Scholar] [CrossRef]
  55. Schlegelmilch, M.; Streese, J.; Biedermann, W.; Herold, T.; Stegmann, R. Odour control at biowaste composting facilities. Waste Manag. 2005, 25, 917–927. [Google Scholar] [CrossRef]
  56. Eatom, A.; Clesceri, L.; Rice, E.; Greenberg, A.; Franson, M.A. Standard Methods for Examination of Water and Wastewater, 21st ed.; American Public Health Association: Washington, DC, USA, 2005. [Google Scholar]
  57. Carnevale, E.; Lombardi, L. Comparison of different possibilities for biogas use by Life Cycle Assessment. Energy Procedia 2015, 81, 215–226. [Google Scholar] [CrossRef] [Green Version]
  58. ISO. 14040: Environmental Management-Life Cycle Assessment-Principles and Framework; British Standards Institution: London, UK, 2006. [Google Scholar]
  59. Walsh, J.L.; Ross, C.C.; Smith, M.; Harper, S.; Wilkins, A. Biogas Utilisation Hanbook; Environment, Health and Safety Division, Giorgia Tech Research Institute: Atlanta, GA, USA, 1988. [Google Scholar]
  60. Standards Australia; Standards New Zealand. Australian/New Zealand Standard: Environmental management—Life Cycle Assessment—Principles and Framework; AS/NZS ISO 14040:1998; 1998; Available online: https://www.saiglobal.com/PDFTemp/Previews/OSH/As/as10000/14000/14040.pdf (accessed on 17 April 2018).
  61. Karim, A.I.M. Life Cycle Analysis and Life Cycle Impact Assessment Methodologies: A State of the Art. Ph.D. Thesis, University of Lleida, Lleida, Spain, 2011. [Google Scholar]
  62. Pianosi, F.; Beven, K.; Freer, J.; Hall, J.W.; Rougier, J.; Stephenson, D.B.; Wagener, T. Sensitivity analysis of environmental models: A systematic review with practical workflow. Environ. Model. Softw. 2016, 79, 214–232. [Google Scholar] [CrossRef]
  63. Hamby, D.M. A review of techniques for parameter sensitivity analysis of environmental models. Environ. Monit. Assess. 1994, 32, 135–154. [Google Scholar] [CrossRef] [PubMed]
  64. Bywater, A. A Review of Anaerobic Digestion Plants on UK Farms-Barriers, Benefits and Case Studies; Royal Agricultural Society of England: Stoneleigh, UK, 2014; Available online: https://www.fre-energy.co.uk/pdf/RASE-On-Farm-AD-Review.pdf (accessed on 19 April 2018).
  65. Cooper, C.D.; Alley, F.C. Air Pollution Control: A Design Approach; Waveland Press: Long Grove, IL, USA, 2002. [Google Scholar]
  66. Amlinger, F.; Peyr, S.; Cuhls, C. Greenhouse gas emissions from composting and mechanical biological treatment. Waste Manag. Res. 2008, 26, 47–60. [Google Scholar] [CrossRef] [PubMed]
  67. Di Nardo, A.; Bortone, I.; Chianese, S.; Di Natale, M.; Erto, A.; Santonastaso, G.F.; Musmarra, D. Odorous emission reduction from a waste landfill with an optimal protection system based on fuzzy logic. Environ. Sci. Pollut. Res. 2019, 26, 14755–14765. [Google Scholar] [CrossRef] [PubMed] [Green Version]
Figure 1. Windrow composting boundary.
Sustainability 12 01595 g001
Figure 2. Process flow diagram for windrow composting adapted from [9].
Sustainability 12 01595 g002
Figure 3. Anaerobic digestion combined composting boundary.
Sustainability 12 01595 g003
Figure 4. Process flow diagram of combined AD and composting, adapted from [39].
Sustainability 12 01595 g004
Figure 5. Impacts and benefits of anaerobic digestion combined composting and windrow composting.
Sustainability 12 01595 g005
Figure 6. Anaerobic digestion combined composting environmental impacts.
Sustainability 12 01595 g006
Figure 7. Windrow composting environmental impacts.
Sustainability 12 01595 g007
Figure 8. Global warming potential SA for electricity change in windrow composting.
Sustainability 12 01595 g008
Figure 9. Global warming potential SA for electricity change in AD and composting.
Sustainability 12 01595 g009
Figure 10. Global warming potential SA when changing biogas benefits in AD and composting.
Sustainability 12 01595 g010
Table 1. Summary of life cycle assessment (LCA) studies reviewed. GWP: global warming potential; AP: acidification potential; EP: eutrophication potential; ODP: ozone depletion potential; POF: photochemical ozone formation; ADP: abiotic depletion potential; EU: energy use; HTP: human toxicity potential; HT: human toxicity; HH: human health; WU: water use; LU: land use.
SourceYearStudy AreaTechnologies Considered (C = Composting; AD = Anaerobic digestion; L = Landfill; I = Incineration, AF = Animal feed)Impact Categories Studied
[12]2000JapanC/AD/IGWP, EP, AP, HTP, LU
[13]2003DenmarkI/AD/CGWP, EP, AP
[14]2003United StatesI/C/ADGWP, EU, AP
[15]2005IndonesiaL/AD/CPOF, GWP, EP, AP
[16]2005SwedenC/AD/IGWP, Nutrient Recovery, EU
[17]2006SpainI/C/AD/LGWP, AP, ODP, WU, HTP, HH, LU, ETP, POF
[18]2007SwedenI/C/ADGWP, POF EP, AP
[19]2007South KoreaC/AF/I/LGWP, EP, AP, ET, HTP
[20]2009DenmarkCGWP
[21]2009DenmarkADGWP
[22]2010SingaporeC/AD/IGWP, EP, AP, POF, EU
[23]2010South KoreaC/AF/IGWP
[24]2010SpainCGWP, AP, ODP, EU, EP, POF
[25]2010JapanADGWP
[26]2011DenmarkI/ADGWP, EP, AP, ETP, POF, water HTP, Soil HTP, Air HTP
[27]2011United StatesADGWP
[28]2011BelgiumADGWP
[29]2014BelgiumAD/AF/LGWP, EU
[30]2015ChinaADGWP
[31]2015SwedenC/AD/I/L/Food donations, AFGWP
[32]2015ChinaADGWP
Table 2. Average distances in Qatar.
Collection PointDestinationDistance (km)Truck Consumption (L)Truck Consumption (kg)
DohaMesaieed5515.4312.57
MesaieedFarm205.64.5
Table 3. Windrow composting inventory [39].
ProcessInputAmountUnitOutputUnit
Collection and transportationFood waste1tonneDiesel emissions: CO2, CO, NOx, SO2, CH4, N2O, PM10, Hydrocarbonskg
Diesel90kg
LoadingFood waste1tonneDiesel emissions: CO2, CO, NOx, SO2, CH4, N2O, PM10, Hydrocarbonskg
Diesel0.46kg
Pre-screeningFood waste1tonneElectricity emissions: CO2, CO, NOx, N2O, PM, PM10, PM2.5, SO2, SO3, CH4, TOC, VOC, N2, Ar, O2, H2O, 1,3–Butadiened, Acetaldehyde, Acrolein, Benzene, Ethylbenzene, Formaldehyde, Naphthalene, PAH, Propylene, PAH, Toluene, Xyleneskg
Electricity1.8kWh
GrindingFood waste940kgDiesel emissions: CO2, CO, NOx, SO2, CH4, N2O, PM10, Hydrocarbonskg
Diesel0.15kg
CompostingFood waste940kgDiesel emission: CO2, CO, NOx, SO2, CH4, N2O, PM10, Hydrocarbonskg
Diesel1.07kgComposting emissions: CH4, N2O, NH3
Curing windrow turnersCompost330kgDiesel emission: CO2, CO, NOx, SO2, CH4, N2O, PM10, Hydrocarbonskg
Diesel0.11kg
Post-screening + removal of contaminantsCompost330kgElectricity emissions: CO2, CO, NOx, N2O, PM, PM10, PM2.5, SO2, SO3, CH4, TOC, VOC, N2, Ar, O2, H2O, 1,3–Butadiene, Acetaldehyde, Acrolein, Benzene, Ethylbenzene, Formaldehyde, Naphthalene, PAH, Propylene, PAH, Propylene, Toluene, Xylenekg
Electricity0.9kWh
Transportation of productCompost330kgDiesel emissions: CO2, CO, NOx, SO2, CH4, N2O, PM10, Hydrocarbonskg
Diesel0.46kg
Windrow composting Final useCompost330kg300 kg Compost consisting of nitrogen, phosphorus, and potassiumkg
Artificial fertilizer (avoided)
Table 4. Emission factors (kg per tonne feedstock) of organic waste composting using windrow technology [9,44].
FeedstockWaste Source%CH4N2ONH3
Food wasteHousehold organic wastes49.69.08 × 10−13.72 × 10−22.01 × 10−1
LeavesHousehold organic wastes with leaves and branches27.85.28 × 10−21.95 × 10−20.00
Manure + lab animal cage wasteBio-waste compost164.24 × 10−21.14 × 10−25.02 × 10−2
Pallet chipsHousehold organic wastes mixed with coarsely chopped branches and bush trimmings3.84.52 × 10−13.80 × 10−30.00
Switch grassHousehold organic wastes with leaves, grass clippings and bush trimmings23.44 × 10−34.44 × 10−40.00
Straw + paperGreen waste0.82.61 × 10−38.12 × 10−41.52 × 10−3
Table 5. Bio-fertilizer inventory [45].
NutrientNutrient Content (mg Nutrient/kg Dry Compound)Replacement of Inorganic Fertilizers (mg/kg)
N5.581.12
P43.343.3
K51.251.2
Table 6. Comparison of environmental impact from the use of compost and inorganic fertilizer [48].
Impact CategoryUnitCompostInorganic Fertilizer
Abiotic depletion Potential (ADP)kg Sb eq.2.87 × 10−7−1.31 × 10⁻⁶
Abiotic depletion Potential (fossil fuel) (ADP-FF)MJ00
Global warming potential (GWP 100a)kg CO2 eq.0−0.0427
Ozone layer depletion (ODP)kg CFC − 11 eq.00
Human toxicity (HT)kg 1,4 − DB eq.0−0.000801
Photochemical oxidation Potential (POP)kg C2H4 eq.0−1.69 × 10⁻⁵
Acidification Potential (AP)kg SO2 eq.0−0.000491
Eutrophication Potential (EP)kg PO4 eq.0−3.377 × 10⁻⁵
Table 7. Aquatic effluent inventory.
EmissionConcentration (mg/L)SourceEfficiency of RemovalSourceProcessed Effluent
BOD2231[48]85[49]446
COD11,245[50]80[51]2249
TSS1407[48]80[51]281
N total1310[48]60[51]524
Phosphate58[48]84[51]9.3
Table 8. Anaerobic digester biogas composition [55].
Biogas%
Methane60
Carbon dioxide35
Hydrogen Sulfide1.67
Ammonia1.67
Water1.67
Table 9. Anaerobic digestion combined composting inventory.
ProcessInputAmountUnitOutputAmountUnitSource
Collection and transportationFood waste1tonneDiesel emissions: CO2, CO, NOx, SO2, CH4, N2O, PM10, Hydrocarbons kg[56]
Diesel14.57kgg
Anaerobic digestionFood waste1tonneBiogas150m3[39]
Energy for feedstock preparation11.25kWhDigestate0.85tonne
Heat for digester19.25kWhEffluent0.57tonne
Water0.5tonne
Biogas utilizationBiogas148m3Emissions from biogas use: NMVOCs, NOx, CO, PM, SOx, HCL, HF Kg[39]
Electricity178.1kWh
Heat120.9kWh
CompostingEnergy from biogas utilization9.52kWhCompost225kWh[39]
Air 0.9tonnekg
Digestate0.85tonneEmissions from composting: CH4, N2O, NH3 kg
Effluent0.57tonnekg
Transport of compost (product)Compost255tonneDiesel emissions: CO2, CO, NOx, SO2, CH4, N2O, PM10, Hydrocarbonskg
Diesel4.56kgkg
Final use of compostAvoided product (inorganic fertilizer) Compost consisting of nitrogen, phosphorus and potassium225kg[39]
Table 10. Emissions from anaerobic digestion of food waste [57].
ParameterAD (g/kg)
NH30.20
CO20
Biogenic CO2 *579.20
CO2.15
N2O0.069
H2S0.17
CH40.59
NOx0
* Biogenic CO2: emissions are defined as CO2 emissions related to the natural carbon cycle, as well as those resulting from the combustion, harvest, combustion, digestion, fermentation, decomposition or processing of biologically based materials [37].
Table 11. Emissions from biogas use [35].
Emissions to Air(g/m3 Biogas)
NOx6.96
CO5.076
PM0.139
SOx0.953
HCl0.085
HF0.095
NMVOCs95.15
Table 12. Global warming potential SA for electricity changes in windrow composting.
Percentage of Variation Total (Kg CO2 eq.)%
30%128.0830.250%
10%127.8660.085%
Reference127.758
−10%127.649−0.850%
−30%127.432−0.250%
Table 13. Global warming potential SA for electricity change in AD and composting.
Percentage of Variation %Total (CO2 eq)%
30%28.2676.75%
10%27.0742.25%
Reference26.478
−10%25.882−6.25%
−30%24.690−2.25%
Table 14. Global warming potential SA when changing biogas benefits in AD and composting.
Percentage of VariationTotal (CO2eq)% of Change from Baseline Study
30%−2.457−109.28%
10%16.833−36.43%
Reference26.478
−10%36.12336.43%
−30%55.414109.28%

