Article

The Effect of Urban-Suburban Interaction on Urbanization and Suburban Ecological Security: A Case Study of Suburban Wuhan, Central China

Urban and rural planning, School of Architecture, Soochow University, Suzhou 215006, China
*
Author to whom correspondence should be addressed.
Sustainability 2020, 12(4), 1600; https://doi.org/10.3390/su12041600
Submission received: 28 January 2020 / Revised: 18 February 2020 / Accepted: 18 February 2020 / Published: 20 February 2020
(This article belongs to the Section Sustainable Urban and Rural Development)

Abstract

:
In developing countries like China, urbanization is still occurring at a rapid pace. During urbanization, the urban land expands drastically, which makes suburbs the most affected area facing urban expansion. The land transition has proven to threaten the function and security of ecosystems, and therefore the topics of suburban land transition and ecological security have raised much attention. However, the urban-suburban interaction, which is one of the basic characteristics of suburbs, has been insufficiently considered. The urban-suburban interaction is developed based on the flows of people, materials, and information between urban and suburban areas, and it essentially reveals the relationship between human activities and land-use optimization. To fill the research gap, this study adopts a case study of Wuhan city, and first quantifies the urban-suburban interactions from a symbiotic perspective, and investigates rural residents and public buses to verify the estimated interactions. The results show that there is obvious heterogeneity in urban-suburban interactions in different suburban towns. Correlation analysis and geographic weight regression are then applied to demonstrate the relationship between the urban-suburban interaction and urbanization in the suburbs. Additionally, urbanization potential in the suburbs is estimated. Then, a suburban ecological security assessment is conducted by a “pressure-status-response” (PSR) model, and the urbanization potential that is estimated based on urban-suburban interaction is integrated as a “pressure” indicator. The comparison between the suburban ecological security assessment results based on considering and not considering urban-suburban interaction demonstrates the importance of considering urban-suburban interaction. This study contributes to the understanding of the complicated relationships of urban-suburban socio-economic, spatial, and ecological environments, and offers suggestions for suburban planning and ecological protection.

1. Introduction

Suburbs are defined either as adjacent areas of a city or as separate areas but within commuting distance of the city [1]. Due to the spatial proximity of suburbs to the urban area, suburbs are affected by the urban area from many aspects. On the one hand, many primary and secondary factories are wildly distributed in the suburbs to provide producing materials; on the other hand, some people settle in the suburbs but work in the near urban areas, which develops the commuting pattern of “set off in the morning and come back at night” between urban and suburban areas. The derived flows of people, materials, and information form complicated but tight interactions between urban and suburbs, which generate both positive and negative impacts such as economic improvement, social conflict, and ecological threat [2,3,4,5]. Hence, studies on urban-suburban interaction have caught much attention in recent years.
Despite the existing studies on urban-suburban interaction analysis, the effects of such interactions on land transition and the eco-environment are insufficiently discussed. Land transition is one of the biggest challenges that the suburbs face in both developing and developed countries. In developing countries, urbanization is occurring at a rapid pace and is accompanied by fast urban land expansion. During this process, a large amount of ecological land transits into the urban area, including natural land and cropland [6,7,8]. Developed countries also confront similar problems. For example, Salvati, et al. [9] concluded that the urban expansion in discontinuous and low-density Mediterranean regions threatens soil quality and vulnerable ecologies. Ustaoglu and Williams [10] pointed out that there is a significant land conversion from agricultural land to urban land in most European countries, and they also analyzed the determinants of such land conversion, including socio-economic, political, and natural factors. Suburban land conversion in the United States in recent years has also been studied, which is mainly caused by urban sprawl characterized by low-density settlements and automobile use increase [3,11,12,13]. In summary, land transition in the suburbs in both developing and developed countries is on the scarification of ecological land, which is fundamental to maintaining ecological security [14].
The land transition in the suburbs usually accompanies ecological risks. As the urban land expands and encroaches on ecological lands, threats are brought in, such as ecological land decrement, landscape fragmentation, and function degradation [15,16,17]. To estimate the threats brought by the urban expansion, an ecological security assessment is usually conducted to describe the conditions of the structure and function of the ecosystems [18], which is also a fundamental task in the planning and management of ecological protection. The “press-status-response” (PSR) evaluation model is one of the most adopted methods to estimate ecological security, which reveals the relationship between the pressure caused by human activities, the status expressed by the eco-environment, and the response proposed by human society [19]. To verify the effects of urban-suburban interaction on ecological security, this study first quantifies the urban-suburban interaction by utilizing the symbiotic theory. Then, a correlation analysis is conducted to verify the relationship between urbanization and urban-suburban interactions. Further, a geographically weighted regression (GWR) model is applied to estimate the urbanization potential of the suburban areas based on urban-suburban interactions. At last, the urbanization potential that considers and does not consider the urban-suburban interactions is integrated into the “pressure” indicator in two PSR models. By comparing the estimation results of the two models, the effects of urban-suburban interactions on ecological security are verified.
The structure of this study is organized as follows. Studies of urban-suburban interaction, suburban land transition, and ecological security assessment are reviewed in the literature review section, which is followed by the methodology description. Then the study area is introduced, and detailed analyses are offered in the results and analysis section. In the discussion section, the significance of considering urban-suburban interaction in urbanization and suburban ecological security assessment is emphasized, and the implications on land use management and planning are also provided. The final section concludes this study.

2. Literature Review

2.1. Urban-Suburban Interaction

Due to the spatial proximity of suburbs to the urban areas, there are varied flows between the two areas, which form the interactions between urban and suburban areas. As to the proven effects of urban-suburban interactions on regional socio-economic development and eco-environment, there are fruitful studies on quantifying the urban-suburban interaction. Conventional methods include census data utilization, questionnaire investigation, and model simulation. For example, Rae [20] applied UK census data in 2001 and adopted GIS software to implement people flow mapping, and further analyze the geographical patterns of residential mobility. Adepoju [21] investigated the information about rural–urban visits and remittance and analyzed the socio-economic links between urban and rural areas. Typical model simulations include the gravity and radiation models. Economic indices such as population, gross domestic product (GDP), and spatial distance are often used to estimate the city connection by the gravity model [22,23]. Different from the gravity model, the radiation model is a parameter-free model. It is applied to estimate the migration based on a distribution data of population [24], and to further simulate urban-suburban interactions [25]. The existing studies have usually focused on the urban-suburban relationship pattern; however, to what extent that the participants depend on the relationship is often neglected, which can be referenced to study respondent effects on social and economic development.
To fill the research gap, this study utilizes the symbiotic theory to quantify the urban-suburban interaction. The symbiotic theory was first applied in biology to study unlikely organisms that live together. Later on, the symbiotic theory was extended to urban studies to analyze the relationship between geographical entities such as urban and rural areas, urban agglomerations, industries, and communities and environments [26,27,28,29]. According to the benefit that the participant unit gains from the interaction, the symbiotic relationships can be classified into parasitism, commensalism, and mutualism. In detail, parasitism indicates that one unit is benefited while the other is harmed, commensalism means that one is advantaged while the other is not affected, and mutualism refers to the situation where both units benefit from the relationship [30]. Considering the ability of the symbiotic theory of quantifying the extent to which that participant units obtain benefits from the interaction, this study adopts the symbiotic theory to study the mutual relationship between urban and suburban areas.

2.2. Suburban Land Transition

Accompanied by urbanization, land transition is occurring at a rapid pace in the suburbs, notably the transition from ecological land to urban land. Such land transitions bring risks like ecological degradation, soil and water loss, cropland fragmentation, and environmental pollution [31,32,33]. Hence, studies on suburban land transition have garnered much attention. In developing countries like China, urban expansion simulation is essential to predict urban land distribution in future scenarios to make and adjust urban development plans to optimize construction land distribution, ensure food security, and protect the natural environment [34]. In this case, urbanization simulation is necessary, and the priority is to identify the correlative factors of urban land expansion. The most commonly used model to simulate urban expansion is the cellular automata (CA) model. In this model, it is crucial to analyze the correlates of land use urbanization and therefore the estimation of land urbanization potential can be conducted. The analyzed correlates usually include both socio-economic factors and spatial factors, such as population density, GDP, and distance to a water body, road, urban center, and town center [35,36,37,38]. However, the effect of urban-suburban interactions is usually neglected. Such interactions are formed based on human activities, and will eventually impact land use, which influences urban expansion. To fill the research gap, after quantifying urban-suburban interactions, this study applies a GWR model to verify the correlation between urban-suburban interaction and urban expansion, which is used to estimate the urbanization potential in the suburbs.

2.3. Suburban Ecological Security Assessment

The rapid process of urbanization and industrialization brings unprecedented social and economic development to cities all around the world. However, threats to the ecological environment come at the same time [39,40,41,42]. Upon realizing the seriousness of the ecological threats, the conception of sustainable development was systematically proposed by the United Nations conference on environment and development in 1992 to call for ecological protection. For decades, ecological protection has been one of the leading development tasks in most countries, and people’s attitudes have shifted from only seeking ecological benefit to implementing the coordinated benefit of society, economy, and ecology. As an arrangement plan to maintain and protect the ecological balance in a particular region based on understanding and evaluating the relationship between land use and human [43], ecological planning plays a vital role in protecting the regional ecological environment and promoting sustainable development. With the ability to evaluate ecological capacity, estimate development potential, and rate sustainability, ecological security assessment is one of the primary and fundamental stages of ecological planning.
Ecological security was first proposed by World Commission on Environment and Development in a report “Our Common Future”; then, the International Institute of Applied System Analysis elaborately defined it as a state in which human life, health and well-being, basic rights, sources of living security, necessary resources, social order, and human ability adapt to environmental changes are not threatened [44]. To quantificationally estimate the security status of the ecological environment, ecological security assessment has been applied by considering regional development characteristics and the interaction between natural, ecological, social, and economic factors [45]. Based on types of the evaluated objects, ecological security assessment can be conducted to comprehensively estimate a region’s ecological security status, such as a city’s situation [39,40], or to estimate the status of a single environmental system, such as cropland, waterbody, soil, and the atmospheric environment [46,47,48].
Urban expansion inevitably brings ecological risks to suburban areas, and there have been studies to discuss the effects of urbanization on ecological security. For example, Gong, et al. [49] simulated urban land distribution in the future and proved that urbanization is correlated with ecological landscape scatter and homogenous distribution. Xu, et al. [50] found that the expansion of artificial land mainly sacrificed natural ecological land and therefore generated adverse effects on ecosystem service values. Feng, et al. [51] applied a generalized additive model to analyze the driving forces of land ecological security, and they concluded that the dominant factors included distance to the city center, district center, and road networks. As a conclusion, they claimed that the ecological deterioration was driven by rapid urbanization.
Despite the fruitful studies on ecological security assessment by considering urbanization, the effects of urban-suburban interactions are insufficiently discussed. To verify the importance of considering urban-suburban interactions, this study adopts the PSR model, which is a commonly applied model to assess ecological security. The PSR framework was first introduced in the 1980s to analyze the environmental change in chains [52]. Later it was refined by the Food and Agriculture Organization of the United Nations (FAO), the United Nations Development Program (UNDP), the United Nations Environment Programs (UNEP), and the World Bank in 1995. In the framework, “pressure” denotes human social and economic activities that result in environmental change, “state” refers to the state of the environment, and “response” represents human actions responding to the state change of the environment. In this study, urbanization potential that considers urban-suburban interaction is integrated into the “pressure” indicator. As a comparison, an estimation that does not consider urban-suburban integration is also conducted. By analyzing the two estimation results, differences can be compared and studied, and the necessity of considering urban-suburban interactions can be verified.

3. Study Area and Data Collection

This study chooses Wuhan city, which is the capital city of Hubei Province, as the study area. By the end of 2018, the GDP of Hubei province was USD 594 billion, which ranked the seventh out of thirty-four provincial-level administrative regions of China. The GDP of Wuhan in 2018 was USD 224 billion, and it ranked ninth nationally. Wuhan has witnessed rapid urbanization in the past years. From 2008 to 2018, the population urbanization rate of Wuhan increased from 63.8% to 80.29%. According to city planning, it is composed of seven urban areas (Hanyang, Qiaokou, Jianghan, Jiang’an, Qingshan, and Wuchang) and six suburbs (Hannan, Caidian, Dongxihu, Huangpi, Xinzhou, Hongshan, and Jiangxia). The six suburban towns include 80 villages in total. The population urbanization rate of the main urban areas is almost 100%, and the land use type of the main urban area is dominated by urban land. Along with the on-going urbanization, urban expansion in suburban areas is apparent in Wuhan. Figure 1 shows the land use information of 2013 and 2016. It also shows that the urbanization process of Wuhan City is occurring rapidly, and the land-use transition is evident, occurring primarily at the urban area margins. In summary, Wuhan was chosen as the study area for two reasons: first, it is representative of cities with rapid urbanization and land transition. The urban expansion in suburban areas is noticeable. Second, there is spatial heterogeneity of the occurrence of urban expansion in different suburban areas, which can be referenced to verify the effects of urban-suburban interactions. Since land transition caused by urban expansion is proven to have negative effects on the natural environment and ecosystems, it is important to distinguish the urban expansion in suburban areas where there are close interactions with the city.
The map data were extracted from the land use database offered by the local land management office. The social and economic data were collected from the city statistical yearbook. The people flow data used to verify the simulated urban-rural interaction was from a questionnaire survey taken in Huangpi in 2016. A team of 30 people (including teachers and students) conducted the investigation, which mainly investigated the information on the daily activities of local people, including the activity type, frequency, origination, and destination. The whole investigation was conducted four times, lasted nearly two months, and covered all villages of Huangpi. The basic attributes of the respondents are shown in Table 1.

4. Methodologies

4.1. Quantification of Urban-Rural Interaction

Mutual advantage is one of the basic features of symbiosis. The main steps of identifying urban-suburban interaction are first, the socio-economic development levels of both the urban area and suburban villages are estimated; second, the correlation between urban and suburban areas needs to be verified to demonstrate their relationship; third, the extent to which suburban villages are interrelated with the urban area is calculated, and an index that reflects the mutualistic level can be estimated. To estimate the urban and suburban socio-economic development level, a comprehensive estimation is conducted. Referring to existing studies [53,54,55,56] and adjusting to the local situation, a series of social and economic indicators to reflect the regional development level was selected, as shown in Table 2.
Principal component analysis (PCA) is adopted to obtain a comprehensive estimation to avoid multicollinearity among the indicators.
Following estimation, a correlation analysis between urban and suburban socio-economic development levels needs to be conducted. Pearson’s r is utilized to measure the correlation. It is calculated as
r = i = 1 n ( x i x ¯ ) ( y i y ¯ ) i = 1 n ( x i x ¯ ) 2 i = 1 n ( y i y ¯ ) 2
where n is the number of samples, x i and y i are the sample values, and x ¯ and y ¯ are the mean values.
The symbiotic index (SI) is calculated by first defining Δ Z i j to show to what extent urban and suburban socio-economic development are related.
Δ Z r u = d Z r Z r d Z u Z u = Z u d Z r Z r d Z u , Δ Z u r = d Z u Z u d Z r Z r = Z r d Z u Z u d Z r
where Z is the comprehensive estimation of the socio-economic development of suburban village r and urban area j, d Z r is the change value of Z r during a period, and Δ Z r u reflects the change of Z r caused by the change in Z u .
Then, SI is calculated as
S I r u = | Δ Z r u | | Δ Z r u | + | Δ Z u r | , S I u r = | Δ Z u r | | Δ Z r u | + | Δ Z u r |
where S I r u + S I u r = 1 , S I r u refers to the interaction from the urban area to the suburban village, and S I u r denotes the connection from the suburban village to the urban area.
In an ideal mutual interaction situation of urban-suburban areas, the values of S I r u and S I u r are equal. Hence, we define that there is mutual interaction when the difference value of S I r u and S I u r is less than 0.4. The interaction index F r u is defined as follows:
F r u = 1 | S I r u S I u r |
where F r u reflects the mutual advantage level of both urban and suburban areas and is a positive indicator. All the values need to be standardized.
To verify the estimated urban-suburban interaction, first, the suburban-to-urban connection is quantified. Real people flow data based on the questionnaire survey in Huangpi.
The real suburban-to-urban connection is calculated as follows:
T r u = f = 1 4 w f n i j N i
where T i j is the quantified calculation based on the questionnaire investigation, n i j is the number of people that claimed they visited location j and N i is the total investigated people in location i. w f is the weight, which is decided based on the visiting frequency. The value of f ranges from 1 to 4, denoting that the visiting frequency changes from several times a week to several times a year, and the values are 0.533, 0.317, 0.094, and 0.056, respectively. A natural break method is then applied to classify the estimation result into three categories. Only the categories with the highest values are identified as having a strong suburban-to-urban connection.
To estimate the urban-to-suburban connection, public bus information from urban Wuhan to Huangpi villages is collected. The collected data cover one week to capture differences between weekdays and weekends. The urban-to-suburban connection is then calculated using the following formula:
T u r = f r v r f i v i
where f r v r refers to the total passenger volume from urban Wuhan to village r, and f i v i is the total passenger volume from urban Wuhan to Huangpi Town. Similarly, the natural break method is applied to classify the urban-to-suburban connection into weak, medium, and strong types. Together, real mutual interaction between urban and suburban areas can be determined only when both the suburban-to-urban connection based on people flow and the urban-to-suburban connection based on the public bus information are classified as strong. A crosstab table is built between the calculated interaction by the symbiotic theory and the real interaction by the investigation data (Table 3). When a mutual interaction is identified, the respondent value in the crosstab is set to 1; otherwise, it is 0.
A chi-square value χ 2 is calculated as follows.
χ 2 = ( O E ) 2 E
where O is the calculated urban-rural integration, and E is the real integration based on the investigation.

4.2. Relationship between Urban-Suburban Interaction and Suburban Land Transition

A GWR model is adopted to analyze the relationship between urban-suburban interaction and suburban urbanization. GWR is a widespread application based on ordinary least regression (OLS), which enables the estimation of local-specific coefficients [57], and therefore reflects spatial differentiation [31]. By adopting the GWR model, not only the relationship between urban-suburban interaction and suburban urbanization can be verified, but also the spatial urbanization potential can be estimated. The following equation expresses the traditional regression model:
Y i = β 0 + β 1 X i 1 + β 2 X i 2 + + β k X i k + ε i
where Y is the dependent variable; X 1 , X 2 , X 3 , , X k are the independent variables, and β 1 , β 2 , , β k are the coefficients.
GWR extends the traditional regression model so that parameters can be locally estimated:
Y i = β 0 ( u i , v i ) + k β k ( u i , v i ) x i k + ε i , ε i N ( 0 , σ 2 ) , C o v ( ε i , ε j ) = 0 ( i j )
where ( u i , v i ) is the spatial position of sample i, β 0 ( u i , v i ) is the intercept, and β k ( u i , v i ) represents the local regression coefficient of factor k at the i position.
Gaussian distance decay is applied to express the weight function:
w i ( u i , v i ) = exp [ ( d i j b ) 2 ] , i = 1 , 2 , , n
where w i ( u i , v i ) is the weight of i with spatial position ( u i , v i ) , d i j is the distance between the position ( u i , v i ) and ( u j , v j ) , and b is the kernel bandwidth. The selection of optimal bandwidth was decided based on minimizing the corrected Akaike Information Criterion (AIC) [58]:
A I C = 2 n ln ( σ ^ ) + n ln ( 2 π ) + n [ n + t r ( L ) n 2 t r ( L ) ]
where n is the number of samples, σ ^ is the standard deviation of the residuals, and t r ( L ) is the trace of the hat matrix.
To verify the relationship between urban-suburban interaction and suburban urbanization, the urbanization rate at the town level is calculated as the dependent variable. The calculation formula is as follows.
A t 1 + n = A t 1 ( 1 + r ) n
where A is the urbanized area; t 1 + n and t 1 represents the ending and starting year, respectively; and r is the urbanization rate. Referring to existing studies, in addition to urban-suburban interaction, population density, GDP, and distance to a water body, road, the urban center, and the town center are selected as independent variables. Then, GWR is applied to verify the correlations and estimate the urbanization potential at a town level.

4.3. Ecological Security Assessment Based on Integrating Urban-Rural Interactions

The PSR model reveals the interrelationship between humans and the ecological environment through the logic that humans generate pressure on the environment by social and economic activities, the respondent effects change the structure, pattern, and function of ecosystems and people give responses to solve the eco-environment issues in turn [59]. Therefore, ecological security can be estimated based on a comprehensive evaluation of the pressure, status, and response.
(1) The pressure indicators
Human activities are interrelated with the optimization of land use. Land use has been proven to have a significant impact on the extent and condition of ecosystems [60]. People aggregation, industry development, and infrastructure improvement raise a drastic land demand for construction, which forms a conflict between land-use utilization and eco-environment protection. From the perspective of ecological pressure, artificial lands like rural settlements, urban land, and other construction land are developed from natural land, and the potential ecological pressure includes resource consumption caused by the urban and rural construction, pollutant discharge brought by human activities, and ecological risk induced by the construction land expansion, such as heat island effects [61,62,63]. Hence, the land-use structure is an important indicator of ecological pressure.
Besides, urbanization potential, which is estimated based on the GWR model by considering urban-suburban interaction, is integrated into the PSR model as an indicator of ecological pressure. There is both direct and implicit pressure caused by the urbanization potential. On the one hand, a high urbanization potential, which is driven by strong urban-suburban interaction, represents constant flows of people and materials, and ecological risks can be generated from human activities such as transportation pollutants. On the other hand, a high urbanization potential indicates a high possibility of land transition in the future, and such land-use changes would exert pressure on local environments.
(2) The status indicators
The status indicators reflect the status of the eco-environment under pressure. In this study, the status indicators include ecosystem service value, ecological landscape pattern, and ecological landscape diversity. First, ecosystems play a vital role in human well-being by offering ecosystem services such as agricultural products, clean water and air, fertile soil, and recreational opportunities [64]. Ecosystem service value is an economic estimation of the varied ecosystem service, which reflects the status of the ecosystems from the perspective of productivity. In this study, the ecosystem service values are classified by referring to the value of ecological services per unit area of different terrestrial ecosystems in China [65]. Second, the ecological landscape is a direct reflection of ecological status under the human activity pressure. Under the background of urbanization and land resource limitation in China, intensive and economical use of land is encouraged, with aims to increase the efficiency of resource utilization and solve the problem of environmental pollution [66]. Referring to existing studies [67,68,69], indicators that represent the scale, aggregation level, and function of the ecological landscape are selected to obtain a comprehensive estimation of the intensity and aggregation of the ecological landscape. The indicators include area, largest patch index (LPI), density, aggregation, proximity index, and fractal dimension. Then, a PCA method is applied to obtain a comprehensive estimation. Besides, since ecological landscape diversity is an essence of biodiversity [70], it is included in the ecological status estimation.
(3) The response indicators
The response indicators include forbidden construction zones, which include prime cropland, national scenery, provincial touring sites and natural reserves, and other environmental protection areas according to the vectorized city planning results.
Together, a comprehensive evaluation system for ecological security is developed, as shown in Table 4.

5. Results and Analyses

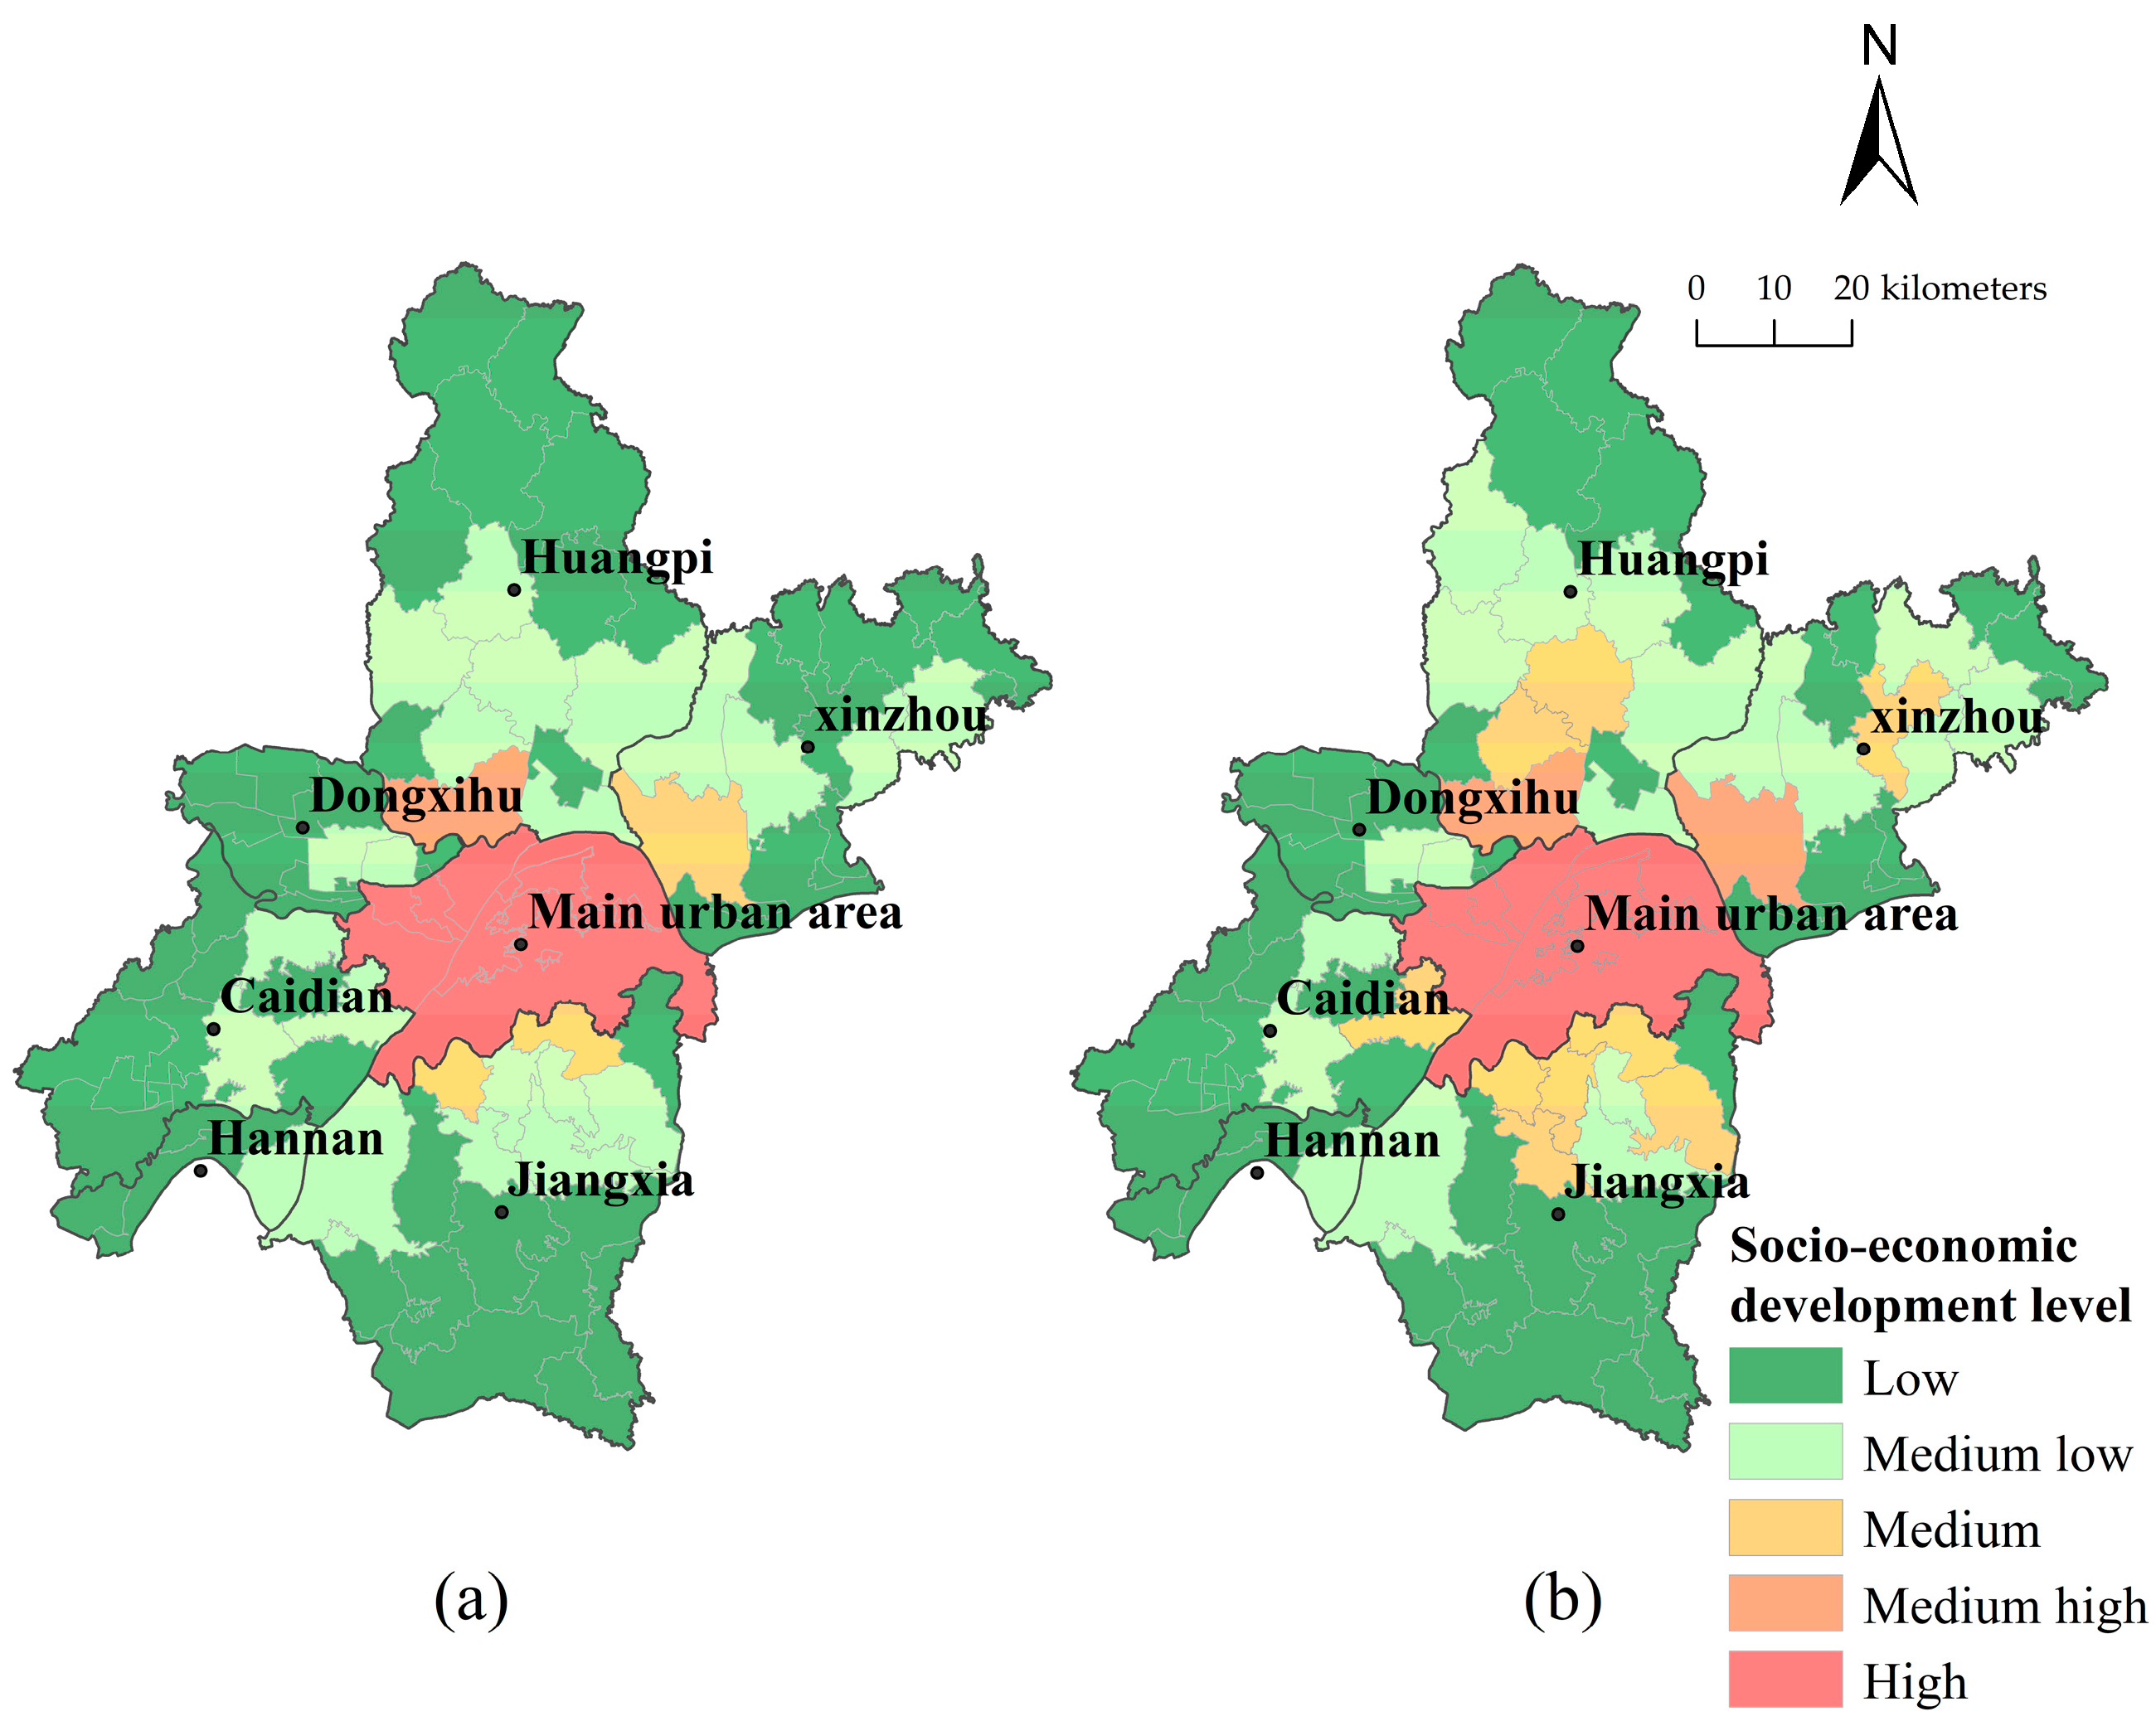
5.1. The Socio-Economic Evaluation of Wuhan City and Suburbs

The socio-economic development of Wuhan city and its suburban villages were estimated based on 14 social and economic indicators by applying the PCA models. Two principal components were extracted, and the eigenvalues of each component were 0.72 and 0.16, respectively. In detail, GDP, population, the ration of the secondary and tertiary industry output value, average personal annual income, population urbanization rate, employment rate, and non-agricultural employment rate have comparatively more significant loading coefficients, which were classified into the first principal component, and reflected the comprehensive development strength from Wuhan’s society and economy. The numbers of primary schools, junior high schools, hospitals, and public road length, road network density, and construction land per capita were classified into the second component. The classification showed that indicators like GDP and population affect regional development directly. Implicit indicators like school numbers and public road construction should also be considered. In some villages, the lack of public infrastructure such as schools and villages has a significant influence on the people’s quality of life [71]. Additionally, public road construction was related to local development, especially in suburban areas. By applying the natural break method, the socio-economic levels were classified into low, medium-low, medium, medium-high, and high categories. Figure 2 shows the estimation results of Wuhan city and its suburban village in 2016.
From the result, the main city area occupied the highest socio-economic development level in both years. Besides, areas with medium-high and medium development levels were mostly located close to the main city. Villages with the lowest development were far from the main urban area. The results indicated that most of the resources, including population, industry, and public infrastructure, were aggregated in the central city of Wuhan; therefore, it showed the highest development level. Additionally, suburban Wuhan is composed of 80 villages, and there showed heterogeneity in the village development levels regarding direct indicators like GDP and population and implicit indicators like public infrastructure. The general development levels of villages increased from 2013 to 2016, and there were no significant differences in the distribution of development patterns of the two years.
The correlation analysis result showed that each suburban village was correlated with the central city regarding their socio-economic development level changes, with all Pearson coefficients more than 0.95, and significant value less than 0.01. The result verified the correlation between the development of urban and suburban areas; however, the correlation analysis results cannot reveal to what extent the suburban village depends on the urban areas. Therefore, the symbiotic analysis was applied to quantify the urban-suburban interaction.

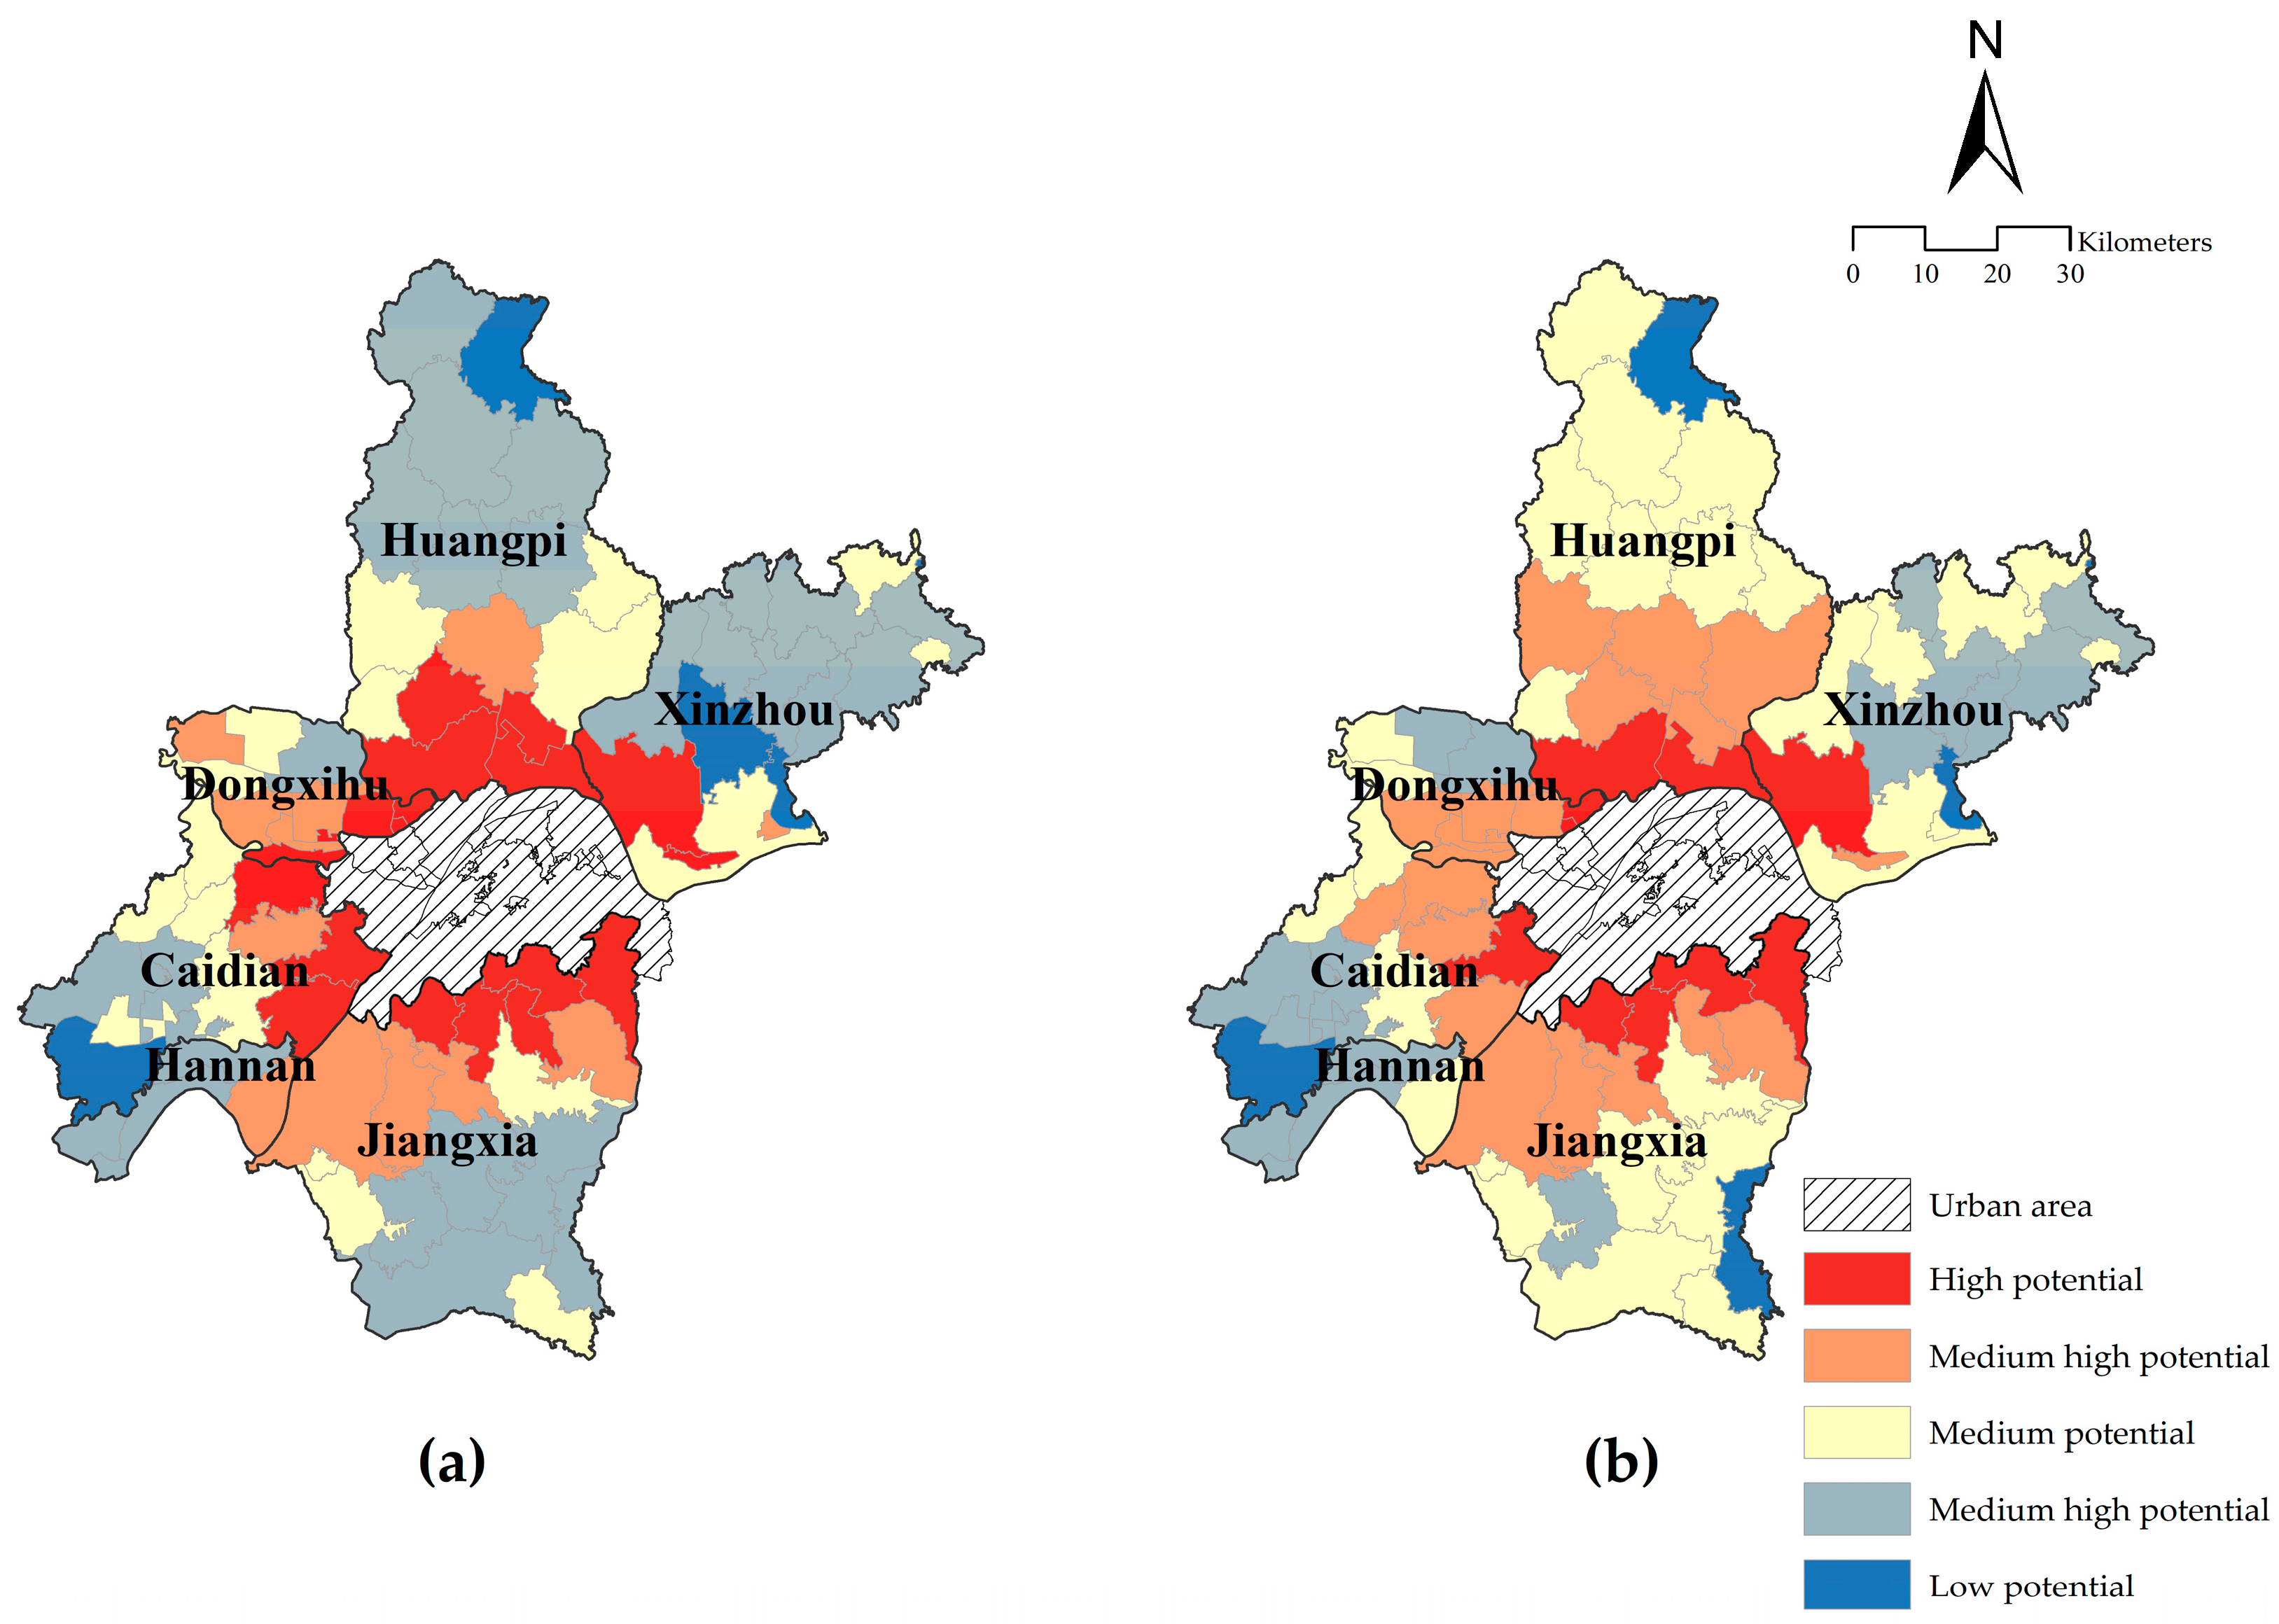
5.2. Urban-Suburban Interaction and Its Effect on Suburban Urbanization

By adopting the symbiotic analysis method, the interaction between the urban area and suburban village was calculated. The real urban-suburban interaction was estimated by the combined analysis of the suburban-to-urban connection based on the questionnaire survey and the urban-to-suburban connection based on the public bus investigation. A crosstab between the estimated and real urban-suburban interaction was developed, and a chi-square test was conducted. The result (x2 = 5.915, and significance = 0.015) indicates the accuracy of the estimation of urban-suburban interaction based on the symbiotic analysis method. From the analysis results, there was apparent heterogeneity in the interactions of every suburban village with urban Wuhan. Figure 3 shows the value distribution of urban-suburban interactions of villages in every town. From the figure, Hannan interacts most weakly with urban Wuhan, and Dongxihu and Caidian are also weakly connected with the urban area. On the contrary, Huangpi, Jiangxi, and Xinzhou have comparatively strong interactions with urban Wuhan.
To verify the correlation between urban-suburban interaction and suburban urbanization, the urbanization rate of every village from 2013 to 2016 was calculated by Formula (12). In the calculation, every village was assigned a number, and Table 5 shows the examples of the calculation.
To analyze the effects of urban-suburban interaction on suburban urbanization, a correlation analysis was conducted for the urbanization rate with quantified urban-rural interaction values. The result shows that a correlation does exist, with Pearson’s correlation as 0.291, and the significance as 0.009. The positive significance indicates that urban-rural interaction promotes suburban urbanization. To further verify the correlation, GWR was applied to analyze the correlation between urban-suburban interaction and urbanization rate in suburban villages, together with other factors including population density, GDP, and distance to water bodies, roads, the urban center, and the town center.
The comparison results are shown in Table 6.
From the results, the GWR that considers urban-suburban interaction explains more variance compared with the GWR that does not consider urban-suburban interaction, according to the R2 and adjusted values. Additionally, the AIC value performed better in the GWR that considers urban-suburban interaction. Figure 4 shows the estimation of urbanization potential at the village level by the GWR that does not consider and considers urban-suburban interaction.
From the estimation result that does not consider urban-suburban interaction, 5, 26, 18, 12, and 19 villages are identified as having low, medium-low, medium, medium-high, and high urbanization potential. By comparison, 5, 16, 28, 21, and 10 villages are identified as having low, medium-low, medium, medium-high, and high urbanization potential, respectively, for results that consider urban-suburban interactions. In the model that considers urban-suburban interaction, fewer villages are identified as having high urbanization potential; however, more villages are thought to have medium-high and medium possibilities compared with the results that do not consider the interaction. To conclude, both the models identify villages with high urbanization potential located around urban Wuhan, and the most significant difference is that the model that considers urban-suburban interaction has a better performance in recognizing villages with medium-high and medium urbanization potential.
People, material, and information flows are embedded in urban-suburban interactions. The urbanization in the suburbs can be classified into urban expansion and in-situ urbanization. The former type denotes that construction land expands upon the urban periphery; the latter means that the land use type transitions to urban land when the rural area develops to a high stage [72,73]. A strong urban-suburban interaction indicates a high potential for factory development, construction of residential settlements, and public infrastructure construction. The differences in urban-suburban interactions among villages result in heterogeneity in different urbanization potential at the village level. Even though urbanization brings benefits and opportunities for local development, ecological risks can be raised at the same time. Therefore, this study applies the PSR model to estimate ecological security status in the suburbs.

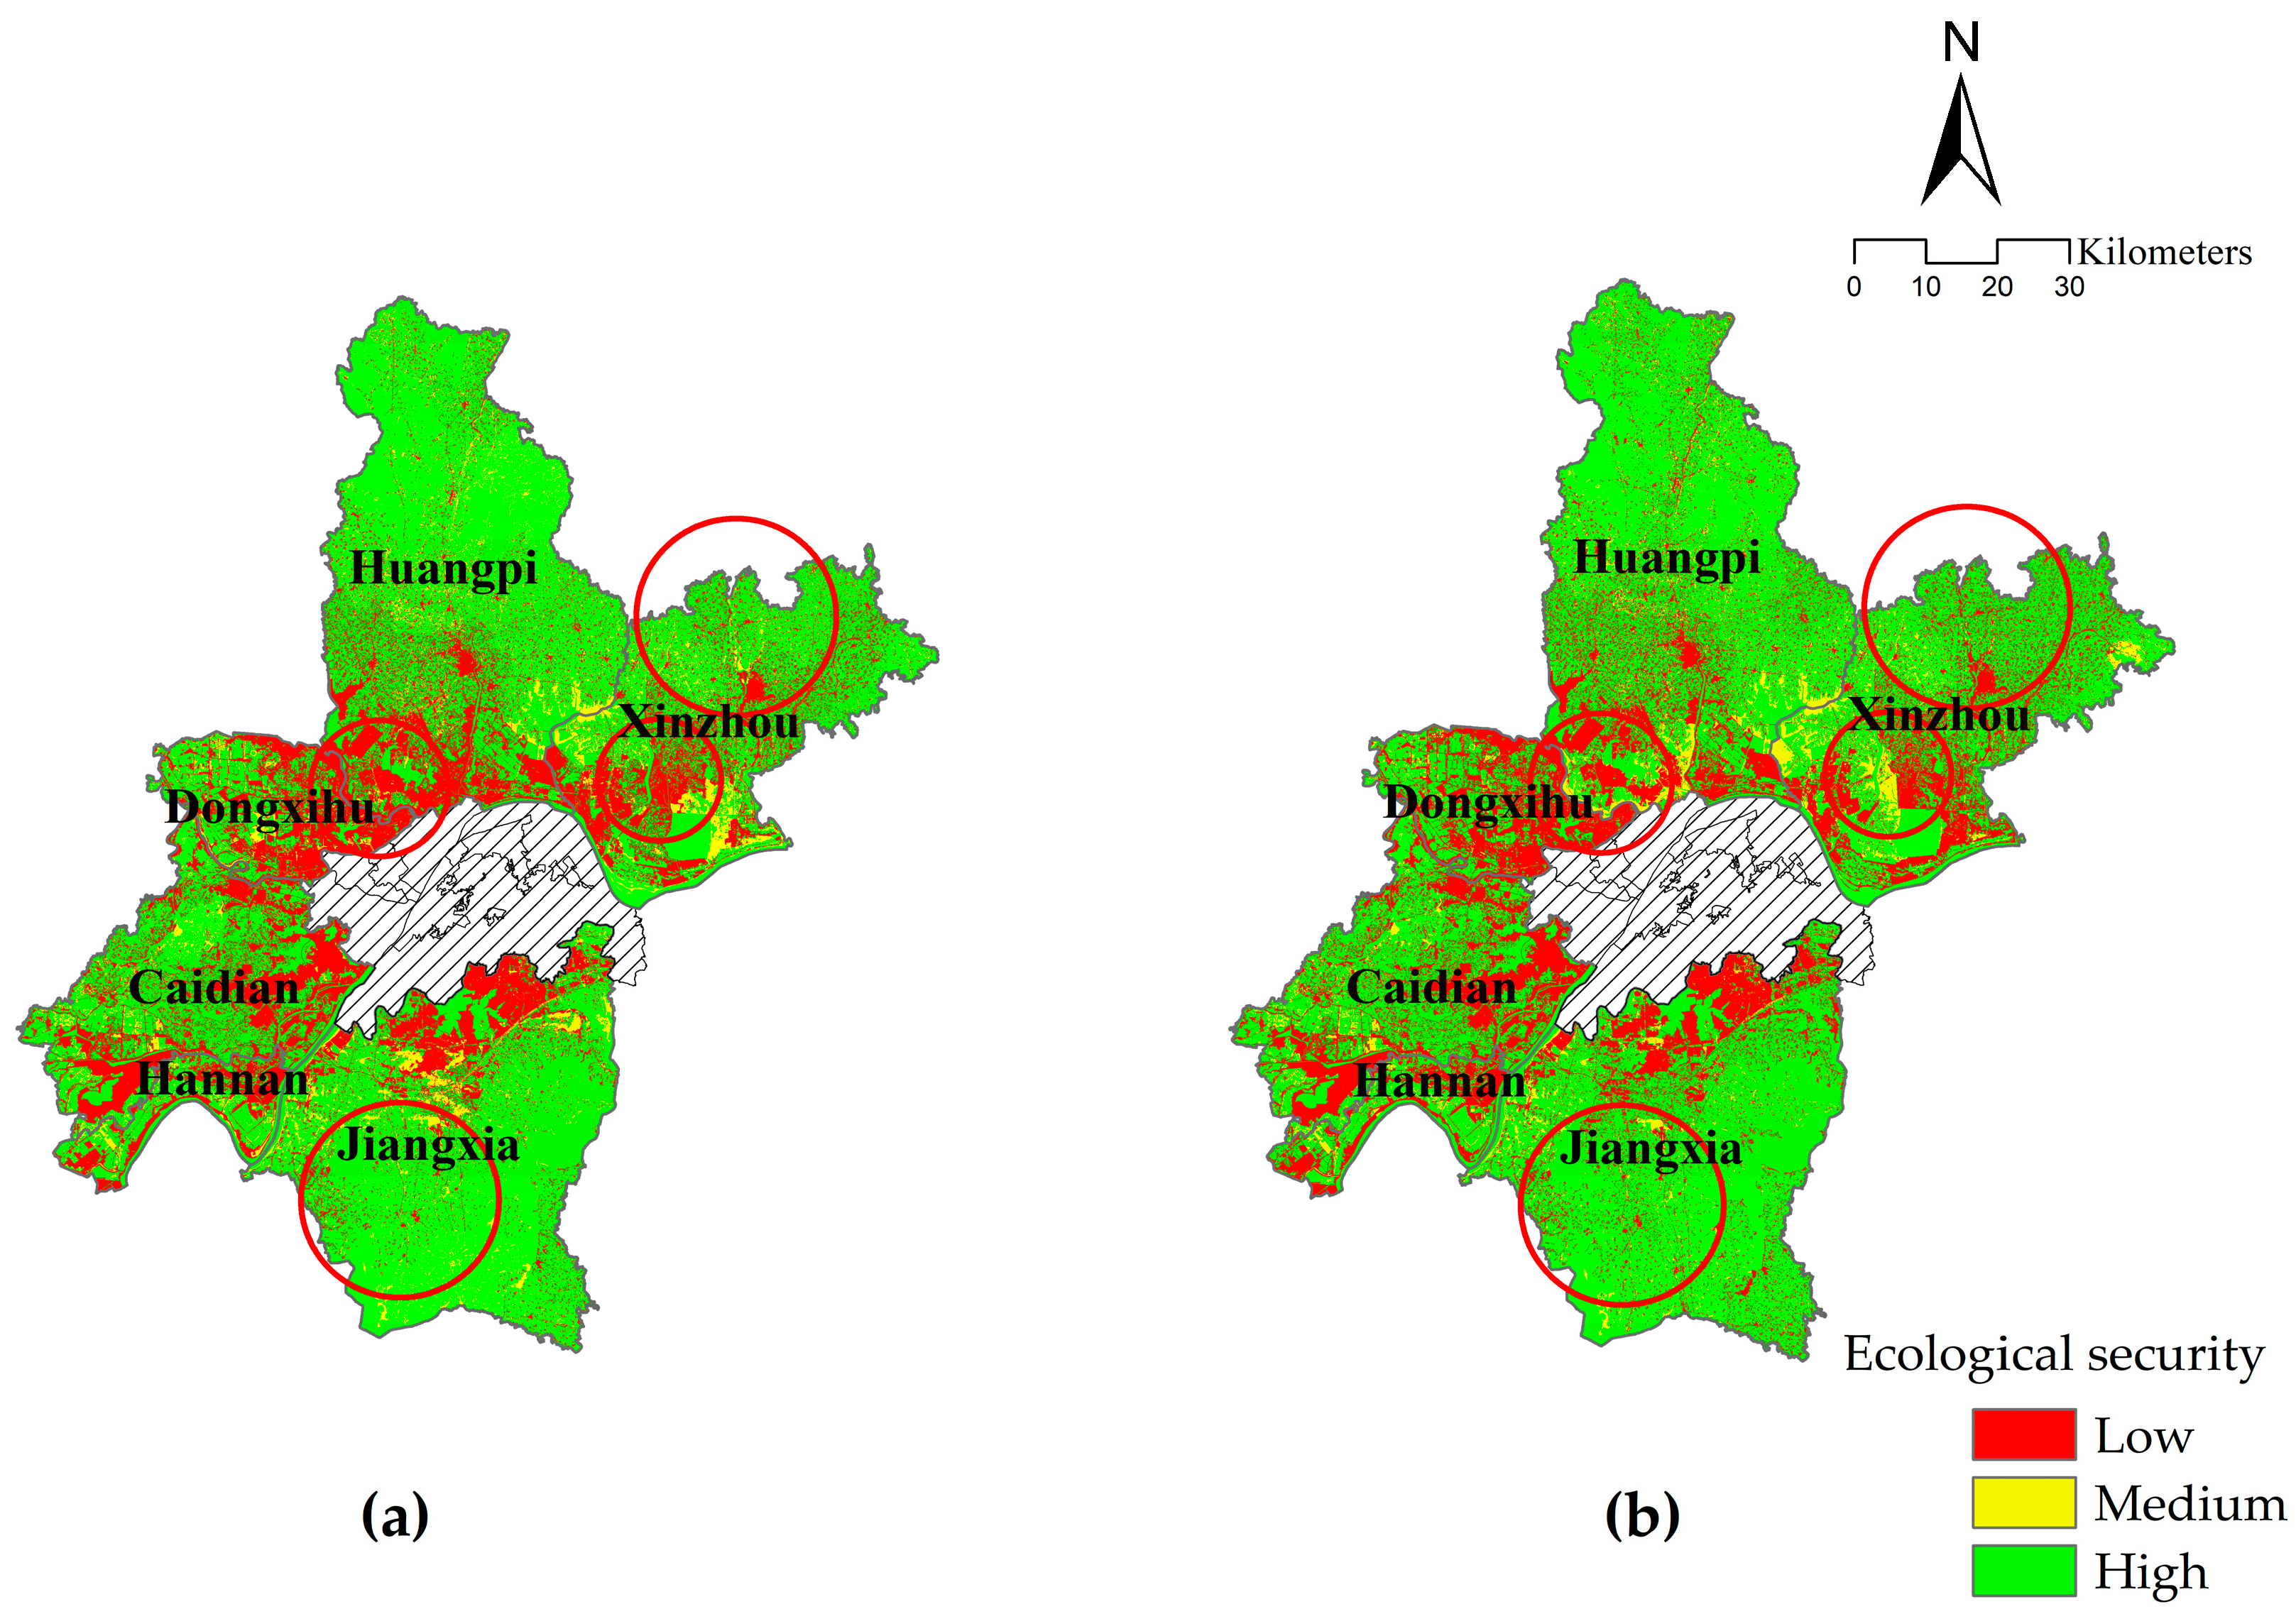
5.3. The Ecological Security Estimation by Considering Urban-Rural Interaction

Based on the aforementioned analysis results, the urban-suburban interaction was proved to relate to the suburban land transition. In the framework of ecological security assessment, the land transition, especially land urbanization, will exert pressure on suburban ecological environments. To estimate suburban ecological security, two PSR models are founded, of which urbanization potential is included as one factor of the “pressure” indicator. In one model, urbanization potential that considers urban-suburban interaction is integrated, and, as a comparison, urbanization potential that does not consider urban-suburban interaction is also combined in the PSR model. The comparison results are shown in Figure 5.
Table 7 shows the estimation results that both consider and do not consider the urban-suburban interaction.
From the results, both models were able to distinguish the high and medium-high risk suburbs based on the low ecological security area identification. Specifically, Dongxihu was estimated as the suburb with the highest ecological risk. As an economic and technological development zone of Wuhan, there is industrial aggregation in this area. According to the statistic yearbook of Dongxihu in 2016, the output of the secondary industry was 60%. The fast development and expansion of industrial construction land caused tense pressure on the eco-environment; therefore, the general ecological security level of this area was at a low level. The results also showed that the PSR model that considered the urban-suburban interaction identified more areas with low ecological security compared with the result that did not consider the interaction. As the industrial back-land of the city, Dongxihu has developed a close interaction with the city, like the labor force flow, product transportation, and money exchange. Such interactions not only accelerate the urbanization but also bring threats to the local ecological environment. The estimation that does not consider the urbanization potential, which is affected by the urban-suburban interaction, will fail to capture sufficient ecological pressure.
Similarly, Hannan and Caidian were identified as suburbs with medium ecological risk by both models, and the difference in the results was that the model that considered the urban-suburban interaction recognized more areas than the result of the model that did not consider the interaction.
Xinzhou, Huangpi, and Jiangxia were classified as suburbs with low ecological risk. However, there were significant differences in the estimation results. Specifically, the difference was most significant in the estimation of Jiangxia. Jiangxia is a large suburban district of Wuhan with a total area of 2018.36 km2 and it is composed of 20 administrative sub-towns. Due to the differences in the natural conditions, traffic location, and development base, the development levels of different villages were varied, and the dependence of each village on the urban-suburban interaction differed too. Compared with the two models, the model that considered the interaction identified more areas with low ecological security close to the central city, while the model that did not consider the interaction evaluated that remote areas had more risks.
The ecological pressure evaluation caused the differences in the estimation results, and the results show that the model that considers the urban-suburban interaction can figure out more areas with low ecological security. As the adjacent area of a city, the suburbs are facing drastic land-use transition caused by urbanization, and it is essential to balance the demand for construction land and the security of the eco-environment. Therefore, identifying the ecological security level by considering the characteristics of suburbs that have close interaction with the city is significantly necessary to guide future construction and to conduct ecological protection and remediation for environmentally-friendly sustainable development.

6. Discussion

6.1. The Quantification of Urban-Suburban Interaction and Its Correlation with Urbanization

The urban-suburban connection can be explained from the perspective of city flow, which refers to both direct flows, such people mobility, and implicit flows, such as telecommunication connections. Existing studies on urban-suburban interactions have focused on quantifying the connection based on selected indicators, such as population migration, mobility, and institutional linkage [74,75]. Generally, the dependence of both areas and the respondent results from such interactions are neglected. Suburbs are broad areas that surround the urban area. The differences in urban-suburban interactions will cause different effects. On the one hand, a strong urban-suburban interaction increases the opportunities for the social and economic development of suburbs; on the other hand, frequent human activities will generate pressure on the local natural environment. Therefore, quantification of the extent to which a suburb depends on urban-suburban interaction is necessary to analyze its effects on suburban development and the environment. By focusing on the results of interaction, the symbiotic theory was applied to quantify the urban-suburban interaction and the results showed that there was apparent differences in the connections between urban and suburban Wuhan.
After quantifying the urban-suburban interaction, this study utilized the GWR model to verify the correlation between urbanization and urban-suburban interaction. In existing studies, the analysis of the driving forces of urbanization usually include socio-economic factors like GDP, population, and spatial factors such as distance to the city center and road networks [76,77,78]. However, the characteristics of suburbs that are interrelated with the city are usually neglected. The interaction reflects the human activities between urban and suburban areas, and in essence, it reveals the land-use demands for construction land development. Under the background of on-going rapid urbanization, urban expansion in China is still occurring. The correlation between urbanization and urban-suburban interaction proves the necessity of considering such connections when studying urbanization and land transition in the suburbs.

6.2. Suburban Ecological Security Assessment Considering Urbanization Potential Based on Urban-Suburban Interaction

Ecological security assessment in the suburbs is an essential task of ecological protection in China. The urbanization rate of China in 2018 hit 59%, indicating that China still has a long way to go compared with developed countries with urbanization rates around 80%. Suburbs are the first areas that face urban expansion, and the respondent pressure can be categorized into three aspects. First, as the adjacent area of urban areas, it faces land use and landscape changes caused by land transition in urbanization. In detail, the transition from rural land into urban land is inevitable and irreversible. During this process, ecological land decreases simultaneously, and the ecological service function degenerates along with the land transition. Second, as the back-land of urban areas, suburbs offer necessary materials for city development, including agricultural and industrial products. In cities, many secondary industries are distributed in the suburbs to serve urban construction conveniently. The construction of industries not only requires a large number of land resources but also creates pollutants during production and transportation. Third, due to the high price of living in urban areas, some people choose to settle in the suburbs and therefore form a common phenomenon of commuting between the urban area and the suburbs. Such settlement choices increase the land-use change in the suburbs, and the accompanied infrastructure construction also aggravates the burden.
The particularity of suburbs that are interrelated with the city should be distinguished when estimating ecological security in the suburbs. The analysis results showed that the urban-suburban interaction has a positive effect on urbanization in the suburbs, indicating ecological threats along with urban development. “Pressure” is an essential part of the PSR model, which describes the pressure caused by humans’ social and economic activities. The difference in the estimation results that consider and do not consider urban-suburban interaction shows the necessity of integrating such interactions in assessments of suburban ecological security. Additionally, the security assessments can provide warnings about ecological risks in advance. For example, this study identified that Dongxihu has most areas identified with a low ecological security level. Dongxihu is a suburban area with a large aggregation of industries, which makes excellent contribution to the socio-economic development of Wuhan. From the perspective of resource optimization, two measures can be made to ensure the balance between industry development and eco-environment protection in the future. First, existing construction land in Dongxihu can be restructured to implement intensive and economical utilization, which can decrease the pressure on ecosystems. Second, construction land demands in Dongxihu can be satisfied by utilizing areas with low ecological risk in other towns such as Xinzhou, Huangpi, and Jiangxia.

6.3. Implications and Priority in Future Studies

By adopting a case study of the Wuhan suburbs, this study quantified urban-suburban interactions and verified the correlation between urban-suburban interactions on suburban urbanization. Then, this study integrated suburban urbanization potential based on urban-suburban interaction into the PSR model and assessed the ecological security of the Wuhan suburbs. Several implications regarding the urban-suburban interaction and the ecological security assessment are obtained as follows.
First, the urban-suburban interaction should be distinguished when studying the suburbs. The issues regarding suburbs are not limited to land transition and the ecological security assessment; topics such as ecosystem service value evaluation, ecological risk assessment, and ecological resilience [79,80,81] can, in the future, be integrate into the effects of urban-suburban interaction, to improve the feasibility and rationality of strategies related to suburban ecological protection.
Second, the urban-suburban interaction analysis can be applied for the prediction of construction land demand. Chinese cities still hold a significant demand for land resources to complement urbanization. To rationally solve the conflict between urbanization and limited land resources, it is vital to estimate the land demands for urban development. The urban-suburban interaction is estimated based on evaluating the flow strengths of people, materials, and information, which reflects the activeness of social and economic activities. A strong urban-suburban interaction indicates a high demand for construction land to ensure the activities. Hence, the consideration of urban-suburban interactions helps predict construction land demand, simulate construction land distribution, and optimize land use resources.
Third, a differentiated protection mechanism of suburban ecological security by considering urban-suburban interactions can be established. This study conducted the ecological security assessment at the village level, and the results showed a spatial heterogeneity in estimation results. Also, the comparison with the traditional PSR model, which does not consider the urban-suburban interaction, also showed the necessity of considering such interactions. Since village development varies, a differentiated protection mechanism should be built according to the assessment results. For example, villages where the airport and many industries are located need to protect the local ecology and environment from noise, pollution, and traffic dispersion while satisfying their land-use demands. In this case, ecological security assessment can be applied as a guideline to find suitable places for construction land development. For villages featuring rural tourism and cropland planting, construction activities should strictly comply with the ecological function zoning. In this case, ecological security assessment can be adopted as an indicator of a ecological carrying capacity evaluation. Therefore, in practical application, the village’s development base and goals need to be considered together to build a practical and feasible ecological protection plan.
Several limitations need to solved in future studies. First, the quantification of urban-suburban interactions can be elaborated from more aspects. In this study, only social-economic interactions are considered; other connections such as social capital, cargo movement, and telecommunications can be combined in future studies. Second, this study demonstrated the relationship between urban-suburban interactions and suburban urbanization at the village level. The specific location of urbanization can be identified in the following studies by adopting spatial simulation models like CA. Therefore, the ecological risk prediction can be detailed too. Third, the ecological security assessment system can be improved. The main thought of this study is to verify the correlation between urban-suburban interactions with suburban ecological pressure, and further to compare the results of ecological security assessments considering and not considering such interactions. Hence, the built PSR system was straightforward, and an improved model can be built in the future. Forth, this study mainly focused on the ecological security of the suburbs. In fact, the urban-suburban interaction also has effects on the urban areas; such effects can be analyzed in future studies.

7. Conclusions

This study adopted the symbiotic theory to quantify the interaction between urban and suburban areas. Specifically, the socio-economic development levels of both urban and rural areas were estimated, and by referring to the correlation between the development levels, the interaction strengths were identified. The utilization of the symbiotic theory is not limited to socio-economic statistical data. In some cases where there is a lack of statistical data, questionnaire investigations of residents’ daily travel, telephone communication, and model simulation such as the gravity model can be utilized to develop connections between the urban and suburban areas, and then the symbiotic analysis can be conducted to analyze the interaction pattern.
This study demonstrates the correlation between urbanization potential and urban-suburban interaction. Urbanization predictions, especially urban expansion, have raised much attention for its importance in land resource optimization and ecological protection. The urban-suburban interaction can be integrated as an indicator to predict the urbanization level and to simulate the distribution of urban construction land. For example, in a CA model that simulates urban construction land distribution, the urban-suburban interaction can be referenced to develop the transition rules of the cells.
Additionally, this study integrates urbanization potential based on considering urban-suburban interaction into the PSR model to estimate suburban ecological security. By comparing the estimation results that considered and did not consider the urban-suburban interaction, this study verified the necessity of considering such interactions in a suburban ecological security assessment. With ecological security assessment results, a balance between suburban construction and eco-environment protection in the future construction can be ensured.
The spatial proximity of suburbs to the city makes suburbs easily affected by urban development and expansion. The analysis results of this study verify the significance of considering urban-suburban interaction to distinguish the effects of urban expansion on suburbs. The results of this study can provide comprehensive and targeted support for suburban land construction land management and ecological protection for other regions with rapid urbanization.

Author Contributions

Conceptualization, methodology, validation, formal analysis, investigation, resources, data curation, writing-original draft preparation, funding acquisition, Y.T., Writing-review and editing, supervision, L.W. All authors have read and agreed to the published version of the manuscript.

Funding

This research was funded by the National Natural Science Foundation of China, grant number 41901203 and the China Postdoctoral Science Foundation, grant number 2019M661919.

Conflicts of Interest

The authors declare no conflict of interest.

References

  1. Hemakumara, G.; Rainis, R. Geo-statistical modeling to evaluate the socio-economic impacts of households in the context of low-lying areas conversion in Colombo metropolitan region-Sri Lanka. AIP Conf. Proc. 2015, 1643, 438–445. [Google Scholar]
  2. Sheridan, C.S.; Dolney, T.J. Heat, Mortality, and Level of Urbanization: Measuring Vulnerability across Ohio, USA. Clim. Res. 2003, 24, 255–265. [Google Scholar] [CrossRef] [Green Version]
  3. Clawson, M. Suburban Land Conversion in the United States: An Economic and Governmental Process; RFF Press: Washington, DC, USA, 2013. [Google Scholar]
  4. Tang, S.; Hao, P.; Huang, X. Land Conversion and Urban Settlement Intentions of the Rural Population in China: A Case Study of Suburban Nanjing. Habitat Int. 2016, 51, 149–158. [Google Scholar] [CrossRef]
  5. Ferronato, B.O.; Roe, J.H.; Georges, A. Urban Hazards: Spatial Ecology and Survivorship of a Turtle in an Expanding Suburban Environment. Urban Ecosyst. 2016, 19, 415–428. [Google Scholar] [CrossRef]
  6. Yin, J.; Yin, Z.; Zhong, H.; Xu, S.; Hu, X.; Wang, J.; Wu, J. Monitoring Urban Expansion and Land Use/Land Cover Changes of Shanghai Metropolitan Area during the Transitional Economy (1979–2009) in China. Environ. Monit. Assess. 2011, 177, 609–621. [Google Scholar] [CrossRef] [PubMed]
  7. Sharma, R.; Ghosh, A.; Joshi, P.K. Spatio-Temporal Footprints of Urbanisation in Surat, the Diamond City of India (1990–2009). Environ. Monit. Assess. 2013, 185, 3313–3325. [Google Scholar] [CrossRef]
  8. Odindi, J.; Mhangara, P.; Kakembo, V. Remote Sensing Land-Cover Change in Port Elizabeth During South Africa’s Democratic Transition. S. Afr. J. Sci. 2012, 108, 60–66. [Google Scholar] [CrossRef]
  9. Salvati, L.; Ferrara, C.; Ranalli, F. Changes at the Fringe: Soil Quality and Environmental Vulnerability During Intense Urban Expansion. Eurasian Soil Sci. 2014, 47, 1069–1075. [Google Scholar] [CrossRef]
  10. Eda, U.; Williams, B. Determinants of Urban Expansion and Agricultural Land Conversion in 25 Eu Countries. Environ. Manag. 2017, 60, 717–746. [Google Scholar]
  11. Nagy, R.; Chelsea, B.; Lockaby, G. Urbanization in the Southeastern United States: Socioeconomic Forces and Ecological Responses Along an Urban-Rural Gradient. Urban Ecosyst. 2011, 14, 71–86. [Google Scholar] [CrossRef]
  12. Brown, D.; Kenneth, G.; Johnson, M.; Loveland, T.R.; Theobald, D.M. Rural Land-Use Trends in the Conterminous United States, 1950–2000. Ecol. Appl. 2005, 15, 1851–1863. [Google Scholar] [CrossRef] [Green Version]
  13. Michael, B.; Besussi, E.; Chin, N. Traffic, Urban Growth and Suburban Sprawl; Centre for Advanced Spatial Analysis, University College London: London, UK, 2003. [Google Scholar]
  14. Xie, H.; He, Y.; Xie, X. Exploring the Factors Influencing Ecological Land Change for China’s Beijing–Tianjin–Hebei Region Using Big Data. J. Clean. Prod. 2017, 142, 677–687. [Google Scholar] [CrossRef]
  15. Song, W.; Deng, X.; Yuan, Y.; Wang, Z.; Li, Z. Impacts of Land-Use Change on Valued Ecosystem Service in Rapidly Urbanized North China Plain. Ecol. Model. 2015, 318, 245–253. [Google Scholar] [CrossRef]
  16. Parnell, S.; Schewenius, M.; Sendstad, M.; Seto, K.C.; Wilkinson, C. Urbanization, Biodiversity and Ecosystem Services: Challenges and Opportunities; Springer: Dordrecht, The Netherlads, 2013. [Google Scholar]
  17. Muhammad, S.; Sbia, R.; Hamdi, H.; Ozturk, I. Economic Growth, Electricity Consumption, Urbanization and Environmental Degradation Relationship in United Arab Emirates. Ecol. Indic. 2014, 45, 622–631. [Google Scholar]
  18. Sun, J.; Li, Y.P.; Gao, P.P.; Xia, B.C. A Mamdani Fuzzy Inference Approach for Assessing Ecological Security in the Pearl River Delta Urban Agglomeration, China. Ecol. Indic. 2018, 94, 386–396. [Google Scholar] [CrossRef]
  19. Jiang, C.-H.; Li, G. Study About Ecological Security Assessment of Beijing Valley Region Based on Psr Model—A Case Study of Puwa Valley Region in Fangshan District. In Proceedings of the IOP Conference Series: Earth and Environmental Science, Shanghai, China, 14–16 March 2019. [Google Scholar]
  20. Alasdair, R. From Spatial Interaction Data to Spatial Interaction Information? Geovisualisation and Spatial Structures of Migration from the 2001 UK Census. Comput. Environ. Urban Syst. 2009, 33, 161–178. [Google Scholar]
  21. Aderanti, A. Rural–Urban Socio-Economic Links: The Example of Migrants in South-West Nigeria. In Modern Migrations in Western Africa; Routledge: Abingdon, UK, 2018; pp. 127–137. [Google Scholar]
  22. Gu, C.; Pang, H. Study on Spatial Relations of Chinese Urban System: Gravity Model Approach. Geogr. Res. 2008, 1, 1–12. [Google Scholar]
  23. Camagni, R.; Capello, R. The City Network Paradigm: Theory and Empirical Evidence. In Urban Dynamics and Growth: Advances in Urban Economics; Emerald Group Publishing Limited: Bradford, UK, 2005; pp. 495–529. [Google Scholar]
  24. Simini, F.; González, M.C.; Maritan, A.; Barabási, A.L. A Universal Model for Mobility and Migration Patterns. Nature 2012, 484, 96. [Google Scholar] [CrossRef]
  25. Hou, H.; Liu, Y.; Liu, Y.; Wei, X.; He, Q.; He, Q. Using Inter-Town Network Analysis in City System Planning: A Case Study of Hubei Province in China. Habitat Int. 2015, 49, 454–465. [Google Scholar] [CrossRef]
  26. Ma, G.; Wang, H. Synergetic Development of Tourism Industry in Lanzhou-Xining Urban Agglomeration Based on Symbiosis Theory. Urban Probl. 2018, 4, 10. [Google Scholar]
  27. Li, S.; Leng, H.; Yuan, Q. A Symbiotic Development Strategy for Farm Areas and Townships in Heilongjiang, China. Int. Rev. Spat. Plan. Sustain. Dev. 2019, 7, 66–82. [Google Scholar]
  28. Chertow, M.R. Uncovering Industrial Symbiosis. J. Ind. Ecol. 2007, 11, 11–30. [Google Scholar] [CrossRef]
  29. Zhu, Y.-G.; Reid, B.J.; Meharg, A.A.; Banwart, S.A.; Fu, B. Optimizing Peri-Urban Ecosystems (Pure) to Re-Couple Urban-Rural Symbiosis. Sci. Total Environ. 2017, 586, 1085–1090. [Google Scholar] [CrossRef] [PubMed]
  30. Li, J.; Young, M.N.; Tang, G. The Development of Entrepreneurship in Chinese Communities: An Organizational Symbiosis Perspective. Asia Pac. J. Manag. 2012, 29, 367–385. [Google Scholar] [CrossRef]
  31. Li, H.; Peng, J.; Liu, Y.; Hu, Y. Urbanization Impact on Landscape Patterns in Beijing City, China: A Spatial Heterogeneity Perspective. Ecol. Indic. 2017, 82, 50–60. [Google Scholar] [CrossRef]
  32. Syed, J.; Abbas, T.; Luo, F.; Ye, R.; Younas, H.; Hu, X.; Chen, L. The Extent of Heavy Metal Pollution and Their Potential Health Risk in Topsoils of the Massively Urbanized District of Shanghai. Arch. Environ. Contam. Toxicol. 2017, 73, 362–376. [Google Scholar]
  33. Wu, Q.; Zhang, X.; Xu, Y.; Li, T. Dualities of Semi-Urbanization Villages in Social-Spatial Transition: A Case Study of Zhoucun Village in Suburban Nanjing, China. J. Rural Stud. 2016, 47, 657–664. [Google Scholar] [CrossRef]
  34. Zhang, H.; Jin, X.; Wang, L.; Zhou, Y.; Shu, B. Multi-Agent Based Modeling of Spatiotemporal Dynamical Urban Growth in Developing Countries: Simulating Future Scenarios of Lianyungang City, China. Stoch. Environ. Res. Risk Assess. 2015, 29, 63–78. [Google Scholar] [CrossRef]
  35. Yang, J.; Guo, A.; Li, Y.; Zhang, Y.; Li, X. Simulation of Landscape Spatial Layout Evolution in Rural-Urban Fringe Areas: A Case Study of Ganjingzi District. Gisci. Remote Sens. 2019, 56, 388–405. [Google Scholar] [CrossRef]
  36. Moghadam, H.S.; Helbich, M. Spatiotemporal Urbanization Processes in the Megacity of Mumbai, India: A Markov Chains-Cellular Automata Urban Growth Model. Appl. Geogr. 2013, 40, 140–149. [Google Scholar] [CrossRef]
  37. Puertas, O.L.; Henríquez, C.; Meza, F.J. Assessing Spatial Dynamics of Urban Growth Using an Integrated Land Use Model. Application in Santiago Metropolitan Area, 2010–2045. Land Use Policy 2014, 38, 415–425. [Google Scholar] [CrossRef]
  38. Shu, B.; Zhang, H.; Li, Y.; Qu, Y.; Chen, L. Spatiotemporal Variation Analysis of Driving Forces of Urban Land Spatial Expansion Using Logistic Regression: A Case Study of Port Towns in Taicang City, China. Habitat Int. 2014, 43, 181–190. [Google Scholar] [CrossRef]
  39. Gong, C.; Chen, J.; Yu, S. Spatiotemporal Dynamics of Urban Forest Conversion through Model Urbanization in Shenzhen, China. Int. J. Remote Sens. 2011, 32, 9071–9092. [Google Scholar] [CrossRef]
  40. Le, H.; Noel, H. Man-Made Deserts: Desertization Processes and Threats. Arid Land Res. Manag. 2002, 16, 1–36. [Google Scholar]
  41. Lee, S.Y.; Dunn, R.J.K.; Young, R.A.; Connolly, R.M.; Dale, P.E.R.; Dehayr, R.; Lemckert, C.J.; McKinnon, S.; Powell, B.; Teasdale, P.R. Impact of Urbanization on Coastal Wetland Structure and Function. Austral Ecol. 2006, 31, 149–163. [Google Scholar] [CrossRef]
  42. Paukert, C.P.; Kristen, L.P.; Joanna, B.W.; Julian, D.O. Development and Assessment of a Landscape-Scale Ecological Threat Index for the Lower Colorado River Basin. Ecol. Indic. 2011, 11, 304–310. [Google Scholar] [CrossRef]
  43. Forster, N. Ecological Planning: A Historical and Comparative Synthesis; JHU Press: Baltimore, ML, USA, 2002. [Google Scholar]
  44. Zhao, Z.; Tao, X. Notice of Retraction an Application of Fuzzy Matter-Element Theory in Land Ecological Safety Evaluation. In Proceedings of the 2010 3rd International Conference on Computer Science and Information Technology, Chengdu, China, 16–18 November 2010. [Google Scholar]
  45. Bao, W.; Xu, Z.; Liu, P. Research Progressof Ecological Security Assessment in China. J. Guangdong Agric. Sci. 2015, 11, 135–140. [Google Scholar]
  46. Liu, F.; Wang, S. Ecological Safety Evaluation of Land Use in Ji’an City Based on the Principal Component Analysis. Asian Agric. Res. 2010, 2, 49. [Google Scholar]
  47. Liu, Q.; Wang, M.; Wang, X.; Shen, F.; Jin, J. Land Eco-Security Assessment Based on the Multi-Dimensional Connection Cloud Model. Sustainability 2018, 10, 2096. [Google Scholar] [CrossRef] [Green Version]
  48. Yu, F.; Li, X.B.; Wang, H.; Yu, H.J. Land Use Change and Eco-Security Assessment of Huangfuchuan Watershed. Acta Geogr. Sin. 2006, 61, 645–653. [Google Scholar]
  49. Gong, J.-Z.; Liu, Y.; Xia, B.; Zhao, G. Urban Ecological Security Assessment and Forecasting, based on a Cellular Automata Model: A Case Study of Guangzhou, China. Ecol. Model. 2009, 220, 3612–3620. [Google Scholar] [CrossRef]
  50. Xu, C.; Pu, L.; Zhu, M.; Li, J.; Chen, X.; Wang, X.; Xie, X. Ecological Security and Ecosystem Services in Response to Land Use Change in the Coastal Area of Jiangsu, China. Sustainability 2016, 8, 816. [Google Scholar] [CrossRef] [Green Version]
  51. Feng, Y.; Yang, Q.; Tong, X.; Chen, L. Evaluating Land Ecological Security and Examining Its Relationships with Driving Factors Using Gis and Generalized Additive Model. Sci. Total Environ. 2018, 633, 1469–1479. [Google Scholar] [CrossRef] [PubMed]
  52. Geniaux, G. Sustainable Development Indicator Frameworks and Initiatives; Seamless: New York, NY, USA, 2009. [Google Scholar]
  53. Bai, Y.; Deng, X.; Jiang, S.; Zhang, Q.; Wang, Z. Exploring the Relationship between Urbanization and Urban Eco-Efficiency: Evidence from Prefecture-Level Cities in China. J. Clean. Prod. 2018, 195, 1487–1496. [Google Scholar] [CrossRef]
  54. Chen, M.; Lu, D.; Zha, L. The Comprehensive Evaluation of China’s Urbanization and Effects on Resources and Environment. J. Geogr. Sci. 2010, 20, 17–30. [Google Scholar] [CrossRef]
  55. Thye, W.W. Chinese Economic Growth: Sources and Prospects; Department of Economics, University of California: Davis, CA, USA, 1996. [Google Scholar]
  56. Shen, J. Estimating Urbanization Levels in Chinese Provinces in 1982–2000. Int. Stat. Rev. 2006, 74, 89–107. [Google Scholar] [CrossRef]
  57. Su, S.; Xiao, R.; Zhang, Y. Multi-Scale Analysis of Spatially Varying Relationships between Agricultural Landscape Patterns and Urbanization Using Geographically Weighted Regression. Appl. Geogr. 2012, 32, 360–375. [Google Scholar] [CrossRef]
  58. Charlton, M.; Fotheringham, S.; Brunsdon, C. Geographically Weighted Regression. In White Paper National Centre for Geocomputation; National University of Ireland Maynooth: Maynooth, Ireland, 2009. [Google Scholar]
  59. Han, B.; Liu, H.; Wang, R. Urban Ecological Security Assessment for Cities in the Beijing–Tianjin–Hebei Metropolitan Region Based on Fuzzy and Entropy Methods. Ecol. Model. 2015, 318, 217–225. [Google Scholar] [CrossRef]
  60. Drummond, M.A.; Thomas, R.L. Land-Use Pressure and a Transition to Forest-Cover Loss in the Eastern United States. BioScience 2010, 60, 286–298. [Google Scholar] [CrossRef]
  61. Song, W.; Pijanowski, B.C.; Tayyebi, A. Urban Expansion and Its Consumption of High-Quality Farmland in Beijing, China. Ecol. Indic. 2015, 54, 60–70. [Google Scholar] [CrossRef]
  62. Narain, V.; Khan, M.S.A.; Sada, R.; Singh, S.; Prakash, A. Urbanization, Peri-Urban Water (in) Security and Human Well-Being: A Perspective from Four South Asian Cities. Water Int. 2013, 38, 930–940. [Google Scholar] [CrossRef]
  63. Lemonsu, A.; Viguie, V.; Daniel, M.; Masson, V. Vulnerability to Heat Waves: Impact of Urban Expansion Scenarios on Urban Heat Island and Heat Stress in Paris (France). Urban Clim. 2015, 14, 586–605. [Google Scholar] [CrossRef]
  64. Sutton, P.C.; Anderson, S.J.; Costanza, R.; Kubiszewski, I. The Ecological Economics of Land Degradation: Impacts on Ecosystem Service Values. Ecol. Econ. 2016, 129, 182–192. [Google Scholar] [CrossRef]
  65. Cao, S.; Liu, Y.; Su, W.; Zheng, X.; Yu, Z. Net Valuation of Terrestrial Ecosystem Services in China. Sci. Sin. Terrae 2018, 48, 331–339. [Google Scholar]
  66. Long, H. Land Consolidation: An Indispensable Way of Spatial Restructuring in Rural China. J. Geogr. Sci. 2014, 24, 211–225. [Google Scholar] [CrossRef]
  67. Dewan, A.M.; Yamaguchi, Y.; Rahman, M.Z. Dynamics of Land Use/Cover Changes and the Analysis of Landscape Fragmentation in Dhaka Metropolitan, Bangladesh. GeoJournal 2012, 77, 315–330. [Google Scholar] [CrossRef]
  68. Ramachandra, T.V.; Aithal, B.H.; Sreekantha, S. Spatial Metrics Based Landscape Structure and Dynamics Assessment for an Emerging Indian Megalopolis. Facilities 2012, 1, 48–57. [Google Scholar]
  69. Liu, P.; Jia, S.; Han, R.; Zhang, H. Landscape Pattern and Ecological Security Assessment and Prediction Using Remote Sensing Approach. J. Sens. 2018, 2018, 1–14. [Google Scholar] [CrossRef] [Green Version]
  70. Hou, W.; Walz, U. Enhanced Analysis of Landscape Structure: Inclusion of Transition Zones and Small-Scale Landscape Elements. Ecol. Indic. 2013, 31, 15–24. [Google Scholar] [CrossRef]
  71. Tian, Y.; Liu, Y.; Liu, X.; Kong, X.; Liu, G. Restructuring Rural Settlements Based on Subjective Well-Being (Swb): A Case Study in Hubei Province, Central China. Land Use Policy 2017, 63, 255–265. [Google Scholar] [CrossRef]
  72. Zhu, Y. In situ Urbanization in Rural China: Case Studies from Fujian Province. Dev. Chang. 2000, 31, 413–434. [Google Scholar] [CrossRef]
  73. Zhou, T.; Jiang, G.; Zhang, R.; Zheng, Q.; Ma, W.; Zhao, Q.; Li, Y. Addressing the Rural in Situ Urbanization (Risu) in the Beijing–Tianjin–Hebei Region: Spatio-Temporal Pattern and Driving Mechanism. Cities 2018, 75, 59–71. [Google Scholar] [CrossRef]
  74. Agergaard, J.; Ortenbjerg, S.B. Urban Transformations and Rural-City Connections in Africa. Dan. J. Geogr. 2017, 117, 63–67. [Google Scholar] [CrossRef] [Green Version]
  75. Iaquinta, D.L.; Drescher, A.W. Defining the Peri-Urban: Rural-Urban Linkages and Institutional Connections. Land Reform 2000, 2, 8–27. [Google Scholar]
  76. Wu, K.; Zhang, H. Land Use Dynamics, Built-up Land Expansion Patterns, Driving Forces Analysis of the Fast-Growing Hangzhou Metropolitan Area, Eastern China (1978–2008). Appl. Geogr. 2012, 34, 137–145. [Google Scholar] [CrossRef]
  77. Li, G.; Sun, S.; Fang, C. The Varying Driving Forces of Urban Expansion in China: Insights from a Spatial-Temporal Analysis. Landsc. Urban Plan. 2018, 174, 63–77. [Google Scholar] [CrossRef]
  78. Xu, L.; Huang, Q.; Ding, D.; Mei, M.; Qin, H. Modelling Urban Expansion Guided by Land Ecological Suitability: A Case Study of Changzhou City, China. Habitat Int. 2018, 75, 12–24. [Google Scholar] [CrossRef]
  79. Li, F.; Wang, X.; Tang, F. Potential Ecological Risk Assessment of Heavy Metals in the Suburban Farmland Soil from Xinxiang City. J. Henan Norm. Univ. Nat. Sci. Ed. 2011, 39, 84–109. [Google Scholar]
  80. Arnold, C.A. Social-Ecological Resilience of an Eastern Urban-Suburban Watershed: The Anacostia River Basin. Ida. L. Rev. 2014, 51, 29. [Google Scholar] [CrossRef] [Green Version]
  81. Łowicki, D.; Walz, U. Gradient of Land Cover and Ecosystem Service Supply Capacities-a Comparison of Suburban and Rural Fringes of Towns Dresden (Germany) and Poznan (Poland). Procedia Earth Planet. Sci. 2015, 15, 495–501. [Google Scholar] [CrossRef] [Green Version]
Figure 1. Land use types of Wuhan city in 2013 (a) and 2016 (b).
Sustainability 12 01600 g001
Figure 2. The estimation of socio-economic development level of the city and suburban villages in 2013 (a) and 2016 (b).
Sustainability 12 01600 g002
Figure 3. Data distribution of urban-suburban interaction in every suburban town.
Sustainability 12 01600 g003
Figure 4. Urbanization potential estimation based on GWR that does not consider (a) and considers (b) urban-suburban interaction.
Sustainability 12 01600 g004
Figure 5. The estimation by considering (a) and not considering (b) urban-suburban interaction.
Sustainability 12 01600 g005
Table 1. Basic attributes of the investigation.
AttributesClassificationNumberProportion
GenderMale254148.73%
Female267351.27%
Age18–40162931.24%
41–65237345.51%
>65121223.25%
Educational levelPrimary school206039.51%
Junior high school215041.24%
High school79615.27%
College1683.22%
Master or above400.76%
Occupation typeFarm219942.18%
Half-farm236245.30%
Non-farm65312.52%
Annual income<10,000209840.24%
10,000–20,000105020.14%
20,000–30,00091617.57%
30,000–40,00080015.34%
40,000–50,0002735.24%
>50,000771.47%
Table 2. Comprehensive evaluation system for socio-economic development.
ObjectiveCriteriaIndexObtaining MethodDirection
Socio-economic development levelEconomic developmentGDPThe total number of GDP+
Population Total population+
The ratio of the secondary industry output valueThe secondary industry output value / GDP (%)+
The ratio of the tertiary industry output valueThe tertiary industry output value / GDP (%+
Average personal annual income Statistical data+
Demographic urbanizationUrban population / Total population (%)+
Social developmentNumber of primary school per 10,000 personsNumber of primary school / 10,000 person+
Number of junior high school per 10,000 personsNumber of junior high school / 10,000 person+
Number of hospitals per 10,000 personsNumber of hospitals / 10,000 person+
Employment rateNumber of employment / population (%)+
Non-agricultural employment rateNumber of non-agricultural employment / population (%)+
Construction developmentPublic road length per capitaThe total length of public road / population+
The density of the road networkThe total length of public road / total area (%)+
Area of construction land per acreArea of construction land / total area (%)+
Table 3. The example of the crosstab.
NumbersThe Estimated Mutual InteractionThe Real Mutual Interaction
111
210
n11
Table 4. The built “pressure-status-response” (PSR) model based on considering urban-rural interaction.
Criterion LayerFactors and WeightsSub-FactorsValues
PressureLand use
P1 (0.15)
Waterbody5
Garden/forest/grass land4
Cropland3
Rural settlements and other construction lands2
Urban land1
Urbanization potential
P2 (0.18)
Low potential5
Medium-low potential4
Medium potential3
Medium-high potential2
High potential1
StatusEcosystem service value
S1 (0.36)
Waterbody5
Garden/forest land4
Grassland3
Cropland2
Construction land (exclude urban land)1
Urban land0
Ecological landscape pattern
S2 (0.20)
High comprehensive evaluation5
Medium-high comprehensive evaluation4
Medium comprehensive evaluation3
Medium-low comprehensive evaluation2
Low comprehensive evaluation1
Ecological landscape diversity
S3 (0.11)
High diversity5
Medium-high diversity4
Medium diversity3
Medium-low diversity2
Low diversity1
ResponsePrime cropland
National scenery, provincial touring site, and natural reserve
Other ecological protection areas
Table 5. Calculation examples.
No.Urbanized Land (unit: km2)Urbanization RateUrban-Rural Interaction (2016)
20132016
10.6621.4620.302 0.49
20.0070.1701.830 0.47
800.0070.00700
Table 6. Comparison of results considering and not considering urban-suburban interaction.
AICcR2Adjusted R2F-Test
Considering 257.650.7420.696p < 0.01
Not considering 402.340.6520.611p < 0.01
Table 7. Areas with low ecological security levels based on PSR models by considering and not considering urban-suburban interaction.
SuburbsConsidering Urban-Rural Interaction (km2)Proportion to the Suburb Not Considering Urban-Rural Interaction (km2)Proportion to the Suburb
High riskDongxihu271.4854.81%254.0851.29%
Medium risk Hannan117.2440.85%114.3039.82%
Caidian434.1939.72%428.4839.20%
Low risk Xinzhou416.7028.47%397.9127.19%
Huangpi478.6021.21%471.3620.89%
Jiangxia407.3820.18%349.4517.31%
Total 2125.6027.92%2015.5926.47%

