Abstract
Soil organic carbon (SOC) and soil inorganic carbon (SIC) play essential roles in carbon cycling in terrestrial ecosystems; however, the effects of crop cultivation on them are still poorly understood, especially in alkali sodic soils widely distributed in semiarid regions. Alkali sodic soils from cornfields and paddies with cultivation years of 5, 15, and 25 were analyzed here to assess the response of soil properties and soil carbon pools to crop cultivation. Soil pH and exchangeable sodium percentages decrease in accordance with cultivation years, while enzyme activity (amylase, invertase, and catalase) shows a contrary trend. Soil pH and exchangeable sodium percentages are negatively correlated with SOC, but positively correlated with SIC. Redundancy analysis reveals an obvious relationship between SOC and invertase activity. The percentage of δ13CSOC found here is approximately –24.78‰ to –22.97‰ for cornfields and approximately –26.54‰ to –23.81‰ for paddies, suggesting that crop cultivation contributes to SOC sequestration and stocking, increasing with cultivation years. The percentage of δ13CSIC found here is approximately 1.90‰ to 3.73‰, proving that lithogenic inorganic carbon is the major SIC, where the stock decreases with increasing cultivation years. Significant total carbon stock loss is observed in cornfields, while it is preserved at 120 Mg ha−1 in paddies. We conclude here from the results that corn and rice cultivation reduce alkali sodic conditions in soil, thereby improving soil enzymes and favoring SOC stocking, but reducing SIC stocks.
1. Introduction
Global warming is receiving more and more attention because of the series of threats it poses, like sea-level rise, land area decline, extreme climates, and food supply shortages, which challenge the sustainable development of eco-environments and social economy [1]. Greenhouse gas (GHG) emissions, including carbon dioxide (CO2), methane (CH4), and nitrous oxide (N2O), are responsible for global warming, owing to the greenhouse effects. Carbon (C) pools in soil are the carbon source for CO2 and CH4 production and emission. Overall, 52% of global anthropogenic CH4 is emitted from agricultural land [2]. Holding vast reserves of C, the C variance in agricultural lands impacts the atmospheric GHG concentration and global climatic conditions. Cultivation practices regulate GHG emission and the global C cycle through altering the distribution and transformation of C in soil.
Soil organic carbon (SOC) is one of the main focuses of studies because of its vital role in regulating ecosystem function and greenhouse effects. SOC mainly is produced from root exudates and the decomposition of litter and crop residues [3,4,5]. The progress is susceptible to cultivation practices, which adjust soil environments, i.e., the soil pH, soil water content, enzyme activities, and soil microbes [6,7,8,9]. Kuzyakov and Domanski (2000) noted that wheat and barley transport about 30% of the assimilated C production into soil [10]. Muller et al. (2016) reported that corn increased SOC content, especially in topsoil [11]. Rice cultivation gathers C in soil, while the C input in paddies is even lower (or higher) than that in upland areas [12,13]. However, few studies have taken the soil inorganic carbon (SIC) pool into account, which is the most common form of carbon in semiarid regions, representing the storage of ~695–1738 Pg (1 Pg = 1015 g) when assessing soil C sequestration [14,15]. SIC is classified as two central units stored in soil, namely, lithogenic inorganic carbon (LIC), inheriting from the parent material, and pedogenic inorganic carbon (PIC), resulting from the precipitation of carbonate ions. The formation of pedogenic carbonate, shown in Equations (1) and (2), can either be a source or sink of C [16]. In the input or output of soil, C is transformed in the process of precipitation. One unit of CO2 is consumed when a carbonate is dissolved, while, on the other hand, one unit of CO2 is released when a carbonate is redeposited. Cultivation regulates carbonate dissolution and precipitation by altering the soil pH, soil water, ion activity (Ca2+, Mg2+, Al3+, K+, and Fe3+), and CO2, either from the atmosphere or via microbial respiration [17,18,19]. Studies have reported that soil pH decreases or increases during rice cultivation, while increased pH is found for soybean cultivation [20,21]. Jaiyeoba (2003) noted that cation exchange capacity (CEC) declines after crop cultivation [22]. Cultivation and its management, i.e., fertilization and irrigation, governs SIC dynamics in soils through regulating the soil environment, SOC contents, and hydrological conditions [23,24]. Dong et al. (2017) noted that long-term fertilizer significantly decreased SIC content in a two-year crop rotation system, that is, winter wheat, summer corn, spring corn, and winter fallow for each two-year period [25], while Bughio et al. (2016) reported that irrigation and fertilization in a wheat–maize rotation system increased SIC content when compared with bare field [17]. Changes in the stock of SIC, induced by crop cultivation and its management, are still unclear. Thus, an accurate estimate, including both SOC and SIC, is required to assess the dynamics of soil C pools during cultivation in agricultural lands.
Soil natural isotope analysis (δ13C) is used to analyze the dynamics of SOC in terrestrial ecosystems because it provides the isotope signatures of soil composition [26,27]. As is well known, the δ13C value of SOC for a C4 plant (Hatch–Slack pathway during photosynthesis) is approximately −15‰ to −7‰, while it is approximately −35‰ to −20‰ for C3 plants (Calvin cycle during photosynthesis) [28,29]. The δ13C value is a sensitive indicator to clarify the contribution of plants or crops to SOC sequestration. Chen et al. (2018) noted that, in restored mangrove forests, SOC relies on mangrove organic matter, using the δ13C values [30]. Chen et al. (2018) also reported that maize mulch increases SOC by 22% in topsoil [31]. Likewise, LIC and PIC are distinguished by δ13C, which is 0‰ for LIC, while for PIC it is related to the δ13C of SOC [17,32]. Jin et al. (2014) noted that the δ13C of SIC in grassland is lower than the forest land of the Loess Plateau, showing that grasslands produce more PIC than forest land [33]. An et al. (2019) reported that the desertification of grassland contributes to PIC formation in topsoil [34]. Therefore, soil δ13C analysis can be of great assistance in analyzing soil C pool transformations and evaluating the influence of different crops on soil C pools in agricultural lands.
Soil desertification is one of the most severe land degradation problems and has occurred on a global scale for centuries [35]. Alkali sodic soil mitigates C sequestration and adjusts the global C cycle through reducing microbial activity and microbial biomass, microbial community structure, and soil respiration [36,37,38]. Because of land degradation, alkali sodic soils are widely distributed in the northeast of China, which includes arid and semiarid regions. To ease food shortages, the local government has carried out large-scale crop cultivation in saline–alkali soils since the 1950s. Grasslands have been converted into agriculture lands, cultivating corn and rice in large amounts, supplying fresh organic material in soils, and increasing microbial and faunal activities [39]. However, the impacts of long-term crop cultivation on soil carbon pools in alkali sodic agricultural lands are still poorly understood. We hypothesize that crop cultivation alters soil properties and enzyme activities, affecting SOC and SIC stocks in cornfields and paddies. Thus, the objectives of the present study are to (i) analyze the alterations in soil physical and chemical properties, as well as enzyme activities in cornfields and paddies with different cultivation years, (ii) assess the response of SOC and SIC content, natural isotopes, and carbon stocks on corn and rice cultivation, and (iii) to evaluate the influence of crop cultivation on SOC and SIC, as affected by soil properties and enzyme activities.
2. Materials and Methods
2.1. Site Description
The study site was located in Songyuan, Jilin province, China (Figure 1), and is southeast of the Songnen Plain, where the area of salinized land is 1.1 × 10⁶ ha [40]. The region has a semiarid and subhumid continental monsoon climate, with an annual average temperature of 5.6 °C and an annual precipitation of 446 mm. Soils have been cultivated regularly there since the 1950s, before which they were covered with grass, Leymus chinensis, Suaeda glauca, and Puccinellia distans being the primary forms of vegetation.
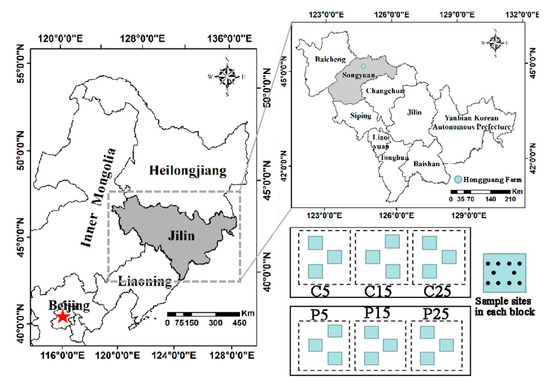
Figure 1.
The location of the study area (Songyuan) in Jilin province, in the northeast of China.
Two tillage systems with one crop per year, planting in May and harvesting in October, have been investigated in the experiment. Three neighboring cornfields and three neighboring paddies were selected and studied, with areas of 1 ha (100 × 100 m) per field, in Hongguang farm, Songyuan, with an elevation of 140 m above the mean sea level. The main landform here is plain, and the soil type is meadow soil (Eutric Vertisol [41]). The fields were covered with native degraded grass vegetation (Leymus chinensis, C3 plant) before crop cultivation, without any prior cultivation or fertilization. Here, the grass cover level was less than 50% in 1991, when C25 and P25 were cultivated, and it has decreased steadily due to climate change, soil desertification, and human activities. Three rain-fed cornfields have been cultivated for 5 (C5), 15 (C15), and 25 years (C25), respectively, under the same conventional tillage management method. Maize seeds (Zea mays L., C4 plant) and base fertilizer were applied together by a planter machine. A blended fertilizer (16% N, 16% P2O5, and 16% K2O) was applied with an application rate of 200 kg ha−1, and 180 kg ha−1 urea was applied in the jointing stage. Three paddies, cultivated for 5 (P5), 15r (P15), and 25 years (P25), respectively, were under continuous irrigation, where the soil was covered with water at a depth of 5 cm. The soils were irrigated sufficiently before planting, and then rice (Oryza sativa L., C3 plant) was planted by a planter machine. The base fertilizer, a blended fertilizer (17% N, 18% P2O5, and 19% K2O) with a rate of 200 kg ha−1, was applied after planting, while 150 kg ha−1 urea was applied in the tillering stage manually. Weed control was carried out manually with broad-spectrum herbicides. Corn and rice were harvested by machines. Crop straws were collected and processed into fertilizer, fodder, and fuel. All fields were plowed by a machine with a depth of 20 cm before planting. The irrigation water originates from Nen River and the groundwater depth ranges from 1.0 to 2.5 m.
2.2. Soil Sampling
Soils with the depth of 0–20 cm (surface layer) and 20–40 cm (subsurface layer) were sampled on September 25, 2016. We established three blocks (15 × 15 m) in each field to collect soil subsamples (ten per layer) randomly (Figure 1), using a soil auger (7 mm). Subsamples from the same block and layer were homogeneously mixed to generate a composite sample. A total of 36 samples were collected and sent to the lab. After removing visible roots and plant material with tweezers, the soil samples were air-dried at room temperature and sieved to <2 mm for further analysis. Soil cores (100 cm3) in three duplicates from each layer in each field were collected for soil bulk density (BD) analysis when sampling.
2.3. Soil Chemical Analysis
Core samples were heated in an oven at 105 °C for 48 h to identify the soil BD. A laser particle diameter analyzer (Bettersize 2000, Liaoning, China) was employed to identify the soil texture (i.e., the sand, silt, and clay proportion). Soil pH and electrical conductivity (EC) were tested at a ratio of 5 to 1 (water to soil). The exchangeable sodium percentage (ESP) was calculated by Equation (3) after measuring the content of exchangeable sodium (CNa+) and the cation exchange capacity (CEC) [42]. Briefly, 2.0 g of soil, mixed with 80 mL EDTA-ammonium acetate, was centrifuged for 5 min at 3000 rpm. The clear liquid, with 3 mL aluminum sulfate solutions (0.1 M), was diluted to test CNa+ using an atomic absorption spectrophotometer. The sediment was rinsed with ethyl alcohol, distilled, and then titrated by HCl (0.05 M) to determine the CEC. A TOC analyzer (Shimadzu TOC-V SSM-5000, Japan) was employed for total carbon (TC), soil organic carbon (SOC), and SIC analysis. Briefly, two sets of soils with a mass of 50 mg were put in sample boats separately, which were closed in the TOC analyzer. One sample for total carbon (TC) was burned at the temperature of 900 °C, while the other, for inorganic carbon (IC), was burned at 200 °C immediately after adding phosphoric acid. TC and IC were computed automatically with the CO2 emitted from the samples, while SOC was calculated from the TC and IC.
2.4. Carbon Isotope Analyses
The isotope analyses of SOC and SIC were carried out with a stable isotope mass spectrometer (Isoprime 100, Langenselbold, Germany). For the former, 5.0 g of soil was reacted with an overdosed HCl (1 M) solution for 24 h to remove SIC. They were washed with deionized water until the pH was less than 5, and then dried at 40 °C. Then, the samples were combusted in an evacuated sealed quartz tube in the presence of silver foil and cupric oxide for 2 h at 850 °C. The CO2 emitted from the reaction was extracted and analyzed with the spectrometer [43]. SIC isotope composition was determined from the CO2 gas emitted from air-dried soils reacting with H3PO4 for 2 h at 80 °C [34]. The δ13C values of SOC (δ13CSOC) and SIC (δ13CSIC) were calculated with Equation (4) [44]. Here, Vienna Pee Dee Belemnite (VDPB) was the standard used. Three multiple samples were tested for each sample.
where δ13C is the natural abundance of SOC or SIC for the samples (‰), Rs is the stable C isotope compositions of SOC or SIC, and Rc is the isotopic composition of the standards.
2.5. Soil Enzyme Assays
Enzyme activities were measured following the method described by Zhang [45]. Amylase and invertase activities were determined by colorimetric assays. Briefly, 5.0 g of air-dried soil was reacted with a 10 mL substrate (1% starch solution) and 10 mL phosphate buffer at pH 5.5 for 24 h at 37 °C. One mL of the liquid filtrated from the mixture was pipetted into a 50 mL flask to react with 2.0 mL of 3,5-dinitrosalicylic acid in boiling water for 5 min. After cooling, it was diluted with deionized water to volume and quantified at 508 nm using a spectrophotometer (UV-2100, Beijing, China). For invertase, the substrate was a 15 mL sucrose solution (8%), the volumes of the phosphate buffer and 3,5-dinitrosalicylic acid were 5.0 mL and 3.0 mL respectively. Controls without a substrate or soil were processed to obtain the amylase and invertase activities, expressed as μg glucose g−1 soil h−1. In order to determine the catalase activity, 2.0 g of air-dried soil was mixed with 40 mL of deionized water and reacted with 5 mL of H2O2 (0.3%) for 20 min, then filtrated and titrated with KMnO4 (0.02 mol L−1). Catalase activity was expressed as mL KMnO4 g−1 soil h−1.
2.6. Statistical Analysis
Total carbon stocks (Mg ha−1) were calculated as the sum of SOC and SIC densities, which were calculated using Equation (5) [46]:
where SD is the SOC or SIC density (Mg ha−1), Ci and BDi are the SOC or SIC concentration (g kg−1) and bulk density (g cm−3) in the layer i, respectively, and H is the thickness of soil (here, H = 20 cm).
Statistical analysis was performed with the SPSS 19.0 software package (SPSS Inc., Chicago, IL, USA). One-way analysis of variance (ANOVA) with separation of means by a least significant difference (LSD) test at p < 0.05 was computed to assess the significant differences of soil properties, enzyme activities, and C pools among fields with different cultivation years, while the t-test was employed to assess the significant differences between soil layers. The redundancy analysis (RDA) was conducted via CANOCO 4.5 (Microcomputer Power, Inc., Ithaca, NY, USA) to assess the relationships between soil carbon pools and soil physical–chemical properties and enzyme activities. SigmaPlot 12.5 (Systat Software, Inc., San Jose, CA, USA) was used for the figures.
3. Results
3.1. Soil Physical–Chemical Properties
The soil physical and chemical indicators are summarized in Table 1. Soils were alkaline for pH values ranging from 7.43 to 10.04 in cornfields and from 7.74 to 9.16 in paddies, despite the fact that their values were reasonably high in the subsurface layer. The EC in cornfields was 0.18–0.45 ms cm−1, and the largest value appeared in C5. They ranged from 0.22 to 0.46 ms cm−1 in paddies, where relatively large values appeared in the surface layer. Soils in the study area were slightly sodic, with ESP <15% indicating strongly sodic soil, with ESP = 24.32% in C5. The texture of the cornfield and paddy was of silt loam soil, although the silt content was higher in paddies compared with the cornfields. The soil bulk density ranged from 1.27 to 1.41 g cm−3 in cornfields, while it ranged from 1.30 to 1.66 g cm−3 in paddies, where larger values appeared in the subsurface layer.

Table 1.
Soil physical and chemical properties (n = 3).
3.2. Soil Enzyme Activities
In cornfields and paddies, enzyme activities in the surface layers were always larger than in the subsurface layers, and larger values were detected in longer cultivation years. Amylase activities in the surface layer were 1.61 and 1.64 times larger than in subsurface layers of the cornfields and paddies, respectively. Amylase activities in C25 (58.05 μg glucose g−1 h−1) and P25 (80.87 μg glucose g−1 h−1) were significantly higher than others. Amylase activities in paddies were always higher than cornfields with the same cultivation year. Invertase activities ranged from 18.27 to 279.44 μg glucose g−1 h−1 in cornfields and 73.35 to 462.14 μg glucose g−1 h−1 in paddies. Differing from amylase, the activities of invertase in the surface of C5 (158.62 μg glucose g−1 h−1) and C15 (227.47μg glucose g−1 h−1) were lower than in P5 (134.04 μg glucose g−1 h−1) and P15 (235.28 μg glucose g−1 h−1). Catalase activities in the cornfields and paddies had mean values of 4.64 mL KMnO4 g−1 and 5.65 mL KMnO4 g−1, respectively. Higher catalase activities were observed in paddies than in cornfields, except for the subsurface layer of P5 (2.31 mL KMnO4 g−1).
3.3. Soil Carbon Distribution
SOC decreased with increasing soil depth in both the cornfields and paddies (Figure 2a). It was approximately 1.3 times larger than subsurface soil, varying from 9.78 to 11.83 g kg−1 in the surface layer and from 7.77 to 9.46 g kg−1 in the subsurface layer in cornfields. SOC increased with cultivation years, such that SOC in P25 (C15) was the largest, while the least appeared in P5 (C5). Larger SOC contents were always observed in paddies rather than cornfields, i.e., they were 11.67 g kg−1 and 12.67 g kg−1 in the surface layer of C15 and P15, respectively.
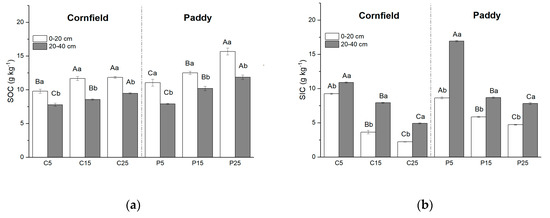
Figure 2.
Soil carbon distribution in cornfields and paddies with different cultivation years: (a) Soil organic carbon (SOC); (b) soil inorganic carbon (SIC). Capital letters indicate the significance among plots with different cultivation years, while lowercase letters indicate the difference between layers (p < 0.05).
The vertical distribution of SIC increased with soil depth, with an opposite trend of SOC (Figure 2b). Larger SIC content was observed in subsurface soil, ranging from 4.72 to 10.88 g kg−1, and 7.81 to 16.92 g kg−1 in cornfields and paddies, respectively. SIC declined with increasing cultivation years. SIC in the surface layer of C25 (9.23 g kg−1) was more than four times that of C5 (2.23 g kg−1). Paddies had larger SIC content when compared to cornfields of the same cultivation year.
3.4. Soil Carbon Stocks
SOC and SIC density changed with increasing cultivation years in both cornfields and paddies, affecting the soil carbon stocks. The total organic carbon stock at a depth of 40 cm was 76.14 Mg ha−1 in cornfields after 25 years of cultivation, while it was maintained at 120 Mg ha−1 in paddies (Figure 3). SIC stocks contributed to nearly half of total carbon stocks in C5 and P5, but they declined to 25.59% and 33.92% in C25 and P25, respectively. The SIC stocks were lower, up to 33.87 Mg ha−1 and 28.76 Mg ha−1 in the cornfields and paddies after 20 years of cultivation (from 5 to 25 years), respectively. SOC stocks showed an opposite trend with SIC for the stocks in C25 and P25, which were 1.22 and 1.56 times that of C5 and P5, respectively.
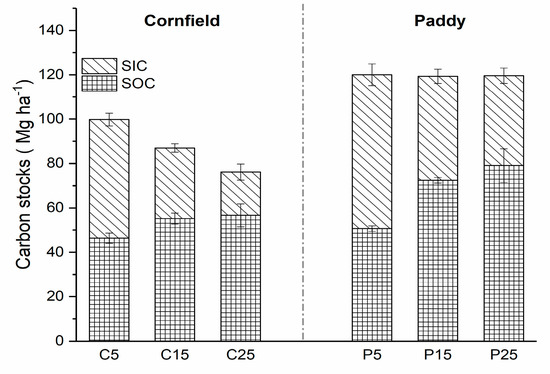
Figure 3.
Carbon stocks in cornfields and paddies (0–40 cm) with different cultivation years.
3.5. The δ13C Values of SOC and SIC
The δ13C of SOC in cornfields, with a mean value of −23.88‰, was higher than in paddies (−25.57‰) (Figure 4). Higher values were observed in the surface layer as compared with the subsurface soils in cornfields, varying from −24.40‰ to −22.97‰. The δ13CSOC value in C25 was the highest, followed by C15 and C5. A similar trend was detected in paddies, where the δ13CSOC values were in the range of P25, P15, and P5, although the values in the subsurface were larger than that in the surface soil. The δ13C of SIC ranged from approximately 1.90‰ to 4.07‰ in cornfields, where small values appeared in the surface layer (Figure 5). C5 had significantly higher δ13CSIC values (3.79‰ and 4.47‰) than C15 (3.25‰ and 3.90‰) and C25 (1.90‰ and 3.73‰). The δ13CSIC value was approximately 2.01‰ to 3.29‰ in paddies, where larger values appeared in the surface layer. The δ13CSIC in the surface layer of P25 was 2.29‰, which was significantly lower than other paddies.
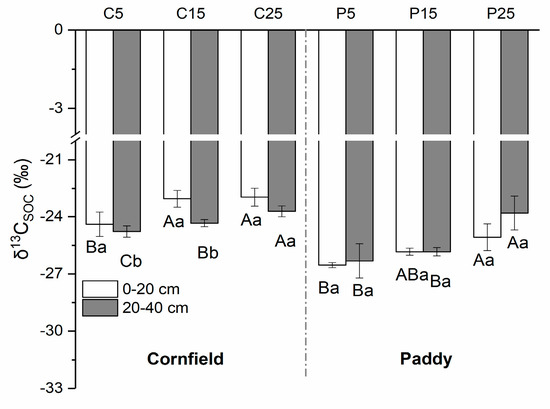
Figure 4.
The natural abundance of SOC isotopes (δ13CSOC) in cornfields (C) and paddies (P). Capital letters indicate the significance among plots with different cultivation years, while lowercase letters indicate the difference between layers (p < 0.05).
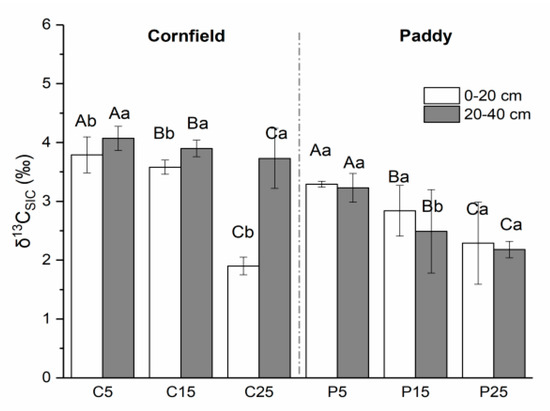
Figure 5.
The natural abundance of SIC isotopes (δ13CSIC) in cornfields (C) and paddies (P). Capital letters indicate the significance among plots with different cultivation years, while lowercase letters indicate the difference between layers (p < 0.05).
3.6. Redundancy Analysis between Soil Properties, Enzyme Activities, and Soil Carbon Pools
The relationship between soil properties, including the physical, chemical, and biological properties (enzyme activities), and soil carbon pools, was analyzed by RDA (Figure 6). The first two component axes explain approximately 89.43% to 91.97% and 6.35% to 8.61% of the variance of soil carbon pools, respectively. Soil pH, EC, ESP, invertase, catalase, and amylase played a bigger role than the soil physical properties, i.e., the BD, sand, silt, and clay content, in terms of explaining soil carbon pools. Soil organic carbon pools, SOC, δ13CSOC, and SOC density, were positively correlated with enzyme activities, i.e., invertase, catalase, and amylase, while they showed significantly negative correlations with pH, ESP, and EC in the cornfields (Figure 6a). SIC was positively correlated with pH, ESP, and EC. In the paddies, SOC was significantly positively correlated with EC and invertase and was negatively correlated with pH and ESP, which was contrary to SIC (Figure 6b). Soil amylase, catalase, and invertase activities showed negative correlations with soil pH and ESP in both fields.
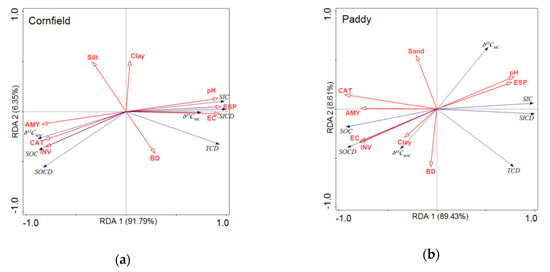
Figure 6.
Redundancy analyses of soil carbon pools, soil properties, and soil enzyme activities. (a) Cornfield. (b) Paddy. AMY, CAT, and INV represent the activities of amylase, catalase, and invertase, respectively. BD, EC, and ESP represent the bulk density, electrical conductivity, and exchangeable sodium percentage, respectively. SOCD, SICD, and TCD represent the stock of SOC, SIC, and TC, respectively.
4. Discussion
4.1. Effects of Crop Cultivation on Soil Properties and Enzyme Activities
Crop cultivation affects soil physical and chemical properties, as well as enzyme activities in both cornfields and paddies, through altering the soil structure, aggregation, porosity, strength, and infiltration with tillage practices [47]. Continuous irrigation and fertilization induces a reduction in soil pH [48]. In our study, the pH in the surface soil was significantly lower than in the subsurface layer, and a lower soil pH was observed in fields with longer cultivation years (Table 1). Consistent with Luo et al. (2017), maize cultivation in the Songnen Plain significantly improved soil quality [49], where EC and ESP decreased with cultivation years for long-term cultivation, and fertilization induced a reduction of Na+, Mg2+, and soil salinity [50]. Awe et al. (2020) suggested that crop cultivation reduces soil BD [51]; however, it was only observed in cornfields that BD in C25 was lower than C5 (Table 1). In paddies, soil BD and clay content increased with increasing cultivation years, which was related to the continuous flood irrigation [52].
Soil enzymes, mainly derived from soil microorganisms, crops, and root exudates [53], were sensitive to crop cultivation. They were active in the surface soil and their activities increased with cultivation years (Table 2). Long-term N fertilization increased enzyme activities associated with hydrolytic C for sufficient N supply in both the cornfields and paddies, not only directly stimulating soil microbes to produce more enzymes, but also favoring corn and rice production to increase root exudation [54]. The soil physical and chemical properties, altered by corn and rice cultivation, affected soil enzyme activities. Invertase, amylase, and catalase activities were negatively correlated with soil pH and ESP in our study (Figure 6), because high soil pH and ESP restricted the growth and development of corn and rice, limiting the metabolic process of soil microbes, and affecting the release of root exudates, limiting soil enzyme activities [55]. The soil C and N contents were closely related to soil enzyme activities [56] and sufficient SOC content, as well as long-term fertilization, which can explain the higher enzyme activities observed in fields with longer cultivation years in our study (Figure 2a).
Table 2.
Soil enzyme activities under cornfields (C) and paddies (P) with depths of 0–20 cm and 20–40 cm.
4.2. Effects of Crop Cultivation on SOC
Crop cultivation affected the vertical distribution of SOC in our study. SOC in the surface soil was significantly higher than that in the subsurface layer, agreeing with previous studies [11,17,57]. The δ13C values of SOC were closely related to the δ13C values of the plant material it originated from. In our study, the mean values of δ13CSOC in the surface layer were −23.48‰ for the cornfields and −25.82‰ for the paddies (Figure 4), which were closer to the δ13CSOC value of corn (approximately −15‰ to −17‰) and rice (approximately −35‰ to −20‰), inferring that crop cultivation performed sound effects on SOC sequestration and the fixation of surface soil. The crops fixed atmospheric carbon into soils by photosynthesis, which transforms CO2 from the air and releases it to the soil through the huge living root systems, which were well developed in the surface layer [58,59]. Fertilizer application in soil facilitates crop growth, thus improving C accumulation in the surface layer [17]. As reported by Jian et al. (2016) and Lu et al. (2011), N fertilization increases SOC content [54,60]. Moreover, the decayed roots also attribute to the SOC in soil [27,61,62,63,64].
SOC increased with cultivation years, and a larger value of δ13CSOC appeared in fields with longer cultivation years in both layers (Figure 2a and Figure 4), suggesting that long-term crop cultivation is valuable for SOC sequestration in the studied alkali sodic soils. Long-term fertilization, irrigation, and the decomposition of litters and roots increased SOC content, and the infiltration and transformation of soil particle fractions, as well as dissolved OC, increased the SOC content in subsurface soils [65,66]. The soil environment was altered by continual cultivation practice, contributing to SOC storage. Soil pH was the most sensitive indicator that regulated the SOC cycle and sequestration for the influence on crop growth, soil microorganisms, and enzyme activities [67,68,69]. The optimum pH for bacteria is 6.5–8, and 5–6 for fungi [70,71]. The intense alkali conditions, i.e., soil pH in C5 and P5, was 9.04 and 8.84, limited soil microbial activities, as well as the humification progress of root and litters, preventing the input and accumulation of SOC [72]. ESP significantly correlated with soil pH, showing a negative correlation with SOC in our study (Figure 6), implying that lower ESP conditions favor SOC and its storage. Wang et al. (2019) noted that SOC increased with cultivation years for native grassland converted into cropland, because decreasing soil salinity alleviates salt stress, as well as N fertilization, which is beneficial to plant growth and SOC accumulation [73]. Du et al. (2019) reported that grassland ecosystems have higher C losses than farmland when following desertification [74], which could also attribute to the SOC increment with increasing cultivation years. Soil desertification in the Songnen Plain has decreased the area of grassland, as well as grass vegetation coverage, resulting in a lower input of above- and below-ground biomass, reducing the SOC stock and increasing soil erosion from wind and water [75]. For instance, SOC losses induced by the 20-year coverage of degraded grasses in C5 (and P5) were related to the low SOC stocks as compared with C25 (and P25) (Figure 3). Soil enzymes participate in the metabolism of organic matter, catalyze biochemical processes, and affect soil nutrient accumulation and mineralization [76,77]. In the present study, invertase had significant impacts on SOC content in both the cornfields and paddies (Figure 6). Some studies have argued that a high clay content stabilizes SOC physically by forming organo-mineral complexes and micro-aggregates to protect SOC from decay [28,78], whereas the correlation between SOC and clay was only detected in paddies here (Figure 6).
4.3. Effects of Crop Cultivation on SIC
Our results are consistent with Dong et al. (2019), following that SIC content increases with the soil depth [79]. The SIC in subsurface soil was more extensive than that in the surface layer (Figure 2b). This could be explained by the primary geological parent materials, as displayed by the δ13CSIC > 0 relationship, where LIC was the primary unit of SIC in the study (Figure 5). Lettens et al. (2004) detected a strong relationship between soil geological conditions and SIC distribution [80], which is proven by our study, where SIC is positively correlated with soil pH and ESP (Figure 6). Worse soil alkali sodic status in the subsurface soil, higher pH, and ESP (Table 1), was favorable to SIC sequestration and storage. The loose soil structure induced by tillage practice and adequate SOC content in surface soil facilitates transforming and infiltrating dissolved carbonates (DIC) [81]. Natural rainfall and irrigation promote the dissolved carbonates that originally exist in the surface soil, flowing and moving downstream, re-precipitating in deeper soil [82].
Long-term cultivation decreased SIC content in both layers in the cornfields and paddies (Figure 2b), which is in line with Wu et al. (2009), who observed SIC loss in the east of China [83]. Changes in the soil environment induced by fertilization, tillage practice, and irrigation affect SIC stocking. Dong et al. (2017) and Eshel et al. (2007) noted that cultivation practices decrease SIC, where cultivation practice disturbs calciferous soils and transports SIC into rivers and lakes, deeper soils, and groundwater through irrigation and rainfall [4,84]. Ma et al. (2013) and Zamanian et al. (2016) argued the improvement in soil sodic and alkali conditions after long-term crop cultivation has triggered SIC loss [32,85]. High contents of soil cations and salt, coupled with the alkaline environment, are harmful to decomposing carbonates but conducive to SIC sequestration [86,87]. In our study, SIC was significantly positively related to pH and ESP (Figure 6), so long-term cultivation hastens SIC loss for the low alkali conditions. Besides, Bai et al. (2017) declared that SIC leaching is a vital factor controlling SIC sequestration and fixation [88]; thus, the leaching of DIC may be assigned to the SIC loss with cultivation years in both layers (0–40 cm).
4.4. The Effects of Crop Types on Soil C Stocks
Total C stocks varied with cultivation years, where they significantly decreased in cornfields while they upheld a stock of 120 Mg ha−1 in paddies (Figure 3), implying that corn and rice cultivation was disadvantageous to C sequestration and storage in the study area. SOC stocks (0–40 cm) increased with cultivation years in both crop types, inferring that both corn and rice cultivation are beneficial to SOC sequestration. Crop cultivation lowers soil alkali sodic conditions, improving crop growth and improving soil microbial activity, thus promoting carbon transformation and sequestration in soil [89]. Liu et al. (2019) argued that rice cultivation generates more SOC than in cornfields [12]. Likewise, more massive SOC stocks were observed in paddies than cornfields in our study (Figure 3), owing to the continuous flooding irrigation practice, where the anaerobic conditions limit soil mineralization and soil organic matter decomposition, raising C stores [3,90]. SIC stocks (0–40 cm) decreased with increasing cultivation years, while the SIC stocks in paddies were larger than in cornfields (Figure 3). The groundwater in the arid and semiarid region contained high concentrations of the Ca2+ and Mg2+ cations [91], which hasten the formation of PIC [92]. Rice flooding irrigation dissolves soluble ions into the water, accelerating the carbonate weathering and erosion, as proven by the lower δ13CSIC values in paddies (Figure 5). Higher silt and clay content and the larger BD in paddies (Table 1) restricted the infiltration of DIC, thus reducing SIC loss in paddies. Surface and subsurface soils (0–40 cm) are the most sensitive soil layers that are directly or indirectly disturbed by crop cultivation and tillage practice, like ploughing, fertilization, and irrigation. In our study, total C stock losses at the depth of 40 cm in the alkali sodic cornfields and paddies were detected. Advanced studies could consider deeper soil layers to assess the “carbon source” (or “carbon sink”) function of alkali sodic agricultural soils.
5. Conclusions
Corn and rice cultivation improved soil alkali sodic conditions by lowering soil pH, EC, and ESP, thus increasing enzyme activities (amylase, invertase, and catalase). SOC and its stocks were negative correlated with soil pH and ESP, while SIC showed significant correlations with pH and ESP. Obvious positive relationships between SOC and enzyme activities were detected in the redundancy analysis carried out in this study. SOC, δ13CSOC, and SOC stocks increased with cultivation years, while SIC, δ13CSIC, and SIC stocks decreased with increasing cultivation years. A total carbon stock loss was observed in the cornfields with increasing cultivation years, while, in paddies, the stocks remained steady at 120 Mg ha−1. Corn and rice cultivation in the studied alkali sodic region was advantageous to improve soil alkali sodic conditions but disadvantageous to soil total carbon storage at the depth of 0–40 cm.
Author Contributions
J.W. and W.Y. drafted the manuscript; J.T. and Z.L. designed the experiments; J.W., P.Y., and Y.Q. collected and tested the samples. All authors have read and agreed to the published version of the manuscript.
Funding
This study was supported by the National Natural Science Foundation of China (No. 41471152).
Conflicts of Interest
The authors declare no conflict of interest.
References
- Zhang, H.; Tang, J.; Liang, S.; Li, Z.; Yang, P.; Wang, J. The Emissions of Carbon Dioxide, Methane, and Nitrous Oxide during Winter without Cultivation in Local Saline-Alkali Rice and Maize Fields in Northeast China. Sustainability 2017, 9, 1916. [Google Scholar] [CrossRef]
- Smith, P.; Martino, D.; Cai, Z.; Gwary, D.; Janzen, H.; Kumar, P.; McCarl, B.; Ogle, S.; O’Mara, F.; Rice, C.; et al. Greenhouse gas mitigation in agriculture. Philos. Trans. R. Soc. B Biol. Sci. 2008, 363, 789–813. [Google Scholar] [CrossRef] [PubMed]
- Kimura, M.; Murase, J.; Lu, Y. Carbon cycling in rice field ecosystems in the context of input, decomposition and translocation of organic materials and the fates of their end products (CO2 and CH4). Soil Biol. Biochem. 2004, 36, 1399–1416. [Google Scholar] [CrossRef]
- Hao, M.; Hu, H.; Liu, Z.; Dong, Q.; Sun, K.; Feng, Y.; Li, G. Shifts in microbial community and carbon sequestration in farmland soil under long-term conservation tillage and straw returning. Appl. Soil Ecol. 2019, 136, 43–54. [Google Scholar] [CrossRef]
- Poirier, V.; Roumet, C.; Munson, A.D. The root of the matter: Linking root traits and soil organic matter stabilization processes. Soil Biol. Biochem. 2018, 120, 246–259. [Google Scholar] [CrossRef]
- Kögel-Knabner, I.; Amelung, W.; Cao, Z.; Fiedler, S.; Frenzel, P.; Jahn, R.; Kalbitz, K.; Kölbl, A.; Schloter, M. Biogeochemistry of paddy soils. Geoderma 2010, 157, 1–14. [Google Scholar] [CrossRef]
- Li, Q.; Zhang, X.; Gao, J.; Song, M.; Liang, J.; Yue, Y. Effects of N Addition Frequency and Quantity on Hydrocotyle vulgaris Growth and Greenhouse Gas Emissions from Wetland Microcosms. Sustainability 2019, 11, 1520. [Google Scholar] [CrossRef]
- Wei, X.; Zhu, Z.; Wei, L.; Wu, J.; Ge, T. Rhizosphere Biogeochemical cycles of key elements in the paddy-rice rhizosphere: Microbial mechanisms and coupling processes. Rhizosphere 2019, 10, 100145. [Google Scholar] [CrossRef]
- Wichern, F.; Mayer, J.; Joergensen, R.G.; Muller, T. Rhizodeposition of C and N in peas and oats after 13C-15N double labbling under field condition. Soil Biol. Biochem. 2007, 39, 2527–2537. [Google Scholar] [CrossRef]
- Kuzyakov, Y.; Domanski, G. Carbon input by plants into the soil. Review. Soil Sci. Plant Nutr. 2000, 163, 421–431. [Google Scholar] [CrossRef]
- Müller, K.; Kramer, S.; Haslwimmer, H.; Marhan, S.; Scheunemann, N.; Butensch, O.; Stefan, S.; Kandeler, E. Carbon transfer from maize roots and litter into bacteria and fungi depends on soil depth and time. Soil Biol. Biochem. 2016, 93, 79–89. [Google Scholar] [CrossRef]
- Liu, Y.; Ge, T.; Zhu, Z.; Liu, S.; Luo, Y.; Li, Y.; Wang, P.; Gavrichkova, O.; Xu, X.; Wang, J.; et al. Carbon input and allocation by rice into paddy soils: A review. Soil Biol. Biochem. 2019, 133, 97–107. [Google Scholar] [CrossRef]
- Xu, S.; Shi, X.; Zhao, Y.; Yu, D.; Li, C.; Wang, S.; Tan, M.; Sun, W. Carbon sequestration potential of recommended management practices for paddy soils of China, 1980–2050. Geoderma 2011, 166, 206–213. [Google Scholar] [CrossRef]
- Eswaran, H.; Van den Berg, E.; Reich, P.F.; Kimble, J.M. Global soil C resources. In Soils and Globle Change; Lal, R., Kimble, J.M., Levine, E., Stewart, B.A., Eds.; CRC/Lewis Publishers: Boca Raton, FL, USA, 1995; pp. 27–44. [Google Scholar]
- Batjes, N.H. Total carbon and nitrogen in the soils of the world. Eur. J. Soil Sci. 1996, 47, 151–163. [Google Scholar] [CrossRef]
- Groshans, G.R.; Mikhailova, E.A.; Post, C.J.; Schlautman, M.A. Accounting for soil inorganic carbon in the ecosystem services framework for United Nations sustainable development goals. Geoderma 2018, 324, 37–46. [Google Scholar] [CrossRef]
- Bughio, M.A.; Wang, P.; Meng, F.; Qing, C.; Kuzyakov, Y.; Wang, X.; Junejo, S.A. Neoformation of pedogenic carbonates by irrigation and fertilization and their contribution to carbon sequestration in soil. Geoderma 2016, 262, 12–19. [Google Scholar] [CrossRef]
- West, L.T.; Drees, L.R.; Wilding, L.P.; Rabenhorst, M.C. Differentiation of pedogenic and lithogenic carbonate forms in Texas. Geoderma 1988, 43, 271–287. [Google Scholar] [CrossRef]
- Smith, P. Global climate change and pedogenic carbonates: Edited by R. Lal, J.M. Kimble, H. Eswaran and B.A. Stewart. CRC Press, 2000. Hardbound, 305 pp. ISBN 566704588. GBP47. Geoderma 2001, 104, 180–182. [Google Scholar] [CrossRef]
- Ding, C.; Du, S.; Ma, Y.; Li, X.; Zhang, T.; Wang, X. Changes in the pH of paddy soils after flooding and drainage: Modeling and validation. Geoderma 2019, 337, 511–513. [Google Scholar] [CrossRef]
- Schoninger, E.L.; Gatiboni, L.C.; Ernani, P.R. Rhizosphere pH and phosphorus forms in an Oxisol cultivated with soybean, brachiaria grass, millet and sorghum. Sci. Agric. 2012, 69, 259–264. [Google Scholar] [CrossRef][Green Version]
- Jaiyeoba, I.A. Changes in soil properties due to continuous cultivation in Nigerian semiarid Savannah. Soil Tillage Res. 2003, 70, 91–98. [Google Scholar] [CrossRef]
- Reddy, M.M. Calcite growth-rate inhibition by fulvic acid and magnesium ion-Possible influence on biogenic calcite formation. J. Cryst. Growth 2012, 352, 151–154. [Google Scholar] [CrossRef]
- Fang, K.; Kou, D.; Wang, G.; Chen, L.; Ding, J.; Li, F.; Yang, G.; Qin, S.; Zhang, Q.; Yang, Y. Decreased soil cation exchange capacity across northern China’s Grasslands over the last three decades. J. Geophys. Res. Biogeosciences 2017, 122, 3088–3097. [Google Scholar] [CrossRef]
- Dong, X.; Hao, Q.; Li, G.; Lin, Q.; Zhao, X. Contrast effect of long-term fertilization on SOC and SIC stocks and distribution in different soil particle-size fractions. J. Soils Sediments 2017, 17, 1054–1063. [Google Scholar] [CrossRef]
- Wang, R.; Dungait, J.A.J.; Creamer, C.A.; Cai, J.; Bo, L.; Xu, Z.; Zhang, Y.; Ma, Y.; Yong, J. Carbon and Nitrogen Dynamics in Soil Aggregates under Long-Term Nitrogen and Water Addition in a Temperate Steppe. Soil Sci. Soc. Am. J. 2015, 79, 527. [Google Scholar] [CrossRef]
- Liu, W.; Qiao, C.; Yang, S.; Bai, W.; Liu, L. Microbial carbon use efficiency and priming effect regulate soil carbon storage under nitrogen deposition by slowing soil organic matter decomposition. Geoderma 2018, 332, 37–44. [Google Scholar] [CrossRef]
- Bai, E.; Boutton, T.W.; Liu, F.; Wu, X.B.; Hallmark, C.T.; Archer, S.R. Spatial variation of soil δ13C and its relation to carbon input and soil texture in a subtropical lowland woodland. Soil Biol. Biochem. 2012, 44, 102–112. [Google Scholar] [CrossRef]
- Bowling, D.R.; Pataki, D.E.; Randerson, J.T. Carbon isotopes in terrestrial ecosystem pools and CO2 fluxes. New Phytol. 2008, 178, 24–40. [Google Scholar] [CrossRef]
- Chen, S.; Arrouays, D.; Angers, D.A.; Martin, M.P.; Walter, C. Soil carbon stocks under different land uses and the applicability of the soil carbon saturation concept. Soil Tillage Res. 2019, 188, 53–58. [Google Scholar] [CrossRef]
- Chen, J.; Heiling, M.; Resch, C.; Mbaye, M.; Gruber, R.; Dercon, G. Does maize and legume crop residue mulch matter in soil organic carbon sequestration? Agric. Ecosyst. Environ. 2018, 265, 123–131. [Google Scholar] [CrossRef]
- Zamanian, K.; Pustovoytov, K.; Kuzyakov, Y. Cation exchange retards shell carbonate recrystallization: Consequences for dating and paleoenvironmental reconstructions. Catena 2016, 142, 134–138. [Google Scholar] [CrossRef]
- Jin, Z.; Dong, Y.; Wang, Y.; Wei, X.; Wang, Y.; Cui, B.; Zhou, W. Natural vegetation restoration is more beneficial to soil surface organic and inorganic carbon sequestration than tree plantation on the Loess Plateau of China. Sci. Total Environ. 2014, 485–486, 615–623. [Google Scholar] [CrossRef] [PubMed]
- An, H.; Li, Q.L.; Yan, X.; Wu, X.Z.; Liu, R.T.; Fang, Y. Desertification control on soil inorganic and organic carbon accumulation in the topsoil of desert grassland in Ningxia, northwest China. Ecol. Eng. 2019, 127, 348–355. [Google Scholar] [CrossRef]
- Ladeiro, B. Saline Agriculture in the 21st Century: Using Salt Contaminated Resources to Cope Food Requirements. J. Bot. 2012, 2012, 310705. [Google Scholar] [CrossRef]
- Andronov, E.E.; Petrova, S.N.; Pinaev, A.G.; Pershina, E.V.; Akhmedenov, K.M.; Gorobets, A.V. Analysis of the Structure of Microbial Community in Soils with Different degrees of Salinization Using T RFLP and Real Time PCR Techniques. Soil Biol. 2012, 45, 147–148. [Google Scholar] [CrossRef]
- Pan, C.; Liu, C.; Zhao, H.; Wang, Y. Changes of soil physico-chemical properties and enzyme activities in relation to grassland salinization. Eur. J. Soil Biol. 2013, 55, 13–19. [Google Scholar] [CrossRef]
- Yan, N.; Marschner, P.; Cao, W.; Zuo, C.; Qin, W. Influence of salinity and water content on soil microorganisms. Int. Soil Water Conserv. Res. 2015, 3, 316–323. [Google Scholar] [CrossRef]
- Ananyeva, K.; Wang, W.; Smucker, A.J.M.; Rivers, M.L.; Kravchenko, A.N. Can intra-aggregate pore structures affect the aggregate’s effectiveness in protecting carbon? Soil Biol. Biochem. 2013, 57, 868–875. [Google Scholar] [CrossRef]
- Dianwei, L.; Zongming, W.; Kaishan, S.; Bai, Z.; Liangjun, H.; Ni, H.; Sumei, Z.; Ling, L.; Chunhua, Z.; Guangjia, J. Land use/cover changes and environmental consequences in Songnen Plain, Northeast China. Chin. Geogr. Sci. 2009, 19, 299–305. [Google Scholar]
- IUSS Working Group WRB. World Reference Base for Soil Resources 2006, 2nd ed.; FAO: Rome, Italy, 2006; p. 103. [Google Scholar]
- Tang, J.; Wang, J.; Li, Z.; Wang, S.; Qu, Y. Effects of Irrigation Regime and Nitrogen Fertilizer Management on CH4, N2O, and CO2 Emissions from Saline–Alkaline Paddy Fields in Northeast China. Sustainability 2018, 10, 475. [Google Scholar] [CrossRef]
- Wei, J.; Cheng, J.; Li, W.; Liu, W. Comparing the effect of naturally restored forest and grassland on carbon sequestration and its vertical distribution in the Chinese Loess Plateau. PLoS ONE 2012, 7, e40123. [Google Scholar] [CrossRef]
- Wu, F.; Zhao, Y.; Fang, X.; Meng, Q. An ecological response to the Eocene / Oligocene transition revealed by the δ13C TOC record, Lanzhou Basin, NE Tibetan Plateau. J. Asian Earth Sci. 2018, 159, 74–80. [Google Scholar] [CrossRef]
- Zhang, C.; Liu, G.; Xue, S.; Song, Z. Rhizosphere soil microbial activity under different vegetation types on the Loess Plateau, China. Geoderma 2011, 161, 115–125. [Google Scholar] [CrossRef]
- Zhang, P.; Tang, J.; Sun, W.; Yu, Y.; Zhang, W. Differential effects of conservational management on SOC accumulation in the grasslands of China. PLoS ONE 2015, 10, 1–15. [Google Scholar] [CrossRef] [PubMed]
- Parihar, C.M.; Yadav, M.R.; Jat, S.L.; Singh, A.K.; Kumar, B.; Pradhan, S.; Chakraborty, D.; Jat, M.L.; Jat, R.K.; Saharawat, Y.S.; et al. Long term effect of conservation agriculture in maize rotations on total organic carbon, physical and biological properties of a sandy loam soil in north-western Indo-Gangetic Plains. Soil Tillage Res. 2016, 161, 116–128. [Google Scholar] [CrossRef]
- Bai, Z.; Caspari, T.; Gonzalez, M.R.; Batjes, N.H.; Mäder, P.; Bünemann, E.K.; de Goede, R.; Brussaard, L.; Xu, M.; Ferreira, C.S.S.; et al. Effects of agricultural management practices on soil quality: A review of long-term experiments for Europe and China. Agric. Ecosyst. Environ. 2018, 265, 1–7. [Google Scholar] [CrossRef]
- Luo, S.; Tian, L.; Chang, C.; Wang, S.; Zhang, J.; Zhou, X.; Li, X.; Tran, L.S.P.; Tian, C. Grass and maize vegetation systems restore saline-sodic soils in the Songnen Plain of northeast China. Land Degrad. Dev. 2018, 29, 1107–1119. [Google Scholar] [CrossRef]
- Wang, Y.; Wang, Z.L.; Feng, X.; Guo, C.; Chen, Q. Long-term effect of agricultural reclamation on soil chemical properties of a coastal saline marsh in Bohai Rim, Northern China. PLoS ONE 2014, 9, 1–7. [Google Scholar] [CrossRef]
- Awe, G.O.; Reichert, J.M.; Fontanela, E. Sugarcane production in the subtropics: Seasonal changes in soil properties and crop yield in no-tillage, inverting and minimum tillage. Soil Tillage Res. 2020, 196, 104447. [Google Scholar] [CrossRef]
- McVay, K.A.; Budde, J.A.; Fabrizzi, K.; Mikha, M.M.; Rice, C.W.; Schlegel, A.J.; Peterson, D.E.; Sweeney, D.W.; Thompson, C. Management effects on soil physical properties in long-term tillage studies in Kansas. Soil Sci. Soc. Am. J. 2006, 70, 434–438. [Google Scholar] [CrossRef]
- Zhang, Y.L.; Chen, L.J.; Chen, X.H.; Tan, M.L.; Duan, Z.H.; Wu, Z.J.; Li, X.J.; Fan, X.H. Response of soil enzyme activity to long-term restoration of desertified land. Catena 2015, 133, 64–70. [Google Scholar] [CrossRef]
- Jian, S.; Li, J.; Chen, J.; Wang, G.; Mayes, M.A.; Dzantor, K.E.; Hui, D.; Luo, Y. Soil extracellular enzyme activities, soil carbon and nitrogen storage under nitrogen fertilization: A meta-analysis. Soil Biol. Biochem. 2016, 101, 32–43. [Google Scholar] [CrossRef]
- Katsalirou, E.; Deng, S.; Nofziger, D.L.; Gerakis, A. Long-term management effects on organic C and N pools and activities of C-transforming enzymes in prairie soils. Eur. J. Soil Biol. 2010, 46, 335–341. [Google Scholar] [CrossRef]
- Akhtar, K.; Wang, W.; Ren, G.; Khan, A.; Feng, Y.; Yang, G. Changes in soil enzymes, soil properties, and maize crop productivity under wheat straw mulching in Guanzhong, China. Soil Tillage Res. 2018, 182, 94–102. [Google Scholar] [CrossRef]
- Teng, M.; Zeng, L.; Xiao, W.; Huang, Z.; Zhou, Z.; Yan, Z.G.; Wang, P. Spatial variability of soil organic carbon in Three Gorges Reservoir area, China. Sci. Total Environ. 2017, 599–600, 1308–1316. [Google Scholar] [CrossRef]
- Liu, X.; Zhang, X.; Chen, S.; Sun, H.; Shao, L. Subsoil compaction and irrigation regimes affect the root–shoot relation and grain yield of winter wheat. Agric. Water Manag. 2015, 154, 59–67. [Google Scholar] [CrossRef]
- Rostamza, M.; Richards, R.A.; Watt, M. Response of millet and sorghum to a varying water supply around the primary and nodal roots. Ann. Bot. 2013, 112, 439–446. [Google Scholar] [CrossRef]
- Lu, M.; Zhou, X.H.; Luo, Y.; Fang, C.M.; Chen, J.K.; Li, B. Minor stimulation of soil carbon storage by nitrogen addition: A meta-analysis. Agric. Ecosyst. Environ. 2011, 140, 234–244. [Google Scholar] [CrossRef]
- Wang, X.J.; Xu, M.G.; Wang, J.P.; Zhang, W.J.; Yang, X.Y.; Huang, S.M.; Liu, H. Fertilization enhancing carbon sequestration as carbonate in arid cropland: Assessments of long-term experiments in northern China. Plant Soil 2014, 380, 89–100. [Google Scholar] [CrossRef]
- Ai, C.; Liang, G.; Sun, J.; Wang, X.; He, P.; Zhou, W. Different roles of rhizosphere effect and long-term fertilization in the activity and community structure of ammonia oxidizers in a calcareous fluvo-aquic soil. Soil Biol. Biochem. 2013, 57, 30–42. [Google Scholar] [CrossRef]
- Paungfoo-lonhienne, C.; Yeoh, Y.K.; Kasinadhuni, N.R.P.; Lonhienne, T.G.A.; Robinson, N.; Hugenholtz, P.; Ragan, M.A.; Schmidt, S. Nitrogen fertilizer dose alters fungal communities in sugarcane soil and rhizosphere. Sci. Rep. 2015, 5, 8678. [Google Scholar] [CrossRef] [PubMed]
- Pavan Fernandes, S.A.; Bettiol, W.; Cerri, C.C. Effect of sewage sludge on microbial biomass, basal respiration, metabolic quotient and soil enzymatic activity. Appl. Soil Ecol. 2005, 30, 65–77. [Google Scholar] [CrossRef]
- Gerzabek, M.H.; Haberhauer, G.; Kirchmann, H. Soil Organic Matter Pools and Carbon-13 Natural Abundances in Particle-Size Fractions of a Long-Term Agricultural Field Experiment Receiving Organic Amendments. Soil Sci. Soc. Am. J. 2001, 352–358. [Google Scholar] [CrossRef]
- Liang, Q.; Chen, H.; Gong, Y.S.; Fan, M.S.; Yang, H.; Lal, R.; Kuzyakov, Y. Effects of 15 years of manure and inorganic fertilizers on soil organic carbon fractions in a wheat-maize system in the North China Plain. Nutr. Cycl. Agroecosystems 2012, 92, 21–33. [Google Scholar] [CrossRef]
- Paul, E.A. The nature and dynamics of soil organic matter: Plant inputs, microbial transformations, and organic matter stabilization. Soil Biol. Biochem. 2016, 98, 109–126. [Google Scholar] [CrossRef]
- Solly, E.F.; Schöning, I.; Herold, N.; Trumbore, S.E.; Schrumpf, M. No depth-dependence of fine root litter decomposition in temperate beech forest soils. Plant Soil 2015, 393, 273–282. [Google Scholar] [CrossRef]
- Steinweg, J.M.; Kostka, J.E.; Hanson, P.J.; Schadt, C.W. Temperature sensitivity of extracellular enzymes differs with peat depth but not with season in an ombrotrophic bog. Soil Biol. Biochem. 2018, 125, 244–250. [Google Scholar] [CrossRef]
- Frankenberger, W.T.; Johanson, J.B. Effect of pH on enzyme stability in soils. Soil Biol. Biochem. 1982, 14, 433–437. [Google Scholar] [CrossRef]
- Hartman, W.H.; Richardson, C.J.; Vilgalys, R.; Bruland, G.L. Environmental and anthropogenic controls over bacterial communities in wetland soils. Proc. Natl. Acad. Sci. USA 2008, 1–6. [Google Scholar] [CrossRef]
- Andersen, R.; Chapman, S.J.; Artz, R.R.E. Microbial communities in natural and disturbed peatlands: A review. Soil Biol. Biochem. 2013, 57, 979–994. [Google Scholar] [CrossRef]
- Wang, Y.; Jiang, J.; Niu, Z.; Li, Y.; Li, C.; Feng, W. Responses of soil organic and inorganic carbon vary at different soil depths after long-term agricultural cultivation in Northwest China. L. Degrad. Dev. 2019, 30, 1229–1242. [Google Scholar] [CrossRef]
- Du, H.; Wang, T.; Xue, X.; Li, S. Estimation of soil organic carbon, nitrogen, and phosphorus losses induced by wind erosion in Northern China. Land Degrad. Dev. 2019, 30, 1006–1022. [Google Scholar] [CrossRef]
- Abdalla, K.; Mutema, M.; Chivenge, P.; Everson, C.; Chaplot, V. Grassland degradation significantly enhances soil CO2 emission. Catena 2018, 167, 284–292. [Google Scholar] [CrossRef]
- Huang, L.; Hu, W.; Tao, J.; Liu, Y.; Kong, Z.; Wu, L. Soil bacterial community structure and extracellular enzyme activities under different land use types in a long-term reclaimed wetland. J. Soils Sediments 2019, 19, 2543–2557. [Google Scholar] [CrossRef]
- Zhang, C.; Liu, G.; Xue, S.; Wang, G. Soil bacterial community dynamics reflect changes in plant community and soil properties during the secondary succession of abandoned farmland in the Loess Plateau. Soil Biol. Biochem. 2016, 97, 40–49. [Google Scholar] [CrossRef]
- Rani, J.; Pal, B.; Cowie, A.L.; Fang, Y.; Collins, D.; Dougherty, W.J.; Singh, B.K. Carbon and nutrient mineralisation dynamics in aggregate-size classes from different tillage systems after input of canola and wheat residues. Soil Biol. Biochem. 2018, 116, 22–38. [Google Scholar]
- Dong, X.; Singh, B.P.; Li, G.; Lin, Q.; Zhao, X. Biochar increased field soil inorganic carbon content five years after application. Soil Tillage Res. 2019, 186, 36–41. [Google Scholar] [CrossRef]
- Lettens, S.; Van Orshoven, J.; van Wesemael, B.; Muys, B. Soil organic and inorganic carbon contents of landscape units in Belgium derived using data from 1950 to 1970. Soil Use Manag. 2004, 20, 40–47. [Google Scholar] [CrossRef]
- Lal, R. Soil carbon sequestration impacts on global climate change and food security. Science 2004, 304, 1623–1627. [Google Scholar] [CrossRef]
- Khokhlova, O.S.; Arlashina, E.A.; Kovalevskaya, I.S. The effect of irrigation on the carbonate status of Chernozems of Central Precaucasus (Russia). Soil Technol. 1997, 11, 171–184. [Google Scholar] [CrossRef]
- Wu, H.; Guo, Z.; Gao, Q.; Peng, C. Distribution of soil inorganic carbon storage and its changes due to agricultural land use activity in China. Agric. Ecosyst. Environ. 2009, 129, 413–421. [Google Scholar] [CrossRef]
- Eshel, G.; Fine, P.; Singer, M.J. Total Soil Carbon and Water Quality: An Implication for Carbon Sequestration. Soil Sci. Soc. Am. J. Abstract 2007, 71, 397–405. [Google Scholar] [CrossRef]
- Ma, J.; Wang, Z.; Stevenson, B.A.; Zheng, X.; Li, Y. An inorganic CO2 diffusion and dissolution process explains negative CO2 fluxes in saline/alkaline soils. Sci. Rep. 2013, 3, 2025. [Google Scholar] [CrossRef] [PubMed]
- Xie, J.; Li, Y.; Zhai, C.; Li, C.; Lan, Z. CO2 absorption by alkaline soils and its implication to the global carbon cycle. Environ. Geol. 2009, 56, 953–961. [Google Scholar] [CrossRef]
- Zhao, X.; Zhao, C.; Wang, J.; Stahr, K.; Kuzyakov, Y. CaCO3 recrystallization in saline and alkaline soils. Geoderma 2016, 282, 1–8. [Google Scholar] [CrossRef]
- Bai, S.G.; Jiao, Y.; Yang, W.Z.; Gu, P.; Yang, J.; Liu, L.J. Review of progress in soil inorganic carbon research. IOP Conf. Ser. Earth Environ. Sci. 2017, 100, 012129. [Google Scholar] [CrossRef]
- Liu, Y.; Ge, T.; Ye, J.; Liu, S.; Shibistova, O.; Wang, P.; Wang, J.; Li, Y.; Guggenberger, G.; Kuzyakov, Y.; et al. Initial utilization of rhizodeposits with rice growth in paddy soils: Rhizosphere and N fertilization effects. Geoderma 2019, 338, 30–39. [Google Scholar] [CrossRef]
- Qiu, H.; Ge, T.; Liu, J.; Chen, X.; Hu, Y.; Wu, J.; Su, Y.; Kuzyakov, Y. Effects of biotic and abiotic factors on soil organic matter mineralization: Experiments and structural modeling analysis. Eur. J. Soil Biol. 2018, 84, 27–34. [Google Scholar] [CrossRef]
- An, H.; Wu, X.; Zhang, Y.; Tang, Z. Effects of land-use change on soil inorganic carbon: A meta-analysis. Geoderma 2019, 353, 273–282. [Google Scholar] [CrossRef]
- Sanderman, J. Can management induced changes in the carbonate system drive soil carbon sequestration? A review with particular focus on Australia. Agric. Ecosyst. Environ. 2012, 155, 70–77. [Google Scholar] [CrossRef]


© 2020 by the authors. Licensee MDPI, Basel, Switzerland. This article is an open access article distributed under the terms and conditions of the Creative Commons Attribution (CC BY) license (http://creativecommons.org/licenses/by/4.0/).