Study on the Influence of Air Tightness of the Building Envelope on Indoor Particle Concentration

Abstract
:1. Introduction
2. Materials and Method
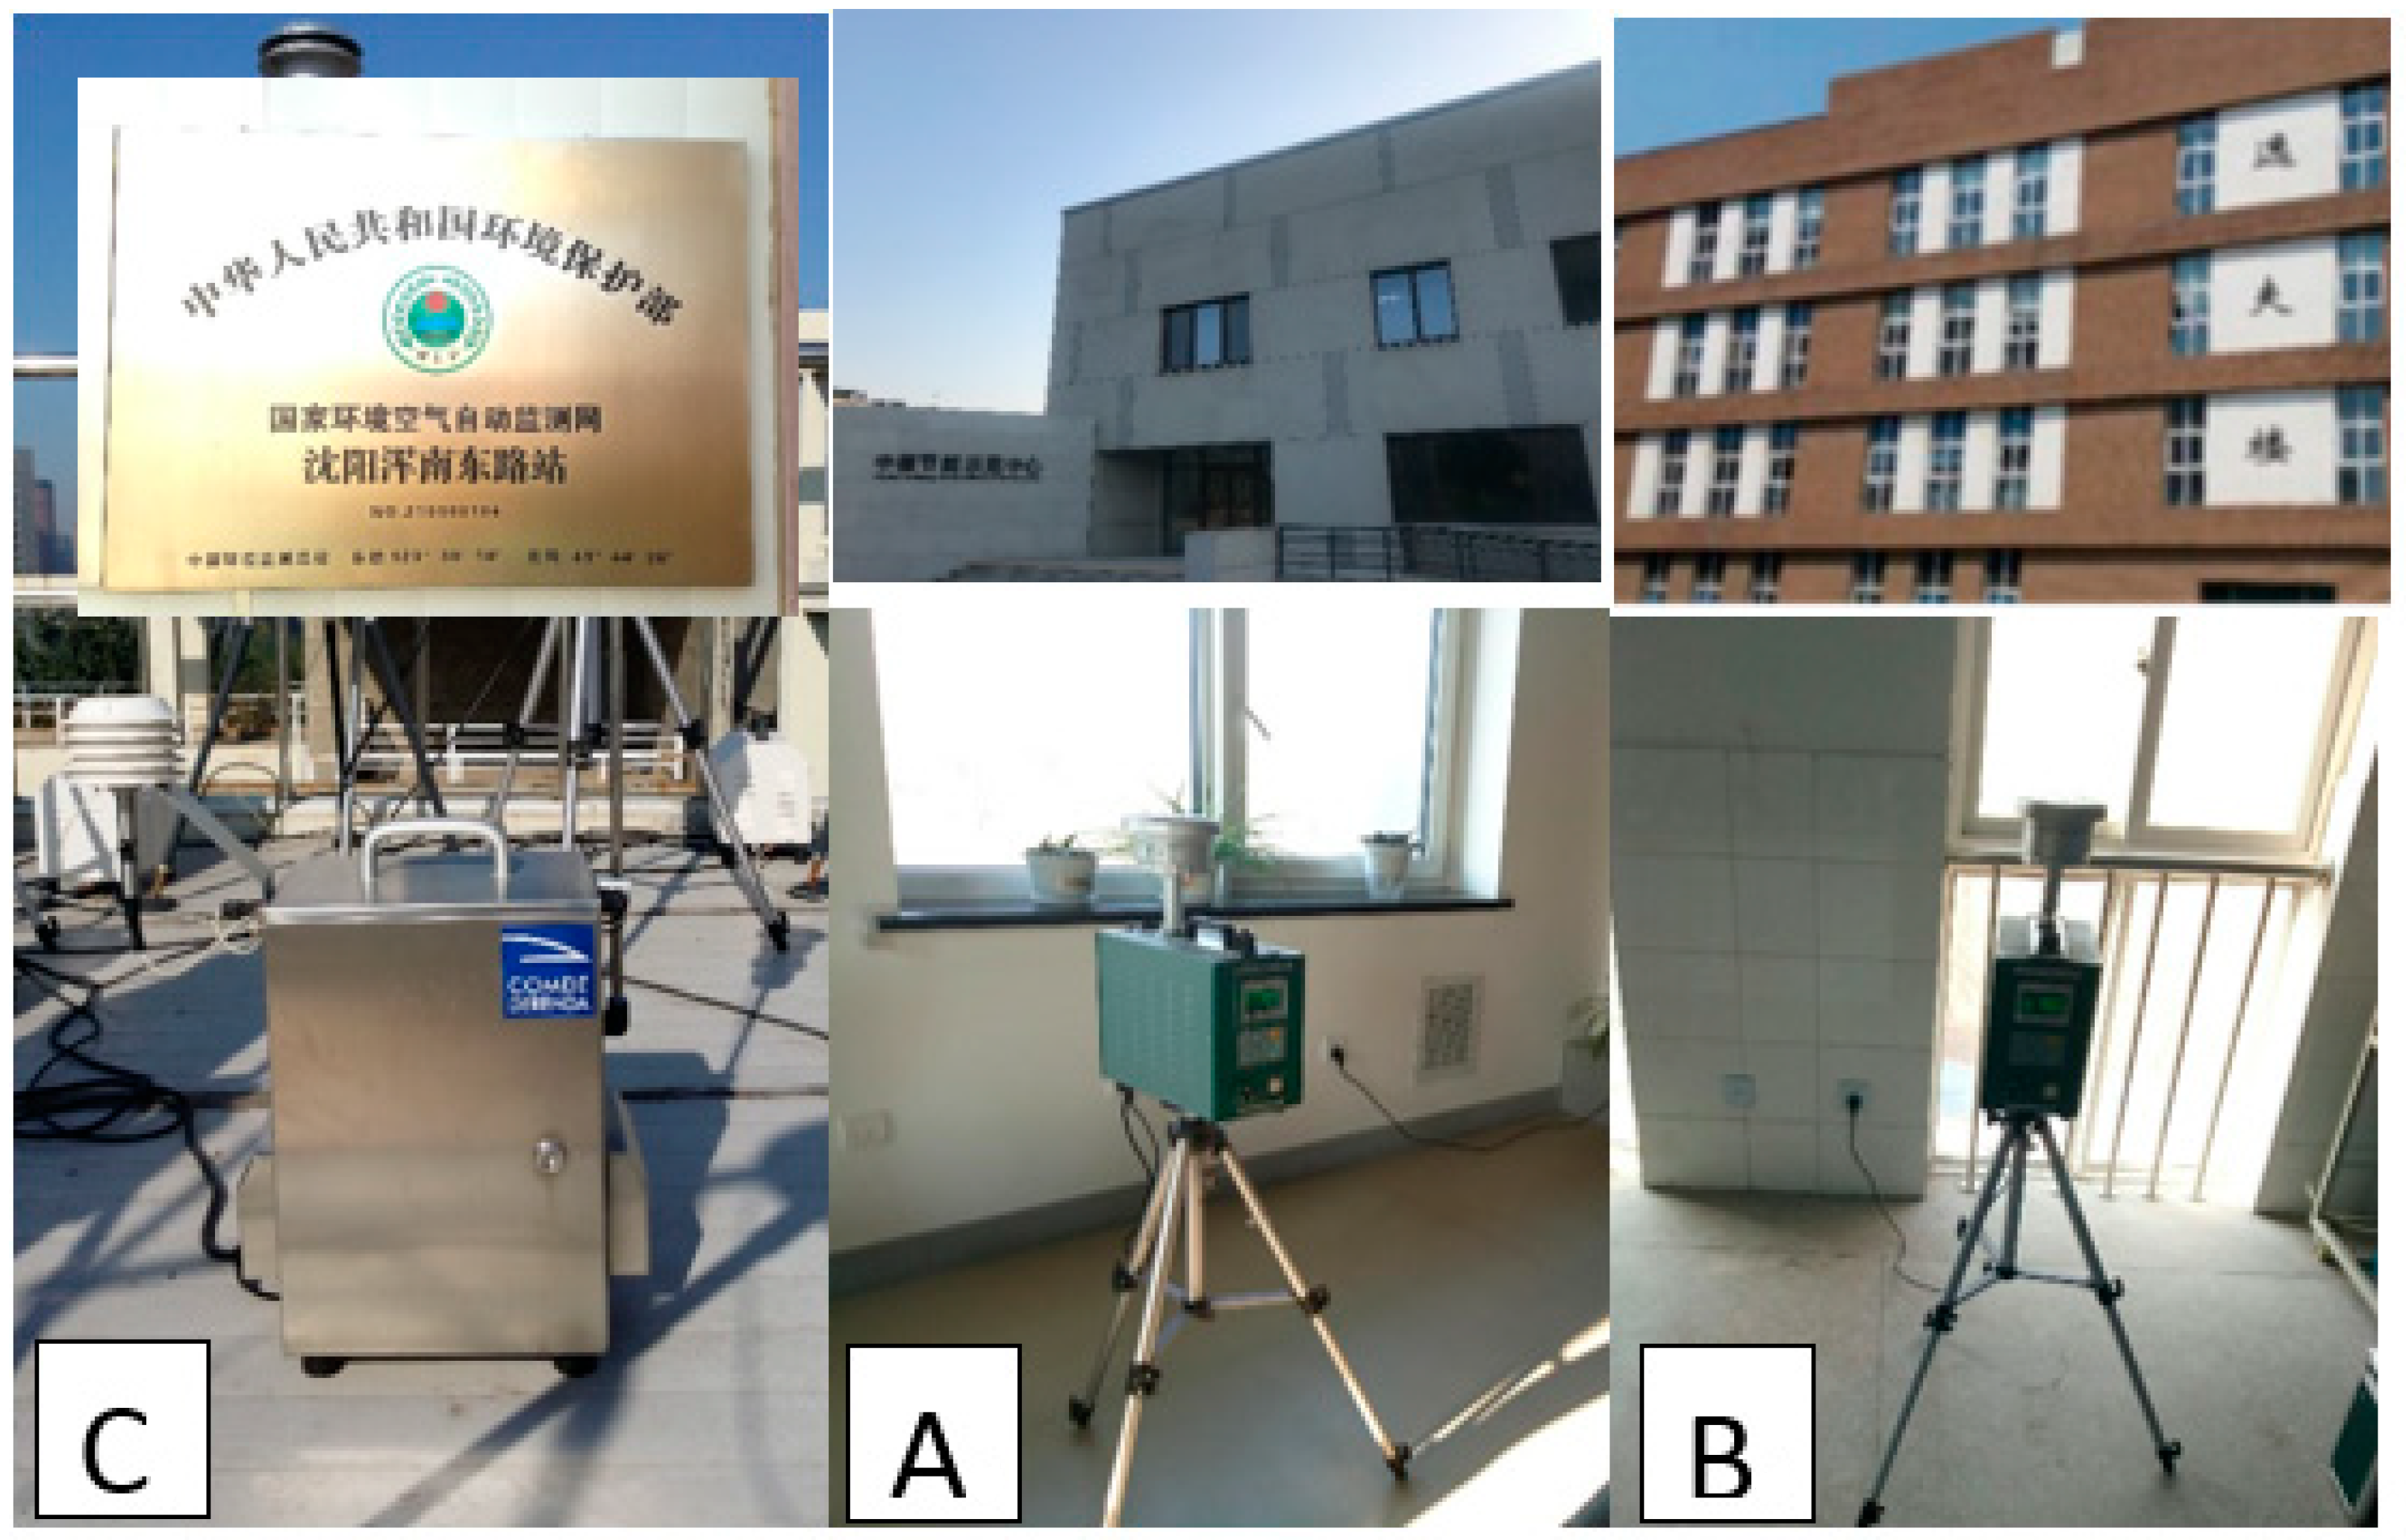
2.1. Sampling Sites
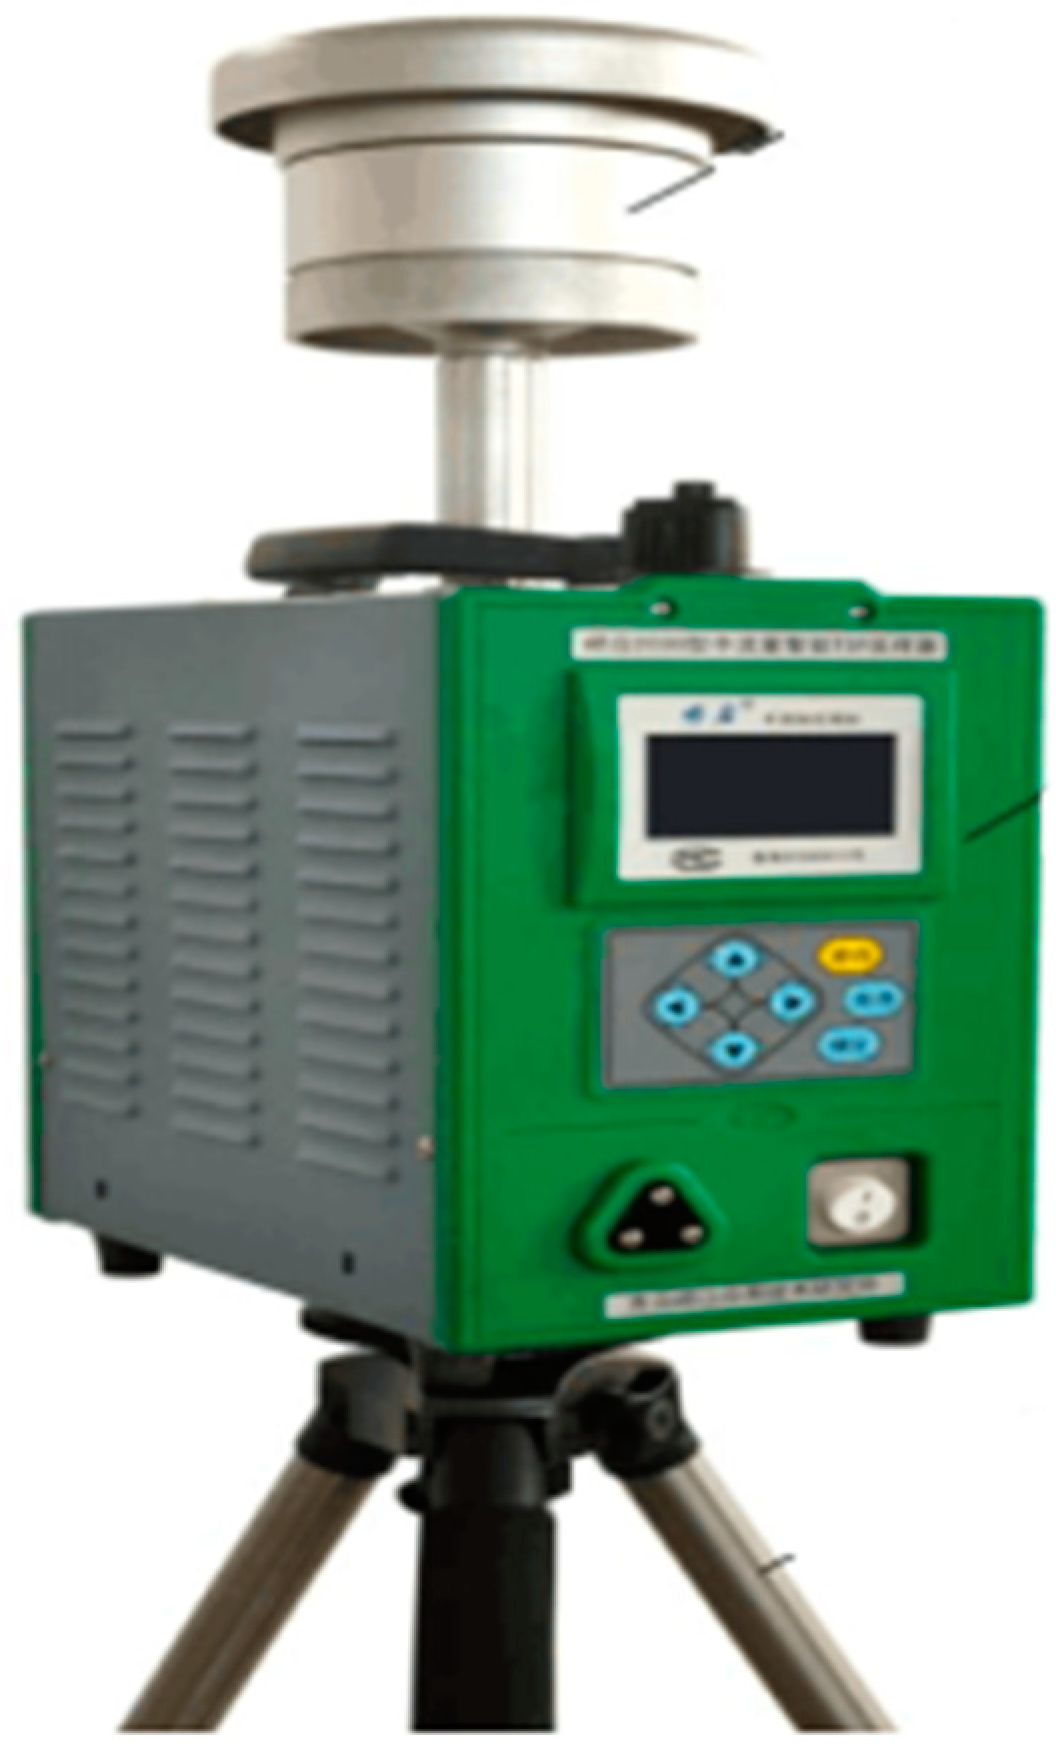
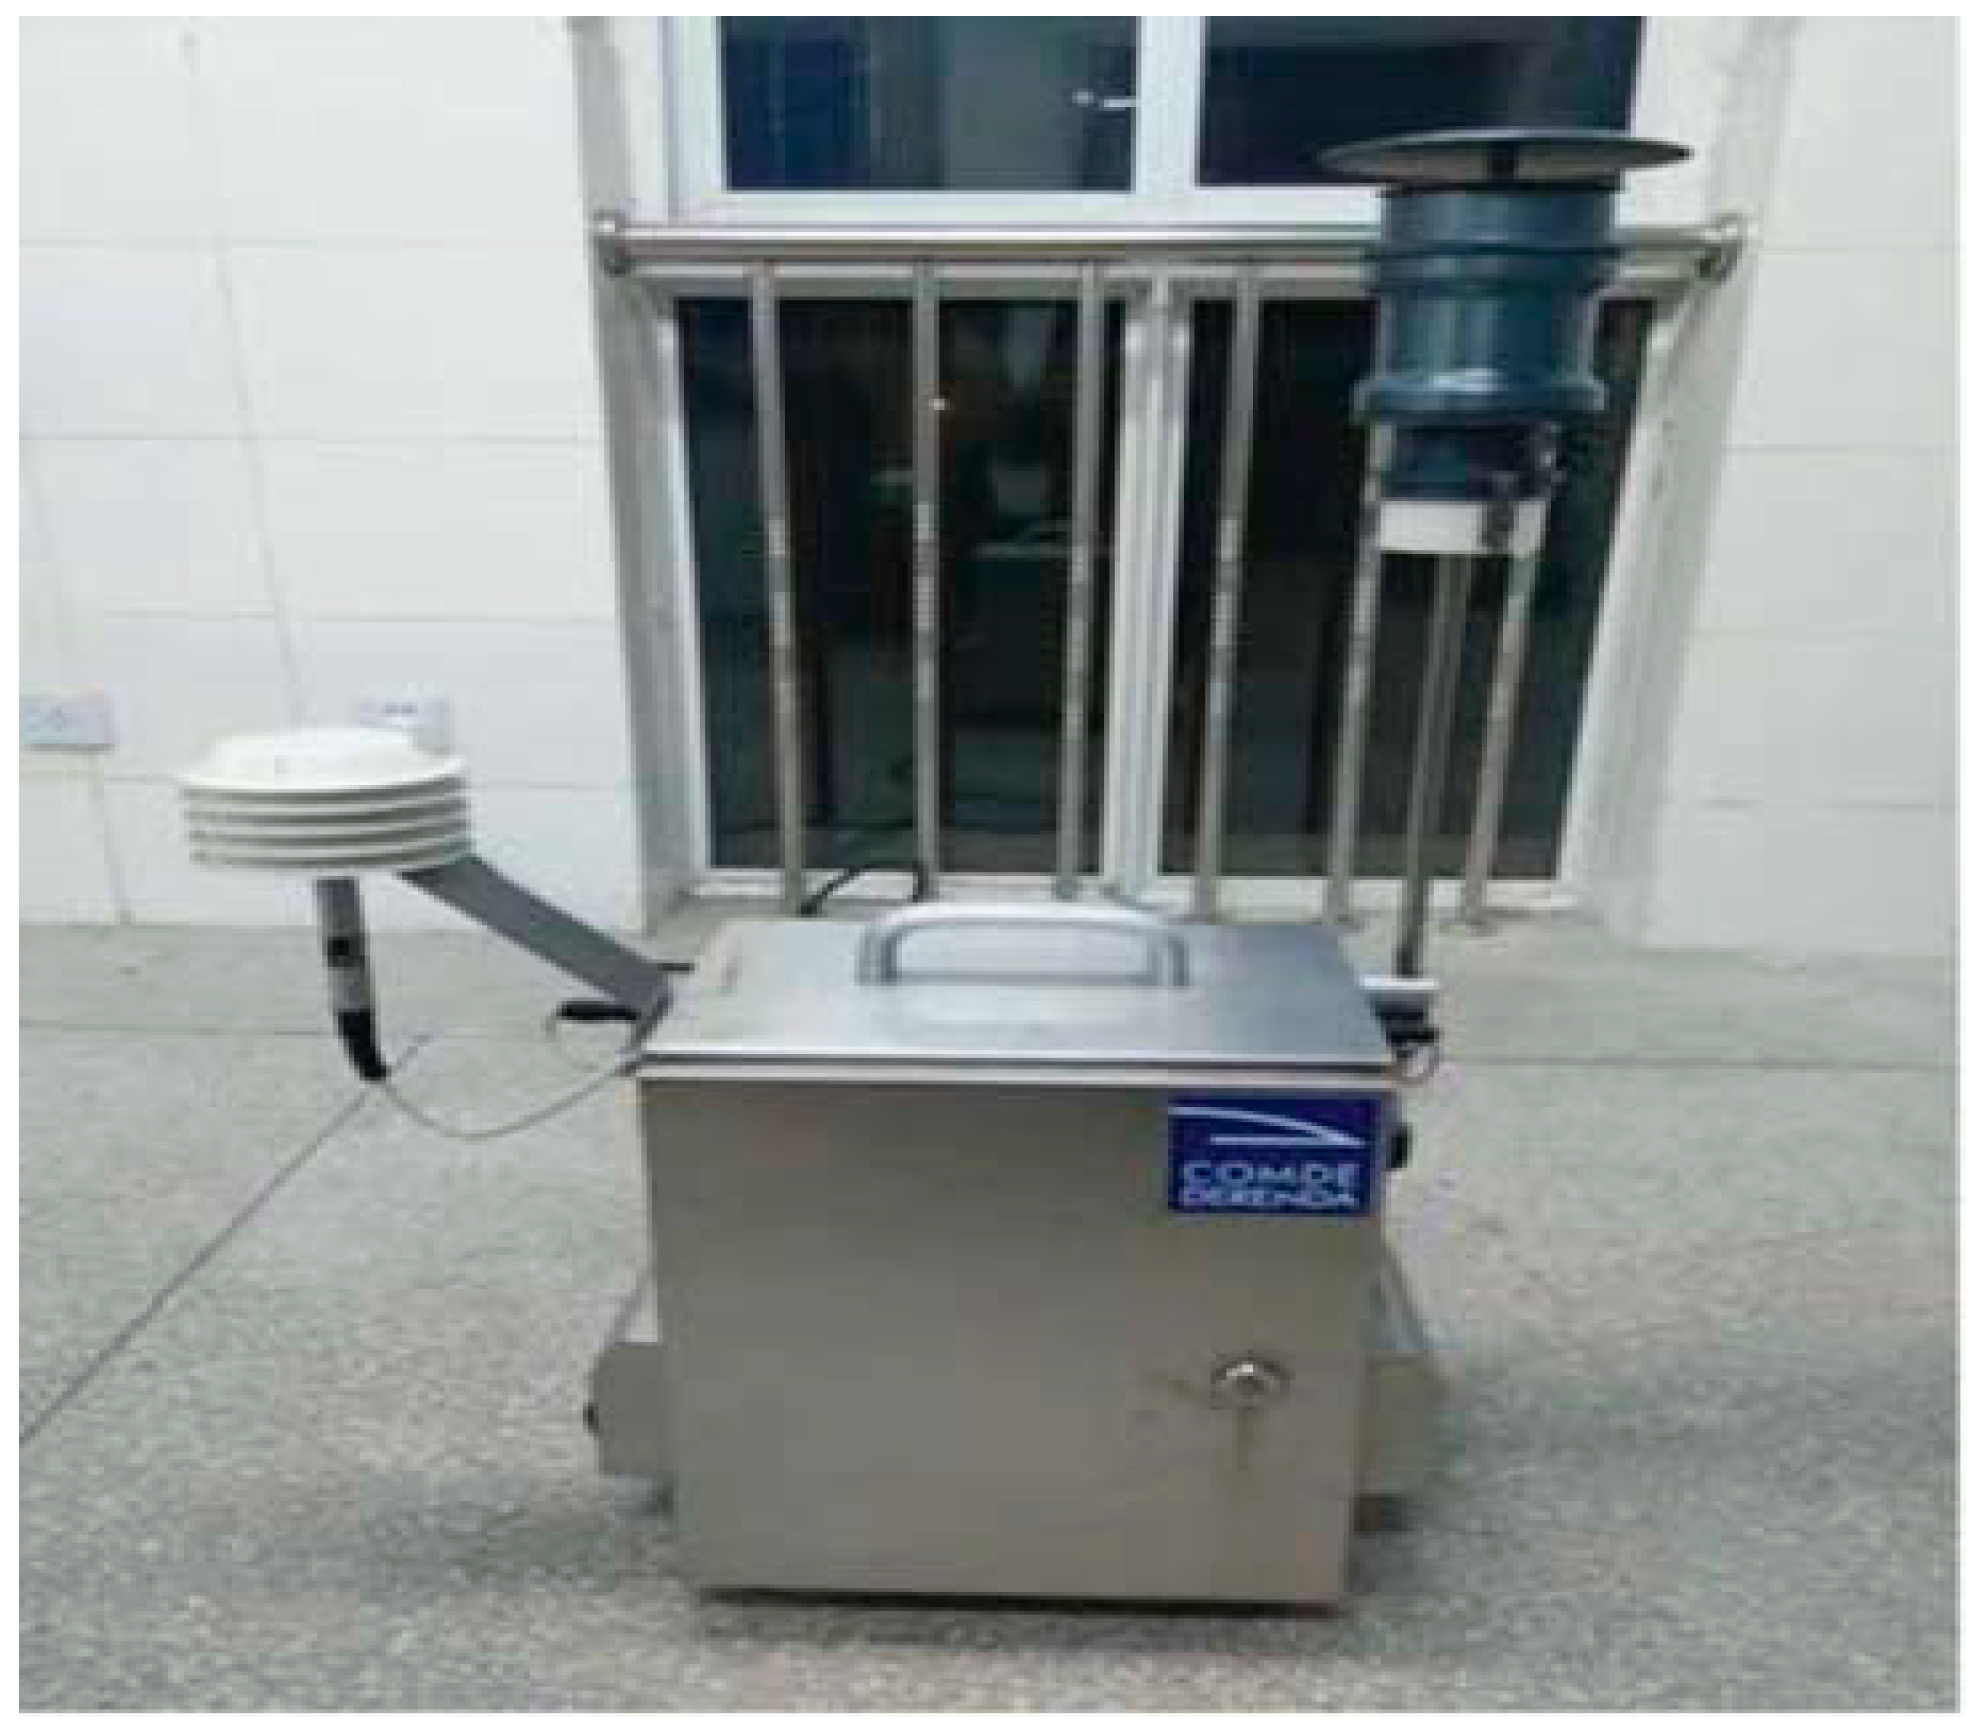
2.2. Sampling Methods and Instruments
3. Processing of Measured Data
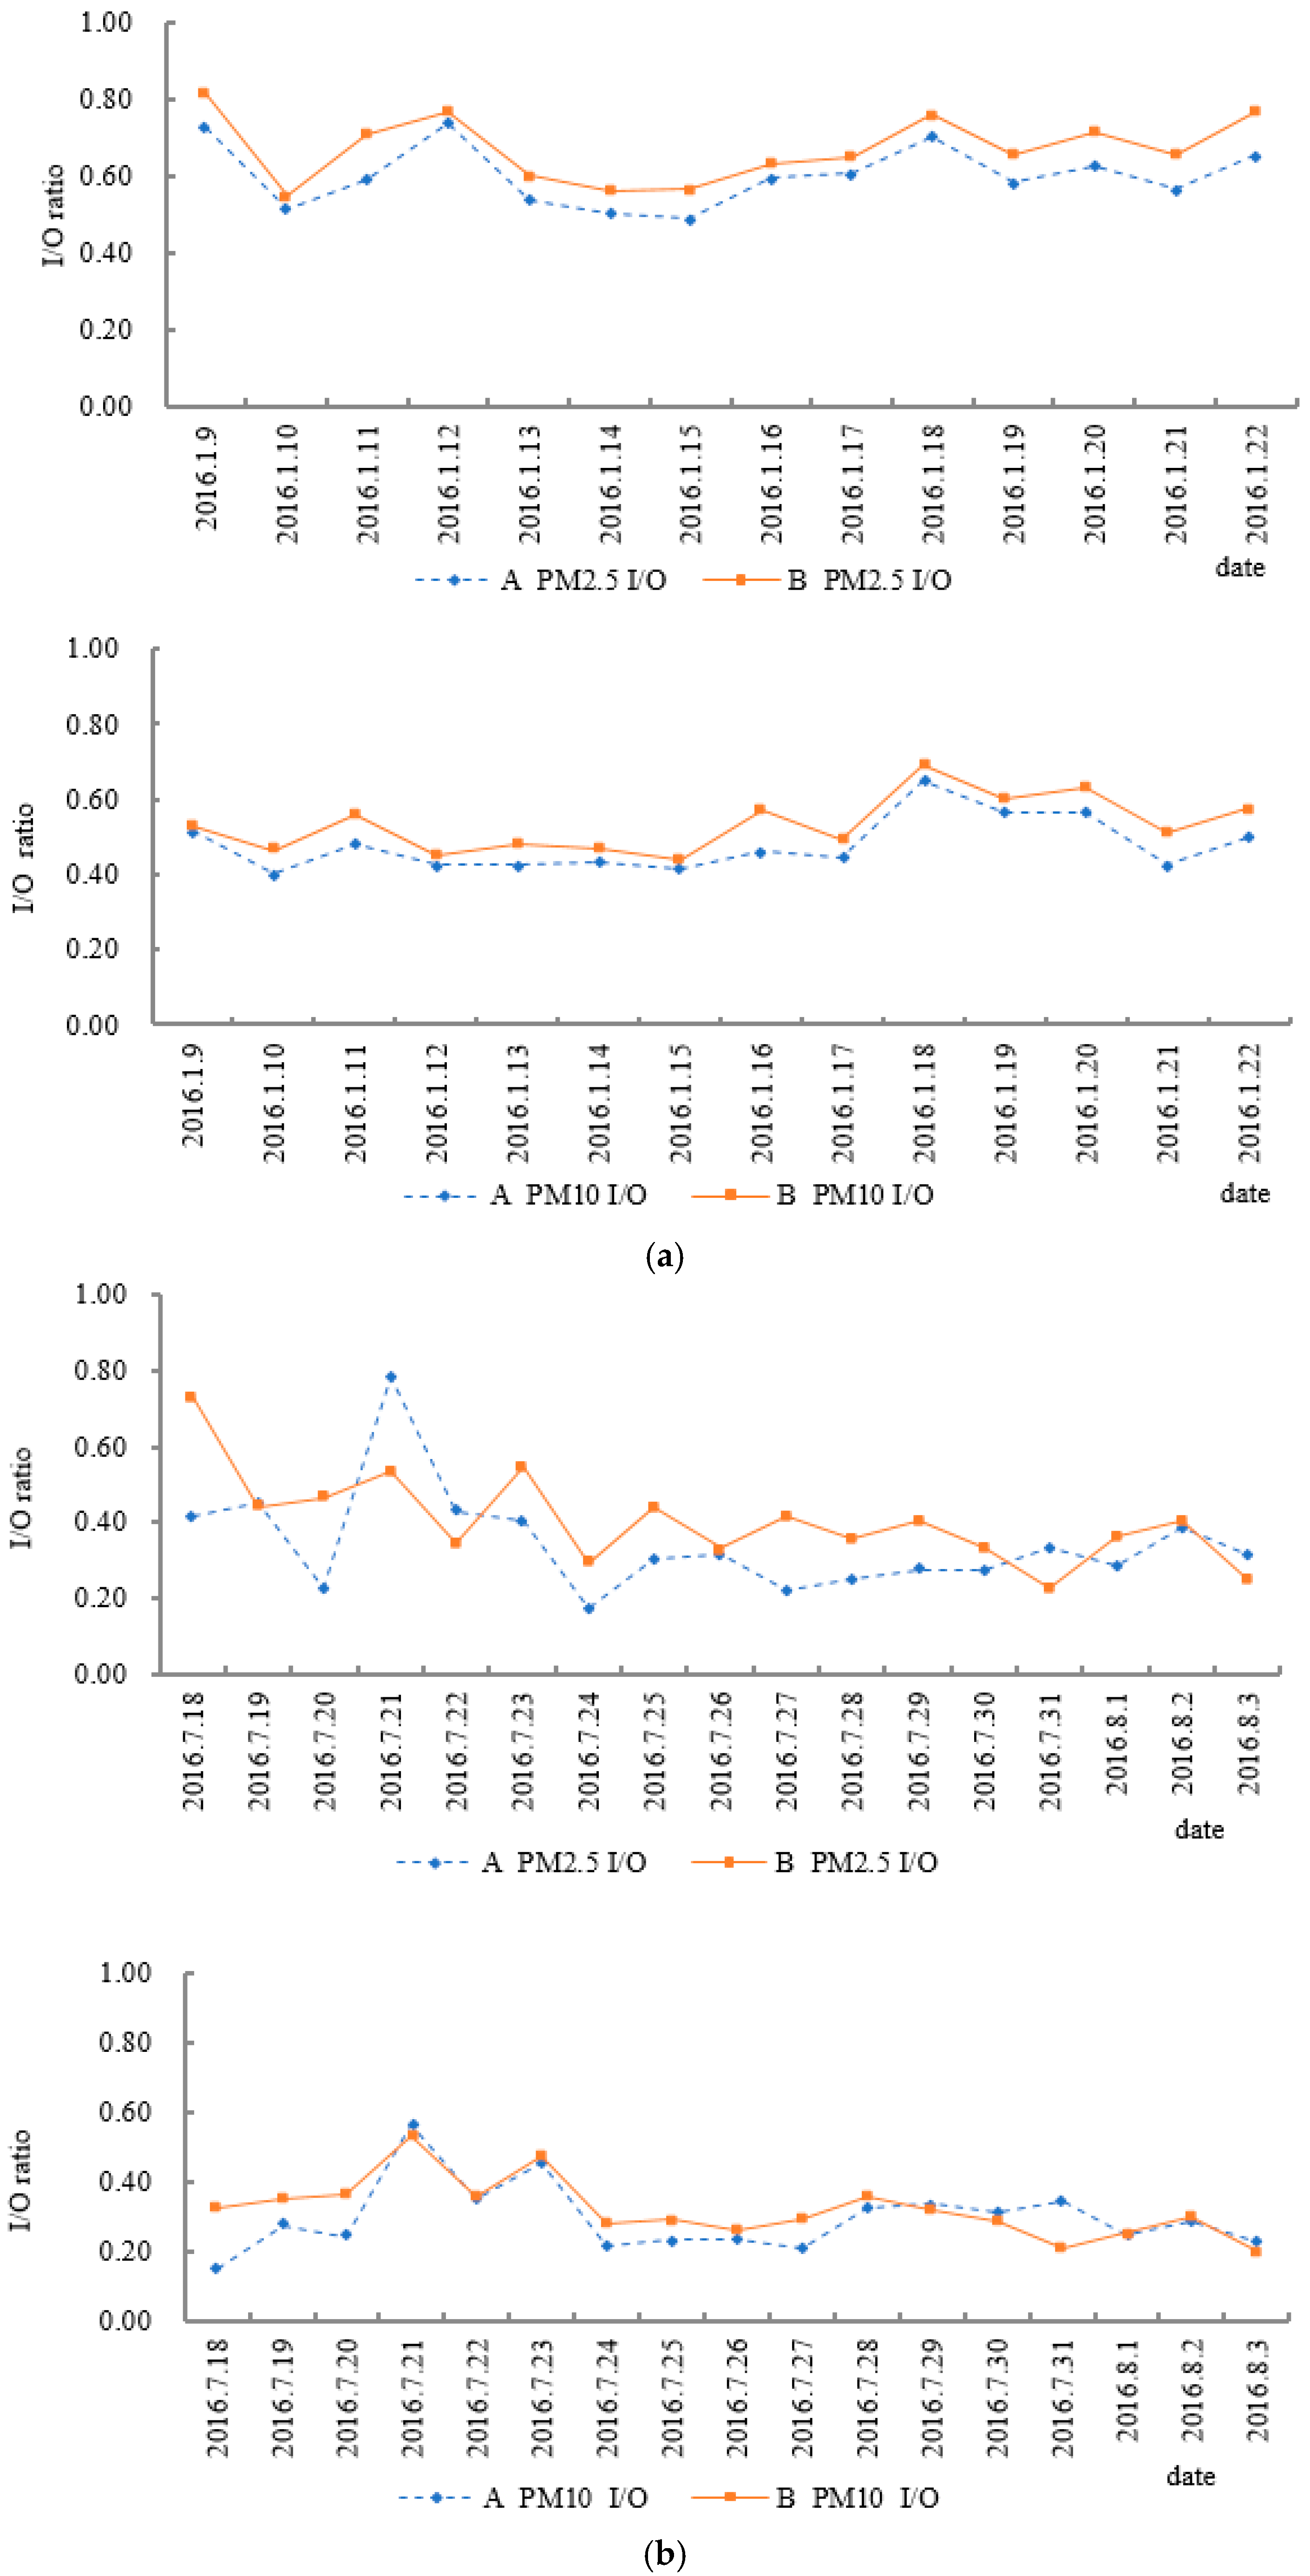
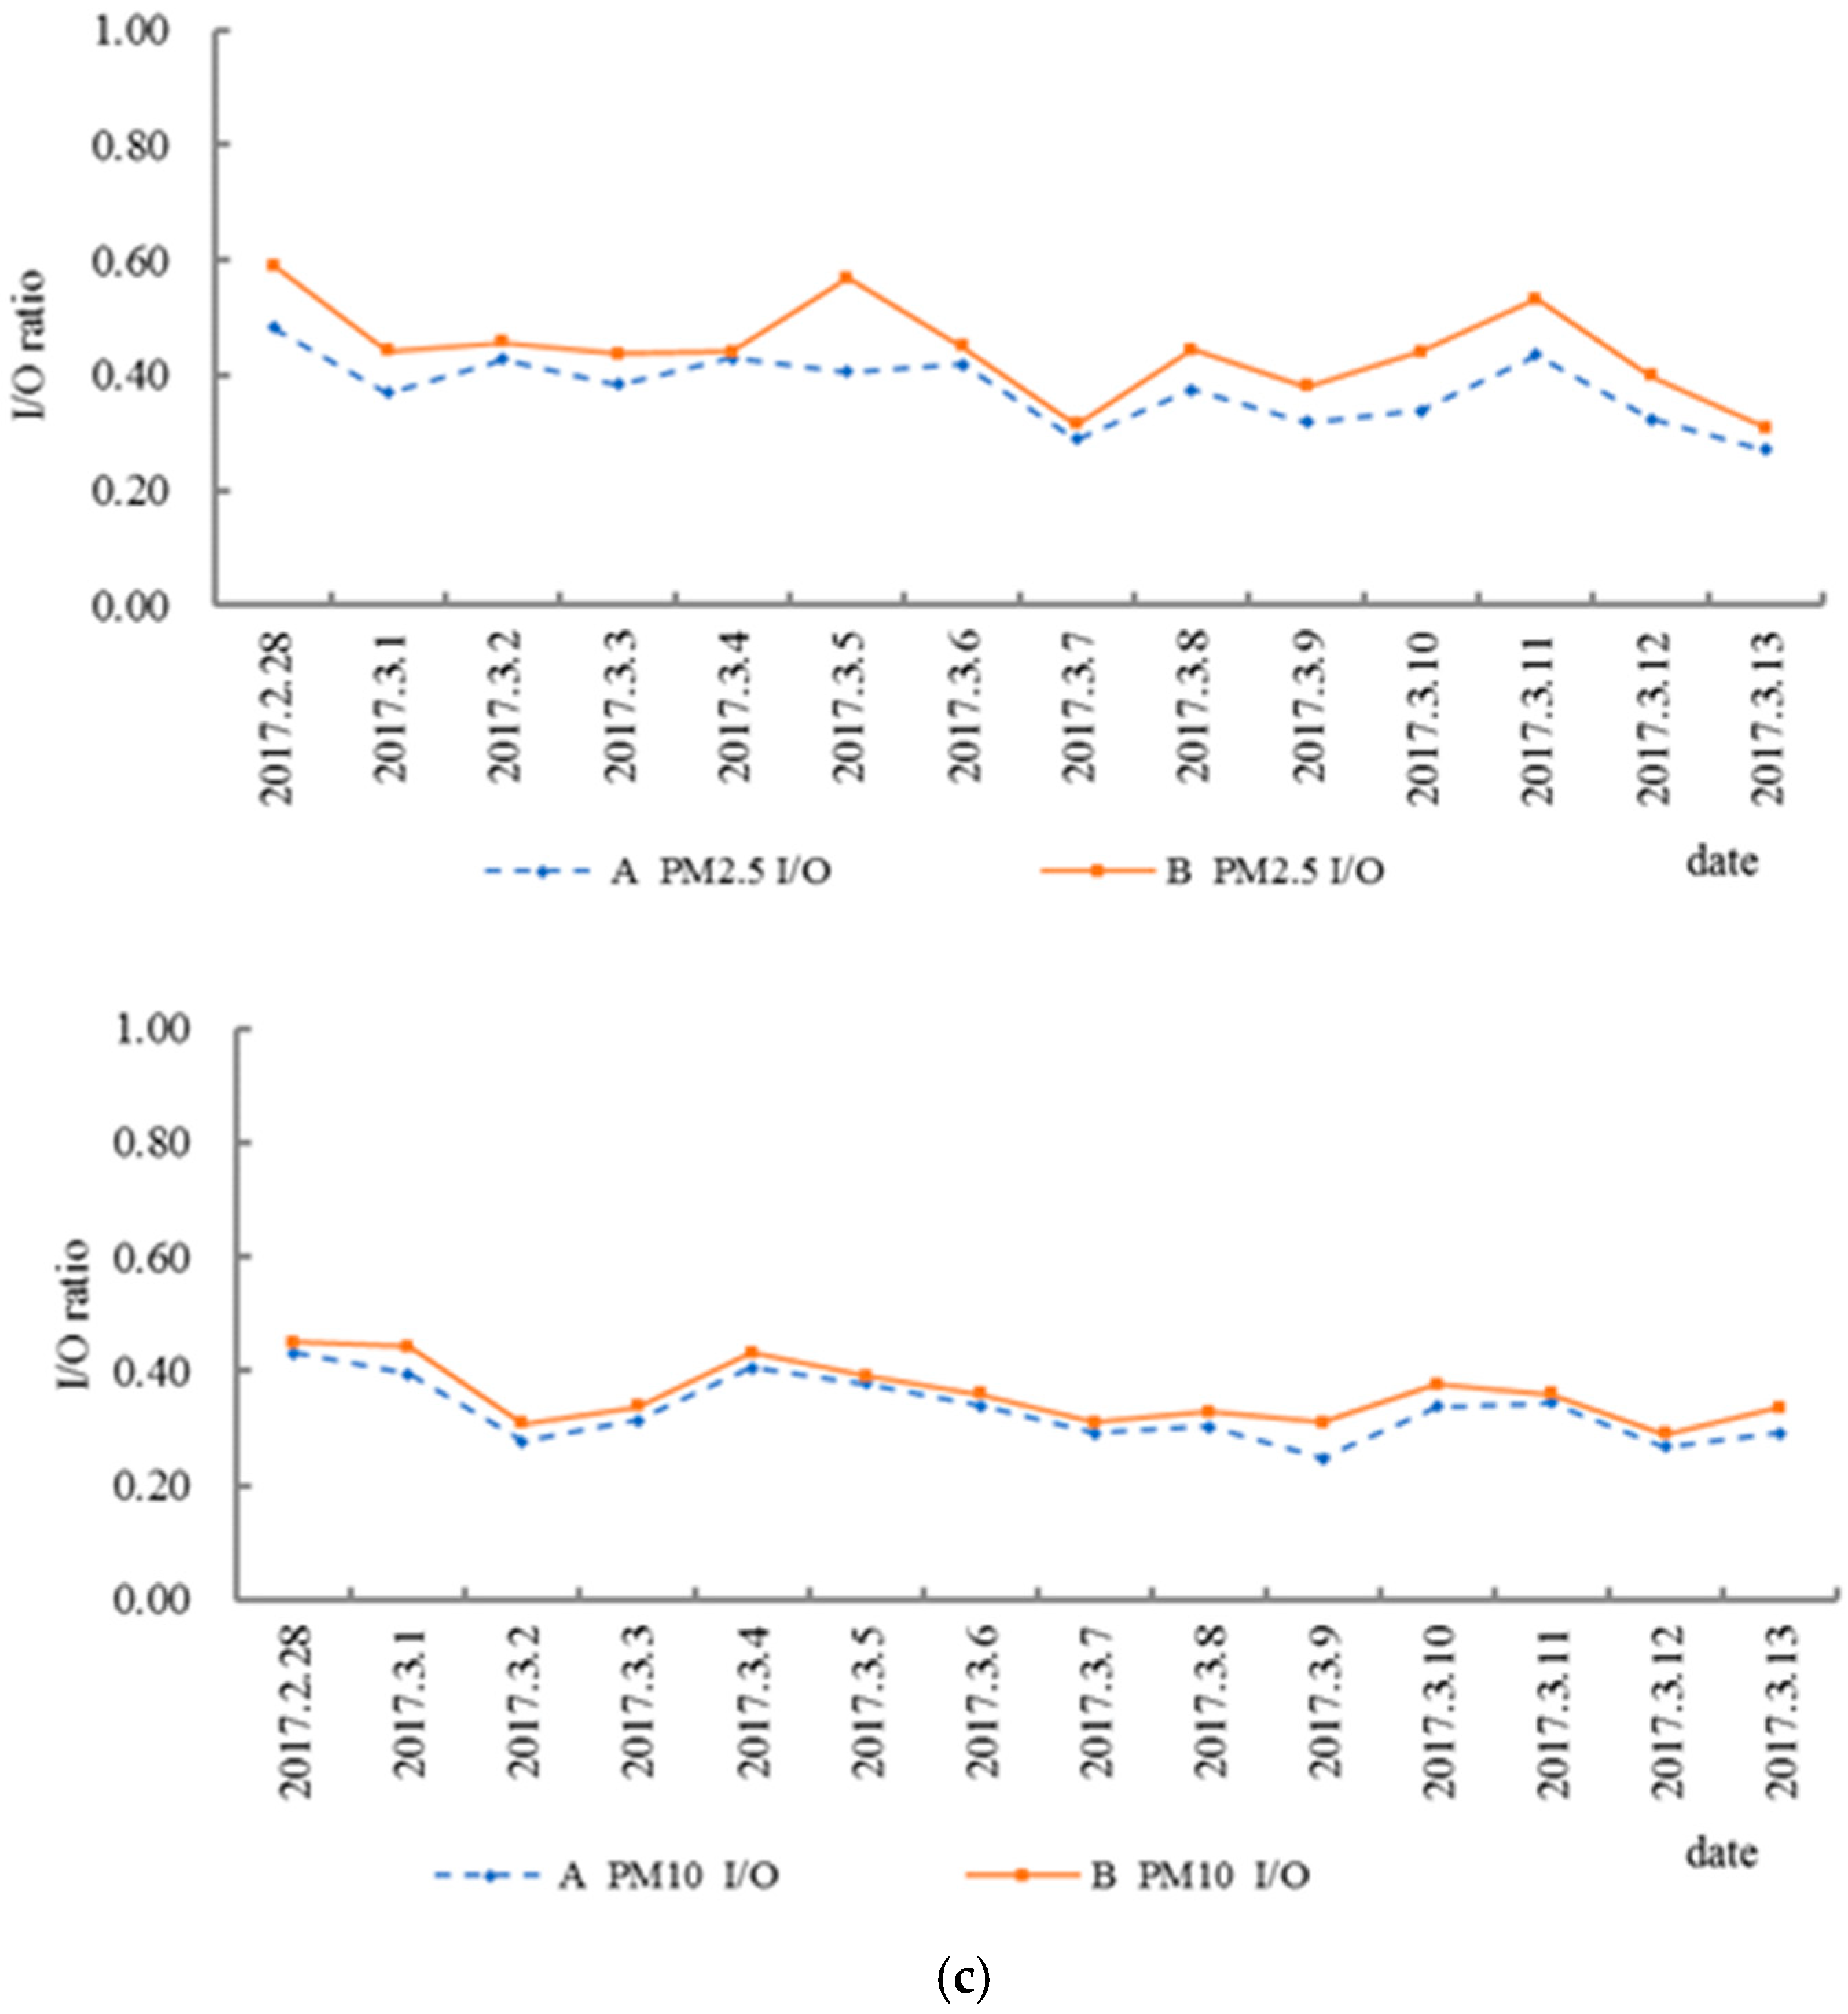
3.1. I/O Ratio
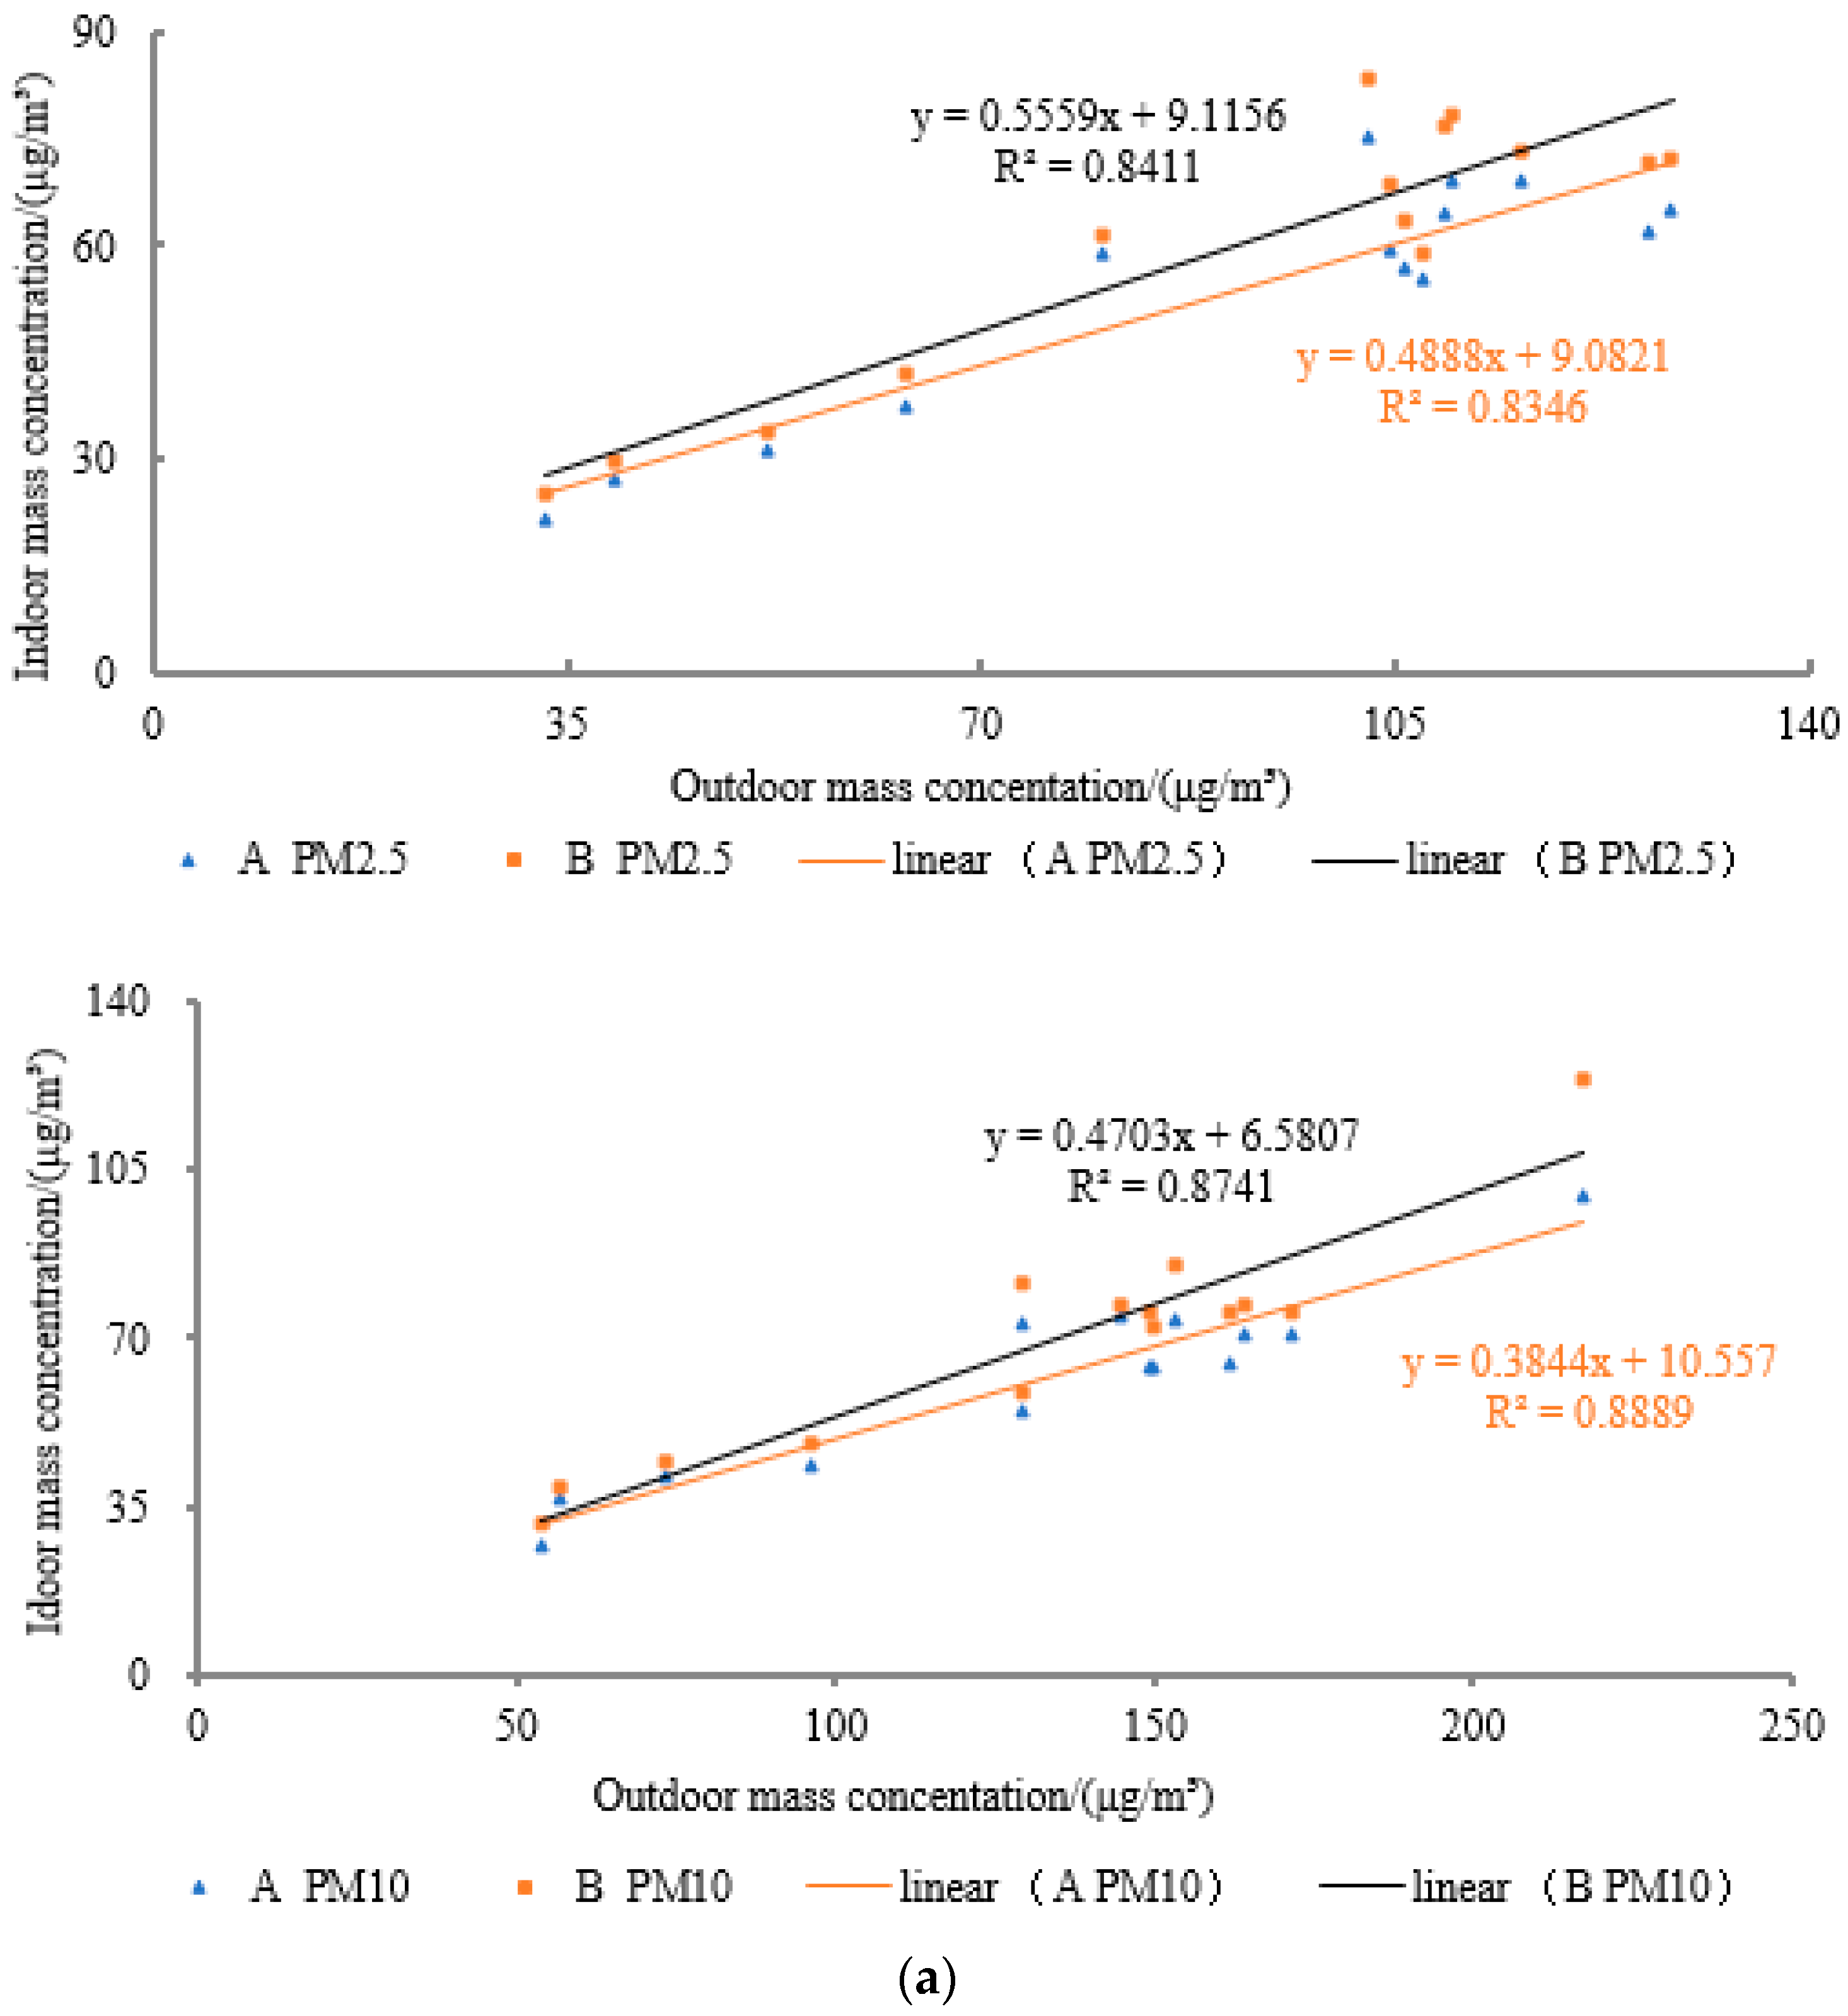
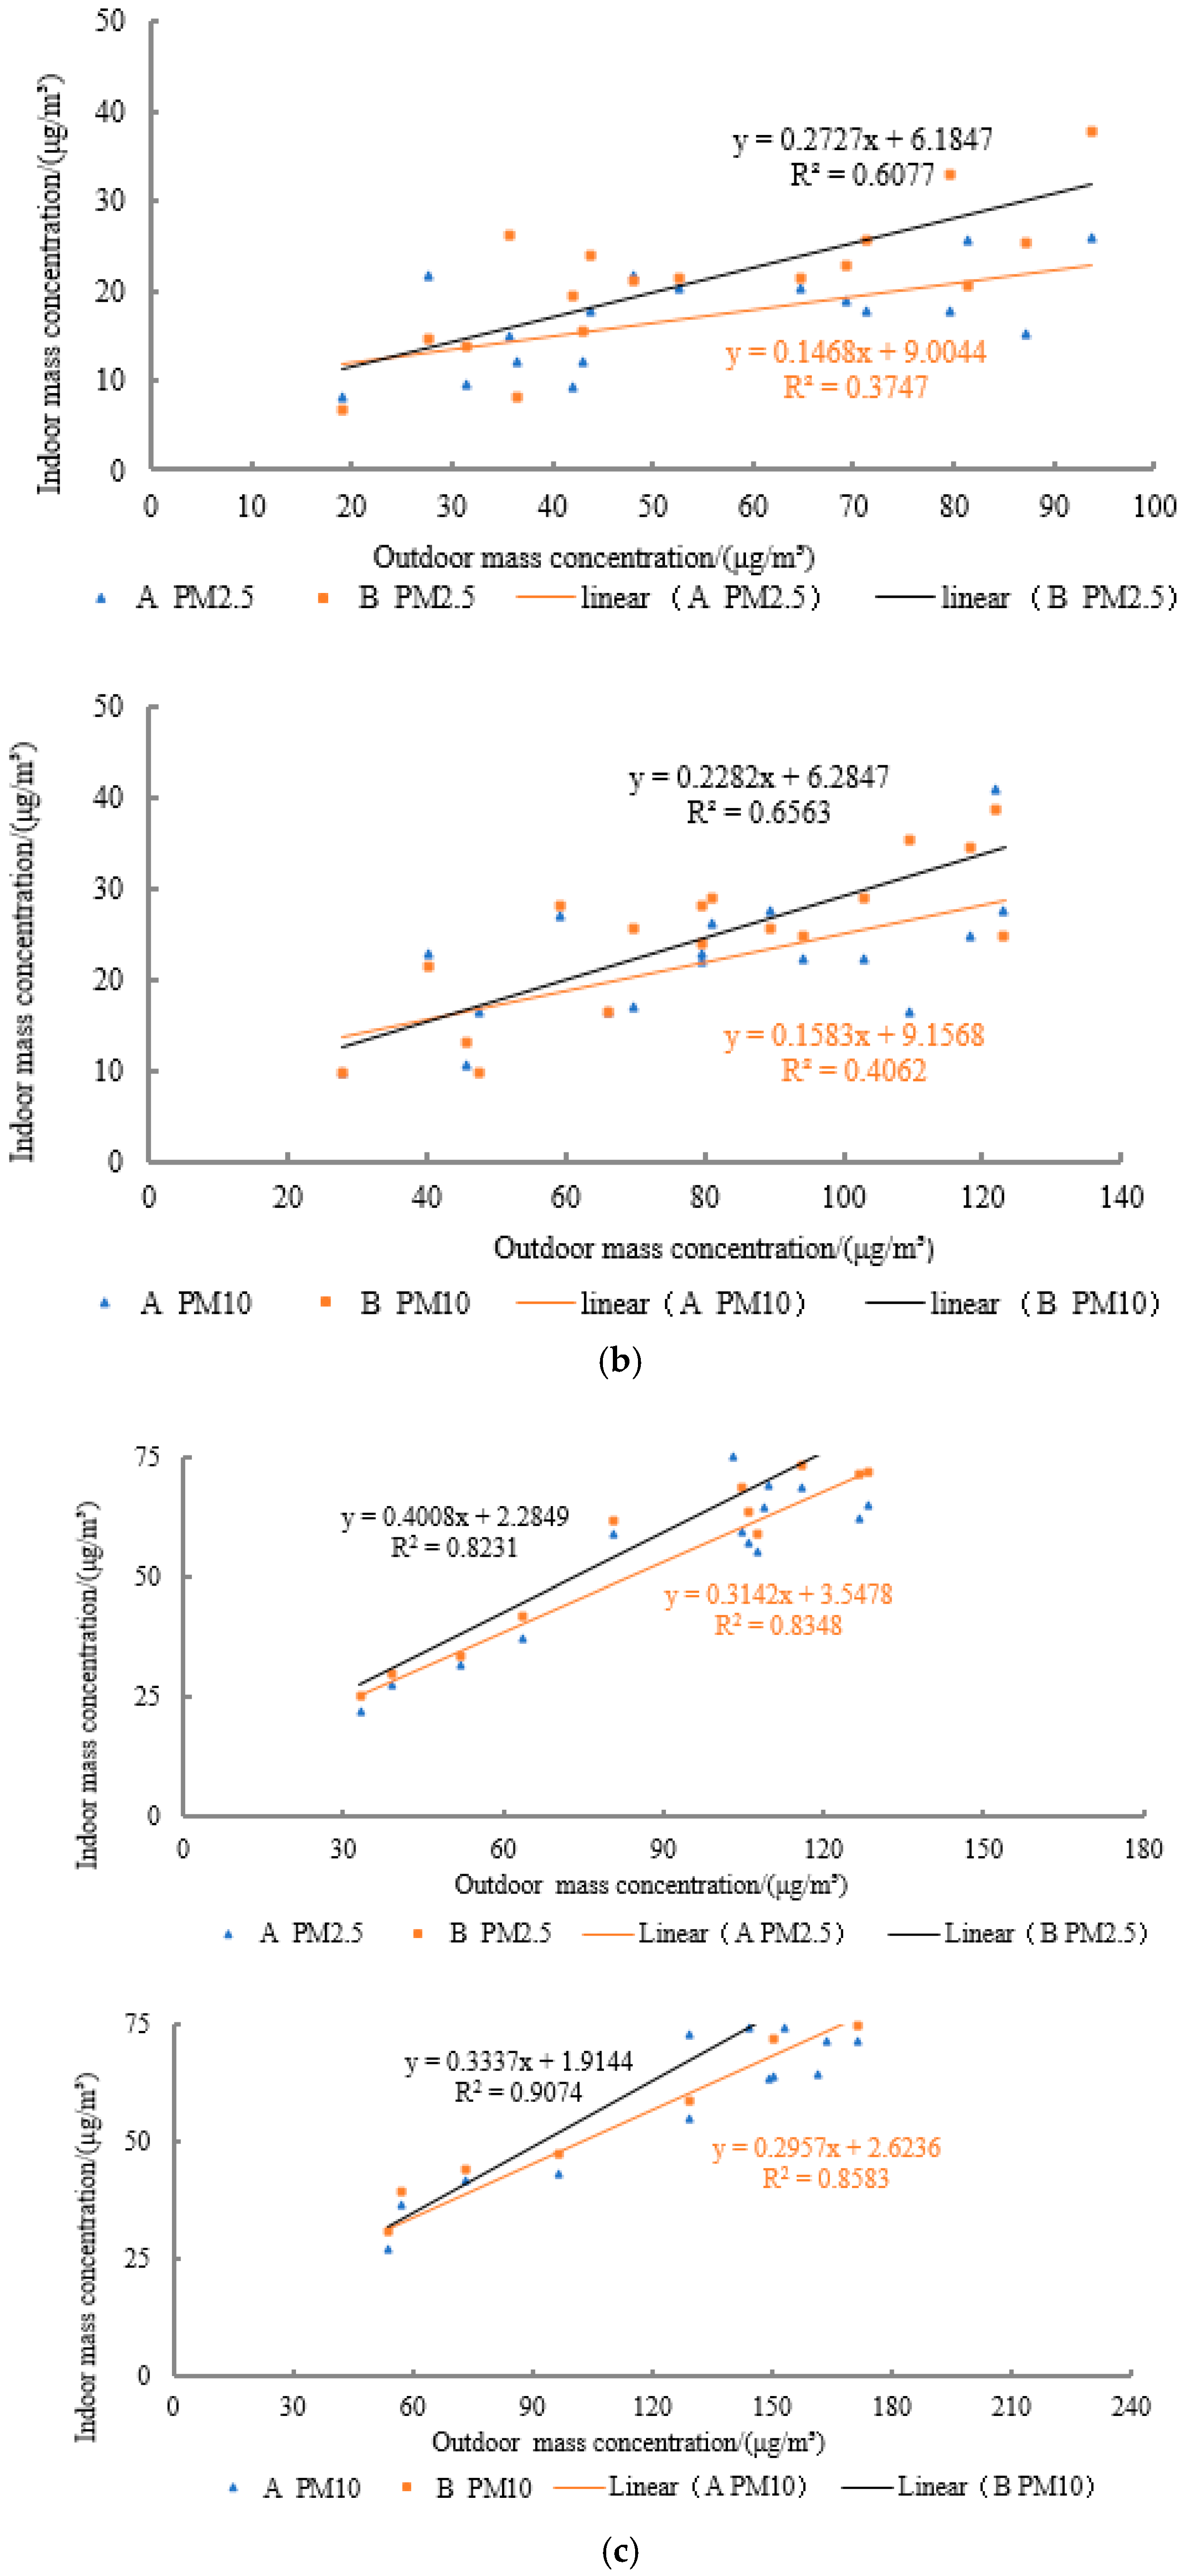
3.2. Linear Regression
4. Numerical Simulation Results
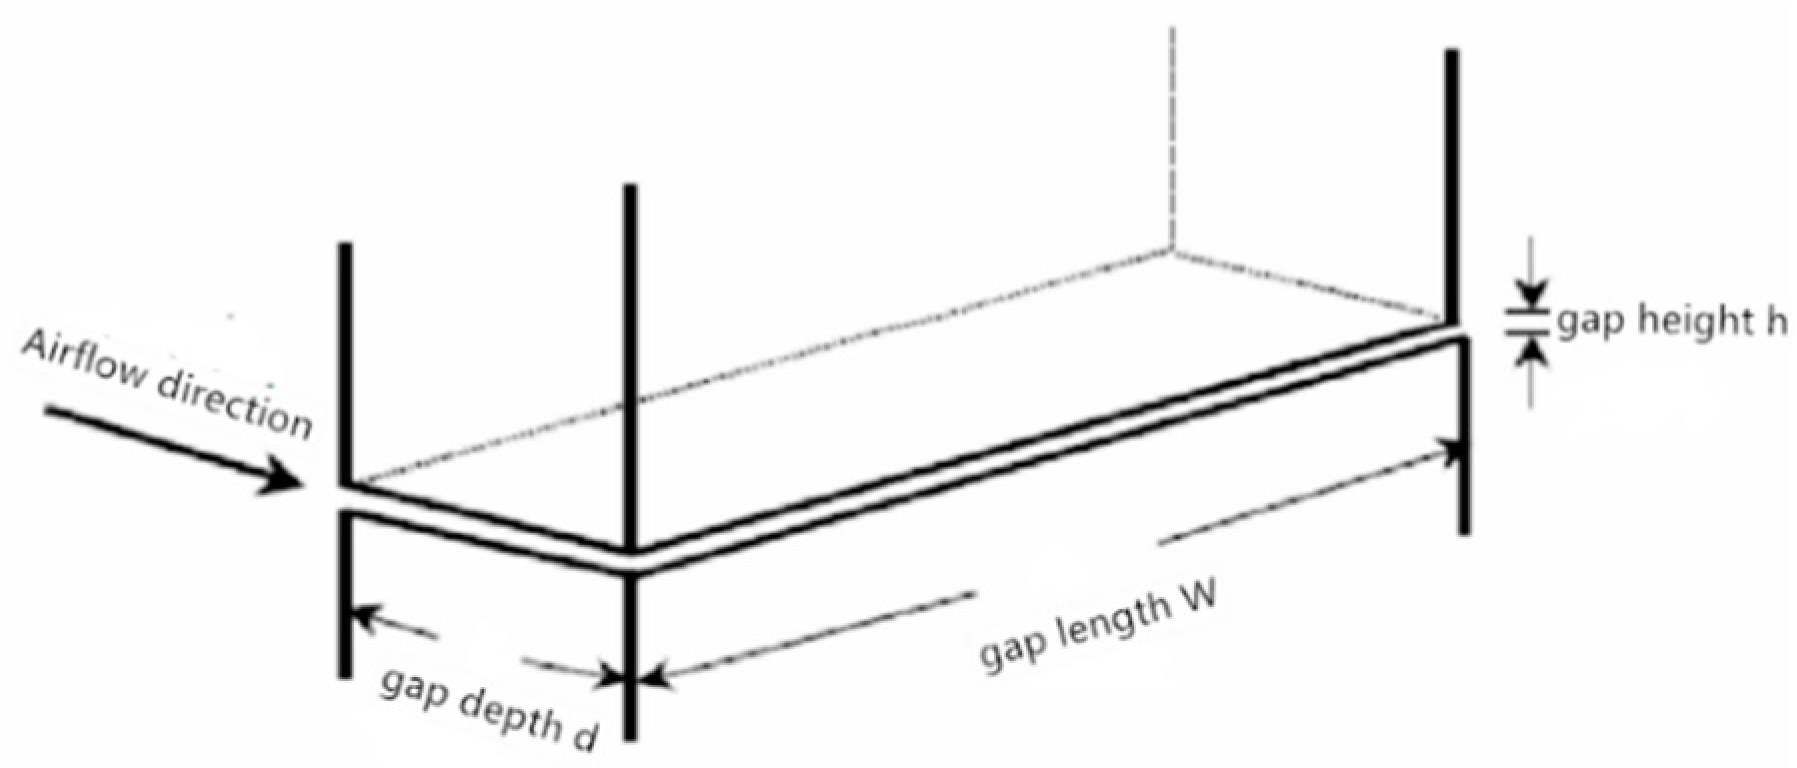
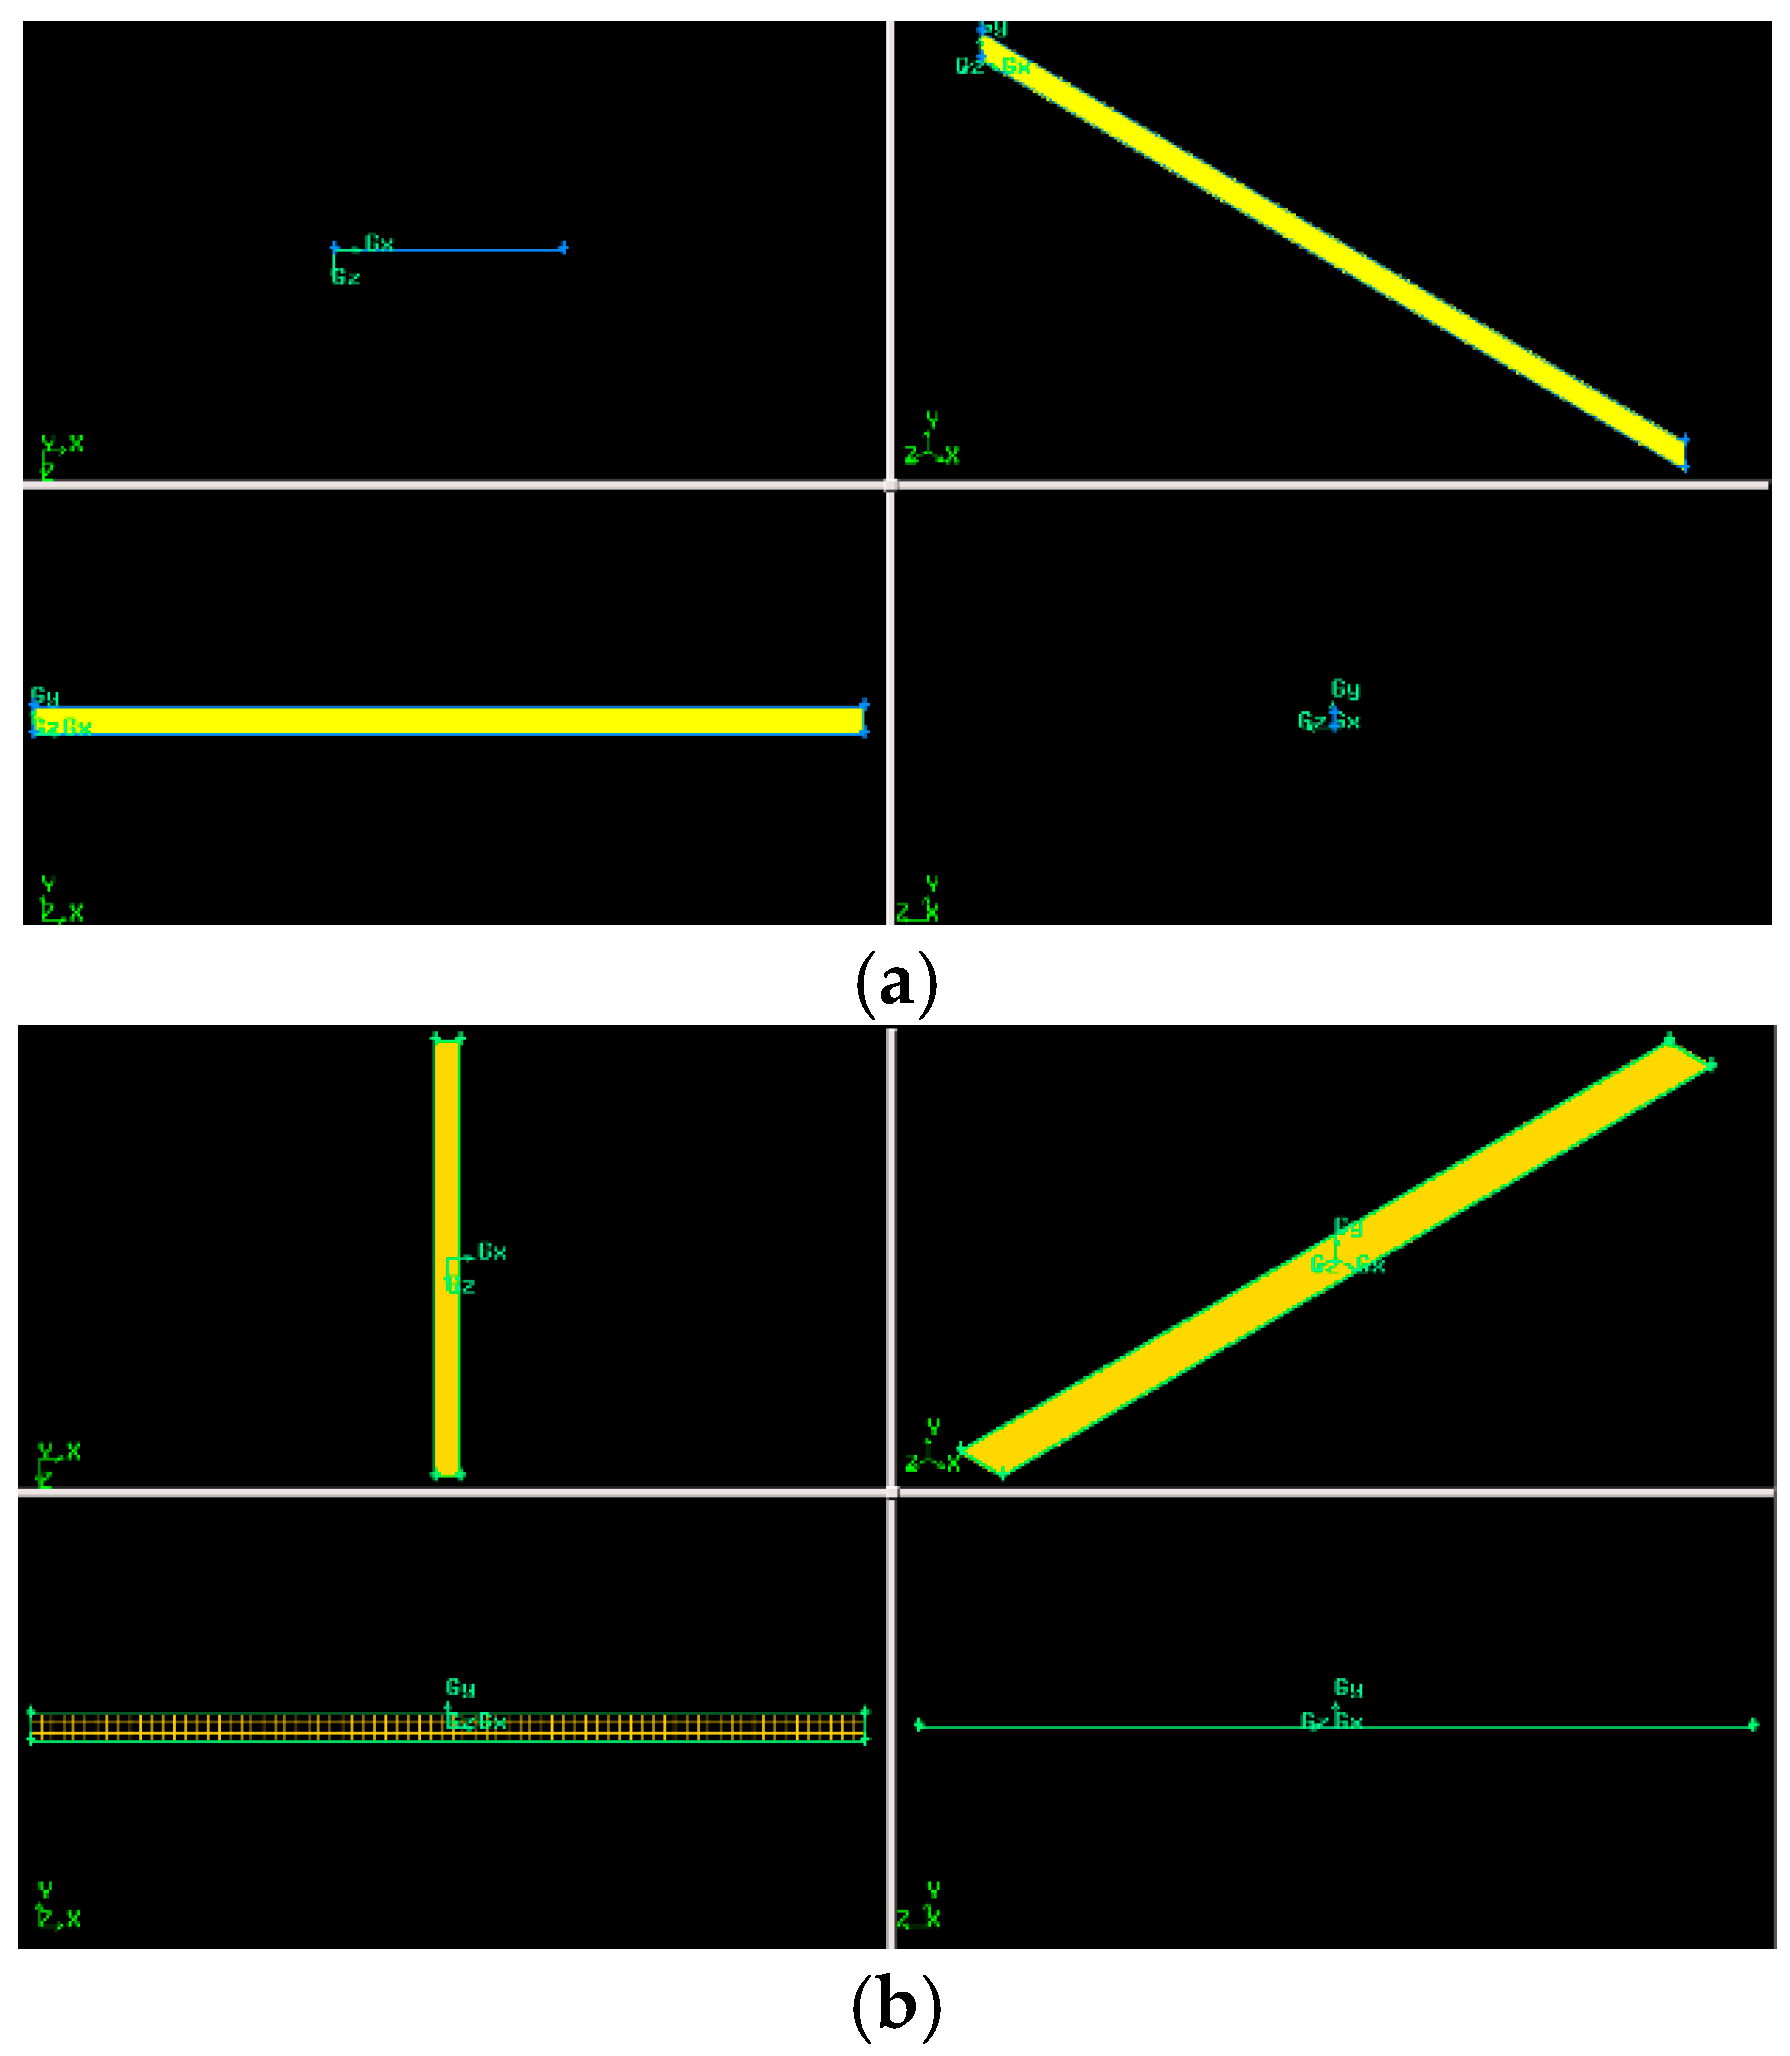
4.1. Principle of Calculation Model
4.2. Setting of Boundary Conditions and Basic Parameters
- (1)
- because the volume fraction of particulate matter in the atmosphere is very small, its subsidence had little effect on the laminar flow, and the effect of particulate matter on laminar flow was ignored (Table 6);
- (2)
- only the influence of gravity, Brownian force, and drag force on particles were considered;
- (3)
- the air passing through the gap was incompressible and met the Bussinesq approximation;
- (4)
- the heat transfer between the air and particulate matter was ignored;
- (5)
- the particles were spherical smooth particles (spherical);
- (6)
- the particles were not charged and there was no electrostatic friction, condensation, collision, or chemical reaction among them, and the particle size did not change during the penetration process;
- (7)
- the particles were inert particles.
- (1)
- inlet: the continuous phase air is set as “velocity-inlet” and the discrete phase particle is set as “escape”;
- (2)
- solid wall: the continuous phase air boundary condition is “no slip (fixed boundary)” and the discrete phase particle boundary condition is “trap”;
- (3)
- export (outlet): continuous phase boundary condition is set as free air flow (outflow) and the discrete phase particles are set as “escape” (escape).
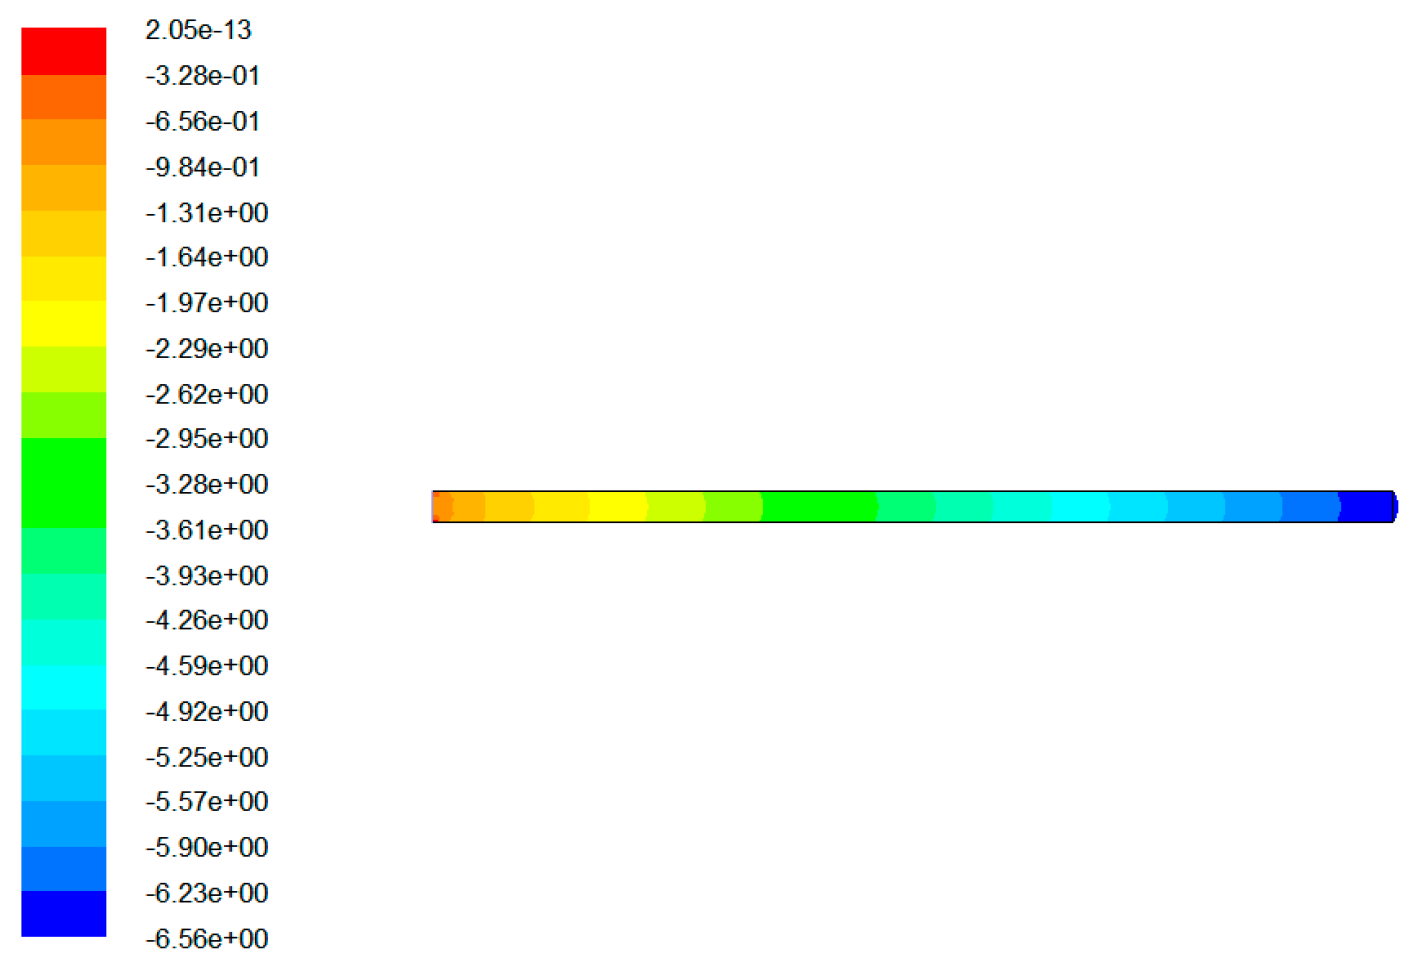
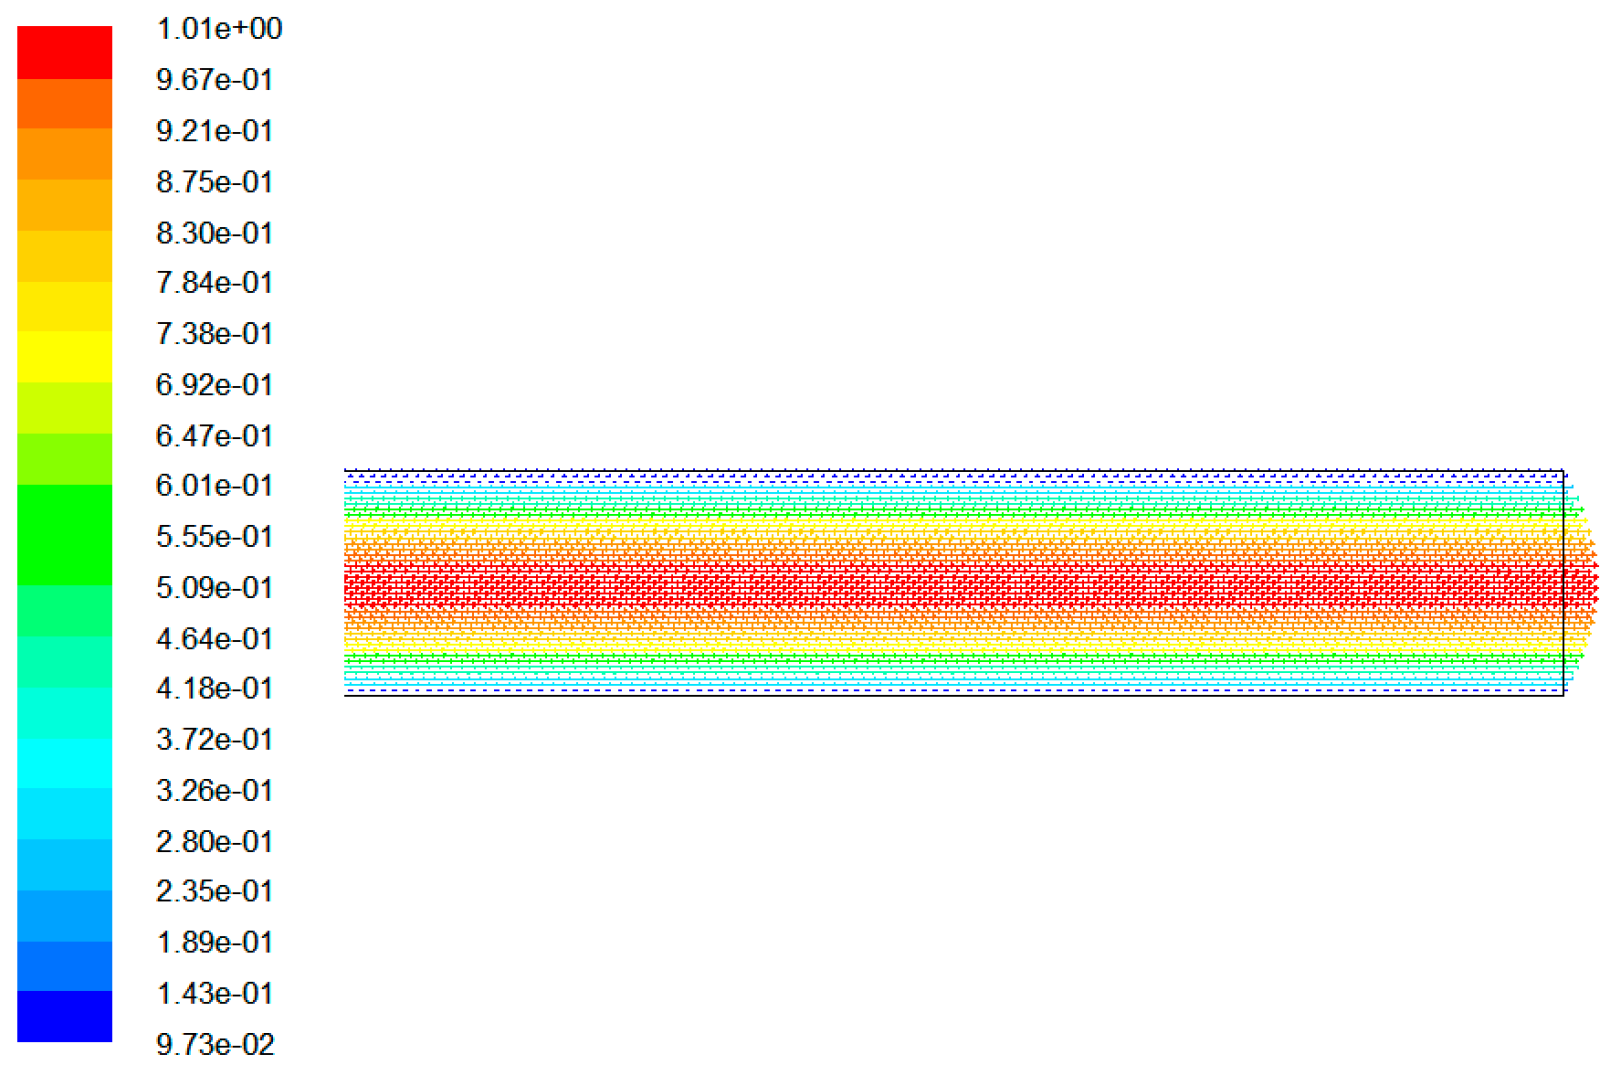
4.3. Simulation Results
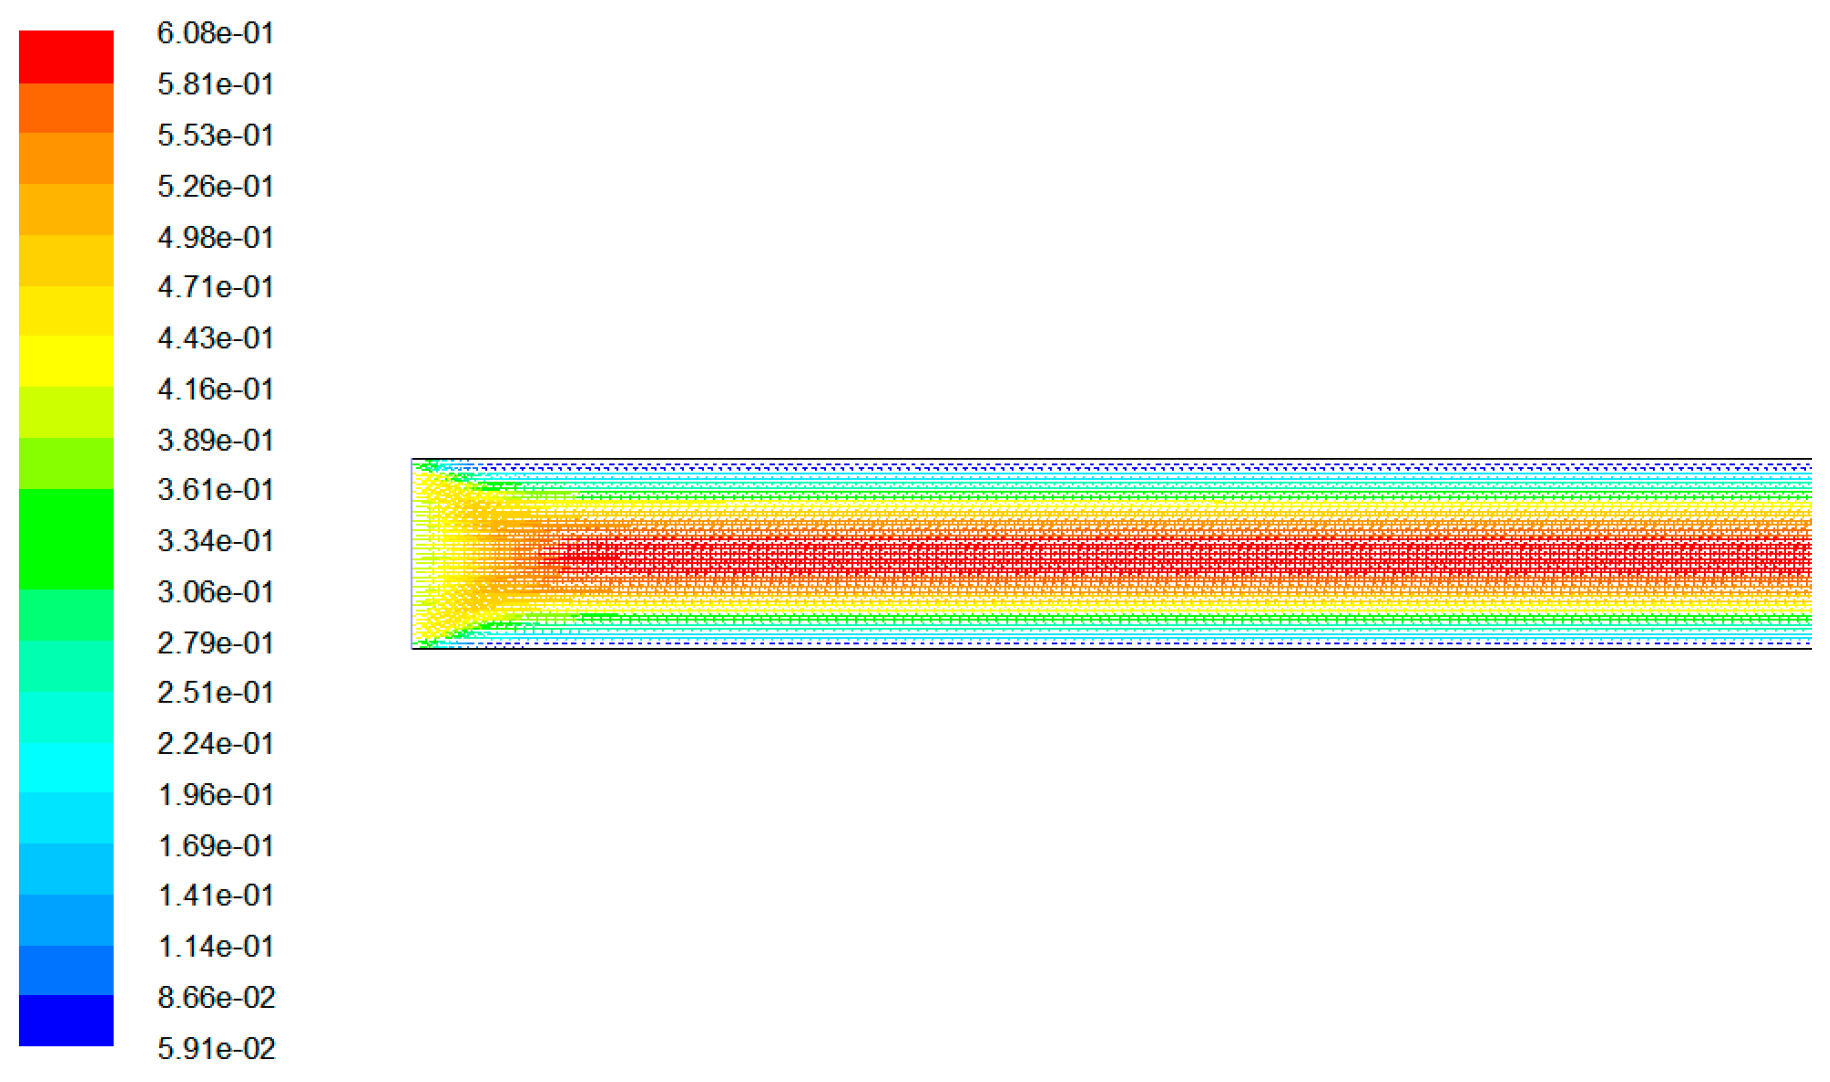
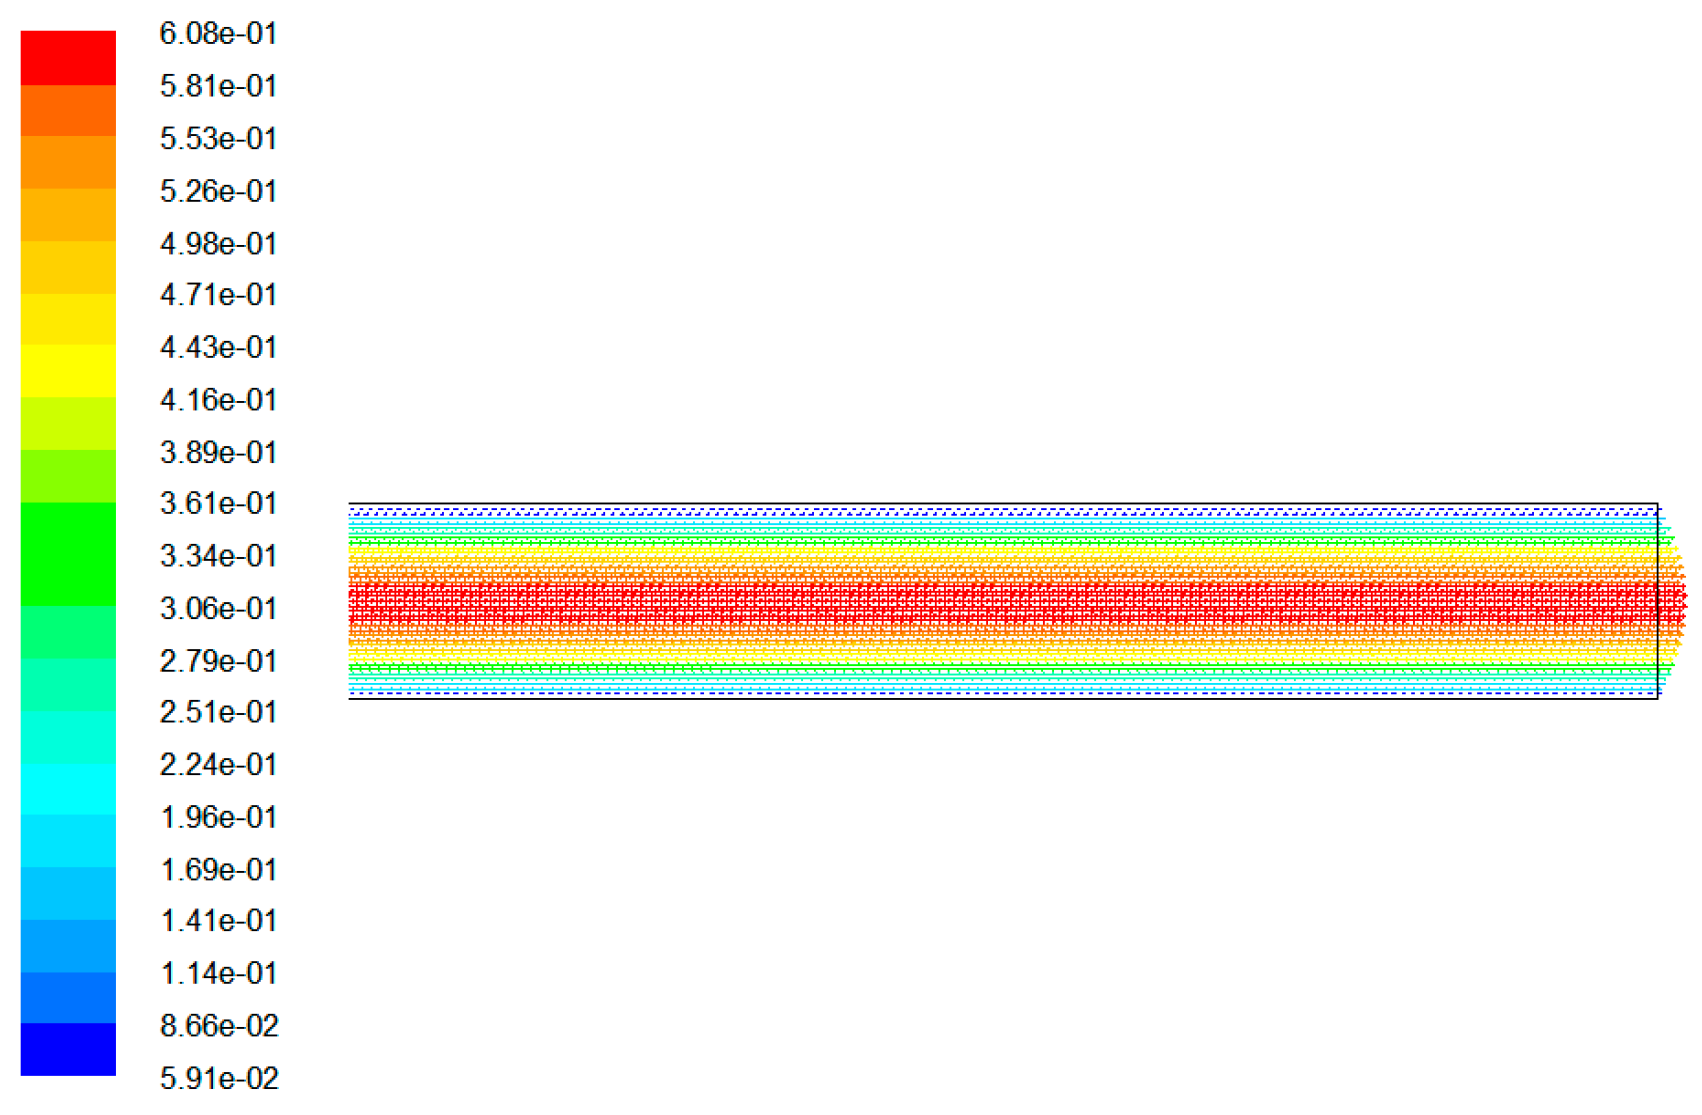
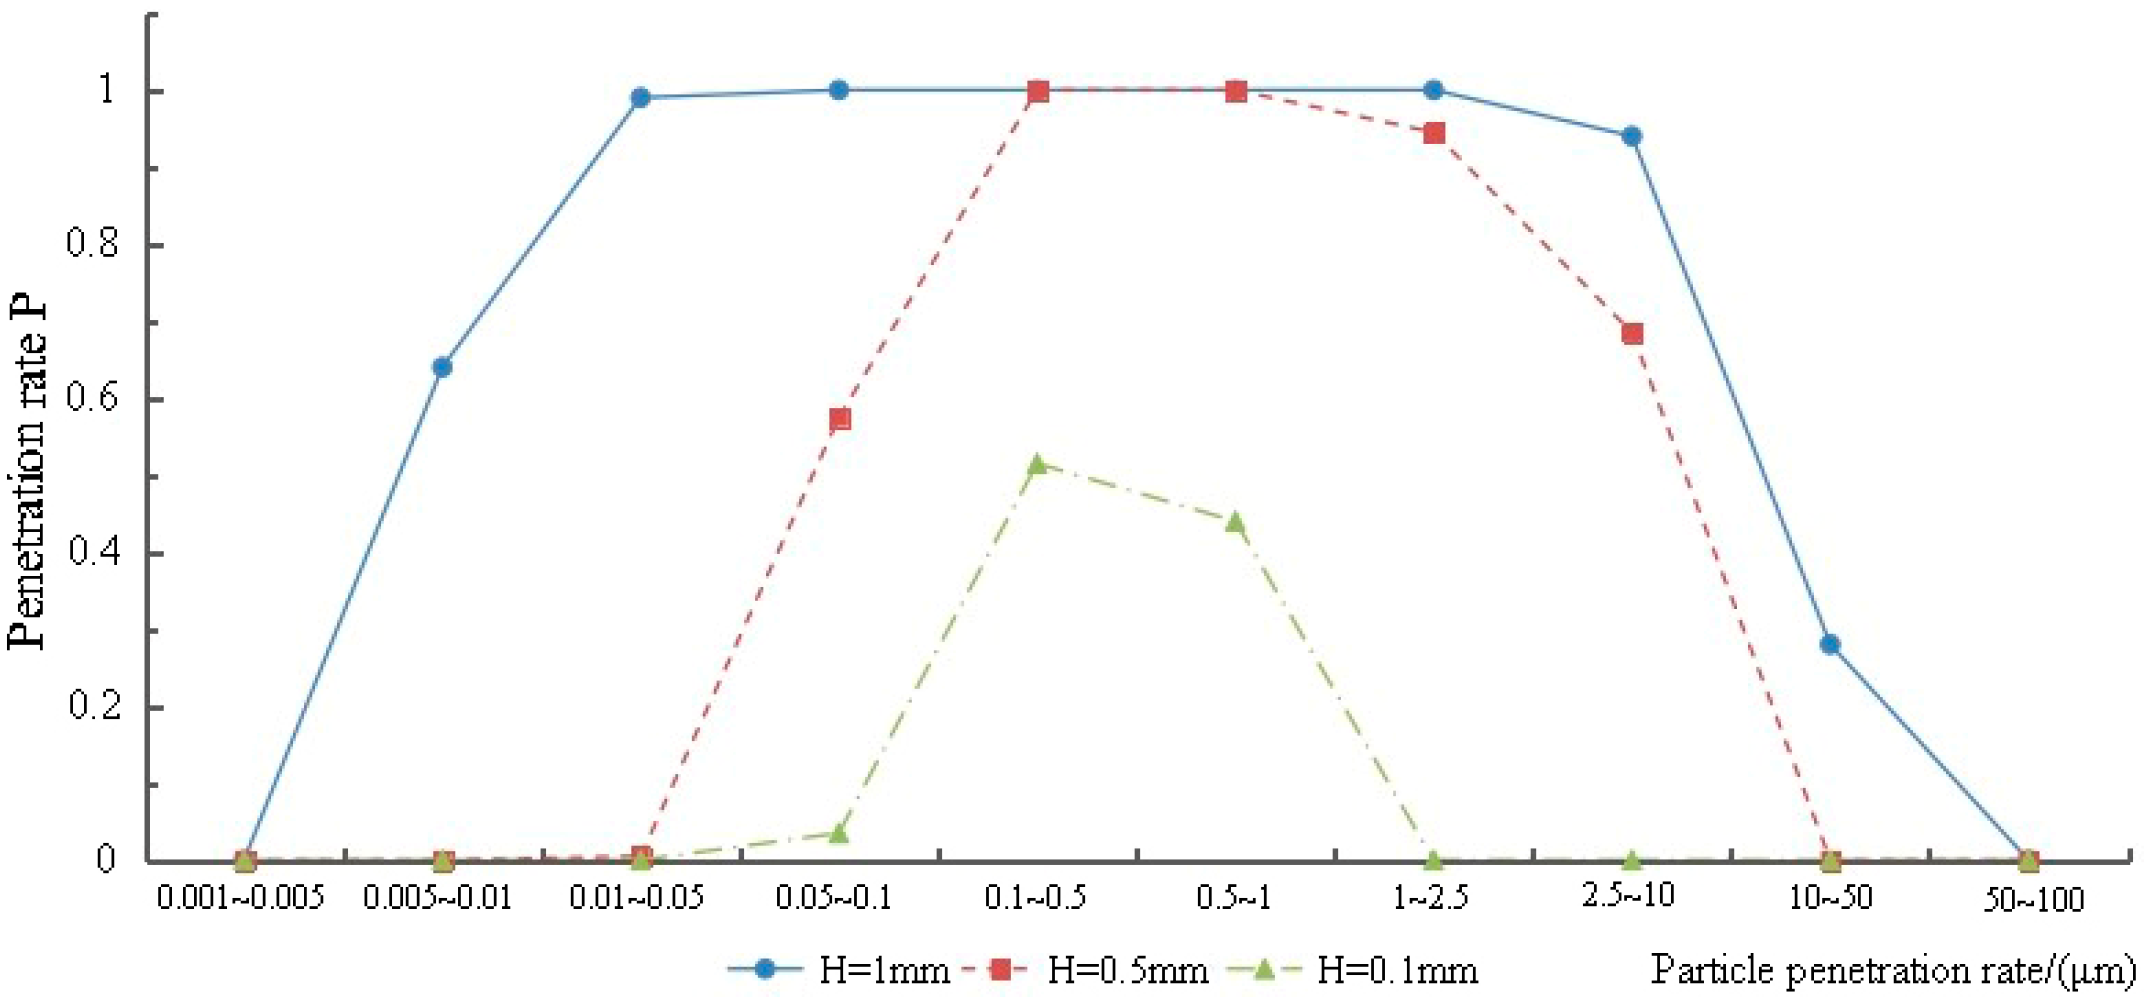
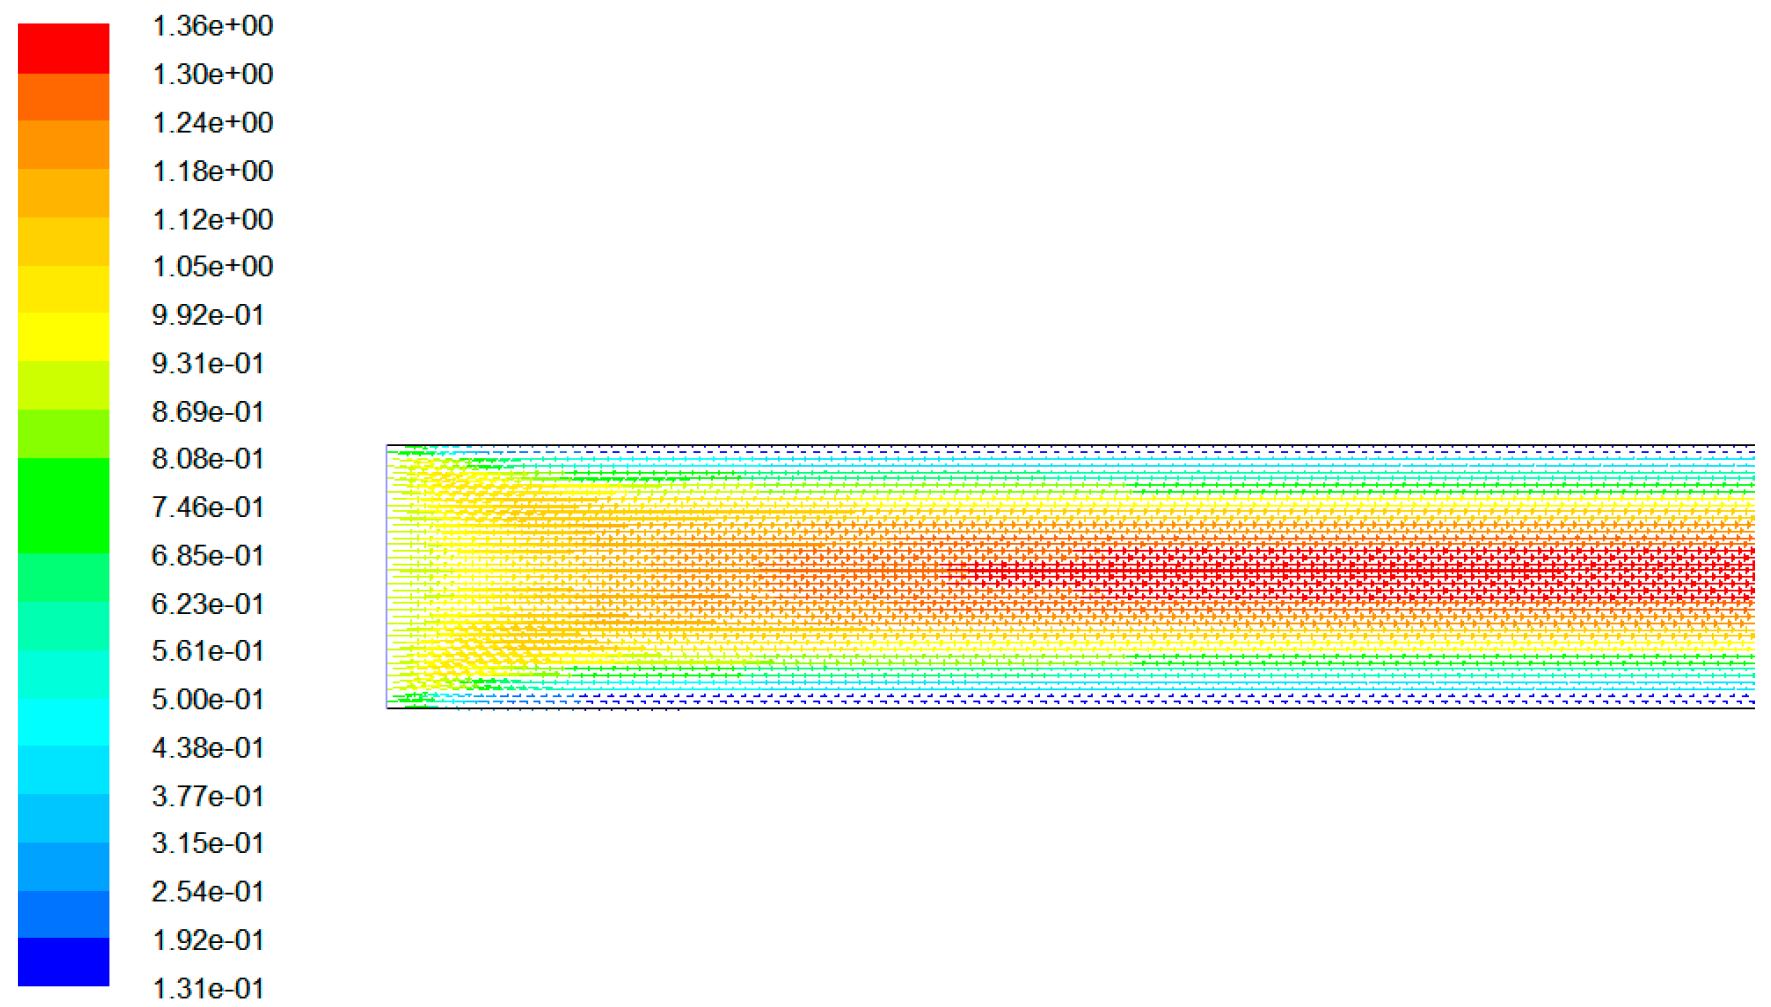
4.3.1. Influence of Gap Height on Penetration Coefficient
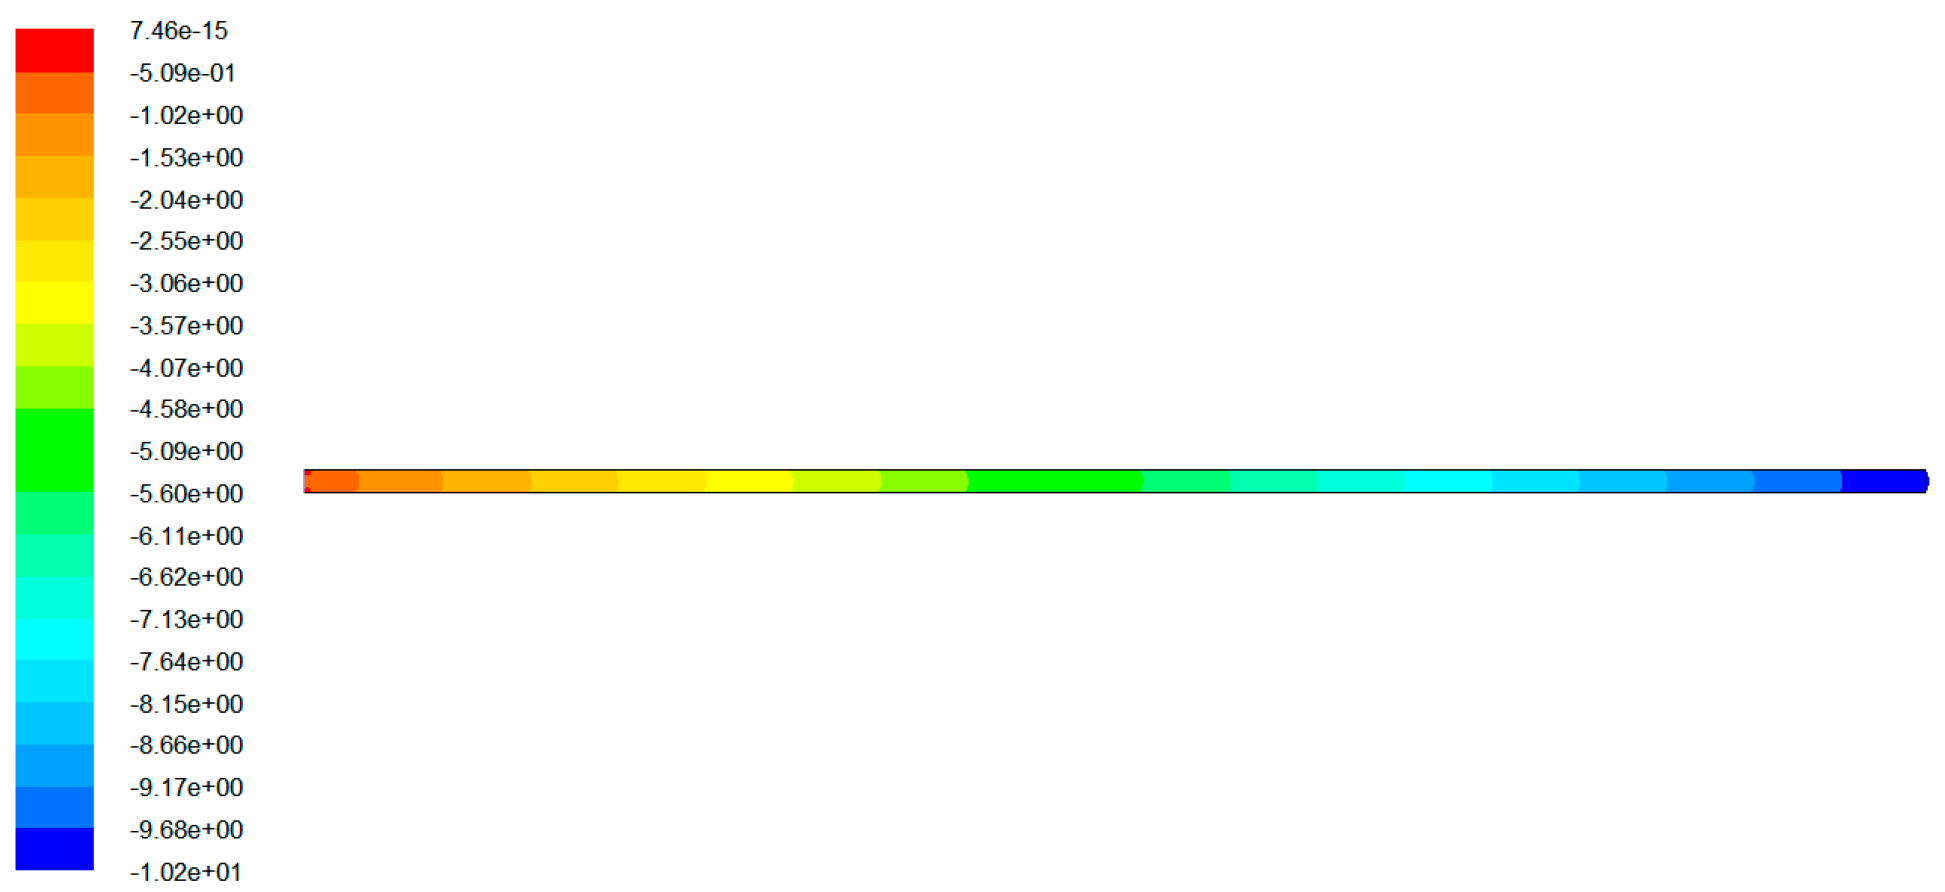
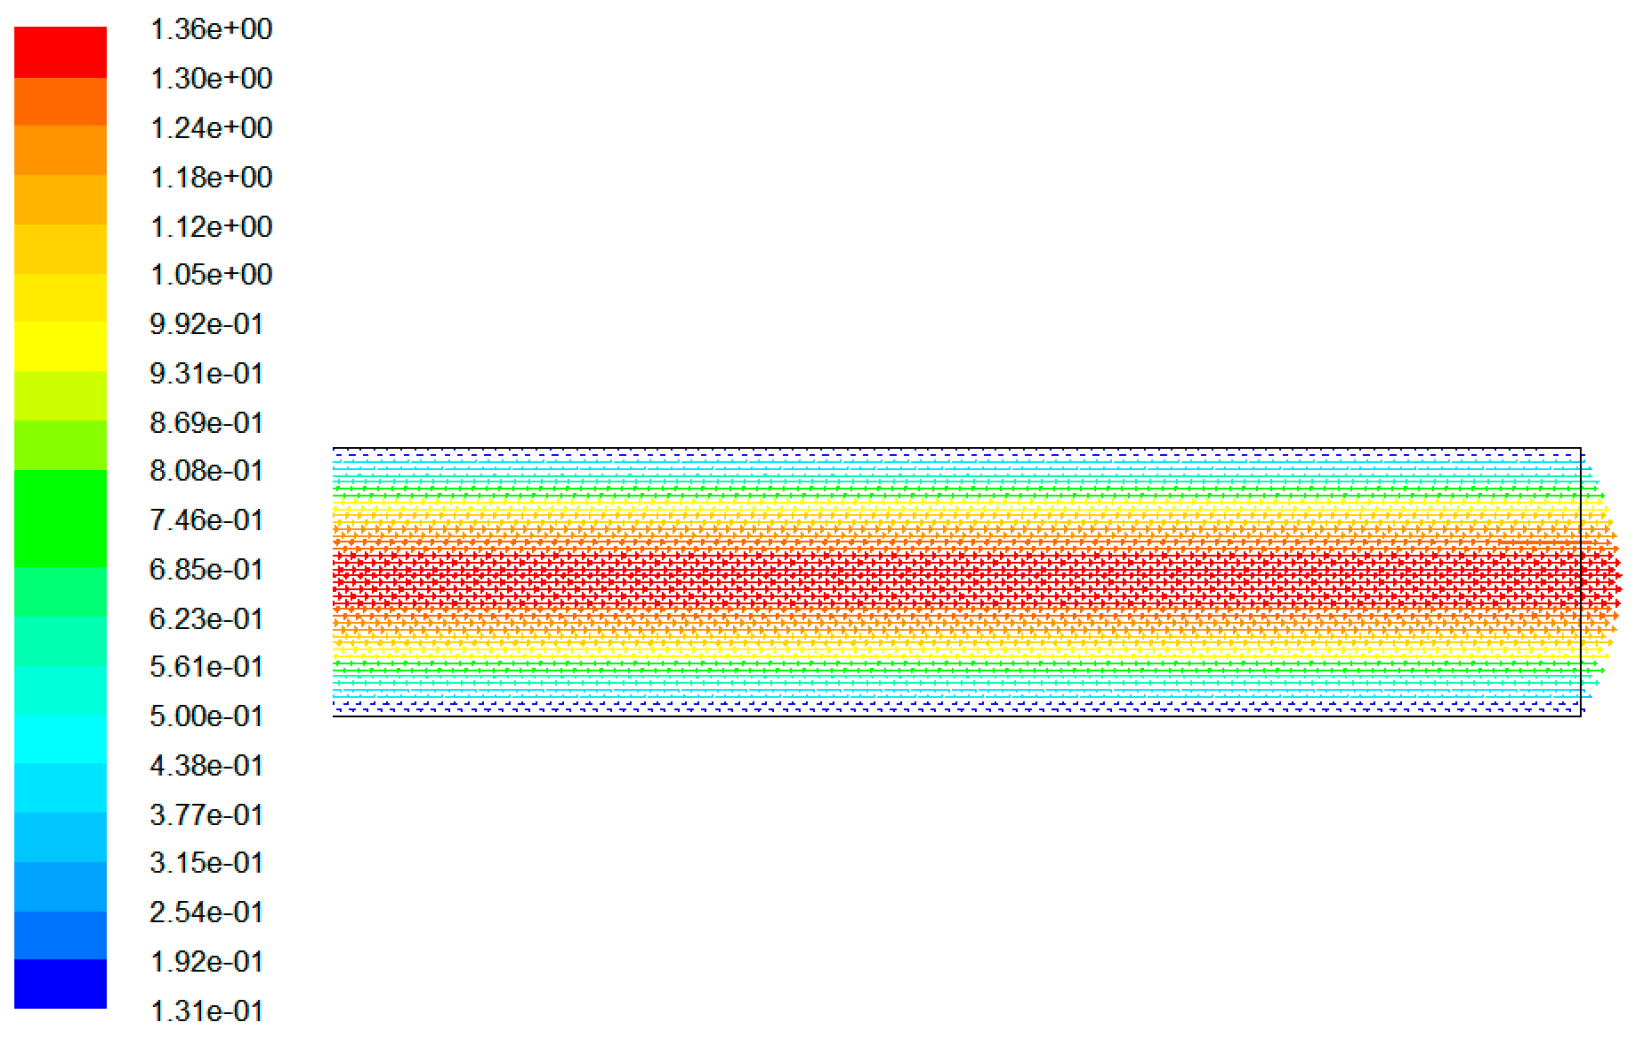
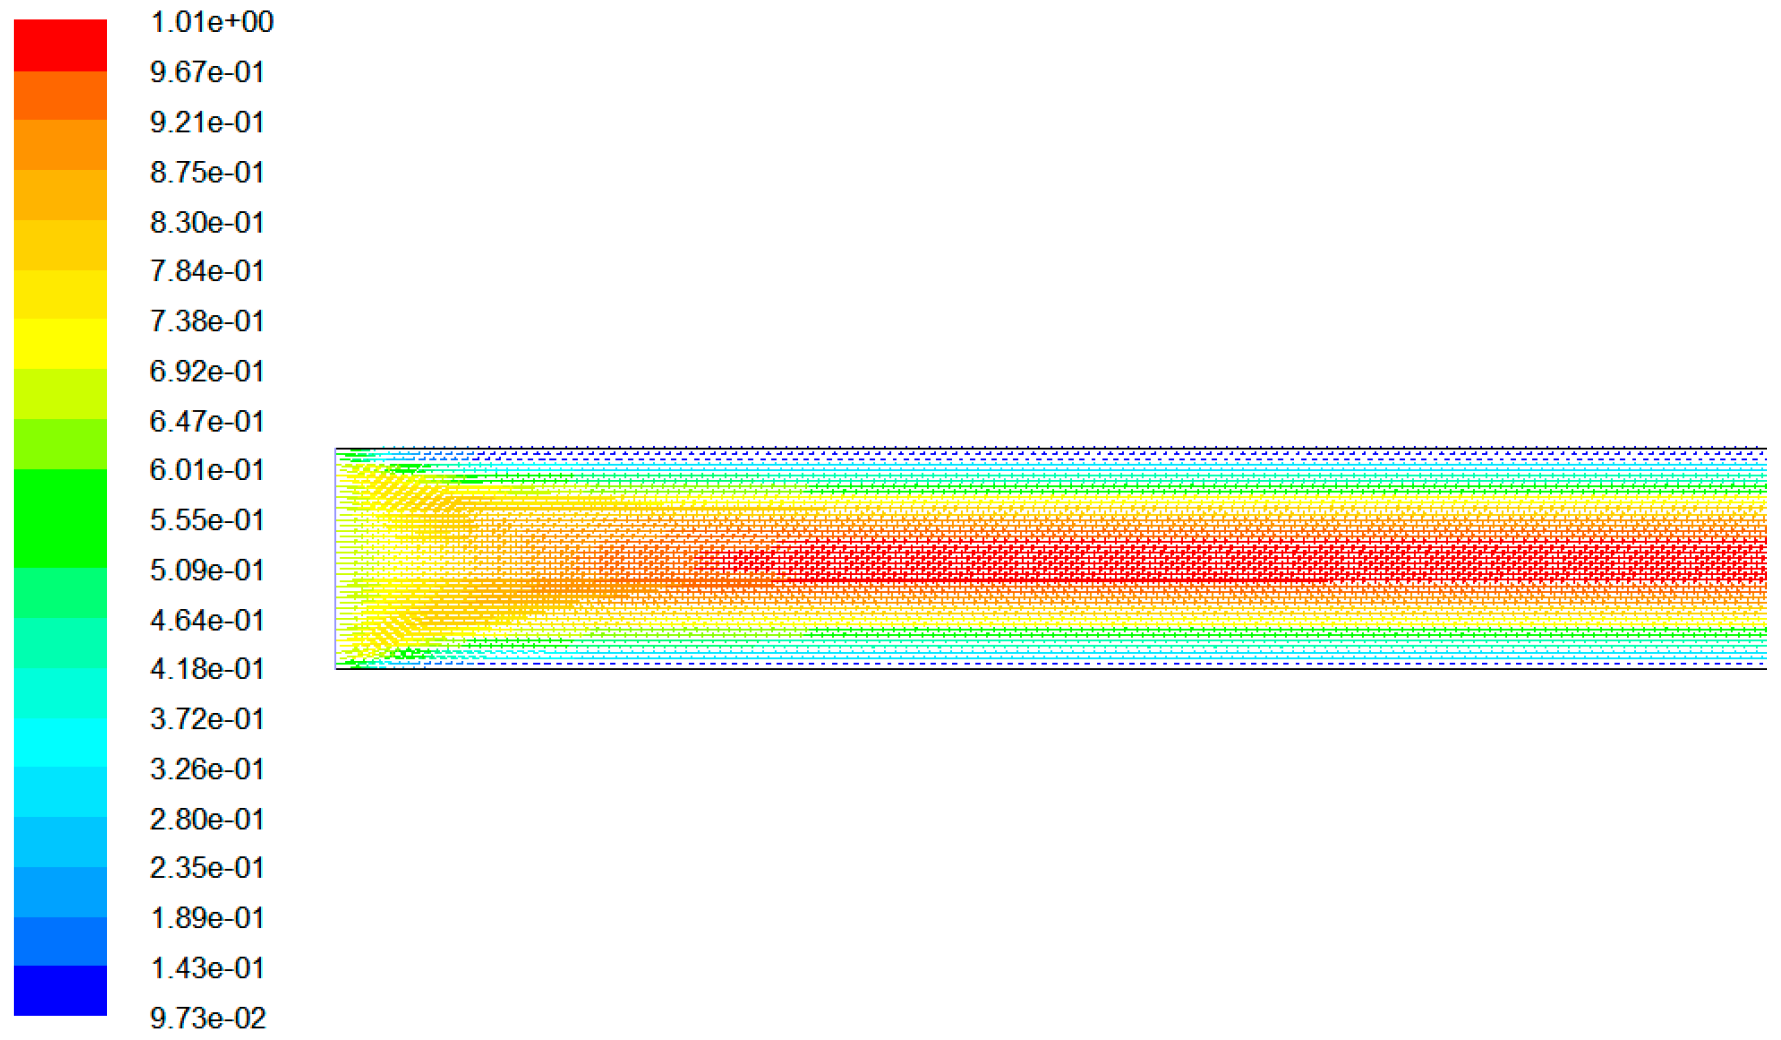
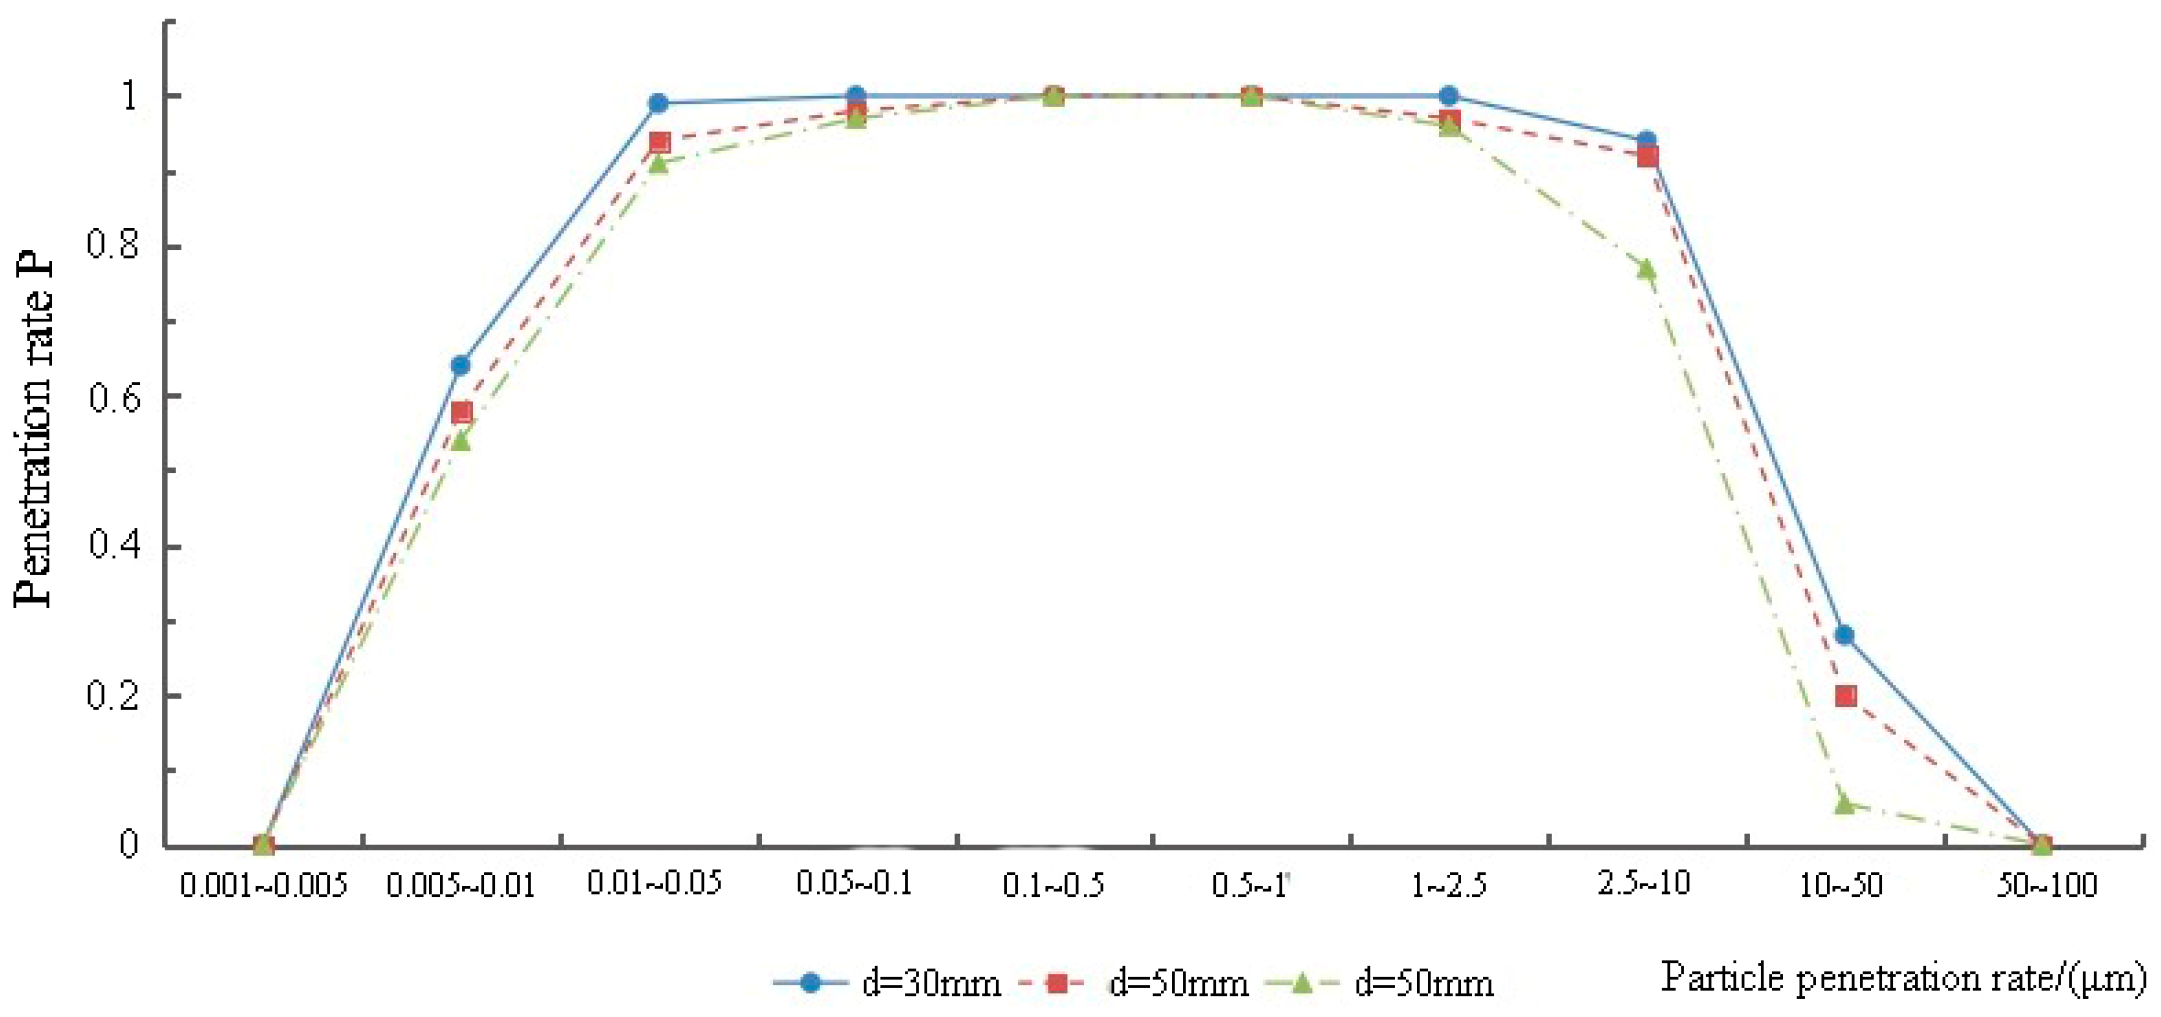
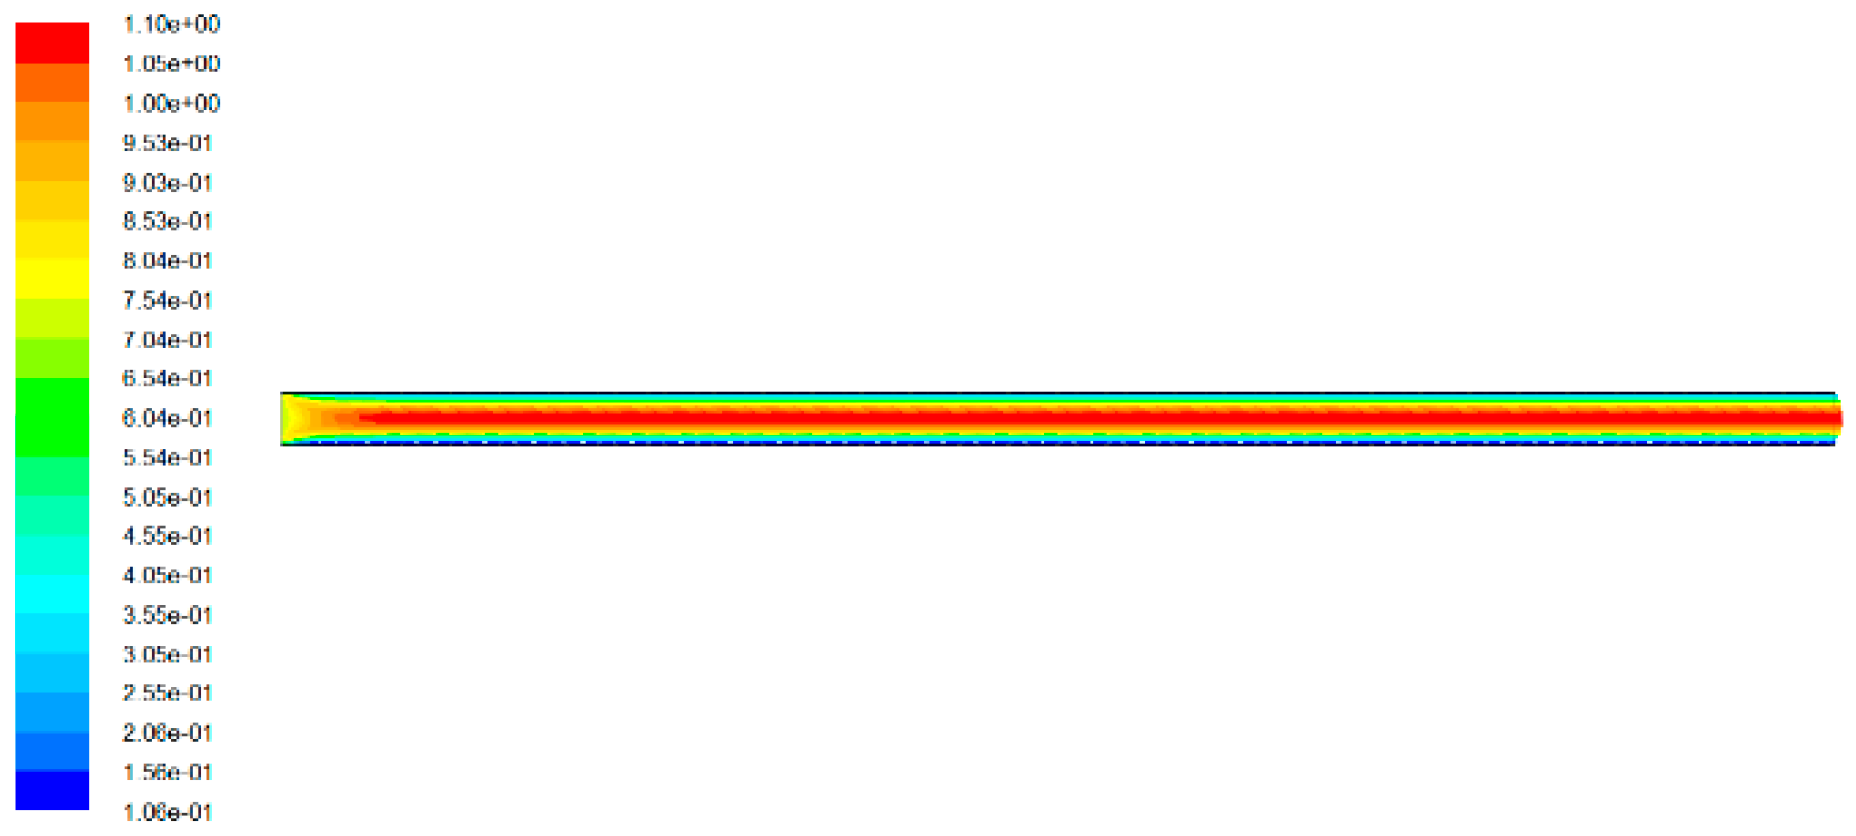
4.3.2. Influence of Gap Depth on Penetration Coefficient
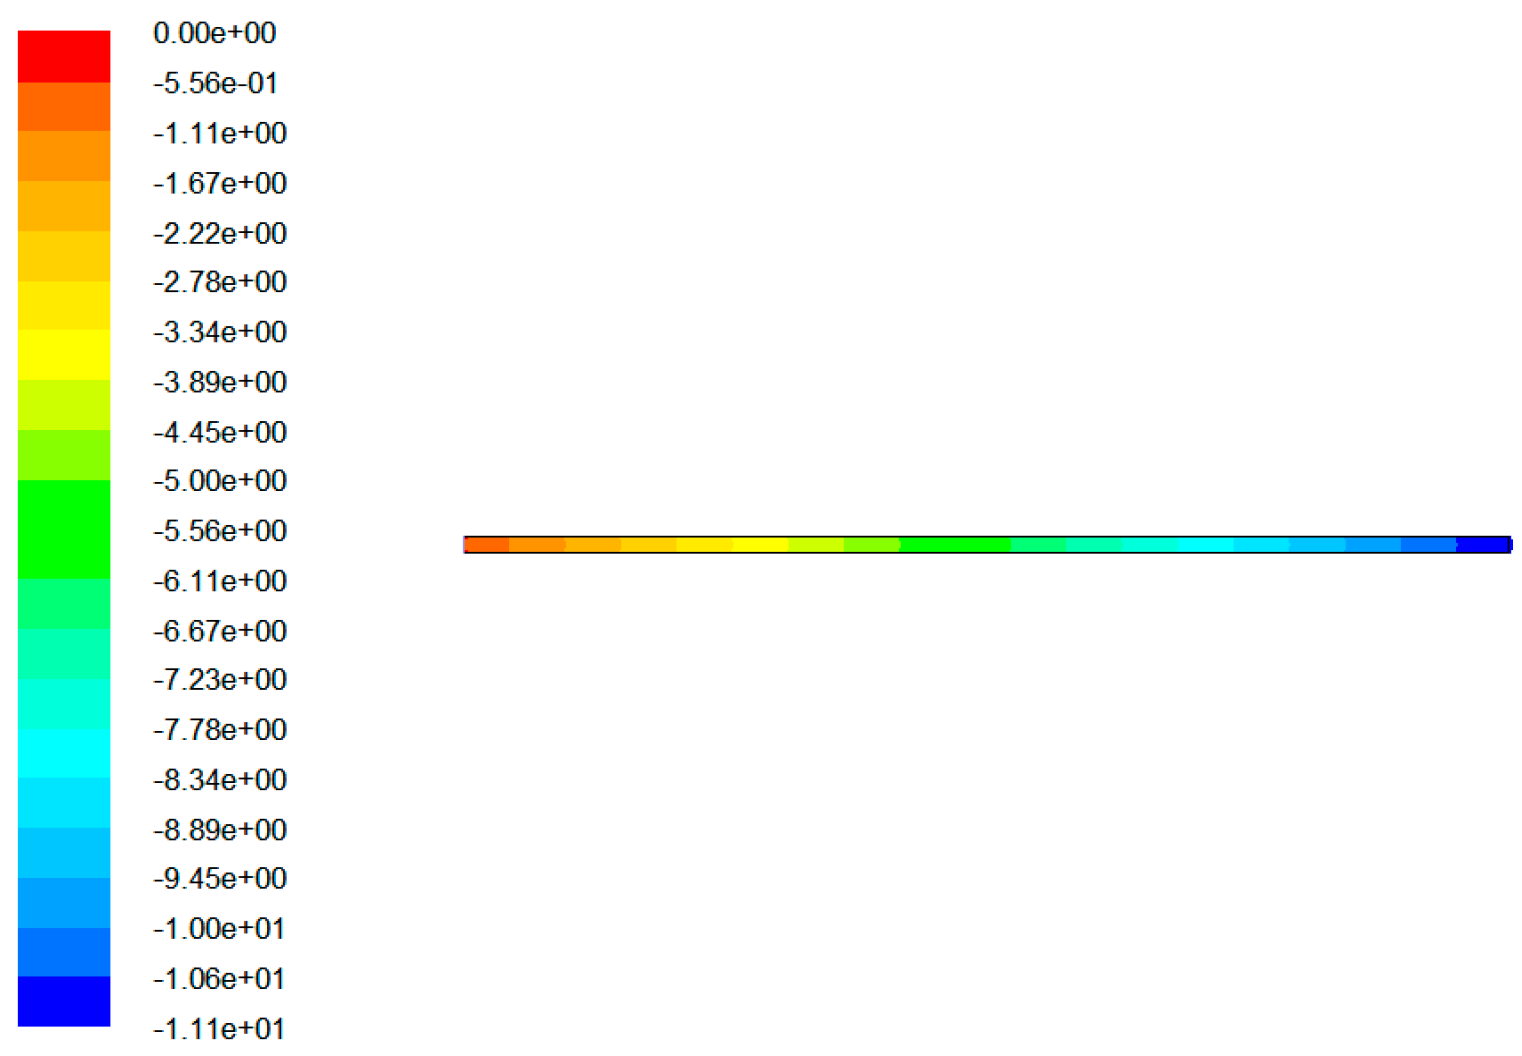
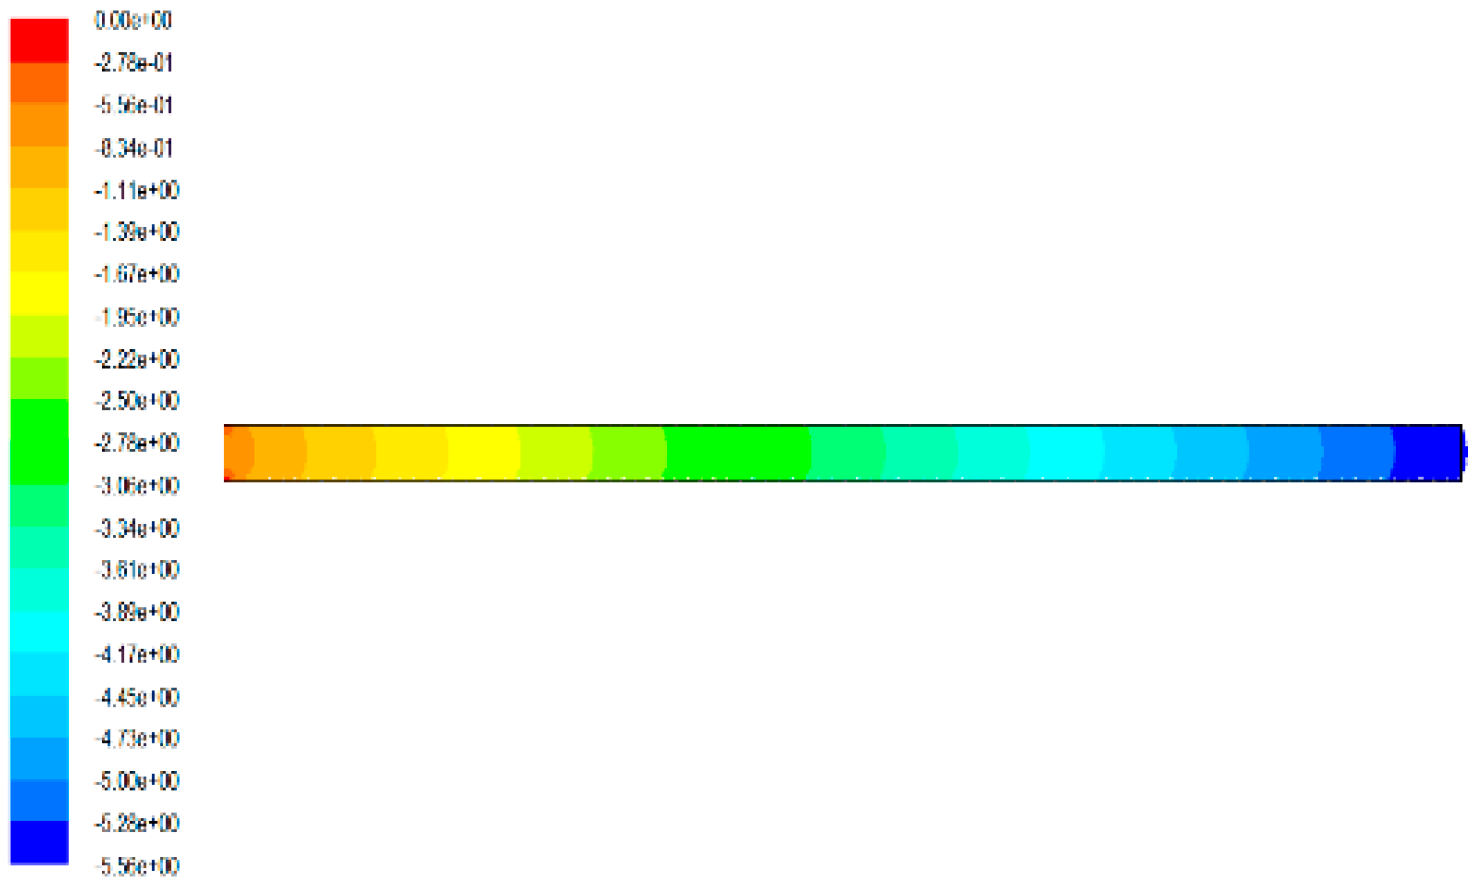
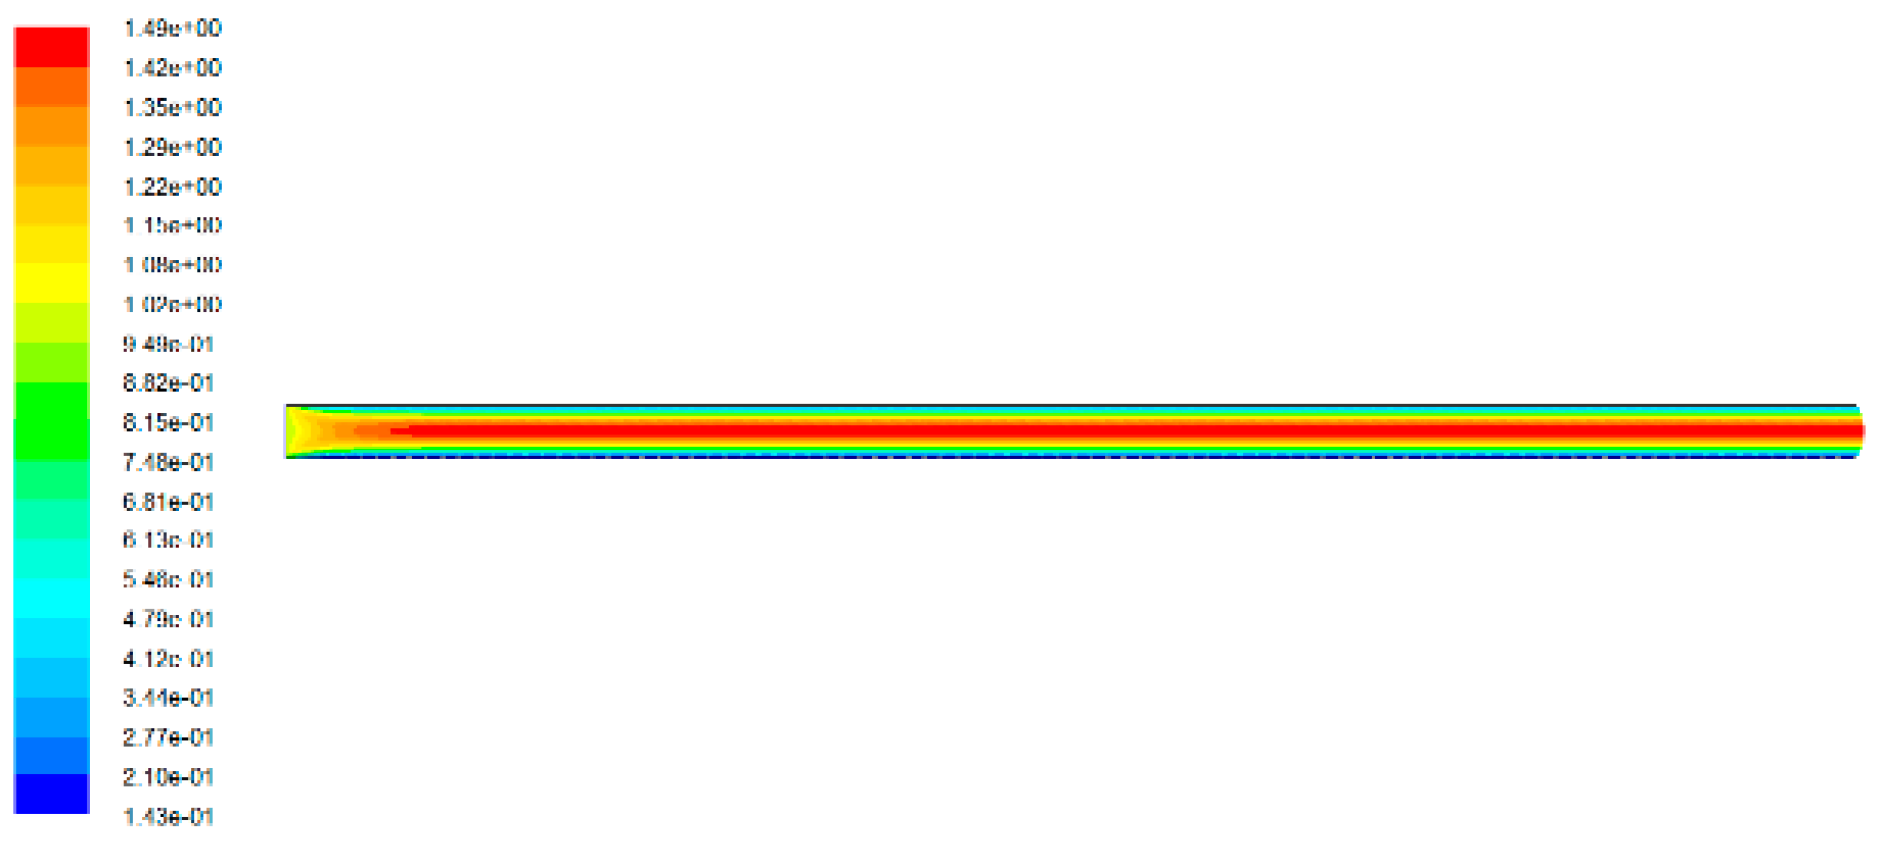
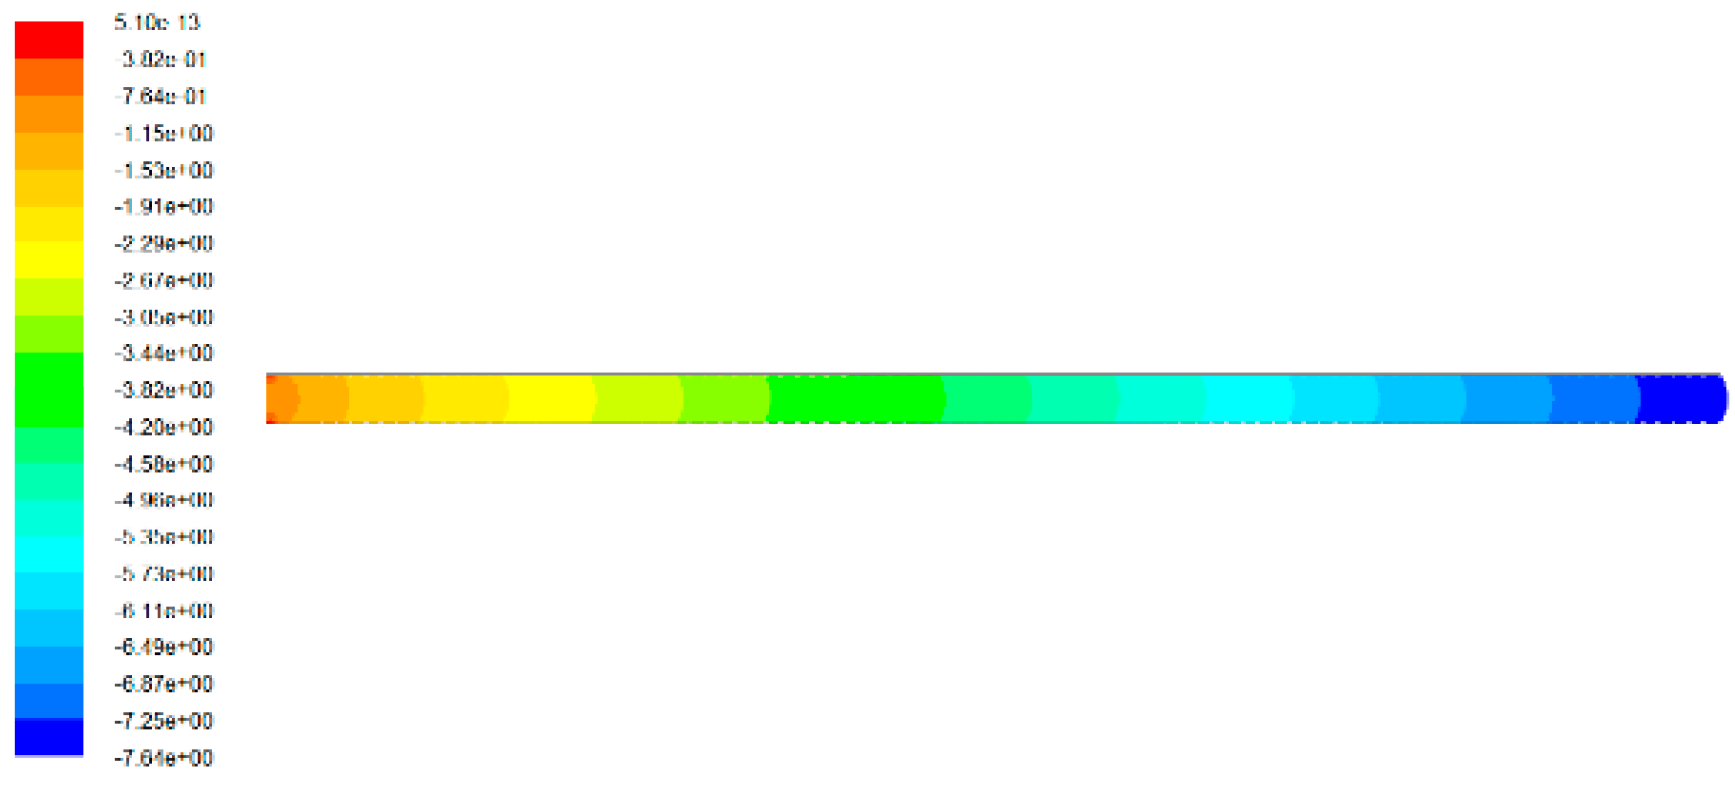
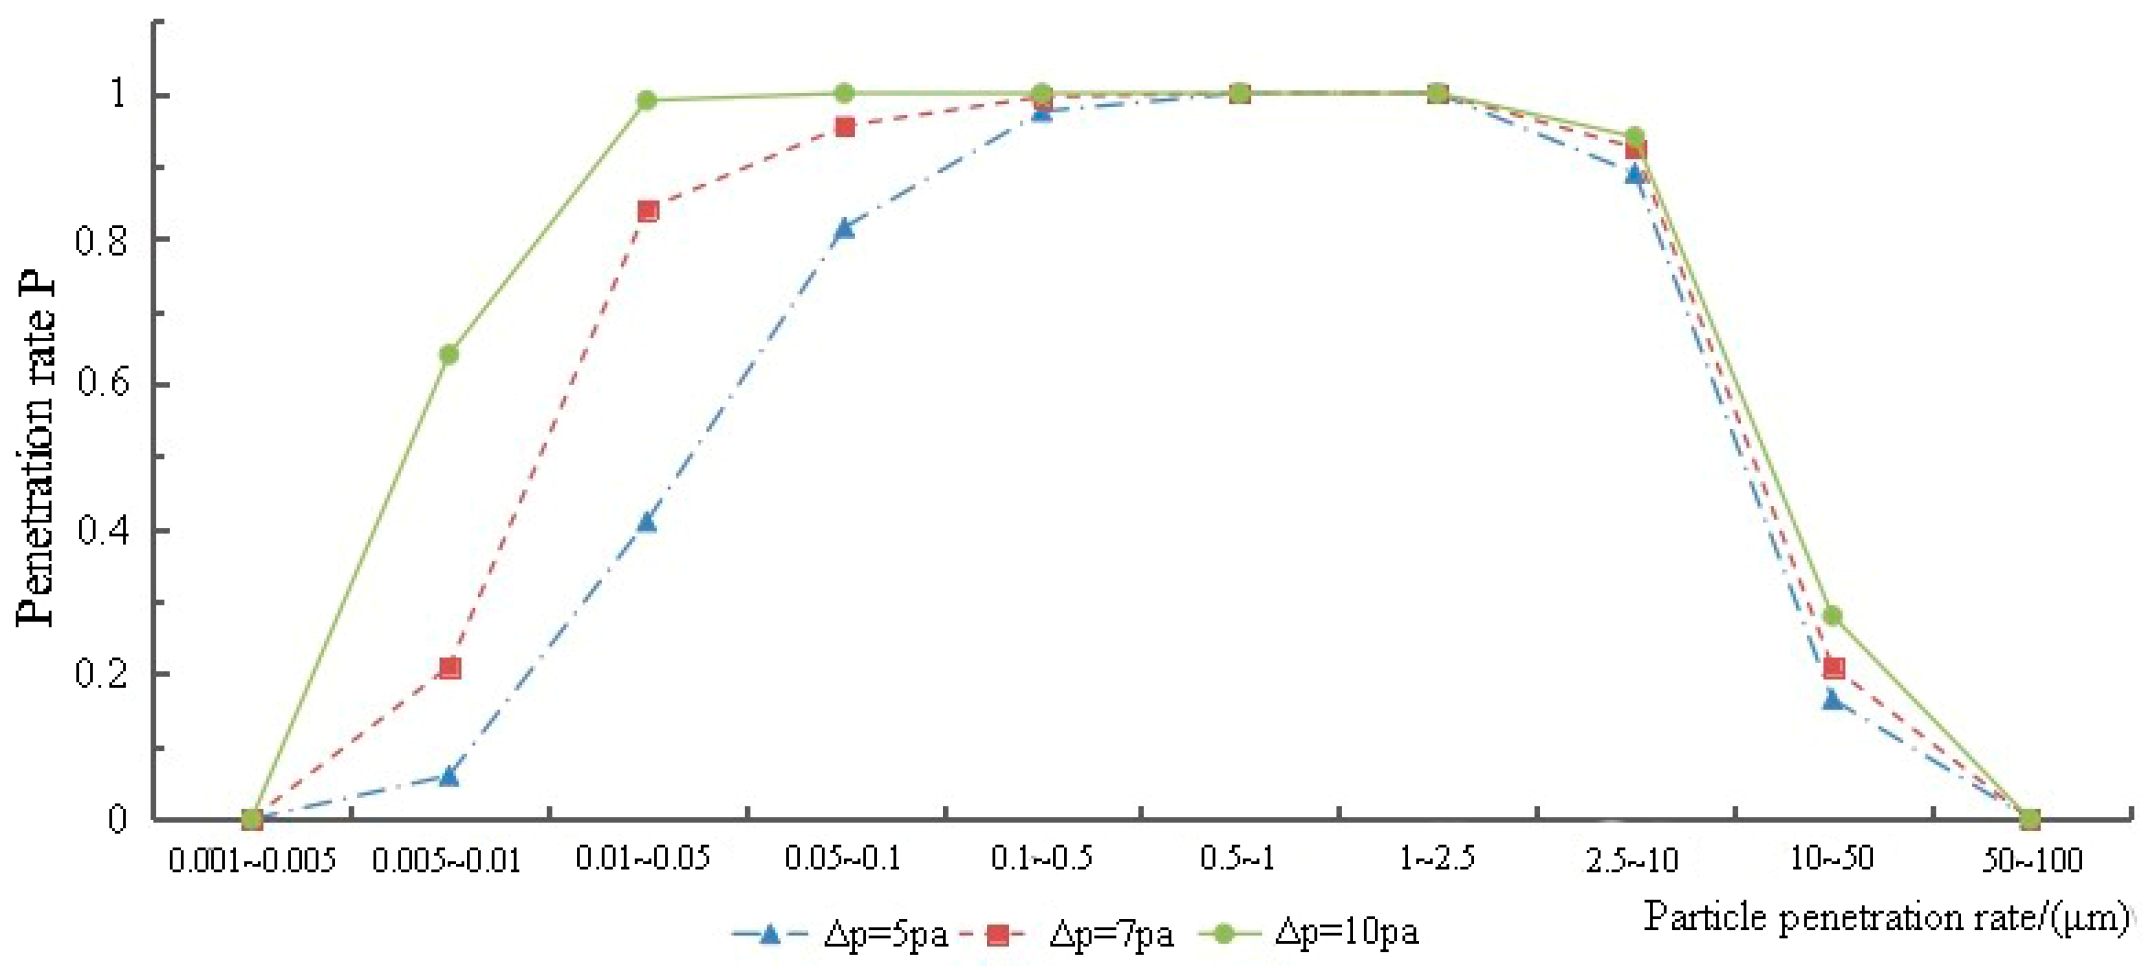
4.3.3. Influence of Pressure Difference between the two Sides of the Gap on the Penetration Coefficient
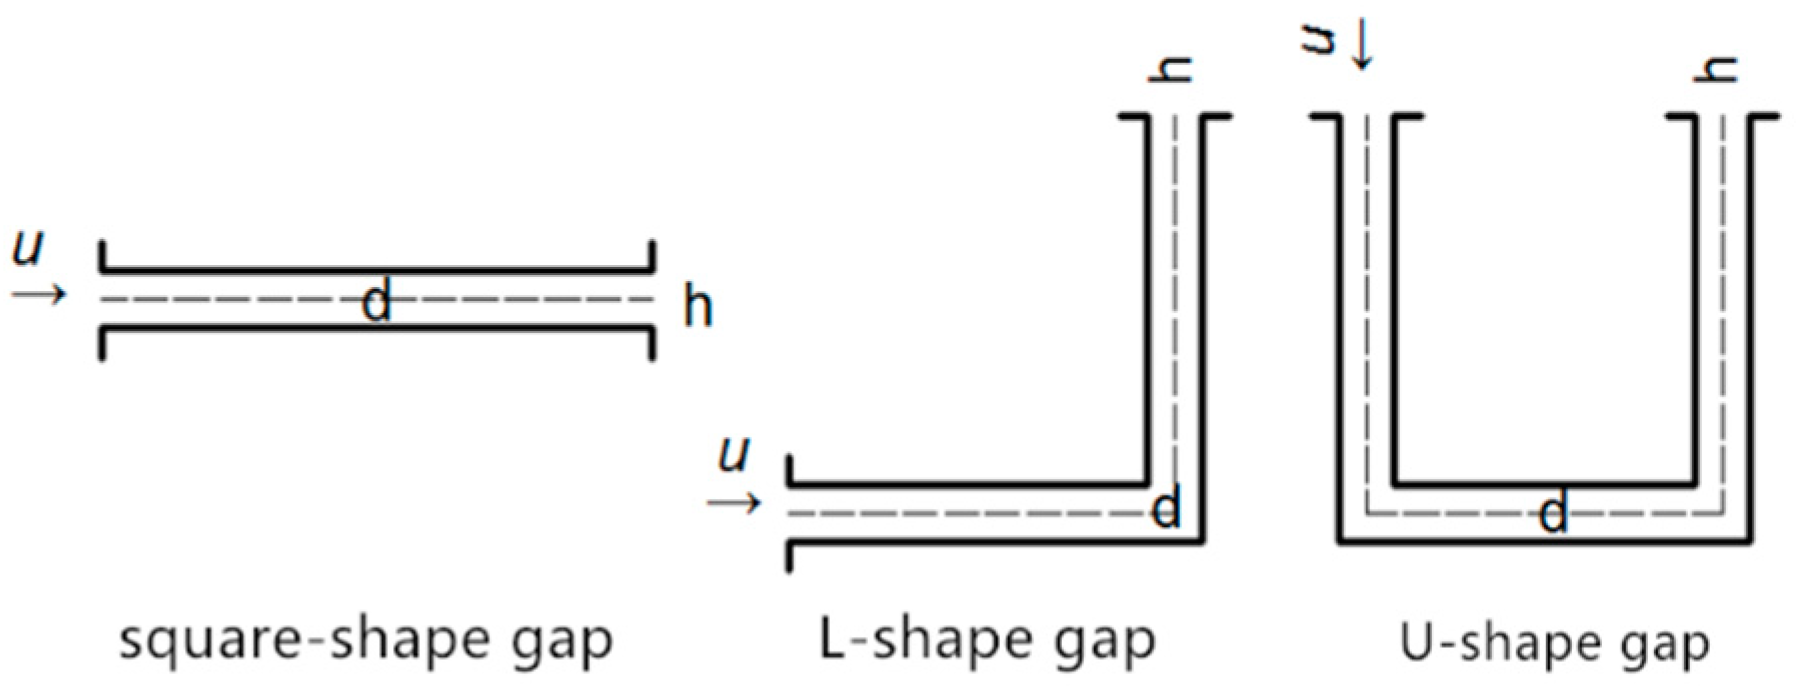
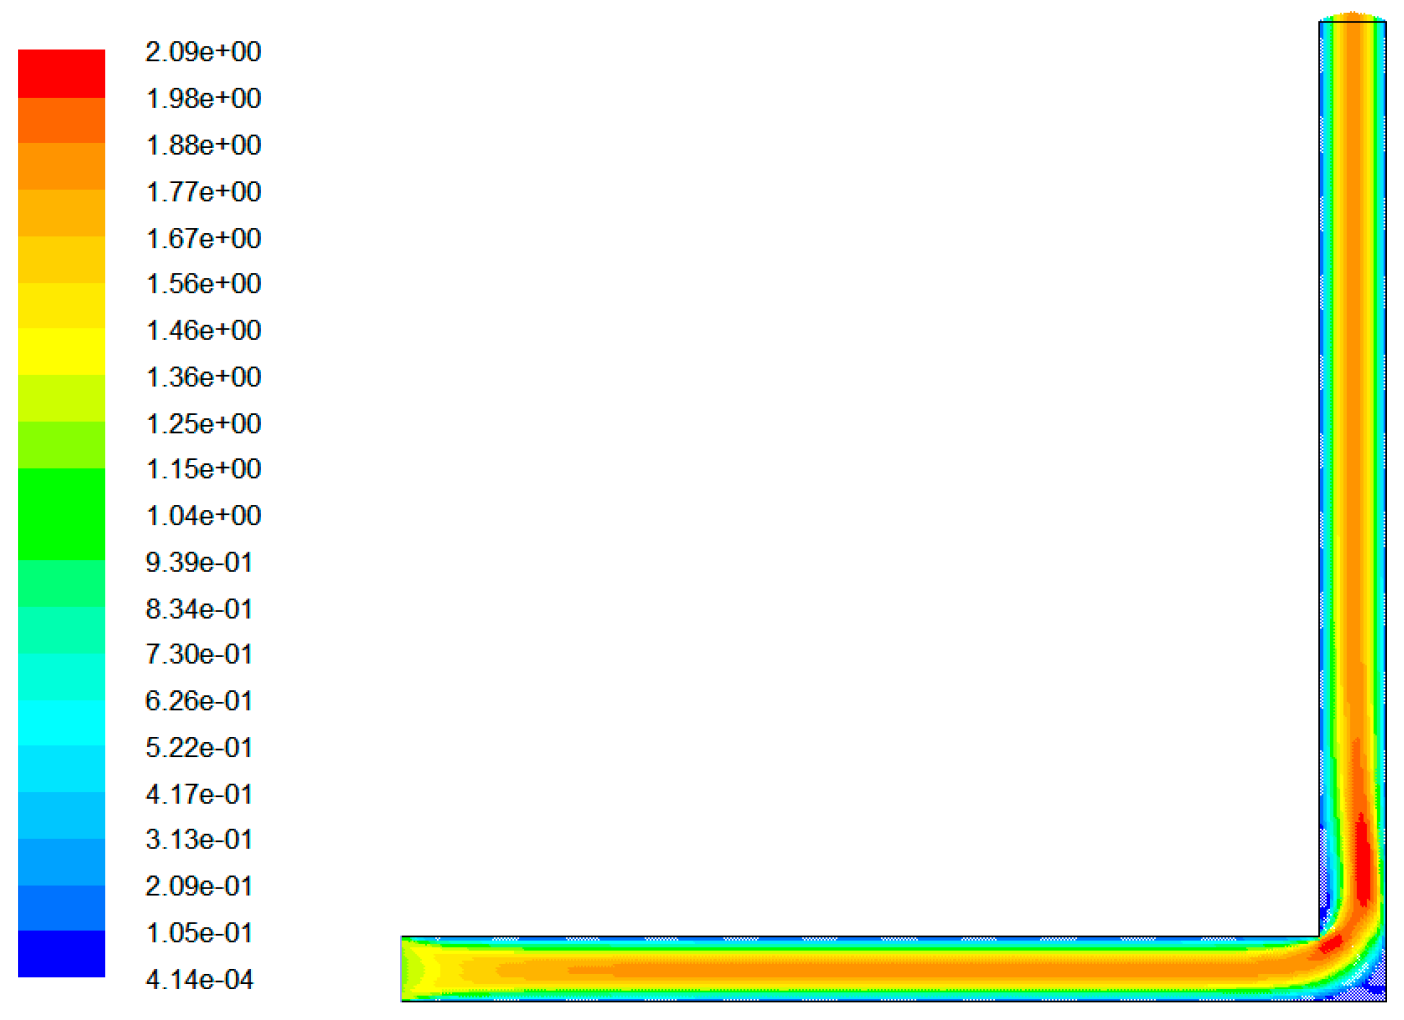
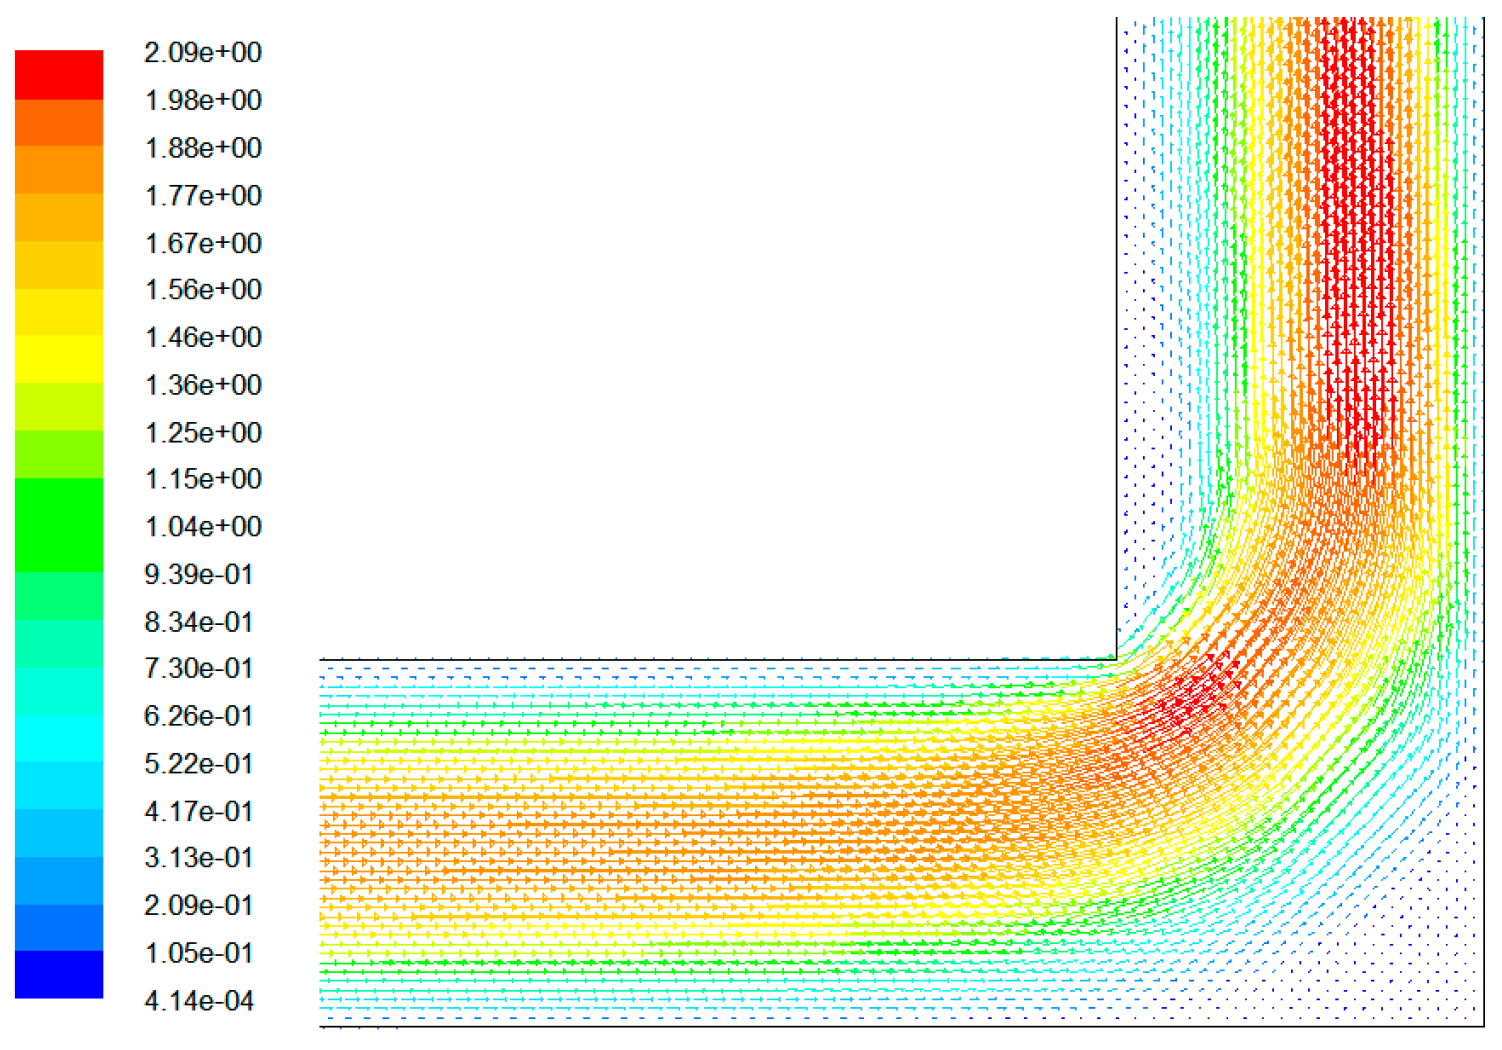
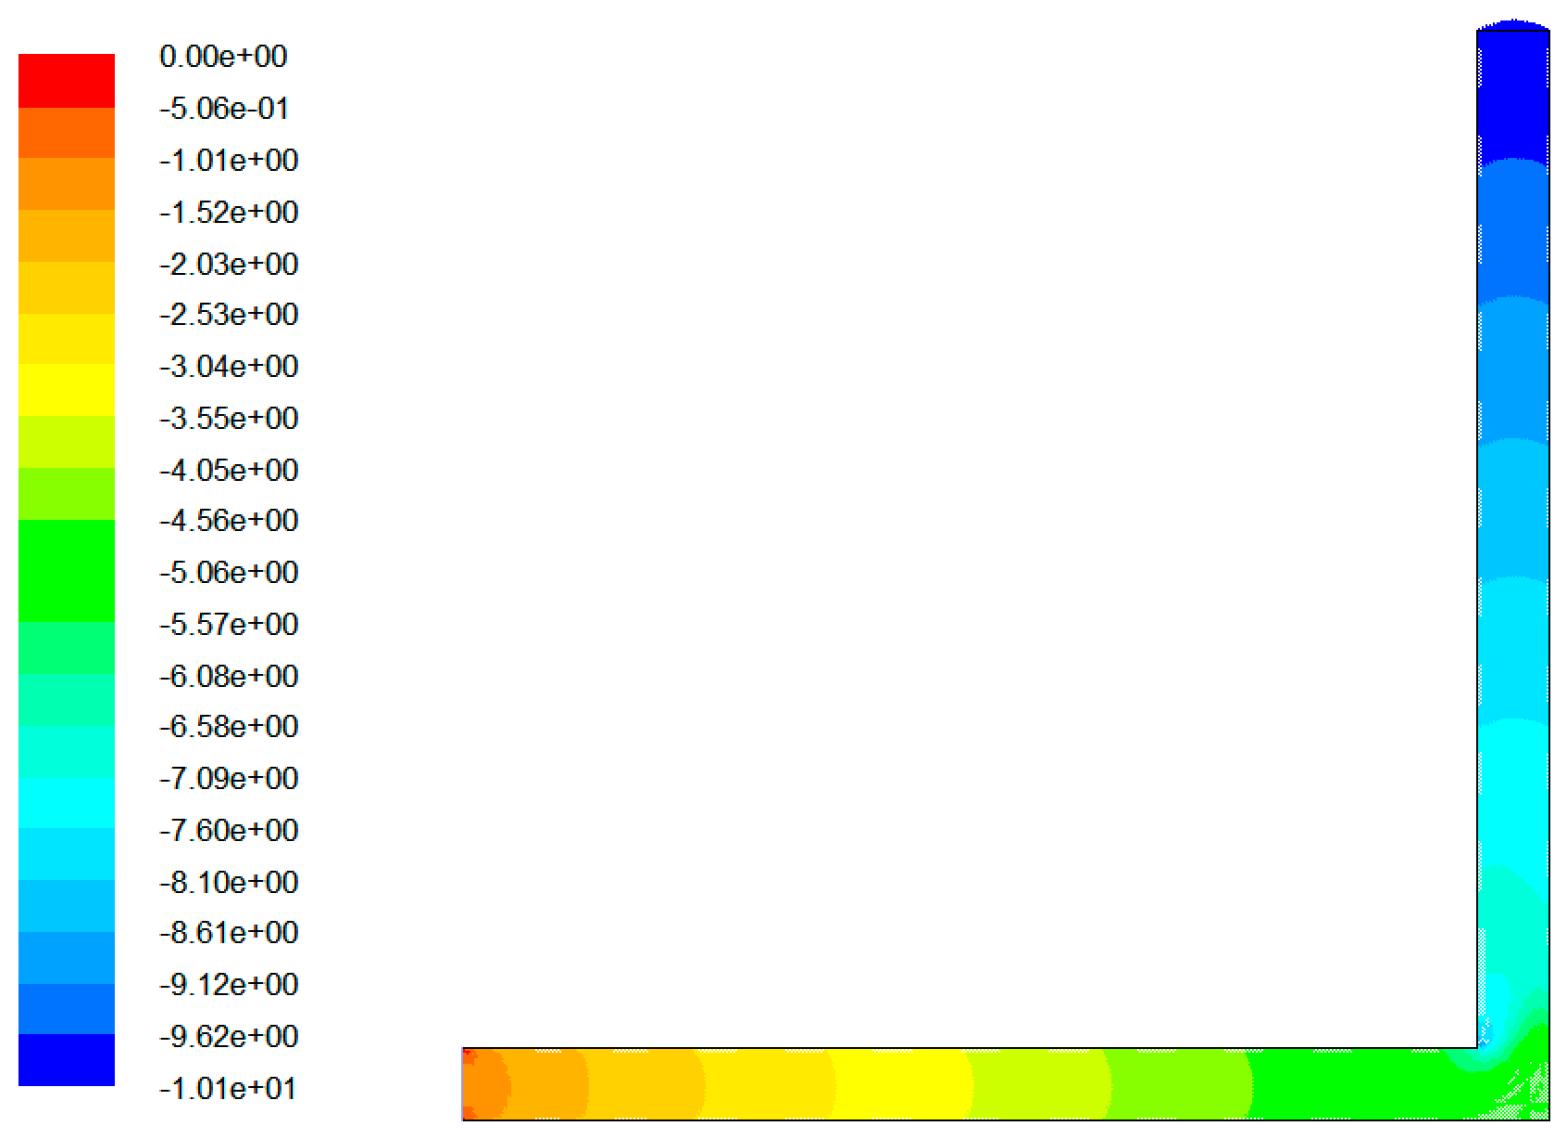
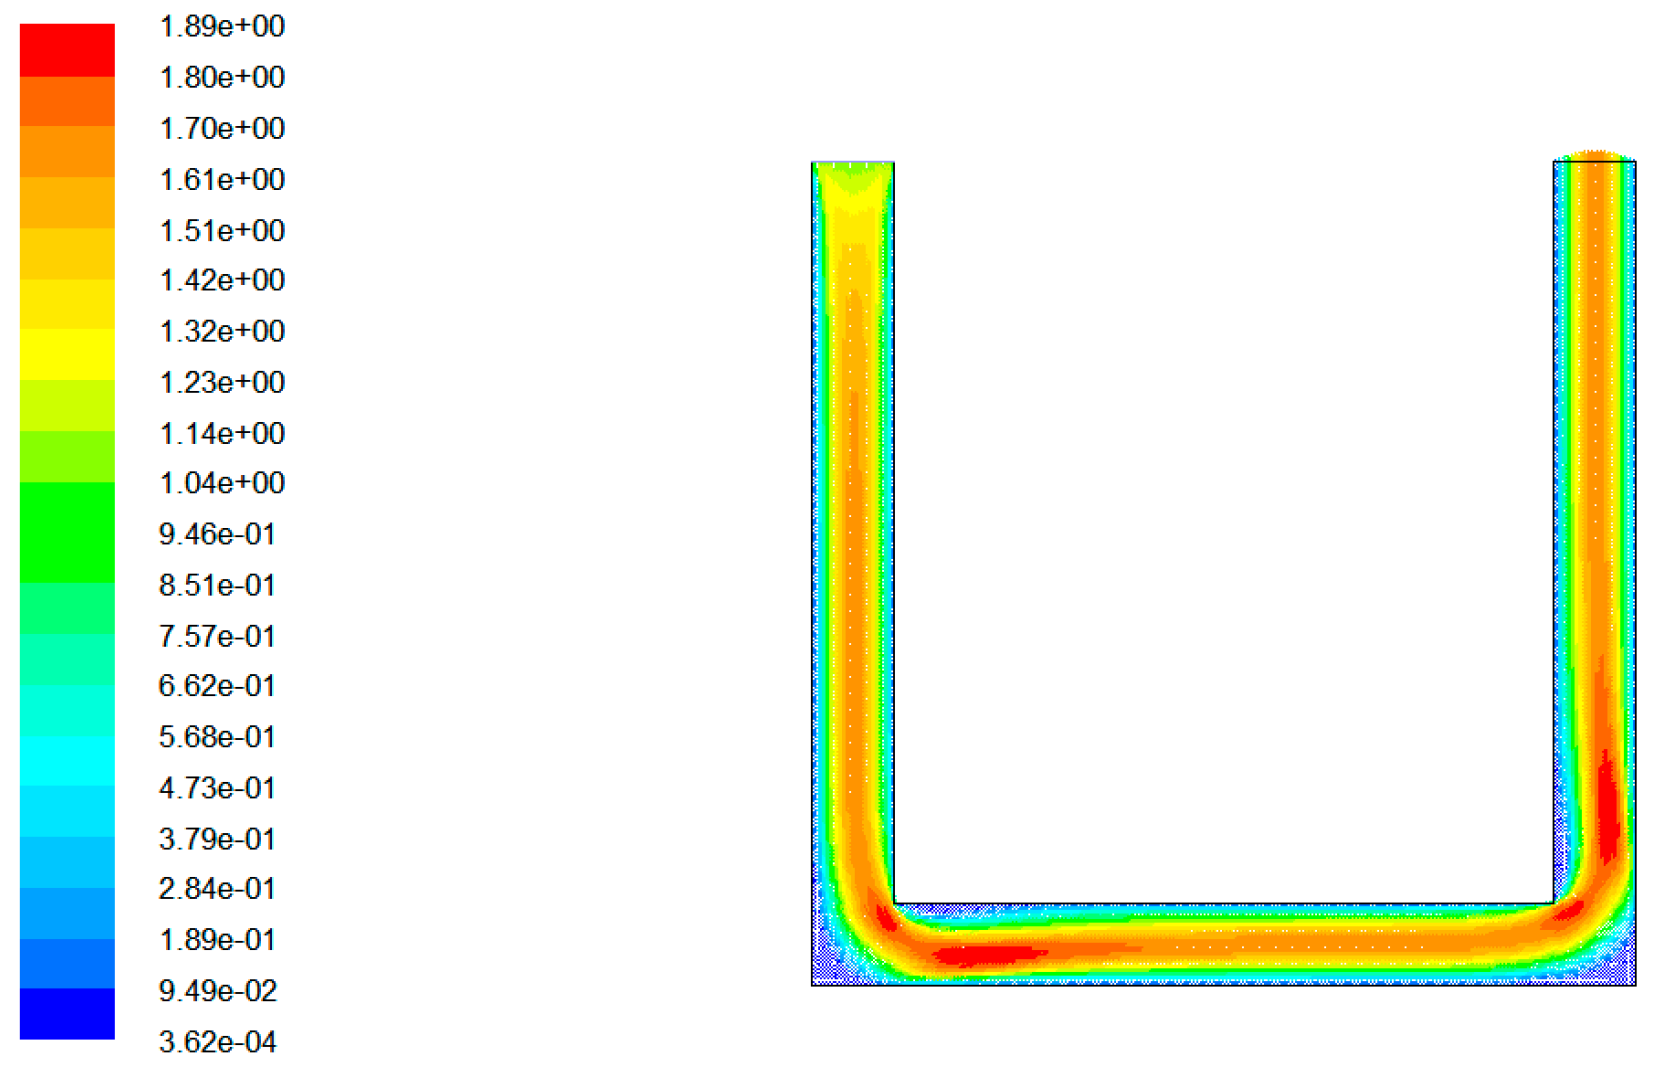
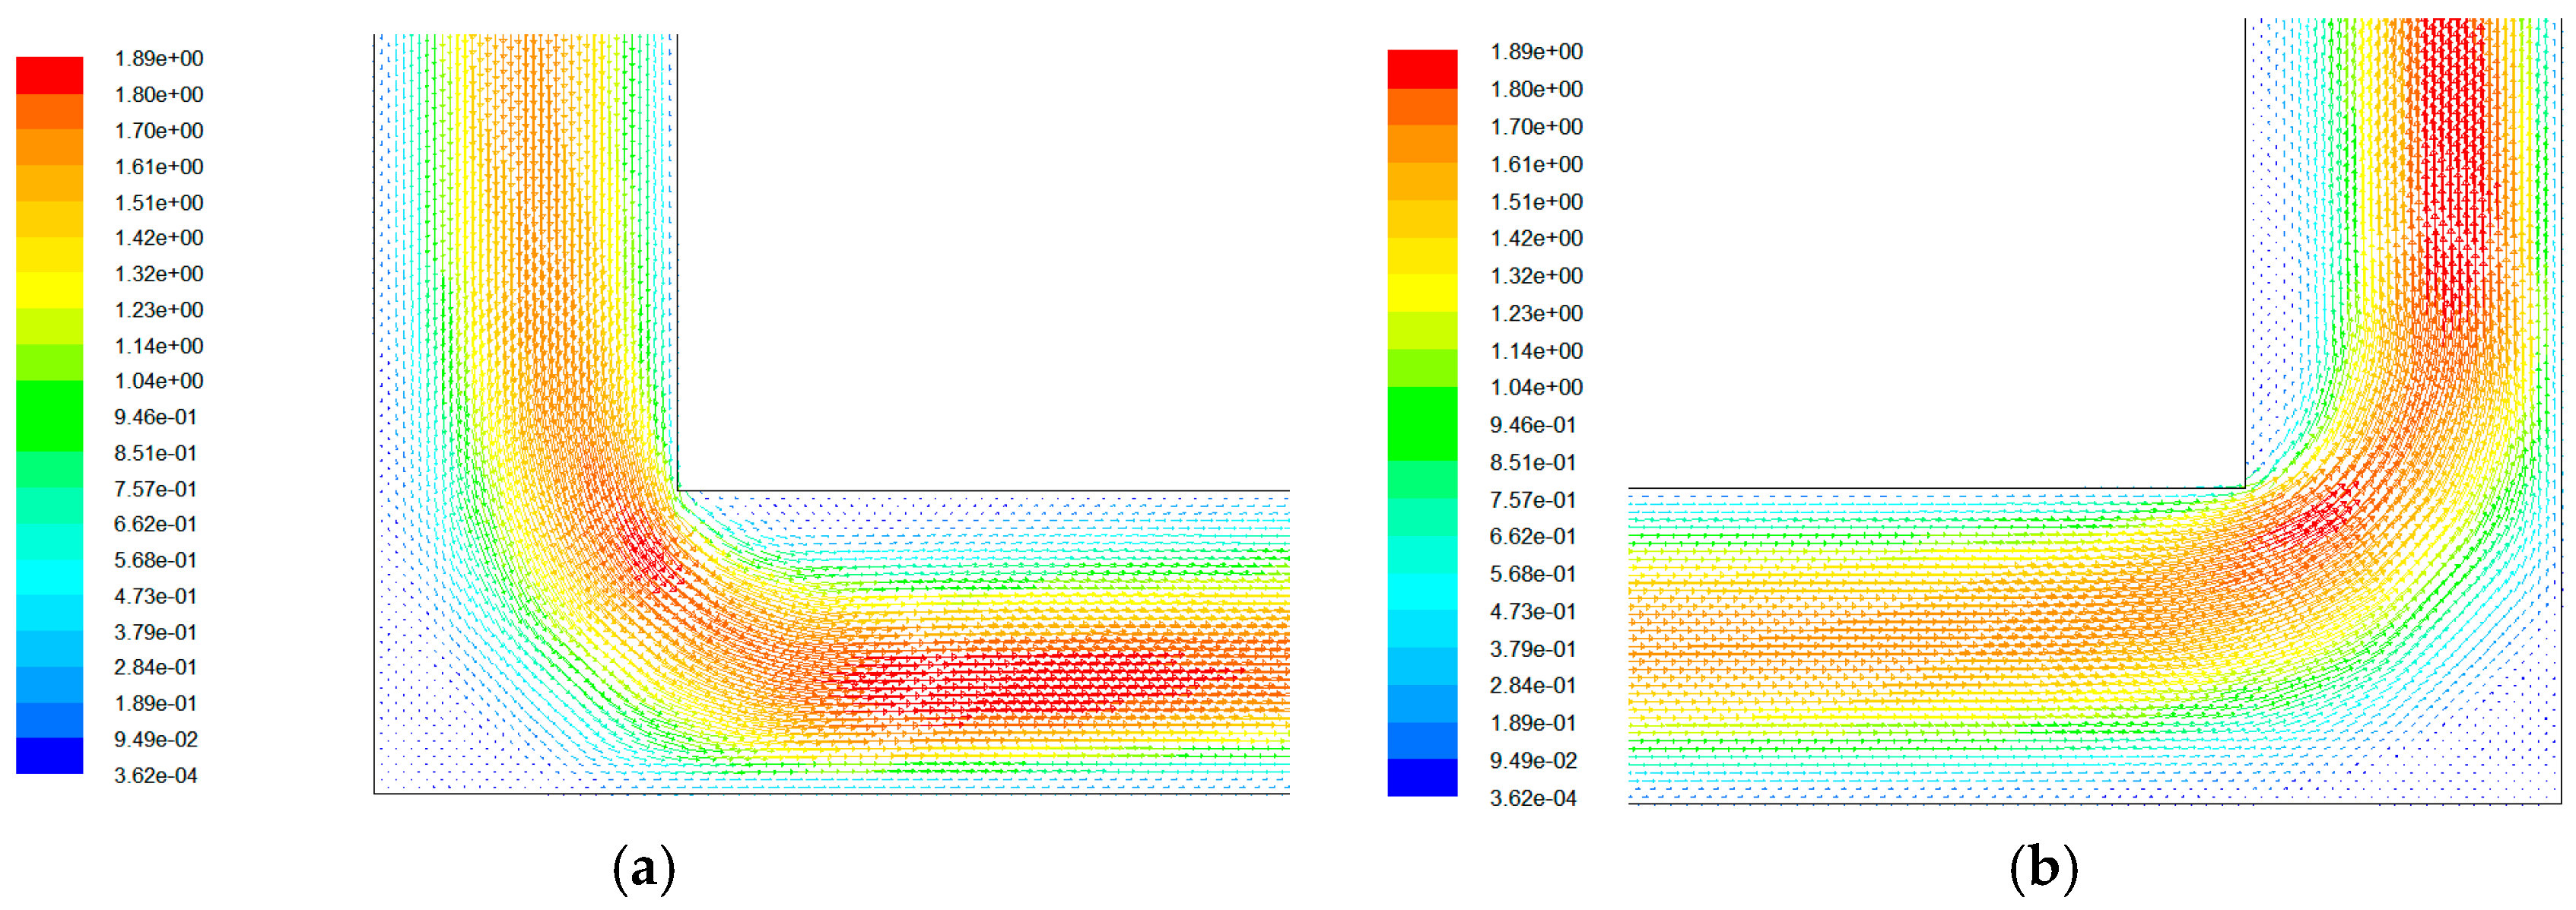
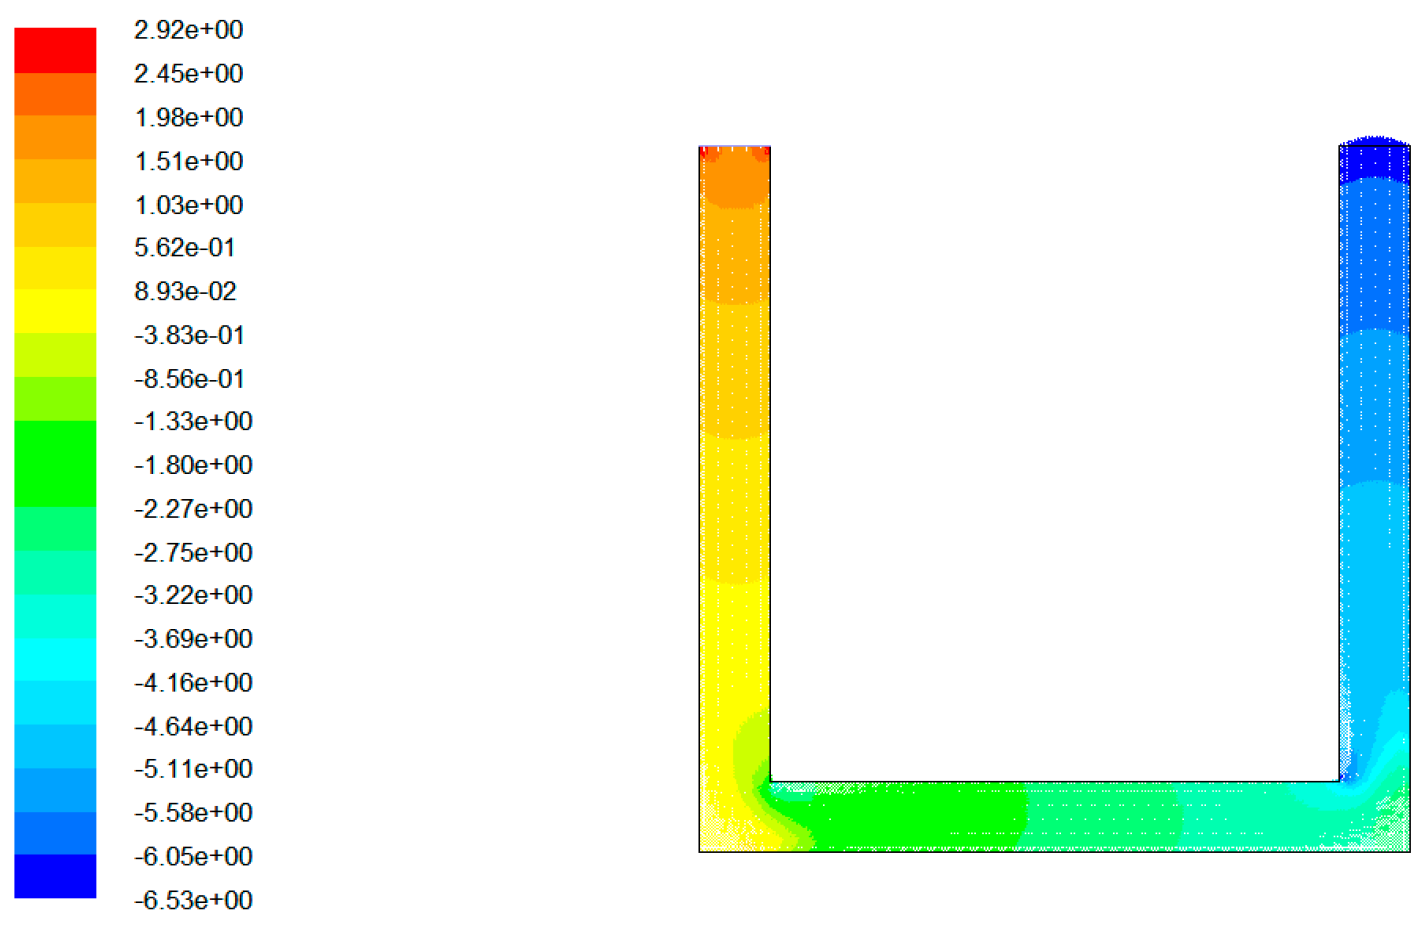
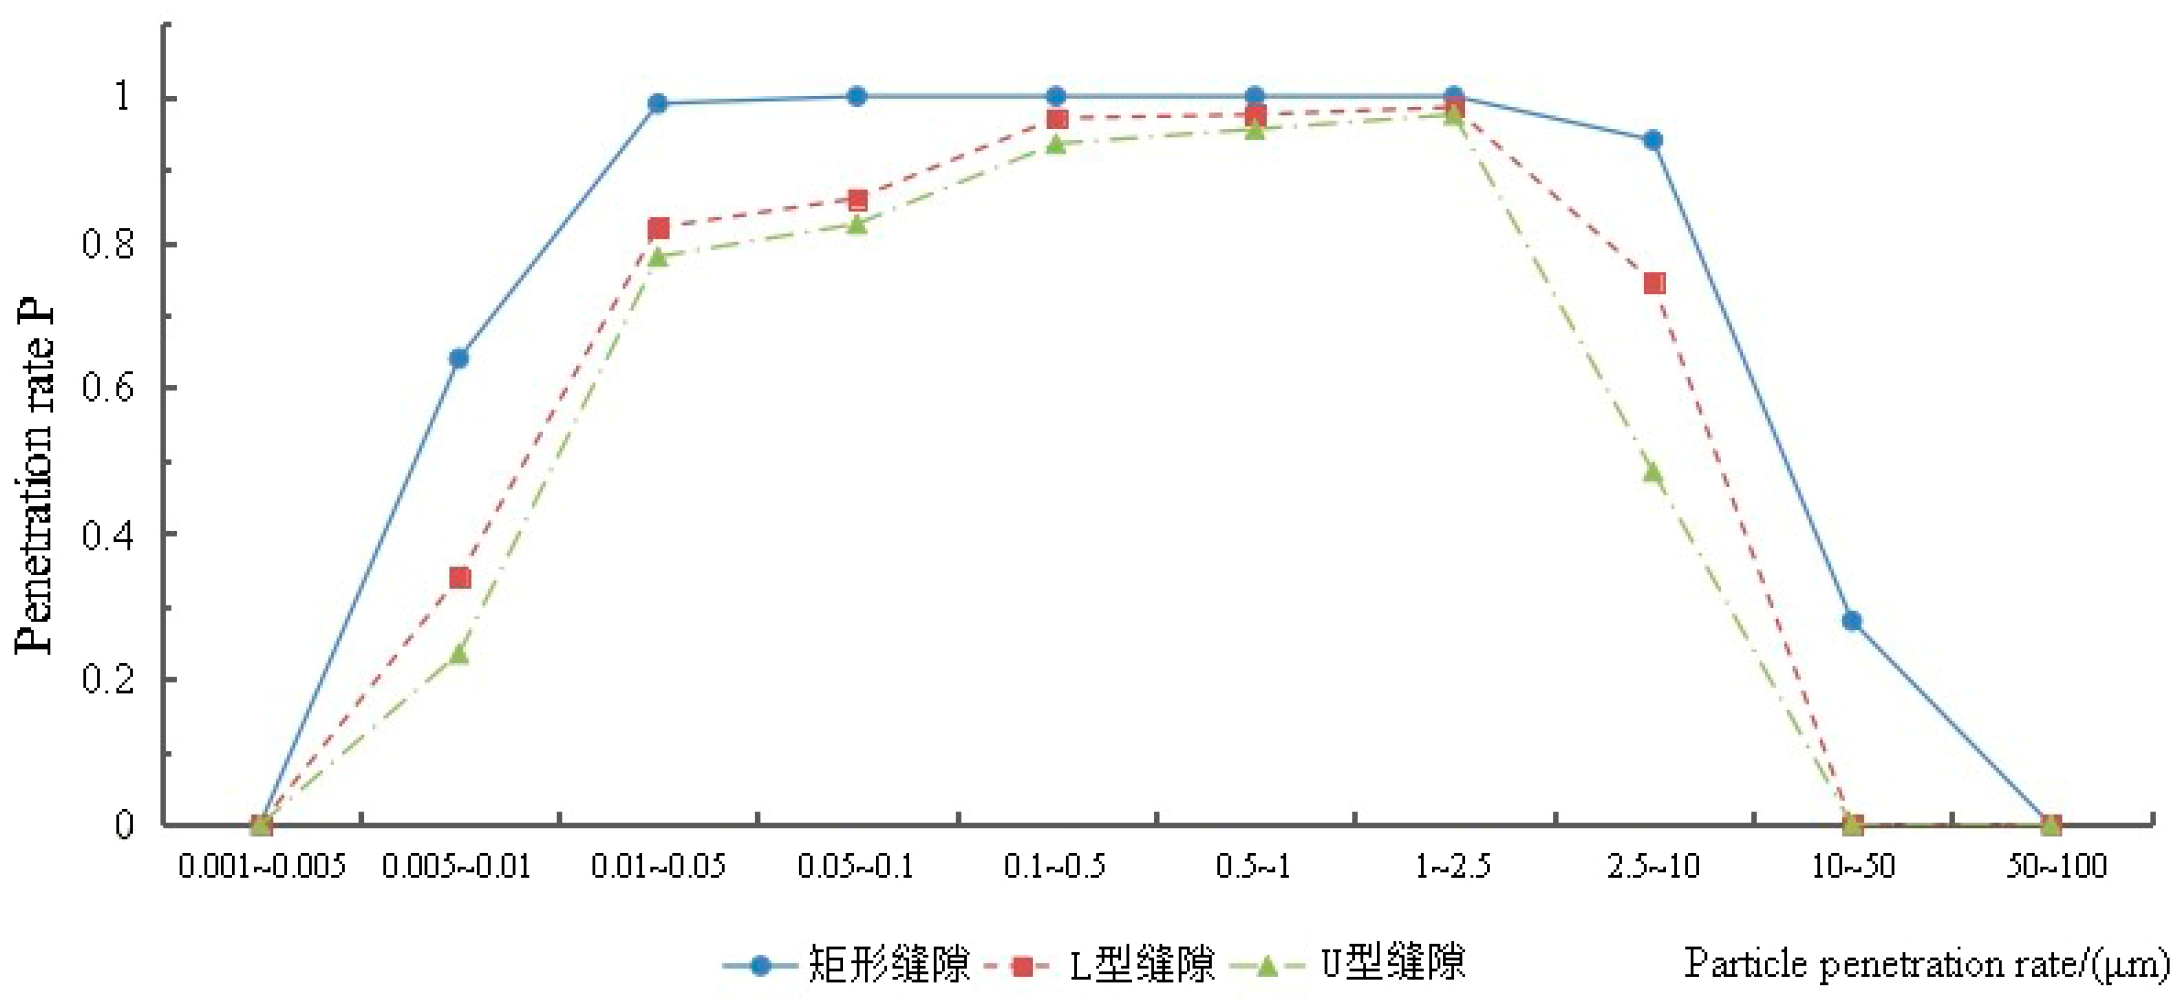
4.3.4. Influence of Gap Shape on Penetration Coefficient
5. Conclusions
Author Contributions
Funding
Acknowledgments
Conflicts of Interest
References
- Bulletin of the State of the Environment of China. Official Website of the Ministry of Environmental Protection of the People’s Republic of China. Available online: http://www.zhb.gov.cn/ (accessed on 24 February 2020).
- Bulletin of the State of the Environment of Shenyang. Official website of the Shen Yang Municipal Bureau of Ecology and Environment. Available online: http://sthjj.shenyang.gov.cn/syssthjj/zwgk/hjzl/hjzlgb/glist.html (accessed on 24 February 2020).
- National standards of People’s Republic of China “Ambient air quality standards” GB3095-2012.
- Ostro, B.; Lipsett, M.; Reynolds, P.; Goldberg, D.; Hertz, A.; Garcia, C.; Henderson, K.D.; Bernstein, L. Long-Term Exposure to Constituents of Fine Particulate Air Pollution and Mortality: Results from the California Teachers Study. Environ. Health Perspect. 2010, 118, 363–369. [Google Scholar] [CrossRef] [PubMed] [Green Version]
- Tovalin-Ahumad, H.; Whitehead, L.; Blanco, S. Personal Exposure to PM and Element Compositional: A Comparison between Outdoor and Indoor Workers from Two Mexican Cities. Atmos. Environ. 2007, 41, 7401–7413. [Google Scholar] [CrossRef]
- Zhang, Y.P. Indoor Air Quality Control: Challenges in the New Century and Responsibilities of HVAC Personnel. HVAC 2013, 43, 1–7. [Google Scholar]
- Cao, G.Q.; Xie, H.; Zhao, S. Study on Indoor PM2.5 Pollution Control Strategy in Public Buildings. Build. Sci. 2015, 31, 41–44. [Google Scholar]
- Xiong, Z.M.; Zhang, G.Q.; Peng, J.G.; Zhou, J.L. Research Status of Indoor Inhalable Particulate Pollution. HVAC 2004, 34, 32–36. [Google Scholar]
- Zhao, L.; Chen, C.; Wang, P.; Wan, Y.L.; Wang, Y.F.; Chen, Z.G.; Wang, Q.Q.; Gao, G.Q.; Meng, C.; Wang, L.T. Variation Characteristics of Indoor and Outdoor PM2.5 Concentration in Summer and Winter of an Office Building in Beijing. Build. Sci. 2015, 4, 32–39. [Google Scholar]
- Fan, Y.S.; Xie, W.; Ye, L.L.; Si, P.F. Analysis on the Characteristics of Indoor and Outdoor Particulate Matter Concentration in an Office Building in Xi ’an. Build. Sci. 2013, 8, 39–44. [Google Scholar]
- Zhong, K.; Yang, F.; Zhu, H.; Kang, Y.M. Comparison of Indoor and Outdoor Particle Concentrations in Ventilation Rooms in Haze in Shanghai. Green Build. 2014, 1, 24–26. [Google Scholar]
- Shi, T.M.; Shan, R.D.; Xia, X.D. Research on Sustainable Design Strategy and Energy-Saving Technology of Sino-German Energy Conservation Demonstration Center. J. Archit. 2016, 14, 28–34. [Google Scholar]
- National standards of People’s Republic of China “Indoor air quality” GB/T 18883-2002.
- Chinese environmental protection industry standard “Technical requirement and test procedures for total suspended particulates sampler” HJ/T374-2007.
- National metrological verification regulations of the People’s Republic of China “Total Suspended Particulates Sampler” JJG 943-2011.
- National environmental protection standard of the People’s Republic of China “Determination of atmospheric articles PM10 and PM2.5 in ambient air using the gravimetric method” HJ618-2011.
- National environmental protection standard of the People’s Republic of China “Specification and Test procedures for (PM10 and PM2.5) sampler” HJ93-2013.
- Li, G.Z. Research on PM Exterior Window Penetration and Control under Multiple Factors. Chin. Acad. Build. Sci. 2016, 2, 5. [Google Scholar]
- Wang, Q.Q.; Li, G.Z.; Meng, C.E. Influence of Air Tightness on Penetration Coefficient of Particles in Cracks of Building Envelope. HVAC 2015, 45, 8–13. [Google Scholar]
- Xu, X. Study on Indoor PM Concentration Control Strategy. Sch. Civ. Eng. Hunan Univ. 2017, 2, 5. [Google Scholar]
- Huang, Y.H. Concentration Level and Exposure Evaluation of Indoor and Outdoor Particulate Matter in Office Buildings in Chongqing. Ph.D. Thesis, Chongqing University, Chongqing, China, 2013. [Google Scholar]
- Wang, Q.Q.; Li, G.Z.; Meng, C.; Zhao, L.; Wang, J.L.; Wang, X.F. External Fine Particulate Matter (PM2.5) Building Envelope Penetration and Passive Control Measures. HVAC 2015, 45, 8–13. [Google Scholar]
- Zhang, F. Numerical Simulation of the Penetration Mechanism of Building Envelope by Airborne Particulate Matter. Ph.D. Thesis, Hunan University, Changsha, China, 2007. [Google Scholar]
- Zhao, L. Indoor PM Pollution Control in Buildings; China Building Industry Press: Beijing, China, 2016; pp. 91–92. [Google Scholar]


| Measured Year | Measured Time | Number of Days | Measured Content |
|---|---|---|---|
| In the winter of 2016 | 2016-1-09 to 2016-1-22 | 14 days | Average daily concentration of PM2.5 and PM10 |
| In the summer of 2016 | 2016-7-18 to 2016-8-03 | 17 days | Average daily concentration of PM2.5 and PM10 |
| In the winter of 2017 | 2017-2-28 to 2017-3-13 | 14 days | Average daily concentration of PM2.5 and PM10 |
| General Situation of the Content | Point A | Point B |
|---|---|---|
| Outside the window towards | North | South |
| Outside the window structure | Three layers of low-e glass medium filled with argon | Plastic steel double glazing |
| External window installation method | External type | Nested |
| External window opening mode | Casement window | Sliding window |
| External window heat transfer coefficient (W/m2, K) | 0.93 | 2.70 |
| Air tightness rating | 8 | 4 |
| Window width (mm) | 5250 | 1000 |
| Window height (mm) | 3900 | 900 |
| The number of windows in the building | 2 | 3 |
| Technical Parameters | The Parameter Value |
|---|---|
| Sampling rate | 100 L/min |
| Flow accuracy | ±5.0% or less |
| Sampling time | Set anything within 100 h |
| Timing accuracy | Less than ±1 s within 20 min |
| Inlet velocity of sampling head | 0.3 m/s |
| PM2.5 sampling head diameter | D = (2.5 ± 0.2) μm |
| PM10 sampling head diameter | D = (10 ± 0.5) μm |
| A membrane diameter | Φ 80 mm |
| Applicable to ambient temperature range | −20–40 °C |
| Applicable to ambient humidity range | 0–95% rH |
| Technical Parameters | The Parameter Value |
|---|---|
| Sampling flow range | 1.5–3.5m/h (adjustable)3 |
| Rated flow | 2.3 m/h3 |
| Flow accuracy | The deviation within 24 h is less than 2% |
| Load capacity | The flow is 2.3m/h, the resistance should not be less than 45kpa3 |
| Sampling time | 1 min to 999 h (adjustable) |
| Timing accuracy | Less than ±1s within 20 min |
| Effective filter diameter | 47–50 mm |
| Applicable to ambient temperature range | −30–50 °C |
| Applicable to ambient humidity range | 0–100% rH |
| Force | The Force of Gravity | Drag Force | Brown Force | Pressure Gradient Force | Thermophores Force |
|---|---|---|---|---|---|
| Orders of magnitude | 10−15 | 10−14 | 10−15 | 0 | 10−17 |
| Gap Height h (mm) | Differential Pressure on Both Sides (pa)  | Mean Velocity of Air in the Gap u (m/s) | Reynolds Number Re |
|---|---|---|---|
| 1 | 5 | 0.7370 | 118.09 |
| 1 | 7 | 0.9940 | 159.28 |
| 1 | 10 | 1.3510 | 216.48 |
| 0.5 | 5 | 0.2050 | 16.45 |
| 0.5 | 7 | 0.2860 | 22.95 |
| 0.5 | 10 | 0.4070 | 32.66 |
| 0.1 | 5 | 0.0082 | 0.132 |
| 0.1 | 7 | 0.0144 | 0.231 |
| 0.1 | 10 | 0.0163 | 0.262 |
| Gap Depth d (mm) | Differential Pressure (pa) | Gap Height h (mm) | Air Velocity v (m/s) | Reynolds Number Re |
|---|---|---|---|---|
| 30 | 10 | 1 | 1.351 | 216.48 |
| 50 | 10 | 1 | 0.910 | 146.01 |
| 70 | 10 | 1 | 0.677 | 108.69 |
| Aperture Shape | Differential Pressure (pa) | Gap Height h (mm) | Air Velocity v (m/s). | Reynolds Number Re |
|---|---|---|---|---|
| Rectangular | 10 | 1 | 1.351 | 216.48 |
| L | 10 | 1 | 1.233 | 197.57 |
| U | 10 | 1 | 1.114 | 178.5 |
© 2020 by the authors. Licensee MDPI, Basel, Switzerland. This article is an open access article distributed under the terms and conditions of the Creative Commons Attribution (CC BY) license (http://creativecommons.org/licenses/by/4.0/).
Share and Cite
Yu, L.; Kang, N.; Wang, W.; Guo, H.; Ji, J. Study on the Influence of Air Tightness of the Building Envelope on Indoor Particle Concentration. Sustainability 2020, 12, 1708. https://doi.org/10.3390/su12051708
Yu L, Kang N, Wang W, Guo H, Ji J. Study on the Influence of Air Tightness of the Building Envelope on Indoor Particle Concentration. Sustainability. 2020; 12(5):1708. https://doi.org/10.3390/su12051708
Chicago/Turabian StyleYu, Liang, Ning Kang, Weikuan Wang, Huiyu Guo, and Jia Ji. 2020. "Study on the Influence of Air Tightness of the Building Envelope on Indoor Particle Concentration" Sustainability 12, no. 5: 1708. https://doi.org/10.3390/su12051708
APA StyleYu, L., Kang, N., Wang, W., Guo, H., & Ji, J. (2020). Study on the Influence of Air Tightness of the Building Envelope on Indoor Particle Concentration. Sustainability, 12(5), 1708. https://doi.org/10.3390/su12051708