Abstract
New energy vehicles have been recognized as a sustainable alternative to lower gasoline consumption and emissions in the transportation sector. To alleviate environmental pressure, a spectrum of government policies has been introduced to inspire the production and penetration of new energy vehicles (NEVs). Meanwhile, some of the incentive policies are facing renewals and modifications to meet consumers’ demand of purchase and the present growth of the NEV industry. This means that the understanding of what the current and upcoming policies are, how to formulate policy portfolios, and consumers’ purchasing NEV behavior in a response to these policies and its adjustment are of practical and academic importance for the NEV sector. Different from prior research which analyzed the role of government policy as a whole, we here separately examined the impact of policy portfolios (i.e., production policy, purchase/usage policy and recycle policy) on NEV adoption from the product life cycle perspective. The hypotheses were empirically tested by analyzing data collected from 299 respondents in China. The results showed that production policy has a significantly positive impact on financial benefits, esteem needs and infrastructure, whereas it insignificantly influences NEV performance; similarly, purchase/usage policy positively affects esteem needs and infrastructure, yet its effect on financial benefits is found to be insignificant; meanwhile, recycle policy has a significantly positive effect on financial benefits, and esteem needs as well as NEV performance. Furthermore, financial benefits, esteem needs, NEV performance and infrastructure are found to significantly and positively impact on consumers’ purchase intention. Parallel to this, we observed perceived usefulness and perceived ease of use play partially mediating relations between policy portfolios and consumers’ adoption intent. Hints for decision-makers and avenues for future study are discussed in this research.
1. Introduction
Dramatic reductions in anthropogenic carbon emissions, including vehicle exhausts, are indispensable in curbing global climate change and its related outcomes [1,2]. China, as the world’s largest vehicle production and sales market since 2009, is playing a crucial role in energy savings and environment protection, for its private vehicle population surged by 360% from 45 million in 2009 to 207 million in 2018 [3]. The exponential growth in private vehicle ownership has triggered a plethora of problems such as energy shortage, traffic jams, and particularly exhaust emissions [4,5]. Based on the World Energy Outlook 2016, motor vehicles are responsible for about 25% of the aggregate of China’s carbon emissions, and in 2030, this percentage is anticipated to climb to45%. Therefore, cutting down carbon emissions from fuel-driven vehicles is critical to mitigate such grim environmental problems and to obtain the goal of emission reduction [6,7].
It has been acknowledged that the usage of new energy vehicles (NEVs) is a promising alternative to lower carbon emissions [8,9]. NEVs include various types of vehicles such as hydrogen fuel vehicles, battery electric vehicles and others, but battery electric vehicles are dominant in the current worldwide NEV market. Here, this paper refers to NEVs merely containing battery electric cars (i.e., pure electric, plug-in hybrid and hybrid). Compared to conventional fuel vehicles (CVs), NEVs bring substantial social and environmental benefits including reducing greenhouse gases and other emissions, enhancing energy security, and promoting the adoption of new technologies, among others [10]. However, commercializing NEVs would be one arduous task. Some experiences from countries including the United States, the Netherlands, China, and Japan have revealed that the diffusion of NEVs is challenged by its prohibition price, inconvenient refueling facilities, expensive renewal battery cost, as well as performance and reliability concerns compared with CVs during the preliminary stage of NEVs [8,11,12,13].
Considering that NEVs are not only a green and sustainable technology innovation, but significant to saving energy and protecting the environment, the governments of various nations have enacted subsidy and incentive schemes to stimulate NEV consumption [14,15]. For instance, the Japanese and German governments have issued free charging policies for NEV users [13]. Norway has taken the lead in developing its own NEV industry due to the government’s subsidizing the construction of public and private charging infrastructure [5]. The US government has offered fiscal subsidy programs, and a state-wide income tax credit for NEV adopters [12]. The Dutch government has planned to reinforce the investment of NEV technologies, with an aim to promote the development of NEVs [11].
China has also initiated various measures to accelerate the industrialization of the NEV industry since 2009 [16]. It is obvious that China’s execution of NEV measures is normally composed of a ‘planning-demonstration-generalization’ procedure [17]. For example, to fulfill the national goal of approximate 550,000 units of NEV sales, which took up 5% of overall vehicle sales by 2011, the Ministry of Finance (MOF) and the Ministry of Science and Technology (MOST)enacted the Regulation on Executing Energy Conservation and NEV Demonstration Scheme, and carried out the NEV pilot and demonstration project in 2009 [18]. Such measures help China to focus on the demonstration of NEVs in public service sectors, such as government vehicles, public transportation, taxis, and particular goal vehicles in 13 tier I cities [17]. Meanwhile, both the local and central governments offer monetary supports to the development of NEVs [5]. Central subsidies primarily compensate a portion of costs to purchase NEVs, whereas fiscal incentives from local government not only cover the additional buying and manufacturing costs of NEVs, but also focus on infrastructure development and battery recycling [19]. Generally, the amount of subsidy per unit that NEVs obtain depends on the battery technical level, vehicle type, and cruise ranges [20]. For example, the central government can subsidize each PHEV (Plug-In Hybrid Electric Vehicle) unit with 50 thousand CNY (Chinese Yuan) if the NEV electric power ratio surpasses 35% per unit, and its fuel, relative to CVs, could save less than 45%. On the other hand, subsidies for FCVs and BEVs can attain up to250 thousand and 60 thousand CNY (Chinese Yuan) per vehicle, respectively [17,21].
These policies typically represent the Chinese government’s goals, measurements, and procedures, and this is how they regulate all agents’ behaviors of the new energy vehicle market, such as the consumers, carmakers, retailers, and recyclers [17,22]. To investigate NEV industry development, such policies are normally divided into three domains [23,24]: (i) Supply side: to offer essential support for the manufacturing sector, including provisions for infrastructure investment, fiscal assistance, human training and technical subsidies [8,25]; (ii) demand side: to boost market demand from product consumers and retailers, provisions for preferential usage rules, government purchases, and direct taxation and fee reduction or exemption [26,27]; and (iii) environment side: to create preferential circumstances boosting thereusage, recycling and remanufacturing of NEVs such as provisions for preferential financial and legal regulations [5]. Table 1 summarizes some of the different types of policies of China’s government, to help aid in and encourage NEV adoption.

Table 1.
A series of policies for NEV development of China.
With intensive supports from the policies issued by national and local governments, China’s NEV industry has been at a rapid-growth stage [28]. It is reported that China produced 1.27 million units of NEVs in 2018, an increase of 59.9% year-on-year, while sales reached 1.26 million units, up 61.7% compared with a year earlier. From January to June in 2019, China’s NEV market saw a 48.5% and 49.6% increase in terms of production and sales compared with the same period of last year, which stood at 614 thousand units and 617 thousand units, respectively [29]. In addition, global NEV sales in the first quarter of 2019 exceeded 500 thousand units, up 58% year-on-year, which implies that China has contributed almost half of the NEV sales [29], and thereby has become the world’s largest nation in term of the accumulated NEV sales [8,9].
Considering that NEVs have the nature of radical innovative technologies, there may be reasons to suspect that vehicle consumers may not behave in the same pattern toward NEVs as they do towards CVs [13]. Innovations at an initial stage typically yield higher technological risks, which brings many variations associated with functionality and quality [30]. Since NEVs represent a totally new product different from CVs, they also result in market fluctuation and technological uncertainties [31]. Therefore, higher uncertainties regarding NEVs thwart individuals’ willingness to purchase NEVs relative to CVs. In this regard, one phenomenon is aroused, that despite strong supports from Chinese governments, there still exists inefficiency in boosting the penetration of NEVs [5]. Parallelly, consumers’ passion for the self-use purchase of NEVs is not expected to be relatively high in reality [7].
To ease these volatilities and skepticism from both demand and supply side, governments have successively made adjustments to the current policies in three facets, namely production, purchase/usage and after-sales service [7,8]. However, in prior research conducted through analyzing the role of government policies as a whole in the diffusion of NEVs [8,19,26], few have grouped government policies into three subclasses, and explored the impact of policy portfolios including production policy, purchase/usage policy and recycle policy on consumers’ purchase intention, separately [1,2]. To this end, the current study tries to close such gap, thus aiding policymakers to have a better and holistic understanding of the role of each subclass policy in enhancing NEV consumption, and it also offers a guideline on policy portfolios with an aim to reduce innovation and purchase uncertainties from the product life cycle policy perspective.
Based on the extant studies of NEV consumption, the current research develops a policy-perception-intention framework, in which consumer perception and product life cycle policy portfolios have incorporated to comprehensively examine the antecedents of NEV adoption intention, and we also take perceived ease of use and perceived usefulness into account using the technology acceptance model (TAM) due to that TAM is a prevalent decision-making theory and can explain consumer behavior based on technology attributes [32,33]. Specifically, this research tries to answer two critical questions: (1) How do product life cycle policy portfolios affect consumers’ intention to purchase NEVs? (2) Do different subclass policies play the same role in diffusing consumers’ purchase perception?
Therefore, the present research may make contributions to literature in three facets: (1) to assess policy implication of consumers’ NEV adoption from the perspective of product life cycle; (2) unlike prior research examining government policies as a whole, our paper separately investigates the impact of policy portfolios (i.e., production policy, purchase/usage policy and recycle policy) on perceived ease of use and perceived usefulness; (3) to identify the differences in three subclass policies playing roles in enhancing consumers’ purchase intention.
The remainder of the research is configured as below. The conceptual framework is formulated and its hypotheses are posited in Section 2. After the research methodology and data collection are described in Section 3, the research results and key findings are illustrated in Section 4 and Section 5. Section 6 concludes with a discussion of academic and practical implications. Limitations and directions for future research are presented in Section 7.
2. Conceptual Framework and Hypotheses
2.1. Conceptual Framework
It is well established that users’ intention will enhance with respects to reshape their behavior patterns and invest more effort and time to start adopting state-of-the-art technologies when they are more prone to embrace an emerging technology [34]. The technology acceptance model (TAM) is the most popular model in the research of technology adoption, which was employed by the work [32]. The technology acceptance model investigates the causal association between consumers’ intention and two critical factors, which include perceived ease of use and perceived usefulness. In the present research, NEVs are the newly-emerging and high technology-based products, and consumers may consider the degrees of NEVs’ ease of use and usefulness before they determine to purchase NEVs.
Prior studies have introduced the TAM to investigate the antecedents of consumers’ perception and intention toward new technologies, and revealed that technology acceptance model can identify the factors influencing users’ adoption intention of technologies [35]. However, some papers have argued that utilizing perceived ease of use and perceived usefulness alone to assess consumers’ attitude and behavioral intention is insufficient, thus adding other factors could improve in the explanatory power of the analysis models [33,34,35]. Considering that commercialization of a new technology is strongly associated with government policy at the initial phase of its development; thus government policy is an important antecedent of consumers’ perception toward new technologies [8]. Particularly, Purnomo and Kusnandar [36] utilized TAM to analyze the adoption of information and communication technology in the agricultural sector through policy as one of the antecedents, and found that these variables, including policy, directly influenced perceived ease of use/usefulness. Therefore, it is reasonable that TAM can be introduced to evaluate the policy portfolios impact on NEV purchase intention in our paper.
In the NEV scenario, NEVs, as a newly-appearing product, are also at the immature stage, and governments have enacted a spectrum of policies to promote NEV development. Moreover, such policies issued at different periods have various goals and objectives, some of which focus on NEV production sector [5], while some may concern about purchase/usage sector [8], and others emphasize on after-sales service sector such as recycling and remanufacturing [37]. From a social and psychological perspective, these diverse policies may generate different roles in both consumers perceived ease of use and perceived usefulness [10,38]. In the context of NEVs, consumers could perceive somewhat uncertainty in reduction of adopting NEVs from the government policy portfolios [38]. In the present research, we find the two critical factors of perceived ease of use and perceived usefulness in technology acceptance model, of which three antecedents containing production policy, purchase/usage policy and recycle policy are employed.
Therefore, in our research framework, the product life cycle policy portfolios offer an environment for NEV consumers’ decision-making under TAM, where perceived ease of use and perceived usefulness characterize consumers’ psychology, and NEV purchase intention depicts people’s behaviors under the policy portfolios scenario. Thus, we argue that the product life cycle policy portfolios can arise an individual’s positive attitude from perceived ease of use/ usefulness. Such positive impact further triggers the NEV purchase intention. The research model is shown in Figure 1.
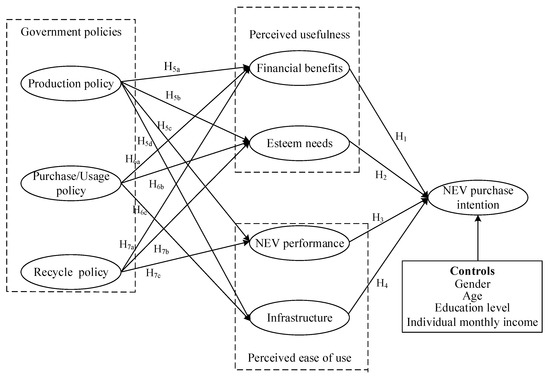
Figure 1.
Research model from the product life cycle perspective.
2.2. Hypotheses
2.2.1. TAM
(1) Perceived Usefulness and NEV Purchase Intention
Technology acceptance model (TAM) is a mature theory in predicting and explaining technology acceptance among potential users’ usage intention [35]. There are two fundamental determinants, one of which is perceived usefulness; it refers to the degree to which a person believes that using a particular system would enhance his or her work performance and help to obtain the valuable goals [32].
Given that NEVs are one kind of durable and sophisticated products, most consumers may purchase NEVs with regard to both physical utility and psychological utility [4]. Thereby, perceived usefulness would contain financial benefits and esteem needs [10].
Financial benefit is one of most important purchase factors for NEV consumers. From the consumer perspective, the usage cost of NEVs is less than that of fuel-driven cars [7]. For example, in addition to the amounts of subsidies offered to consumers’ purchase of NEVs by governments, NEV consumers also enjoy a wide variety of usage cost reduction and exemption, related to insurance fees, purchase taxes, and vehicle and vessel fees as well, hence extracting considerable benefits for NEV consumers [19]. From the social perspective, NEVs are not only environmentally-friendly transport innovativeness [2], but also energy-efficient vehicles; thus it proves NEVs can bring tremendous advantages toward our society such as exhaust emission reduction and environmental pollution curbing among others, which result in benefiting each individual accordingly [39]. In this sense, we believe that the more usefulness consumers perceive from NEVs, the more likely they would have the intention to purchase NEVs [7]. Accordingly, it is hypothesized that:
Hypothesis 1 (H1).
The financial benefits positively affect purchase intentions to NEVs.
Esteem Needs point to the admiration and approval of others which give us our level of self-respect, it is the 4th level of Maslow’s need hierarchy where people strive for a sense of personal value [40]. According to the need hierarchy theory, each individual has almost identical, unchangeable needs, such as food, sleep and social acceptance [40,41]. Such needs can be expressed in different ways based on the situation a person is in; when primary needs such as having clothing to keep warm, shelter to live in, food to avoid from starvation, are satisfied, people will pursuit high-level needs such as self-development needs, and esteem needs, which normally will be assessed from the psychological lens, rather than simply evaluated from the monetary perspective as they are for primary needs. To this end, based on the psychological self-verification theory, to label be-respected group with social fame and status, people are prone to possess or to purchase symbolic-attribute products. NEVs would serve as a symbolic product for consumers who wish to show an affinity for social position and reputation as a part of their self-identities, due to that NEVs are seen as a disruptive green innovativeness containing newly-emerging driverless and smart technology [1]. Such a symbolic-attribute product could match an individual’s esteem needs in Maslow’s hierarchy as social identity, thus driving consumers to adopt the unique and novelty product. Therefore, when potential consumers have greater esteem needs and would like to purchase NEVs, regardless how high the price of NEVs are, because the consumers deem NEVs as superior to the existing green products and deserving of a try [42,43]. In this vein, esteem needs are one critical factor influencing their purchase intention of NEVs. Then the next hypothesis is put forward:
Hypothesis 2 (H2).
Stronger perception that NEVs meet esteem needs predicts greater NEV adoption intent.
(2) Perceived Ease of Use and NEV Purchase Intention
The perceived ease of use entails the degree to which a person believes that using a specific system would be free of effort [32]. NEV performance and infrastructure have association with perceived ease of use [7]. Performance is the sum or any aspect of what a product can do for a user. A product’s performance is used by makers to identify product features and enable a user to have a set of capabilities. Performance may or may not be easy to identify [19,44]. In the context of NEV products, consumers have limited knowledge of NEV performance due to that NEVs are new, relative to CVs, especially as a NEV’s powertrain is battery and is quite different from CVs driven by fuel [30,45].
Although NEVs feature the low cost of usage, easy-to-use and the conveniences of maintenance [46], the issues regarding cruise distance and security are obvious drawbacks, which have still perplexed NEV users and makers [3]. Once consumers perceive high risks in relation to the performance aspects of new products, it is most likely to deter their adopting NEVs [47]. Functionality and usability are critical attributes influencing the purchase intention of NEVs. Thus, we have the third hypothesis in this paper:
Hypothesis 3 (H3).
The vehicle performance positively affects purchase intentions to NEVs.
Infrastructure primarily refers to the extent of which consumers feel the convenience of NEV recharging [26]. It is closely related with the number and scale of NEV’s charging facilities such as public charging stations and private charging piles [5]. The availability of charging infrastructure influences the driving experience of NEVs [46]. It is highlighted that lacking the supportive infrastructure would hinder the potential consumers to purchase NEVs to some extent [26]. CVs have competitive advantages over NEVs due to the discrepancy of service stations in number. In addition, having facilities either at work or at home is an important determinate for NEV adoption [48,49]. Especially for at-home charging, it is not only convenient, but easy to use like electric household applications [50]. Therefore, one more hypothesis is made:
Hypothesis 4 (H4).
The infrastructure positively affects purchase intentions to NEVs.
2.2.2. Antecedents of TAM
To enhance the penetration of NEVs, governments have promulgated a spectrum of policies, which guide carmakers in formulating production strategy, and aid customers in altering consumption behaviors of NEVs. Those policies have covered each echelon of one NEV supply chain, from manufacturing echelon to purchase/usage to battery recycling [19]. It is worth noting that some of the policies are obsoleted and then replaced by new ones, while others may be newly enacted to close the policy gap. The purpose of these government policies is to fuel the development of NEVs, with fostering a sound environment where consumers are willingness to purchase NEVs. Therefore, we group these policies into three subclasses from the perspective of product life cycle, namely, production policy, purchase/usage policy and recycle policy, and propose that these subclass policies are the antecedents of TAM in the setting of consumers’ NEV purchase intention.
(1) Production Policy
The development of NEV industry heavily relies on government policy supports in the infant period. Definitely, NEV production, as a crucial part of NEV industry, also requires their corresponding assistance. In terms of NEV production, Chinese government has enacted the policies regarding tax reliefs or tax allowances to reduce burden on NEVs’ manufacturers [19]. In addition, massive amounts of subsidies are provided for NEV production sector in technological breakthroughs and innovations. Currently, the most influential manufacturing policy supposed to regulate the product profile of vehicle manufacturers is dual credit policy, namely, the CAFC Regulation and NEV Credit Program, which has been taken into effect in China since April 1 2018.
The dual credit policy exercises a parallel management of carmakers’ fuel consumption credits (CAFC) and NEV credits, requiring that CV manufacturers must satisfy two conditions before being allowed to produce [5,51]. The first condition is the output of one CV requires the corresponding NEV credits; the second one is that the CV’s actual fuel consumption must be below the government’s threshold value [52,53]. To obtain must-be NEV credits, CV’s makers have two options, i.e., self-producing NEVs and purchasing credits from NEV firms [5]. From the above practices, we can see that the dual credit policy obviously curbs low-quality CV production and encourages NEV production [54]. It implies that the manufacturing of CVs, especially for lower-quality CVs, needs more NEV credits, thus in turn leading to an increase in CV’s production costs compared to NEVs [25].
In addition, the dual credit policy has rich connotations, including the development of state-of-the-art technologies such as automatic driving, voice recognition, and artificial intelligence, because NEVs are strongly associated with these sophisticated technologies, which are unique NEV attributes relative to CVs [5]. Therefore, production policy also signals that NEVs are a radical innovation to consumers, which enables consumers to regard NEVs as a kind of identity symbol [10,55]. In this regard, the dual credit policy could influence NEV manufacturers to invest in research and development sector, and hence ultimately stimulate NEV sales [5]. Additionally, to stimulate the penetration of NEVs, although the amounts of subsidy for NEV manufacturers are annually declining and will have been withdrawn by the year of 2020, the subsidies for constructing charging infrastructure are still retained.
Thus, the following hypotheses are made:
Hypothesis 5 (H5a).
The production policy has a significantly positive effect on financial benefits of NEVs.
Hypothesis 5 (H5b).
The production policy has a significantly positive effect on esteem needs of potential consumers.
Hypothesis 5 (H5c).
The production policy has a significantly positive effect on vehicle performance of NEVs.
Hypothesis 5 (H5d).
The production policy has a significantly positive effect on infrastructure of NEVs.
(2) NEV Purchase/Usage Policy
NEV purchase/usage policy involves a wide range of sectors such as vehicle and vessel tax exemption, insurance charge exemption, purchase subsidies, driving restriction rescission, and road tolls exemption, as well as parking fee exemption, with an aim to encourage NEVs’ purchase/usage. Conversely, big cities in China like Shanghai and Beijing have launched strict policies to regulate CV purchases through license-plate lottery and license plate auction [56], but such policies have typical positive effects on the diffusion of NEVs [26]. Other cities also regulate CVs to run on the street under some specific circumstances such as heavy haze weather by implementing the policy of even-and-odd-numbered plates, but such policies and regulations are not imposed on NEVs [19]. Furthermore, some policies even offer NEVs the privilege of driving on bus lanes or having their own dedicated parking lots, which make NEV drivers feel more convenient [26]. All of these NEV purchase/usage policies directly benefit the NEV consumers due to less purchase and traveling costs.
Evidences also show that these traffic policies have served as a non-economic incentive, attracting a plethora of potential consumers [57]. Quite different from driving CVs under strict restrictions, the possession of NEVs means consumers’ travel experience is improved greatly, hence lowering individual inner needs of owning CVs, and resulting in consumers’ willingness to purchase NEVs rather than CVs. In addition, although NEV retailers do not involve in infrastructure construction as NEV manufacturers do, they can freely endow consumers with charging piles as to attract consumers’ orders, because charging piles are a kind of compact and at-home recharging device, which dramatically relieve the potential consumers’ charging anxiety [42]. Accordingly, we have the following hypotheses:
Hypothesis 6 (H6a).
The NEV purchase/usage policy has a significantly positive effect on financial benefits of NEVs.
Hypothesis 6 (H6b).
The NEV purchase/usage policy has a significantly positive effect on esteem needs of potential consumers.
Hypothesis 6 (H6c).
The NEV purchase/usage policy has a significantly positive effect on infrastructure of NEVs.
(3) Recycle Policy
Since NEVs have entered the market for several years, the recycling issue is becoming a key and critical problem for the NEV industry [58], and the Chinese government has issued the policies directly related to the NEV recycling. It requires that the scraped power batteries of NEVs generated in the process of production, usage, storage and transportation should be recycled and disposed properly. A report from CATRC (China Automotive Technology and Research Center) shows that the overall sum of discarded NEV batteries are anticipated to reach approximately 170 thousand tons by 2020 [59]. With an aim to effectively and efficiently handle the ongoing problems, the Chinese Ministry of Industry and Information Technology reinforced the rules that NEV makers must fully take obligations to recycle scrapped batteries by the establishment of recycling channels in 2018 [60]. It is the first time such issue of NEVs’ used battery recycling has been put forward in China. The recycling of NEVs is a critical issue for the NEV industry; it is not only environmental concerns, but obviously affects the perceived values of NEVs, as the appropriate disposal of spent NEV batteries is a key part of recycling NEVs because battery cost almost accounts for about 40% of the total NEV cost [55]. In particular, improperly tackling used NEV batteries definitely causes severe and harmful environmental pollution and carbon emissions [61].
Developing effective recycling methods to recover all the valuable parts from used batteries is of great necessity [59]. There are two available methods to handle used batteries, i.e., gradient or echelon utilization and remanufacturing [55]. No matter which method is adopted, it is obvious that recycling will make consumers better off [58]. Many studies have investigated the retired NEV batteries in the view of economic performance, and found that the management of end-of-life NEVs have great recovery potential at the present and in the future [55,58,60]. Specifically, Ahmadi et al. investigated the recycling economic feasibility by echelon utilization of spent batteries in the off-peak wind/solar energy storage sector and found it has positive social welfares [37].
Additionally, the recycling policy could enhance consumers’ environmental awareness, due to that individuals with esteem needs are more concerned about the environment issue than the average person; it means that individuals who are inclined to pursue being respected are more likely to label themselves as environmentalists [38]. Furthermore, from the product life cycle perspective, recycling is a part of the whole process from manufacturing to disposition, and a good recycle policy can facilitate to upgrade NEV performance with respects to easy-charging and the easy-disassemble sector. Hence, we put forward the following hypotheses:
Hypothesis 7 (H7a).
The recycle policy has a significantly positive effect on financial benefits of NEVs.
Hypothesis 7 (H7b).
The recycle policy has a significantly positive effect on esteem needs of potential consumers.
Hypothesis 7 (H7c).
The recycle policy has a significantly positive effect on vehicle performance of NEVs.
2.2.3. Control Variable
To confirm the robustness of the hypothesis’ explanation, we specified several demographical variables which may affect a consumer’s purchase intention as control variables in the present study [62]. They include age, gender, education level and income which have been always utilized to investigate the impact on NEV purchase intention [14,22]. Among these control variables, gender is the most highlighted influencing factor in technology acceptance model, followed by income, education level and age. The existing papers have observed that males have more likelihood to purchase innovative products than females [34], whereas females are more inclined to buy green products than males [33]. Well-educated, young people with high income have more tendency to try new and novel technologies than poor-educated, elderly and low-paid people [35]. Thereby, to explore the relationship between policy portfolios, perceived ease of use/usefulness, and NEV purchase intention, we control four variables, namely, age, gender, income and education level.
3. Methodology
3.1. Data Collection
Data were collected with the assistance of Wenjuanxin (https://www.sojump.com/), a professional online questionnaire platform in China [7]. Prior to conducting the formal questionnaire survey, a pilot study was launched among 20 participants to fine-tune the survey questionnaire. From the feedback information, some adjustments and revisions were made to finalize the questionnaire including briefly explaining what the dual credit policy (China’s production policy) is, and modifying the words of some items to make them understandable and concise. The survey was available online for more than one month. A total of 420 responses were received, 121 invalid responses were eliminated because they are obviously inconsistent or erroneous. The final effective sample size is 299. The respondents consisted of 45.8% male and 54.2% female, whose ages are 19 to 60 or above years. Respondents aged 19 to 26 years, 27 to 36 years, 37 to 46 years, and 47 to more than 60 years comprised 16.1%, 61.9%, 17.1% and 4.9% of the participants, respectively. The scope of the respondents comes from 27 provinces and covers seven large geographical areas in China: Central China (Hubei, Jiangxi, Henan, Hunan), Northwest (Ningxia, Shanxi, Gansu), East China (Fujian, Anhui, Jiangsu, Shanghai, Zhejiang, Shandong), North China (Inner Mongolia, Shanxi, Tianjin, Hebei, Beijing), Southwest (Chongqing, Yunnan, Sichuan, Guizhou), Northeast (Heilongjiang, Jilin, Liaoning), and South China (Guangxi, Guangdong). Table 2 summarizes the demographic characteristics.
Table 2.
Respondent profile.
3.2. Measurement
Eight constructs were measured in this research: production policy, purchase/usage policy, recycle policy, financial benefits, esteem needs, NEV performance, infrastructure, and NEV purchase intention. To guarantee the quality of the constructs’ measurement, all scales were adopted from previous literature (Table 3) and assessed with multiple items. Five-point Likert scales ranging from ‘strongly disagree’ to ‘strongly agree’ were used.
Table 3.
Constructs and measurement.
NEV purchase intention pertains to the possibility for a consumer to buy NEVs, and four items of NEV purchase intention were borrowed from [14,19].Financial benefit stands for the perception of individual on the payoffs one obtains from purchasing NEVs; we adopted three items of financial benefit from the scale of [19].Esteem needs denote the whole feeling of a NEV consumer on inner pursuit of preferred self or being respected; measurement for esteem needs was adapted from the scale of [19,63], and three items were involved in this portion. NEV performance refers to how well a consumer believes NEVs’ manipulation. Measurement for NEV performance was adapted from the scale of [8], and two items were included in this portion. Infrastructure is defined as the degree of convenience that NEV consumers perceive when they charge electricity anytime and anywhere, and two items measuring this variable were adopted from the scales of [8].
Production policy refers to a consumer’s perception of dual credit policy. Three questions (PP1, PP2, and PP3) were developed specifically to this construct. In detail, PP1: Dual credit policy is effective for the expansion of NEVs; PP2: Dual credit policy is good news for potential consumers; PP3: Dual credit policy is necessary for potential consumers. Recycle policy refers to the extent of which consumers positively respond and react to spent NEV battery recycling, and two items (RP1 and RP2) were utilized to measure this variable (RP1: I will not participate in battery recycling without subsidies, and RP2: I would like to participate in battery recycling).Purchase/usage policy corresponds to the consumer opinion on the NEV consumption in the process of purchase/usage, and three items of purchase/usage policy (UP1, UP2, and UP3) were adapted from the scale of [7].
3.3. Common Method Variance
Common method variance (CMV) may be a threat to measurement accuracy due to that constructs are latent and all of the questions are answered by the same respondents [64]. We performed two techniques to test the common method variance. First, Harman’s single-factor test was conducted by running a confirmatory factor analysis [65] with eight conceptually important variables in our theoretical model including PP, UP, RP, FB, EN, performance, and infrastructure. The results from the analysis show that eight factors are present and neither one general factor nor a single factor takes up the majority of the variance, each factor accounts for less than 27.56 percent, indicating that common method variance are not a likely contaminant of our outcomes. Second, following the work [62], a common method factor test was used to check the extent of common method variance in the PLS model; we tested all items as the indicators of a new common method factor and calculated each indicator’s variances substantively explained by the principle variable and by the method. The results indicated the average substantively explained variance of the factors is 0.68, whereas the average method-based one is 0.014. Additionally, common method factor’s loadings are insignificant. The above two tests confirmed that CMV is not a major concern in this study.
4. Results
Partial Least Squares regression (PLS) was used to test the structural model and the corresponding hypotheses [62]. Before assessing the structural model, we first checked the measurement model.
4.1. Measurement Model
Evaluation of the measurement model contains the assessment of reliability, convergent validity and discriminant validity. The reliability of measurement was checked by utilizing Cronbach’s alpha and composite reliability (CR). As illustrated in Table 4, Cronbach’s scores are greater than the recommended criterion of 0.7 [66]. Additionally, CR is a more rigorous estimate of reliability, all of CR scores surpass the recommended benchmark of 0.6 [67], which implies that the measurement of reliability is good in the model.
Table 4.
Results of confirmatory factor analysis.
The convergent validity was tested by measuring the factor loading and average variance extracted (AVE). As shown in Table 4, the results indicate that the factor loadings of all items exceed 0.6 and all of AVE scores are above 0.55. Following the assessment criterion of [68], the convergent validity in our measurement model is satisfactory. In addition, we also carried out discriminant validity tests, and the results show from Table 5 that the corresponding square roots of AVE are significantly greater than the correlations between all latent constructs. They are in accordance with the benchmark provided by [68], which implies that the discriminant validity of the measurement model is meeting the criterion.
Table 5.
Square roots of AVEs and correlation coefficient matrix.
4.2. Structural Model
After having established the reliability and validity of the constructs, we assessed the structural model. Overall, the model showed the majority of the hypotheses are supported by the data.
Figure 2 and Table 6 showed that, from the perspective of perceived usefulness, the factors of financial benefits (β = 0.289, p < 0.001) and esteem needs (β = 0.303, p < 0.001) are strong predictors of NEV purchase intention. As we hypothesized that financial benefits (H1) and esteem needs (H2) would positively affect NEV purchase intention, hence H1 and H2 are supported. In terms of the two dimensions of perceived ease of use, NEV performance (β = 0.118, p < 0.001) and infrastructure (β = 0.152, p < 0.01) are the antecedents of NEV purchase intention. As we hypothesized that NEV performance (H3) and infrastructure (H4) would positively affect NEV purchase intention, then H3 and H4 are supported.
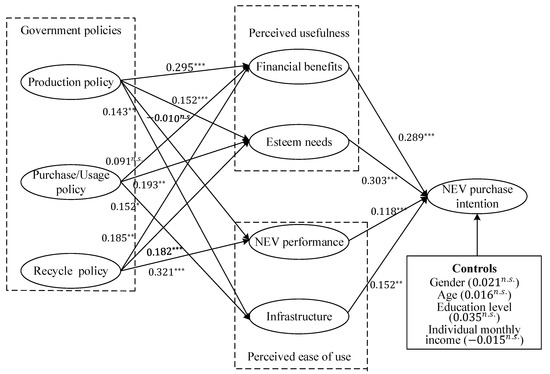
Figure 2.
Result of hypothesis testing. Note: * p < 0.05; ** p < 0.01; *** p < 0.001; n.s. non-significant.
Table 6.
Results of structural model analysis.
As for the path from production policy to financial benefits, esteem needs, infrastructure and NEV performance, the results were somewhat mixed. Production policy was found to have significantly positive effects on financial benefits (β = 0.295, p < 0.001), esteem needs (β = 0.152, p < 0.001), and infrastructure (β = 0.143, p < 0.01), thus supporting H5a, H5b and H5d. However, the correlation between production policy and NEV performance (β = −0.010, p = 0.858) is negative. Therefore, H5c is rejected. As for the paths from purchase/usage policy to financial benefits, esteem needs and infrastructure, the results were somewhat mixed as well. Purchase/usage policy has significantly positive effects on esteem needs (β = 0.193, p < 0.01) and infrastructure (β = 0.152, p < 0.05), thus supporting H6b and H6c, while H6a is not supported due to that it does not significantly affect financial benefits (β = 0.091, p = 0.126). With respect to the effect of recycle policy, it was found that recycle policy has significantly positive effects on financial benefits (β = 0.185, p < 0.01), esteem needs (β = 0.182, p < 0.001) and NEV performance (β = 0.321, p < 0.001), hence supporting H7a, H7b and H7c.
The analysis contained control variables. None of the four control variables has significant effects on NEV purchase intention presented in Figure 2. Such outcome is partially aligned with the results of [8], yet opposite to the work [14] in which the income factor significantly and positively influences consumers’ adoption intention of NEVs.
4.3. Mediation Analysis
Our hypothesized model implies that both perceived ease of use and perceived usefulness mediate the link between policy portfolios and NEV purchase intention. The bootstrapping method, proposed by [69], was used to calculate the indirect effects. The mediation analysis was performed at a 95% confidence interval based on 10,000 bootstrap samples. Based on the recommendation of [69], the confidence interval of the lower and upper bounds was computed to check whether the indirect effects are significant. If zero is contained in the interval, it implies that the indirect effect is insignificant. The results showed (Table 7) that both NEV performance and financial benefits do not play a mediating role in the relation between NEV purchase intention and production policy or purchase/usage policy. Whereas the mediating effects of financial benefits, esteem needs, NEV performance and infrastructure are all significant among the paths toward NEV purchase intention.
Table 7.
Bootstrap test for mediating effects.
4.4. Separate Effect of Single Policy
To have a more holistic understanding of the effect of policy portfolios, we conducted a separate analysis with respect to each subclass policy, that is, to evaluate how production policy, purchase/usage policy and recycle policy exert influence on consumers’ NEV purchase intention, separately. The comparative results are presented in Table 8.
Table 8.
Results of single policy analysis.
From Table 8, in the setting of the separate analysis, it concluded that either perceived usefulness factors (financial benefits and esteem needs) or perceived ease of use factors (NEV performance and infrastructure) have significant effects on NEV purchase intention. Among three subclass policies, we also find that financial benefits are most influenced by production policy (0.362), then by purchase/usage policy (0.199), and recycle policy (0.185); while esteem needs are most affected by purchase/usage policy (0.260), followed by production policy (0.247) and recycle policy (0.182). In addition, purchase/usage policy is a stronger predictor of infrastructure than production policy.
Comparing between the separate and combined analysis, we also found that the impact of production policy either alone or in combination with the other subclass policies on NEV performance remains insignificant. Parallelly, purchase/usage policy alone exerts a significant effect on financial benefits, yet shows no effect under the policy portfolio, that is, to say such effect of stimulating purchase will weaken under the policy portfolios scenario. Most importantly, the outcomes illustrated that both perceived usefulness and perceived ease of use have more significant effects on NEV purchase intention under the combined analysis (i.e., policy portfolio scenario) than under the separate analysis, thus confirming that the product life cycle policy portfolios are effective ways to accelerate the diffusion of NEVs.
5. Discussion
This study has investigated how product life cycle policy portfolios influence consumers’ intentions to purchase NEVs with the perceptions of perceived ease of use and perceived usefulness.
First, the results suggest two components of perceived usefulness are the antecedents of consumers’ intention to purchase NEVs. Within which, financial benefit positively affects consumers’ NEV purchase intention (H1), such findings confirm the results of prior research that consumers are willing to purchase NEVs under financial incentives [15]. In addition, the result is consistent with [19]. They argued that esteem needs are a reliable predictor of individual purchase intention toward NEVs, which implies that consumers with higher esteem needs are more inclined to purchase NEVs. It suggests that enhancing consumers’ financial benefits and esteem needs can increase their perceived usefulness, hence promoting consumers’ NEV purchase intention.
With regard to perceived ease of use, both NEV performance and infrastructure are the antecedents of NEV purchase intention. The former is supported by previous research that NEV performance is a strong driving force of consumers’ purchase intention of vehicles [48]. Conversely, it is deemed that consumers who are highly skeptical of NEV performance would reject to purchase NEVs [44]. This suggests that with the improvement of NEV performance, the market expansion of NEVs can be achieved. Additionally, the latter’s effect is also verified by prior study [8]. They reported that the availability of charging infrastructure is of great importance in popularizing NEVs. Meanwhile, the positive effect of infrastructure on NEV purchase intention exceeds that of NEV performance. The conclusion demonstrates that consumers are giving priority to the factor of convenience of charging rather than the factor of NEV performance when they decide to purchase NEVs. It implies that construction of charging infrastructure is in urgent need of promoting NEV adoption at the infant stage.
Second, government policy portfolios have significant effects on consumers’ perceived usefulness and ease of use. As for perceived usefulness, production policy and recycle policy are antecedents of financial benefits, whereas purchase/usage policy is not. Production policy, purchase/usage policy and recycle policy positively affect esteem needs. Three subclass policies related to NEVs play different roles in an individual’s perception when consumers make purchase decisions. In the context of government policy portfolios, the results are consistent with prior research regarding production policy. They argued that subsidy policy related to manufacturing could improve consumers’ financial benefits and esteem needs [8]. However, the insignificant influence of purchase/usage policy on financial benefits is inconsistent with previous study [44]. Compared with production policy and recycle policy, consumers are more directly affected by purchase/usage policy.
In terms of perceived ease of use, purchase/usage policy and production policy are the antecedents of infrastructure. Recycle policy is the antecedent of NEV performance, whereas the effect of production policy on NEV performance is insignificant. The conclusion is partially consistent with prior work that expanding NEV production scale and market size can enhance the construction of infrastructure [42], and that production incentives can strengthen improvement in NEV technologies [17]. The results suggest that sound production policy and purchase/usage policy are effective and useful tools of the promotion of infrastructure construction. Meanwhile, recycle policies related to batteries should be further amended to facilitate improvement in NEV battery functionality and quality [5].
Third, the significant positive effect of production policy on financial benefits is greater than that of infrastructure, and the positive effect of recycle policy on NEV performance is larger than that of financial benefits. It reveals that production policy plays a critical role in perceived financial benefit relative to infrastructure, and recycle policy also helps consumers more easily perceive NEV performance than financial benefits, with the results partially supported by the work from the literature [5,55]. Meanwhile, purchase/usage policy has a significant positive influence on infrastructure, which implies that such policy is supportive for the constructing of NEV charging infrastructures [42]. On the contrary, the insignificant influence of purchase/usage policy on financial benefits gives the indication that financial incentives have limited effect on promoting the adoption of NEVs. Such findings are an augment to prior studies that with the implementation of the dual credit policy, an incentive subsidy does not further boost the development of NEVs [55].
Fourth, perceived ease of use and perceived usefulness are serving as mediators between government policy portfolios and NEV purchase intention. In details, production policy does have a significant positive effect on NEV purchase intention through the mediating effect of financial benefits, esteem needs and infrastructure. Esteem needs and infrastructure play mediation roles between purchase/usage policy and NEV purchase intention, whereas financial benefits have no significant mediating effect compared to the two above subclass policies, while the indirect effects of recycle policy on NEV purchase intention are significantly positive via the mediating factors of financial benefits, esteem needs and NEV performance.
6. Implications
Issuing a series of policy is a common practice to promote the diffusion of NEVs. This study examined the influence of three subclass policies (production policy, purchase/usage policy and recycle policy) on consumers’ NEV purchase intention through perceived ease of use/usefulness. Some crucial theoretical and practical implications are obtained.
The study makes several theoretical implications to research. First, this research has investigated the impact of product life cycle policy portfolios on NEV purchase intention of consumers based on TAM. Prior studies have examined the indirect moderating role of government policies in NEV adoption; but the purpose of the current study is to empirically assess the influence of different subclass policies on consumers’ purchase intention toward NEVs through perceived usefulness and perceived ease of use. The present study is one of the first to examine the effect of product life cycle policy portfolios, i.e., production, purchase/usage, and recycle policy, on consumers’ willingness to purchase NEVs, hence illustrating the positive function of product life cycle policy mix. Additionally, we also find that esteem needs have the association with consumers’ purchase process under the policy portfolio scenario, thus uncovering the psychological mechanism of NEV purchasing intention.
Second, prior research has seldom focused on product life cycle policy portfolios, which is referred to how consumers’ purchase intention responds when they are exposed to the different policy mix. The present study finds that the product life cycle policy portfolios is an important factor before consumers determine to purchase NEVs. This study also enriches the literature on the role of the constitution of government policy in consumers’ purchase decision of NEVs.
Third, extant work has yet comprehensively explored the mediating role of cognitive acceptance of NEVs between different subclass policies and purchase intention. The current study finds that government policy portfolios have indirect effects on NEV purchase intention through mediating effect of financial benefits, esteem needs, NEV performance and infrastructure.
This study also has practical implications. The results indicate the guiding role of policy portfolios in the penetration of NEVs, and provide government, retailers and carmakers with an in-depth understanding of how policy portfolios can affect NEV purchase intention. First, government should have a holistic view on issuing different subclass policies and effectively constituting policy portfolios. This is because different subclass policies have unique and different roles in consumers’ perception.
Second, given the policy portfolios with three subclass policies, the perceived financial benefits, esteem needs, NEV performance and infrastructure positively affect NEV purchase intention. For such reasons, the strategies for enhancing consumers’ perception on usefulness and ease of use toward NEVs should be adopted. For instance, carmakers could propagate the symbolic meaning of driving NEVs through advertisements, and the government should encourage more social capitals invested in the amplification of infrastructure (charging stations) to alleviate consumers’ charging anxiety.
Third, given that recycle policy is the antecedent of NEV performance whereas the production policy is not, the government, on one hand, should perfect the existing NEV recycle policy, especially for spent battery recycling; meanwhile, it would be a wise move for the government to put recycle policy into other subclasses to yield a package of policies with an aim to consumers’ full understanding of perceived values toward NEVs. On the other hand, the government should reinforce the implementation of market-based dual credit policy, and carmakers should speed up the steps of upgrading and improving NEV technologies, which reverses the misconception of production policy mainly focusing on NEV production size but neglecting its quality and functionality; it is why the old-version production policy results in the insignificant effect on NEV performance in this analysis model.
Fourth, as the production policy, purchase/usage policy, and recycle policy are the antecedents of esteem needs, meanwhile, production policy and purchase/usage policy positively influence infrastructure. Therefore, the government should underline or disseminate the distinct natures of NEVs in a different subclass of policies to capture consumers’ attention. For example, self-driving and car networking technology can be highlighted in production policy, free or discount charges for public parking lots in usage policy, and the reimbursement of disposal or trade-in used battery in recycle policy. In addition, both production policy and recycle policy should include the contents regarding construction of charging infrastructure, for instance, charging infrastructure’s functions can be extended from merely electricity charging to battery replacement, even to used battery collection for recycling.
Fifth, given that production policy and recycle policy are the antecedents of financial benefit whereas purchase/usage policy is not a significant influential factor, the government should slow down the paces of shrinking subsidies for consumers’ purchase of NEVs, thus narrowing the perceived benefit gap between the previous subsidy policy and the current one, otherwise, it will curb consumers’ willingness to buy NEVs due to the dramatic drop in perceived financial benefits.
7. Conclusion, Limitations and Future Research
A policy-perception-intention framework was proposed to investigate the predictors of consumers’ NEV purchase intention from the perspective of product life cycle policy portfolios. Based on the technology acceptance model (TAM), we examined the effects of both usefulness and ease of use of consumers’ perception on purchase behavior. The former has two dimensions, i.e., financial benefit and esteem needs, whereas the latter has two facets, i.e., NEV performance and infrastructure. Meanwhile, we investigated the influence of three subclass policies (production policy, purchase/usage policy and recycle policy) on consumers’ NEV purchase intention and the mediating role of consumers’ perceptions. The results showed that product life cycle policy portfolios and consumers’ perceptions are important determinants of their NEV purchase intention. All factors of perceived usefulness and perceived ease of use have positive effects on purchase intention. Meanwhile, consumers’ perceptions play a critical mediating role between policy portfolios and NEV purchase intention.
Our study also has several limitations. First, the data were collected from the online survey platform participants in China; with different cultures and preferences in various nations, the findings may alter when the analysis model extends to other nations and regions. Second, NEV purchase intention is the dependent variable in the current study, but purchase intention is not yet equivalent of actual purchase behavior; the divergence between purchase intention and actual behavior is really in existence. Hence, future research may examine NEV usage by considering actual purchase behavior as a dependent variable in the analysis model. Third, NEVs in the present work include all NEV categories and all brands, and consumers may have different perceptions toward NEVs, in terms of quality, functionality and utilities when they experience NEV products of various types and brands, thus, some specific groups of NEVs must be addressed in future research. Finally, though the current work reveals that different subclass policies and its portfolios affect consumer NEV purchase intention through their perception of usefulness and ease of use, whether perceived risks and negative utilities share exactly the critical role in the effect of policy portfolios on purchase intention was not clarified; future work can further distinguish it.
Author Contributions
Conceptualization, J.L.; data curation, D.Y.; formal analysis, Y.Z.; investigation, Y.Z.; methodology, D.Y.; validation: Y.Z.; writing—original draft, J.L. and Y.Z.; writing—review and editing, C.L., J.L. and Y.Z. All authors have read and agreed to the published version of the manuscript.
Funding
The paper was funded by the National Natural Science Foundation of China (71964023, 71472143, 71872076); Social Science Key Program of Jiangxi and Hubei Province (17GL01, GL17121, 20181ACB29003, 19D048); Postgraduate Innovation Program of Jiangxi Province (YC2019-B030).
Acknowledgments
We are thankful for the suggestions and efforts of the reviewers and editors.
Conflicts of Interest
The authors declare no conflict of interest.
References
- White, L.V.; Sintov, N.D. You are what you drive: Environmentalist and social innovator symbolism drives electric vehicle adoption intentions. Transp. Res. Part A Policy Pract. 2017, 99, 94–113. [Google Scholar] [CrossRef]
- Thøgersen, J. Transport-related lifestyle and environmentally-friendly travel mode choices: A multi-level approach. Transp. Res. Part A Policy Pract. 2018, 107, 166–186. [Google Scholar] [CrossRef]
- Zhang, L.; Long, R.; Chen, H.; Yang, T. Analysis of an optimal public transport structure under a carbon emission constraint: A case study in Shanghai, China. Environ. Sci. Pollut. Res. 2018, 25, 3348–3359. [Google Scholar] [CrossRef] [PubMed]
- Wang, Z.; Wang, C.; Hao, Y. Influencing factors of private purchasing intentions of new energy vehicles in China. J. Renew. Sustain. Energy 2013, 5, 63133. [Google Scholar] [CrossRef]
- Li, J.; Ku, Y.; Liu, C.; Zhou, Y. Dual credit policy: Promoting new energy vehicles with battery recycling in a competitive environment. J. Clean. Prod. 2019. [Google Scholar] [CrossRef]
- Larson, P.D.; Viáfara, J.; Parsons, R.V.; Elias, A. Consumer attitudes about electric cars: Pricing analysis and policy implications. Transp. Res. Part A Policy Pract. 2014, 69, 299–314. [Google Scholar] [CrossRef]
- Wang, S.Y.; Wang, J.; Jun, L.; Jinpeng, W.; Liang, L. Policy implications for promoting the adoption of electric vehicles: Do consumer’s knowledge, perceived risk and financial incentive policy matter? Transp. Res. Part A 2018, 117, 58–69. [Google Scholar] [CrossRef]
- Wang, Z.; Zhao, C.; Yin, J. Purchasing intentions of Chinese citizens on new energy vehicles: How should one respond to current preferential policy? J. Clean. Prod. 2017. [Google Scholar] [CrossRef]
- Yu, P.; Zhang, J.; Yang, D.; Lin, X.; Xu, T. The Evolution of China’s new energy vehicle industry from the perspective of a technology–market–policy Framework. Sustainability 2019, 11, 1711. [Google Scholar] [CrossRef]
- Schuitema, G.; Anable, J.; Skippon, S.; Kinnear, N. The role of instrumental, hedonic and symbolic attributes in the intention to adopt electric vehicles. Transp. Res. Part A Policy Pract. 2013, 48, 39–49. [Google Scholar] [CrossRef]
- Hoen, A.; Koetse, M.J. A choice experiment on alternative fuel vehicle preferences of private car owners in the Netherlands. Transp. Res. Part A Policy Pract. 2014, 61, 199–215. [Google Scholar] [CrossRef]
- Meng, F.; Jin, X. Evaluation of the development capability of the new energy vehicle industry: An empirical study from China. Sustainability 2019, 11, 2635. [Google Scholar] [CrossRef]
- Rezvani, Z.; Jansson, J.; Bodin, J. Advances in consumer electric vehicle adoption research: A review and research agenda. Transp. Res. Part D Transp. Environ. 2015, 34, 122–136. [Google Scholar] [CrossRef]
- He, X.H.; Zhan, W.J.; Yingying, H. Consumer purchase intention of electric vehicles in China: The roles of perception and personality. J. Clean. Prod. 2018, 204, 1060–1069. [Google Scholar] [CrossRef]
- Huang, X.Q.; Ge, J.P. Electric vehicle development in Beijing: An analysis of consumer purchase intention. J. Clean. Prod. 2019, 216, 361–372. [Google Scholar] [CrossRef]
- The State Council. Auto Industry Adjustment and Renovation Plan; The State Council: Beijing, China, 2009. [Google Scholar]
- Zhang, X.; Bai, X. Incentive policies from 2006 to 2016 and new energy vehicle adoption in 2010–2020 in China. Renew. Sustain. Energy Rev. 2017, 70, 24–43. [Google Scholar] [CrossRef]
- MOF. Notice on Implementing Energy Saving and New Energy Vehicle Pilot Program; MOF/MOST: Beijing, China, 2009. [Google Scholar]
- Zhang, X.; Wang, K.; Hao, Y. The impact of government policy on preference for NEVs: The evidence from China. Energy Policy 2013, 61, 382–393. [Google Scholar] [CrossRef]
- Lin, B.; Wu, W. Why people want to buy electric vehicle: An empirical study in first-tier cities of China. Energy Policy 2018, 112, 233–241. [Google Scholar] [CrossRef]
- MOF. Notice on Implementing New Energy Vehicle Private Buyer Subsidy Pilot Project; MOF/MOST/MIIT/NDRC: Beijing, China, 2010. [Google Scholar]
- Lim, M.K.; Mak, H.Y.; Rong, Y. Toward mass adoption of electric vehicles: Impact of the range and resale anxieties. Manuf. Service Oper. Manage 2014, 17, 101–119. [Google Scholar] [CrossRef]
- Rothwell, R.; Zegveld, W. Industrial Innovation and Public Policy: Preparing for the 1980’s and the 1990’s; Frances Pinter: London, UK, 1981. [Google Scholar]
- Huang, C.; Shyu, J.; Tzeng, G. Reconfiguring the innovation policy portfolios for Taiwan’s SIP Mall industry. Technovation 2007, 27, 744–765. [Google Scholar] [CrossRef]
- Zhou, D.Q.; Yu, Y.; Wang, Q.W. Effects of a generalized dual-credit system on green technology investments and pricing decisions in a supply chain. J. Environ. Manag. 2019, 247, 269–280. [Google Scholar] [CrossRef] [PubMed]
- Wu, J.; Yang, Z.; Hu, X.; Wang, H.; Huang, J. Exploring driving forces of sustainable development of China’s new energy vehicle industry: An analysis from the perspective of an innovation ecosystem. Sustainability 2018, 10, 4827. [Google Scholar] [CrossRef]
- Ma, S.C.; Fan, Y.; Feng, L. An evaluation of government incentives for new energy vehicles in China focusing on vehicle purchasing restrictions. Energy Policy 2017, 110, 609–618. [Google Scholar] [CrossRef]
- Ministry of Science and Technology. International Forum on Electric Vehicle PILOT and industrial Development; MOST: Shanghai, China, 2016. [Google Scholar]
- China Association of Automobile Manufacturers. Vehicle Sales Information Database; China Association of Automobile Manufacturers: Beijing, China, 2019. [Google Scholar]
- Park, E.; Ohm, J.Y. Factors influencing the public intention to use renewable energy technologies in South Korea: Effects of the Fukushima nuclear accident. Energy Policy 2014, 65, 198–211. [Google Scholar] [CrossRef]
- Lopes, M.M.; Moura, F.; Martinez, L.M. A rule-based approach for determining the plausible universe of electric vehicle buyers in the Lisbon Metropolitan Area. Transp. Res. Part A Policy Pract. 2014, 59, 22–36. [Google Scholar] [CrossRef]
- Davis, F.D. Perceived Usefulness, Perceived Ease of Use, and User Acceptance of Information Technology. MIS Quart. 1989, 13, 319–340. [Google Scholar] [CrossRef]
- Lin, J.C.C.; Lu, H. Towards an understanding of the behavioral intention to use a web site. Int. J. Inform. Manag. 2000, 20, 197–208. [Google Scholar]
- Mathieson, K.; Peacock, E.; Chin, W. Extending the technology acceptance Model: The influence of perceived user resources. Data Base Adv. Inform. Syst. 2001, 32, 86–112. [Google Scholar] [CrossRef]
- King, W.R.; He, J.A. A meta-analysis of the technology acceptance model. Inform. Manag. 2006, 43, 740–755. [Google Scholar] [CrossRef]
- Purnomo, H.K. Barriers to acceptance of information and communication technology in agricultural extension in Indonesia. Inform. Dev. 2018. [Google Scholar] [CrossRef]
- Ahmadi, L.; Yip, A.; Fowler, M.; Young, S.; Fraser, R. Environmental feasibility of re-use of electric vehicle batteries. Sustain. Energy Assess. Technol. 2014, 6, 64–74. [Google Scholar] [CrossRef]
- Noppers, E.H.; Keizer, K.; Bolderdijk, J.W.; Steg, L. The adoption of sustainable innovations: Driven by symbolic and environmental motives. Global Environ. Change 2014, 25, 52–62. [Google Scholar] [CrossRef]
- Liu, Y.; Hong, Z.; Zhu, J.; Yan, J.; Qi, J.; Liu, P. Promoting green residential buildings: Residents’ environmental attitude, subjective knowledge, and social trust matter. Energy Policy 2018, 112, 152–161. [Google Scholar] [CrossRef]
- Maslow, A.H. Motivation and Personality, 3 ed.; Longman: Boston, MA, USA, 1970. [Google Scholar]
- Schulte, I.; Hart, D.; Vander Vorst, R. Issues affecting the acceptance of hydrogen fuel. Int. J. Hydrog. Energy 2004, 29, 677–685. [Google Scholar] [CrossRef]
- Hahnel, U.J.J.; Ortmann, C.; Korcaj, L.; Spada, H. What is green worth to you? Activating environmental values lowers price sensitivity towards electric vehicles. J. Environ. Psychol. 2014, 40, 306–319. [Google Scholar] [CrossRef]
- Jansson, J.; Nordlund, A.; Westin, K. Examining drivers of sustainable consumption: The influence of norms and opinion leadership on electric vehicle adoption in Sweden. J. Clean. Prod. 2017, 154, 176–187. [Google Scholar] [CrossRef]
- She, Z.Y.; Qing, S.; Ma, J.J. What are the barriers to widespread adoption of battery electric vehicles? A survey of public perception in Tianjin, China. Transp. Policy 2017, 56, 29–40. [Google Scholar] [CrossRef]
- Pagiaslis, A.; Krontalis, A.K. Green consumption behavior antecedents: Environmental concern, knowledge, and beliefs. Psychol. Market. 2014, 31, 335–348. [Google Scholar] [CrossRef]
- Schlüter, J.; Weyer, J. Car sharing as a means to raise acceptance of electric vehicles: An empirical study on regime change in automobility. Trans. Res. Part F Traffic Psychol. Behav. 2019, 60, 185–201. [Google Scholar] [CrossRef]
- Aggarwal, P.; Cha, T.; Wilemon, D. Barriers to the adoption of really-new products and the role of surrogate buyers. J. Cons. Market. 1998, 15, 358–371. [Google Scholar] [CrossRef]
- Krupa, J.S.; Rizzo, D.M.; Eppstein, M.J.; Brad Lanute, D.; Gaalema, D.E.; Lakkaraju, K.; Warrender, C.E. Analysis of a consumer survey on plug-in hybrid electric vehicles. Transp. Res. Part A Policy Pract. 2014, 64, 14–31. [Google Scholar] [CrossRef]
- Jensen, A.F.; Cherchi, E.; Mabit, S.L. On the stability of preferences and attitude before and after experiencing an electric vehicle. Transp. Res. Part D Transp. Environ. 2013, 25, 24–32. [Google Scholar] [CrossRef]
- Caperello, N.D.; Kurani, K.S. Households’ stories of their encounters with a plugin hybrid electric vehicle. Environ. Behav. 2012, 44, 493–508. [Google Scholar] [CrossRef]
- Shi, O.; Zhen, L.; Liang, Q. The dual-credit policy: Quantifying the policy impact on plug-in electric vehicle sales and industry profits in China. Energy Policy 2018, 121, 597–610. [Google Scholar]
- Wang, S.N.; Zhao, F.Q.; Liu, Z.W.; Hao, H. Impacts of a super credit policy on electric vehicle penetration and compliance with China’s Corporate Average Fuel Consumption regulation. Energy 2018, 155, 746–762. [Google Scholar] [CrossRef]
- Li, J.; Ku, Y.; Yu, Y.; Liu, C. Optimizing production of new energy vehicles with across chain cooperation under China’s dual credit policy. Energy 2020, 2, 1330–1340. [Google Scholar] [CrossRef]
- Luo, C.; Leng, M.; Huang, J.; Liang, L. Supply chain analysis under a price-discount incentive scheme for electric vehicles. Eur. J. Oper. Res. 2020, 235, 329–333. [Google Scholar] [CrossRef]
- Li, Y.; Zhang, Q.; Liu, B. Substitution effect of New-Energy Vehicle Credit Program and Corporate Average Fuel Consumption Regulation for Green-car Subsidy. Energy 2018, 152, 223–236. [Google Scholar] [CrossRef]
- Yu, H.; Pan, S.Y.; Tang, B.J.; Mi, Z.F.; Zhang, Y.; Wei, Y.M. Urban energy consumption and CO2 emissions in Beijing: Current and future. Energy Eff. 2015, 8, 527–543. [Google Scholar] [CrossRef]
- Hao, H.; Ou, X.; Du, J.; Wang, H.; Ouyang, M. China’s electric vehicle subsidy scheme: Rationale and impacts. Energy Policy 2014, 73, 722–732. [Google Scholar] [CrossRef]
- Assunçao, A.; Moura, P.S.; de Almeida, A.T. Technical and economic assessment of the secondary use of repurposed electric vehicle batteries in the residential sector to support solar energy. Appl. Energy 2016, 181, 120–131. [Google Scholar] [CrossRef]
- Al-Thyabat, S.; Nakamura, T.; Shibata, E.; Iizuka, A. Adaptation of minerals processing operations for lithium-ion (LiBs) and nickel metal hydride (NiMH) batteries recycling: Critical review. Miner. Eng. 2013, 45, 4–17. [Google Scholar] [CrossRef]
- Stanway, D. China Puts Responsibility for Battery Recycling on Makers of Electric Vehicles. Available online: https://auto.economictimes.indiatimes.com/news/industry/china-puts-responsibility-for-battery-recycling-on-makers-of-electric-vehicles/63081241 (accessed on 25 February 2020).
- Ahmadi, L.; Young, S.; Fowler, M.; Fraser, R.; Achachlouei, M. A cascaded life cycle: Reuse of electric vehicle lithium-ion battery packs in energy storage systems. Int. J. Life Cycle Assess. 2017, 22, 111–124. [Google Scholar] [CrossRef]
- Liang, H.G.; Saraf, N.; Hu, Q.; Xue, Y.J. Assimilation of enterprise systems: The effect of institutional pressures and the mediating role of top management. Mis Quart. 2007, 31, 59–87. [Google Scholar] [CrossRef]
- Noppers, E.H.; Keizer, K.; Milovanovic, M. The importance of instrumental, symbolic, and environmental attributes for the adoption of smart energy systems. Energy Policy 2016, 98, 12–18. [Google Scholar] [CrossRef]
- Malhotra, N.K.; Kim, S.S.; Patil, A. Common method variance in IS research: A comparison of alternative approaches and a reanalysis of past research. Manag. Sci. 2016, 52, 1865–1883. [Google Scholar] [CrossRef]
- Podsakoff, P.M.; Organ, D.W. Self-reports in organizational research: Problems and prospects. J. Manag. 1986, 12, 531–544. [Google Scholar] [CrossRef]
- Nunnally, J.; Bernstein, I. Psychometric Theory; McGraw-Hill: New York, NY, USA, 1978. [Google Scholar]
- Chin, W.W.; Gopal, A. Adoption intention in GSS: Relative importance of beliefs. Data Base Adv. Inform. Syst. 1995, 26, 42–64. [Google Scholar] [CrossRef]
- Fornell, C.; Larcker, D. Evaluating structural equation models with unobservable variables and measurement error. J. Mark. Res. 1981, 18, 39–50. [Google Scholar] [CrossRef]
- Preacher, K.J.; Hayes, A.F. Asymptotic and resampling strategies for assessing and comparing indirect effects in multiple mediator models. Behav. Res. Methods 2008, 40, 879–891. [Google Scholar] [CrossRef]


© 2020 by the authors. Licensee MDPI, Basel, Switzerland. This article is an open access article distributed under the terms and conditions of the Creative Commons Attribution (CC BY) license (http://creativecommons.org/licenses/by/4.0/).