Article

Variability of Soil Water Heat and Energy Transfer Under Different Cover Conditions in a Seasonally Frozen Soil Area

1
School of Water Conservancy and Civil Engineering, Northeast Agricultural University, Harbin 150030, China
2
Heilongjiang Agricultural Reclamation Survey and Design Institute, Harbin 150090, China
3
School of Environment, Tsinghua University, Beijing 100084, China
4
Key Laboratory of Effective Utilization of Agricultural Water Resources of Ministry of Agriculture, Northeast Agricultural University, Harbin 150030, China
5
Heilongjiang Provincial Key Laboratory of Water Resources and Water Conservancy Engineering in Cold Region, Northeast Agricultural University, Harbin 150030, China
*
Authors to whom correspondence should be addressed.
Sustainability 2020, 12(5), 1782; https://doi.org/10.3390/su12051782
Submission received: 8 February 2020 / Revised: 20 February 2020 / Accepted: 21 February 2020 / Published: 27 February 2020

Abstract

:
In a seasonally frozen soil area, there is frequent energy exchange between soil and environment, which changes the hydrological cycle process, and then has a certain impact on the prediction and management of agricultural soil moisture. To reveal the effects of different modes of regulation on the energy budget of soil in a region with seasonally frozen soil, four treatments, including the regulation of bare land (BL), biochar (CS), and straw (JS), and the combined regulation of biochar and straw (CJS), were used in field experiments. The variations in the soil temperature, liquid water content, and total water content were analyzed, the energy budget of the soil was calculated, the response functions of the soil energy were determined, and the mechanism of soil energy transfer was elucidated. The results showed that, during the freezing period, the JS treatment reduced the amplitudes of the variations in the soil temperature and liquid water content and increased the water content at the soil surface. During the thawing period, the CJS treatment effectively improved the soil hydrothermal conditions. During the freezing period, the heat absorbed by the CS and JS treatments reduced the fluctuation of the soil energy budget. At a soil depth of 10 cm, the spectral entropy of a time series of the soil net energy was 0.837 under BL treatment, and the CS, JS, and CJS treatments decreased by 0.015, 0.059, and 0.045, respectively, compared to the BL treatment. During the thawing period, the CS treatment promoted energy exchange between the soil and the external environment, and the spectral entropy of a time series of the soil net energy was increased; the JS treatment had the opposite effect. The CJS treatment weakened the impact of environmental factors on the soil energy budget during the freezing period, while it enhanced the energy exchange between the soil and the environment during the thawing period. This study can provide important theoretical and technical support for the efficient utilization of soil hydrothermal resources on farmland in cold regions.

1. Introduction

It is generally known that seasonally frozen soil, as part of the Soil–Plant–Atmosphere Continuum system, frequently alternates between freezing and thawing and is the main location of energy–water–gas exchange between the atmosphere and land surfaces in cold regions [1,2,3]. The freeze–thaw process of soil changes the effects of sensible heat and latent heat between the soil and the atmosphere and affects the hydraulic properties of the soil itself, which directly affects the process of soil water migration [4,5]. As a result of thawing–freezing, water in the soil undergoes a phase change and redistribution; under the influence of the water potential gradient, water migrates to the frozen front, leading to an increase in the total water content in the frozen zone [6,7,8]. Moreover, in the period of soil melting, the thawed water infiltration increases the amount of water in shallow soil layers and reduces the transfer and dissipation of heat in the soil, which has a significant effect on mitigating water resources shortages and spring drought and correspondingly benefiting for crop growth at the seedling stage [9,10]. Therefore, the energy transfer between soil and environment affects the interaction effect of water and heat in soil [11,12,13].
As an important agricultural measure, soil cover can significantly regulate soil moisture and has attracted the attention of scholars in China and abroad. As early as the 1930s, Hallsted et al. [14] studied the ecological effects of the use of straw cover on farmland. Since then, many scientists have built upon this work and continued to study this area, and the research contents have mainly included the hydrothermal energy transfer in the soil, soil nutrients, and the evolutionary pattern of microbial activities under cover conditions. Specifically, Nagare et al. [15] carried out an indoor one-way freezing simulation to study the spatial redistribution of the soil water-heat during the soil freezing process. Guglielmin et al. [16] thought that the relationship between the hydrothermal process and the vegetation in the active layer of frozen soil is a sensitive indicator for studying climate change. Chen et al. [17] studied the soil evaporation variability under different mulch treatments and found that, compared to BS treatment, soil evaporation of straw mulchings in the stable freeze stage was reduced by 49.0% to 58.8%, while there was only a small difference among straw mulchings during the thaw period. Xu et al. [18] simulated the dynamic change and transfer of water and heat in frozen soil by establishing a one-dimensional numerical model. Yang et al. [19] studied the effects of mulching coverage and double coverage on the temperature in the profile of frozen–thawed soil and proposed that regulating the surface cover affected the net radiation obtained by the soil, which, in turn, affected the evolution of the hydrothermal environment in soil. Tang et al. [20] found that covering inhibited the migration of soil salt to the soil surface, and the variation characteristics of soil water and salt exhibited a decreasing trend as the soil depth increased. Most of the above studies focused on the regulation effects of covering on soil hydrothermal conditions during the freezing–thawing cycle, while neglecting the energy transfer process between the soil and the environment under changing environments.
In this study, using biochar and straw as soil conditioner, based on the analysis of soil water and heat status, the budget of soil energy in different regulation modes was analyzed. Furthermore, the soil energy transfer function was constructed by combining sensitive meteorological factors, and the mechanism of soil energy transfer and conversion was elucidated under freezing and thawing conditions. This study aims to provide theoretical and technical support for the efficient use of hydrothermal resources in frozen–thawed soils.

2. Materials and Methods

2.1. Study Area

The study area is located in the hinterland of the Songnen Plain in northeast China, with a geographical location of 45°44′24″ N and 126°43′7″ E. This region has a continental monsoon climate, with warm and humid summers, cold and dry winters, and a freezing period that lasts from November to March of the following year. The average annual precipitation is 529 mm; summer precipitation is mainly concentrated in July and August and accounts for approximately 65% of the total annual precipitation; winter precipitation mainly occurs in the form of snow, and snowfall is mainly concentrated in November and February of the following year. The multiyear average snow period is 110 d, and the maximum freezing depth is 180 cm. The test site is located in the hinterland of the plain. The terrain is flat and has no vegetation cover. According to the sampling analysis, there are 9 main types of soil in the area, including black soil, black calcareous soil, meadow soil, marsh soil, and sandy soil, and black soil is the major type. The mechanical composition of various particles in the soil, which was identified by a Winner 801 laser particle size analyzer, showed that sand (>0.02 mm), powder (0.002–0.02 mm), and clay (<0.002 mm) accounted for 49.84%, 35.89%, and 14.27%, respectively, of the total. In addition, based on testing and analysis, the physical parameters of the soil in the test area are shown in Table 1.

2.2. Experimental Field Deployment

The test site was divided into 4 plots, and a soil hydrothermal environment monitoring system (ET100, Dongfangshengtai, China) was installed in each plot to monitor the soil temperature and liquid water content at soil depths of 10, 20, 30, …, 100 cm at a recording interval of 1 d/time. A neutron meter (CNC503DR, CPN company, USA) was used to measure the total water content of the soil. In addition, soil column cores were sampled at a sampling interval of 3 d/time by manual soil extraction during the freezing period, and the oven-drying method was used to monitor the total water content of the soil to double-check the data obtained with the neutron meter. Meanwhile, a frozen soil apparatus (LQX-DT, Jinzhouyangguang, China) was buried in each plot to record the freezing depth of the soil. An automatic weather station (TRM-ZS1, Jinzhouyangguang, China) was established near the plot to record indicators, such as the ambient temperature, ambient humidity, evaporation, total radiation, net radiation and saturated vapour pressure in the atmospheric environment, and the equation for saturated vapour pressure is shown below [21]:
e w = 6.112 × exp [ 17.62 × t 243.12 + t ]
where ew is saturated vapour pressure, hpa; t is the thermodynamic temperature of air, °C.
Plant straw and biochar were chosen as regulation materials. In each plot, treatments, which included biochar cover (CS, the amount of addition was 20 t/hm2), straw cover (JS, the amount of addition was 12 t/hm2), a combined biochar and straw cover (CJS, the amount of biochar and straw addition was 10 t/hm2 and 6 t/hm2, respectively), and bare land (BL) as a natural control, were established. During the planning and deployment process for the CS treatment, biochar was evenly sprayed on the ground surface, and then the soil was subjected to subsoiling and subsequent tillage by a tiller to ensure an even mixture of biochar and the soil. For the JS treatment, the soil was subjected to subsoiling and subsequent tillage, and 2 layers of straw were used to cover the ground surface, with the straw laid in a crisscross manner (10 cm in thickness). For the CJS treatment, the amounts of biochar and straw were half of the amount used for the CS treatment and half of the amount used for the JS treatment, respectively. For this treatment, the soil was first subjected to subsoiling and subsequent tillage, biochar was then evenly mixed with the soil, and the ground surface was covered with a layer of straw (5 cm in thickness). For the BL treatment, the soil was only subjected to subsoiling and subsequent tillage.

2.3. Theory

The gravimetric water content and the volumetric water content of soil during the freezing period can be calculated using the following equations [22,23,24]:
W = ( W v W v u ) ρ i + W v u · ρ w ρ d + ( W v W v u ) ρ i + W v u · ρ w
W u = W v u · ρ w ρ d + ( W v W v u ) ρ i + W v u · ρ w
where W is the gravimetric total water content, %; Wu is the liquid gravimetric water content of soil, %; Wv is the volumetric water content of soil, %; Wvu is the liquid volumetric water content of soil, %; ρ d is the soil bulk density, kg/m3; ρ i is the ice density, kg/m3; and ρ w is the liquid water density, kg/m3.
The specific heat of thawed soil, Cdu, and the specific heat of frozen soil, Cdf, are respectively given by
C d u = C s u + W C w 1 + W
C d f = C s f + ( W W u ) C i + W u C w 1 + W
where C s u , C s f , C w , and C i are the specific heats of the skeleton of the thawed soil, the skeleton of frozen soil, the water, and the ice, respectively, kJ/(kg·°C).
The volumetric heat capacity of thawed soil, Cu (kJ/m3·°C), and the volumetric heat capacity of frozen soil, Cf, can be calculated as follows:
C u = C d u ρ u = [ C s u + W C w ] ρ d
C f = C d f ρ f = [ C s f + ( W W u ) C i + W u C w ] ρ d
where ρ u and ρ f are the natural bulk densities of thawed soil and frozen soil (kg/m3), respectively.
The phase transition of the water in the frozen soil results in the absorption and release of a large quantity of heat. The latent heat change during the phase transition of water produces a significant difference between the heat change in frozen soil and that in thawed soil. The heat of the phase transition of water, Qw, can be calculated through the changes in the ice content in a given soil layer:
Q w = L ρ d Δ ( W W u )
where L is the heat of water melting, which is 334.56 kJ/kg [25]; Δ ( W W u ) is the difference in the ice content between the current moment and the previous moment.
If the migration of water vapor in the soil is ignored, then the heat change for frozen soil, Δ Q d , and that for thawed soil, Δ Q r , during the freezing–thawing period can be respectively expressed as
Δ Q d = L ρ d Δ ( W W u ) + [ C s f + ( W W u ) C i + W u C w ] ρ d Δ T
Δ Q r = L ρ d Δ ( W W u ) + [ C s u + W C w ] ρ d Δ T
where Δ T is the temperature difference between the current moment and the previous moment. Based on Equations (9) and (10), the heat change at a given soil depth under each treatment during the freezing–thawing period, Q c d i , is
Q c d i = { t = 1 T Δ Q d W W u 0 t = 1 T Δ Q r W W u = 0
where T is the length of a given data sequence, and i is the soil depth, where i = 10, 20, … 100 cm. The total heat change in a given plot under each treatment during the test period, Qcd, is
Q c d = i = 10 100 Q c d i
The ratio of the heat change at a given soil depth to the total heat change in the plot under a given treatment (abbreviated as the proportion of heat change in the soil layer), Qcdpi, is
Q c d p i = Q c d i Q c d
To determine the heat budget at different soil depths during the test period, the amount of heat change in each hour within a given day (24 h) was calculated, and statistical analysis was performed. The daily heat absorption value, Δ Q x , and the daily heat release value, Δ Q s , for a given soil layer can be respectively calculated as follows:
Δ Q x = { t = 1 I Δ Q d W W u 0 and Δ Q d > 0 t = 1 I Δ Q r W W u = 0 and Δ Q r > 0
Δ Q r = { t = 1 J Δ Q d W W u 0 and Δ Q d < 0 t = 1 J Δ Q r W W u = 0 and Δ Q r < 0
where I is the number of hours during heat change that are positive in a given day, and J is the number of hours during which the heat change is negative in a given day, I + J = 24.

2.4. Data Processing

In this study, the test data were first processed by Excel 2013, and SPSS 16.0 was used for normal distribution and homogeneity analysis of variance testing, followed by analysis of variance (ANOVA) testing if the test conditions were met. In addition, MATLAB software was used to construct the response function. Finally, SigmaPlot 12.5 software was used for graphing [26,27,28].

3. Results and Discussion

3.1. Variability of Soil Water Heat

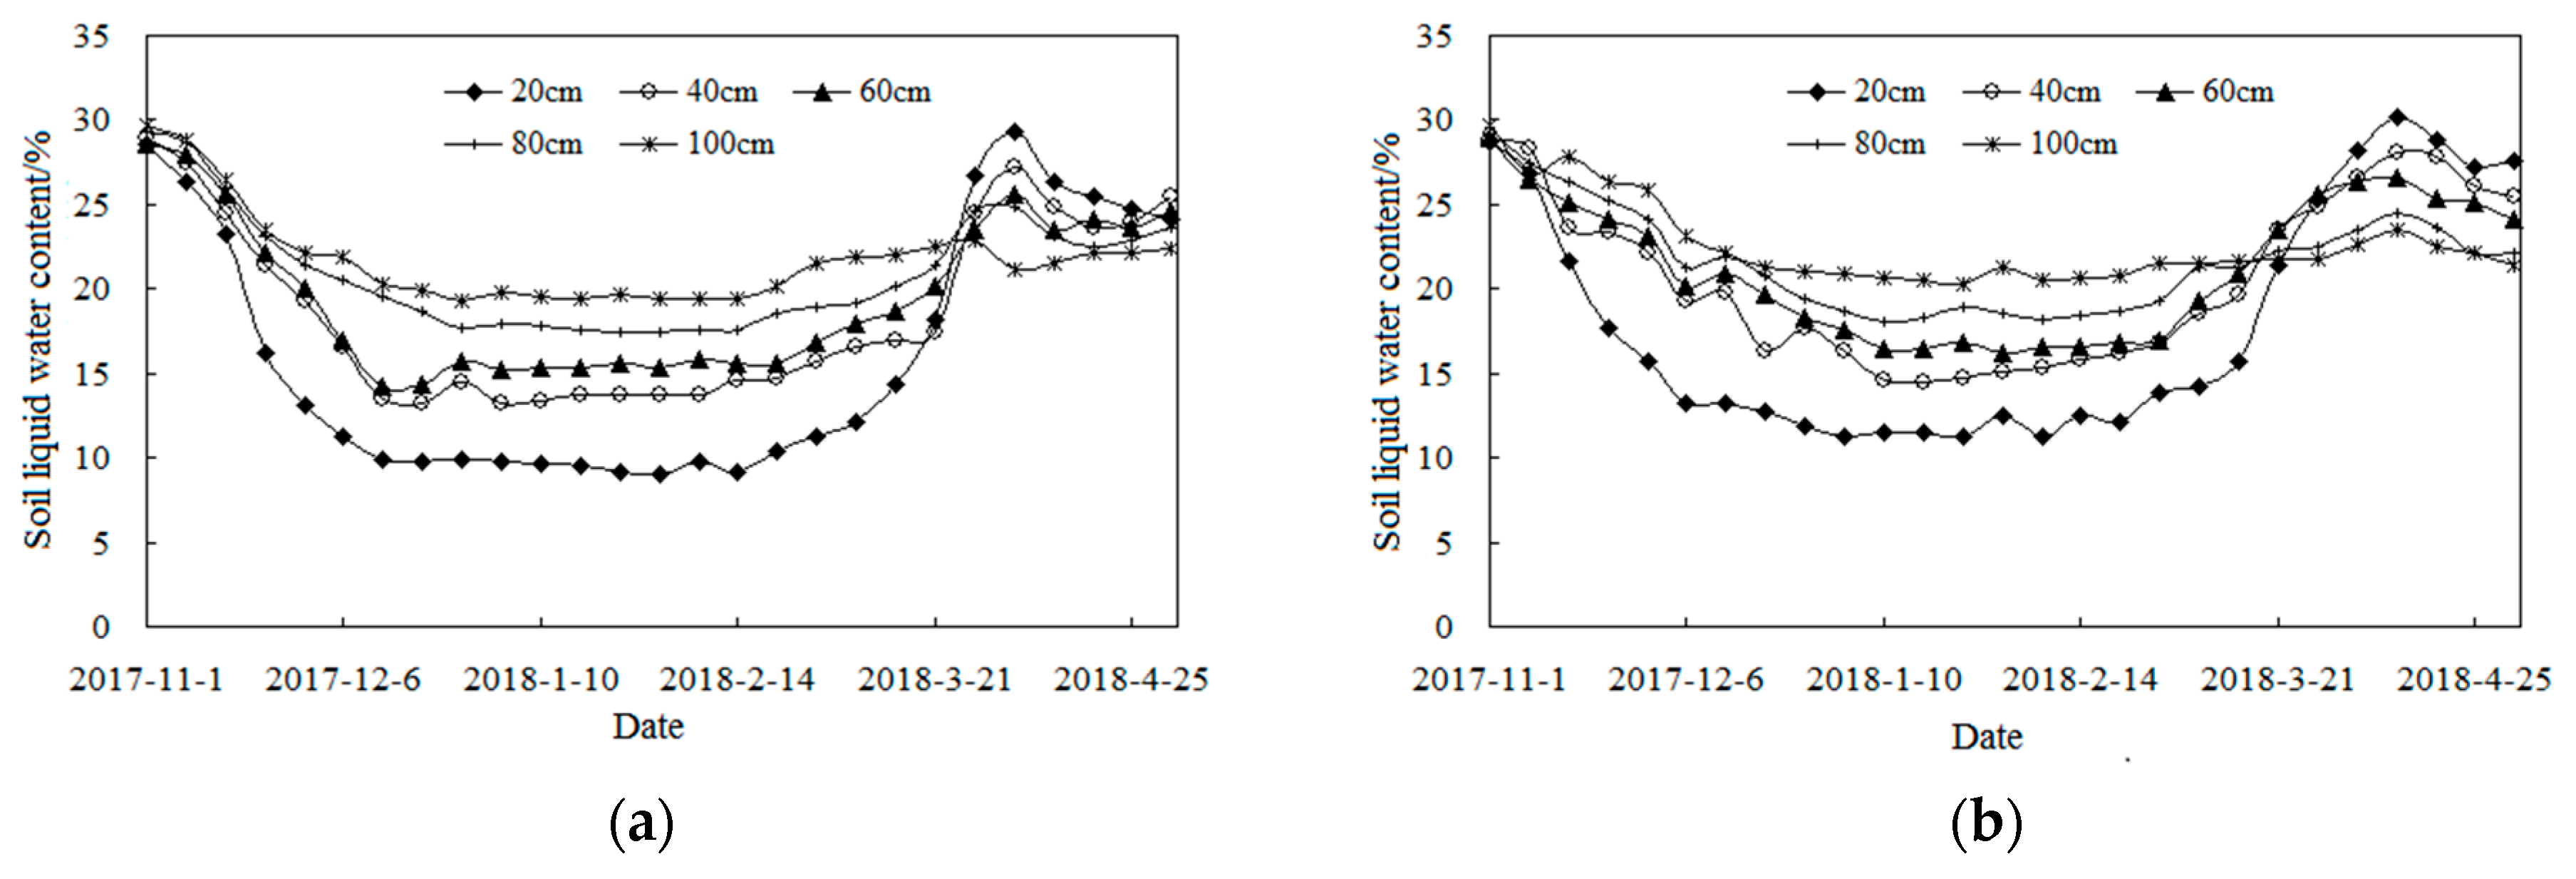
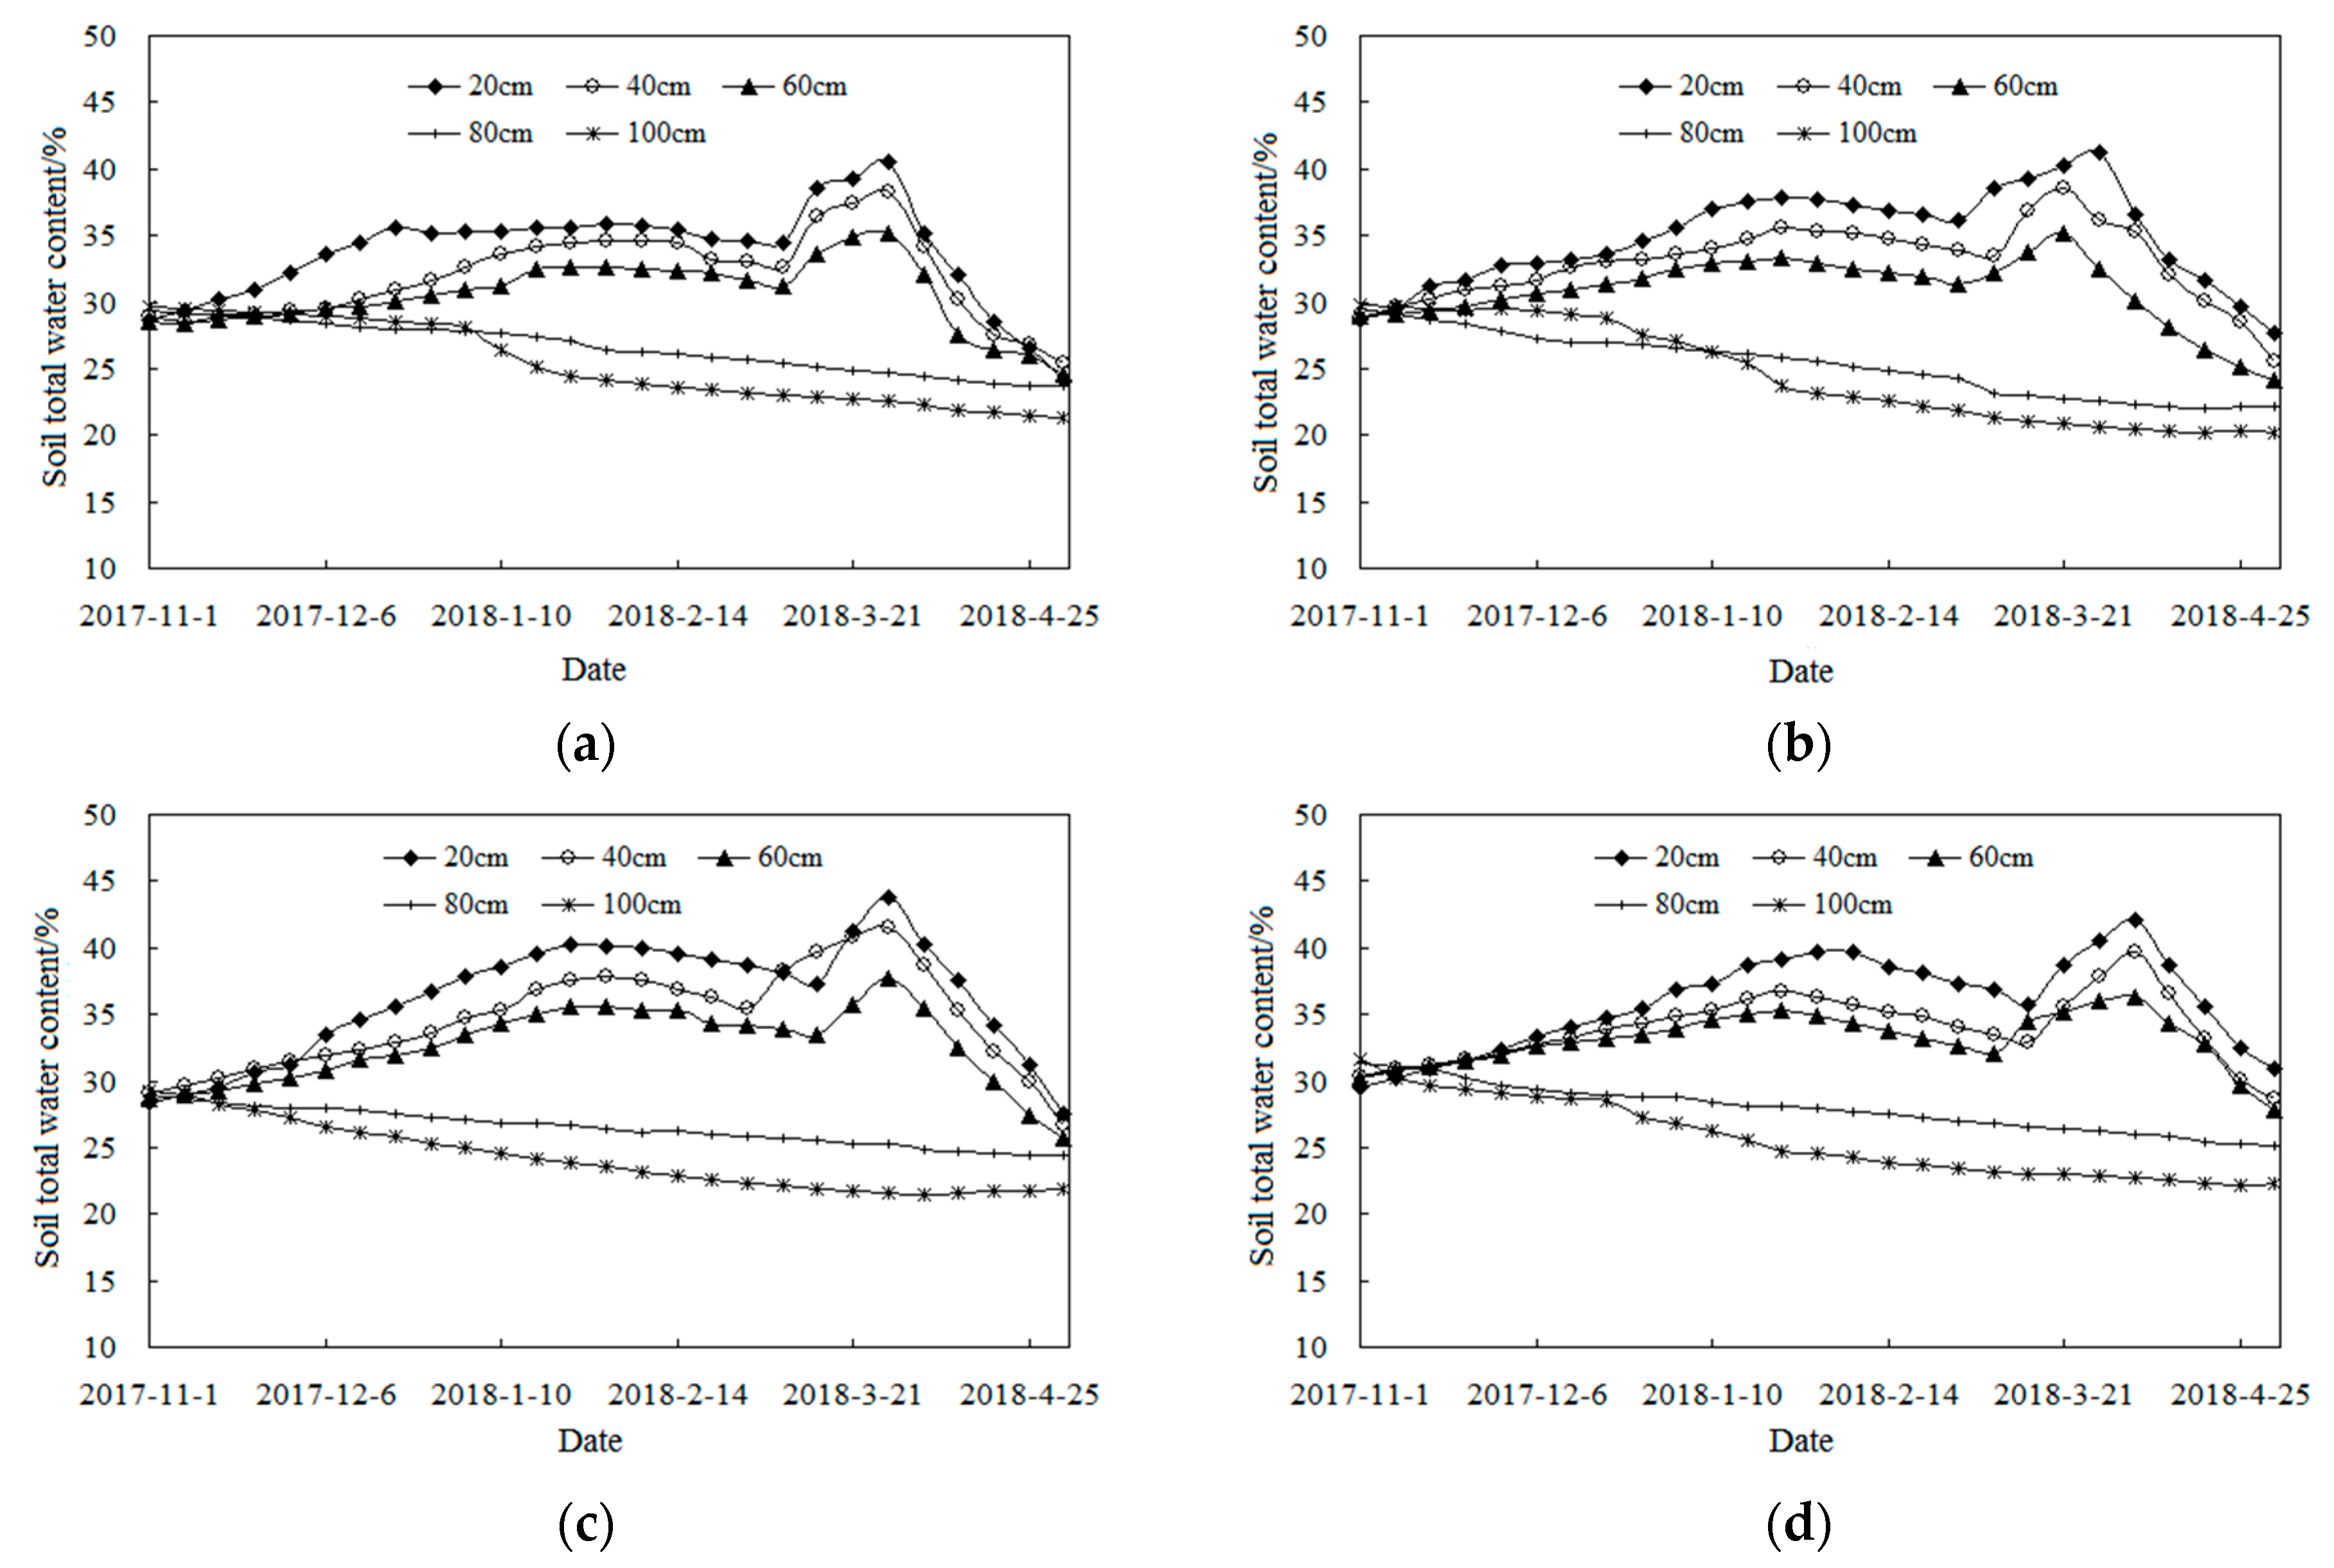
The variations in the soil temperature, liquid water content, and total water content under different regulation modes are shown in Figure 1, Figure 2 and Figure 3. The following can be seen from Figure 1, Figure 2 and Figure 3:
(1)
The soil temperature decreased first and then increased. First, during the freezing period, under the BL treatment, the variation amplitude of the soil temperature at a soil depth of 20 cm was 22.21 °C; With the increase of soil depth, the variation amplitude of the soil temperature decreased in order accordingly. Under the CS treatment, the variation amplitude of the soil temperature at a depth of 20 cm was 20.37 °C, which was less than that of the BL treatment. Under the JS and CJS treatments, the variation amplitudes of the soil temperature at a soil depth of 20 cm were 15.12 °C and 16.28 °C, respectively. During the thawing period, compared with the BL treatment, the temperatures in the CS, JS, and CJS treatments all had greatly increased amplitudes at a soil depth of 20 cm.
(2)
During the freezing period, the variation amplitudes of the soil liquid water content at a soil depth of 20 cm under the BL, CS, JS, and CJS treatments were 19.46, 17.47, 13.31, and 16.34%, respectively. During the thawing period, with the thawing of soil and the infiltration of snowmelt water, the liquid water content in the soil increased. The maximum value of the soil liquid water content under the BL treatment was 29.13%; the maximum values of the soil liquid water content under the CS, JS, and CJS treatments were all increased, and their average values had a decreasing order of CJS > CS > JS > BL.
(3)
During the freezing period, the variation amplitudes of the soil liquid water content at a soil depth of 20 cm under the BL, CS, JS, and CJS treatments were 6.95%, 9.24%, 11.82%, and 9.89%, respectively. During the thawing period, because of the snowmelt water infiltration, the variability of the soil total water content was similar to that of the soil liquid water content. The maximum value of the soil total water content under the BL treatment was 40.51%, while the maximum values of the total water content were all increased under the CS, JS, and CJS treatments, and the most significant increase occurred under the CJS treatment.

3.2. Balance Effect of the Soil Energy Budget

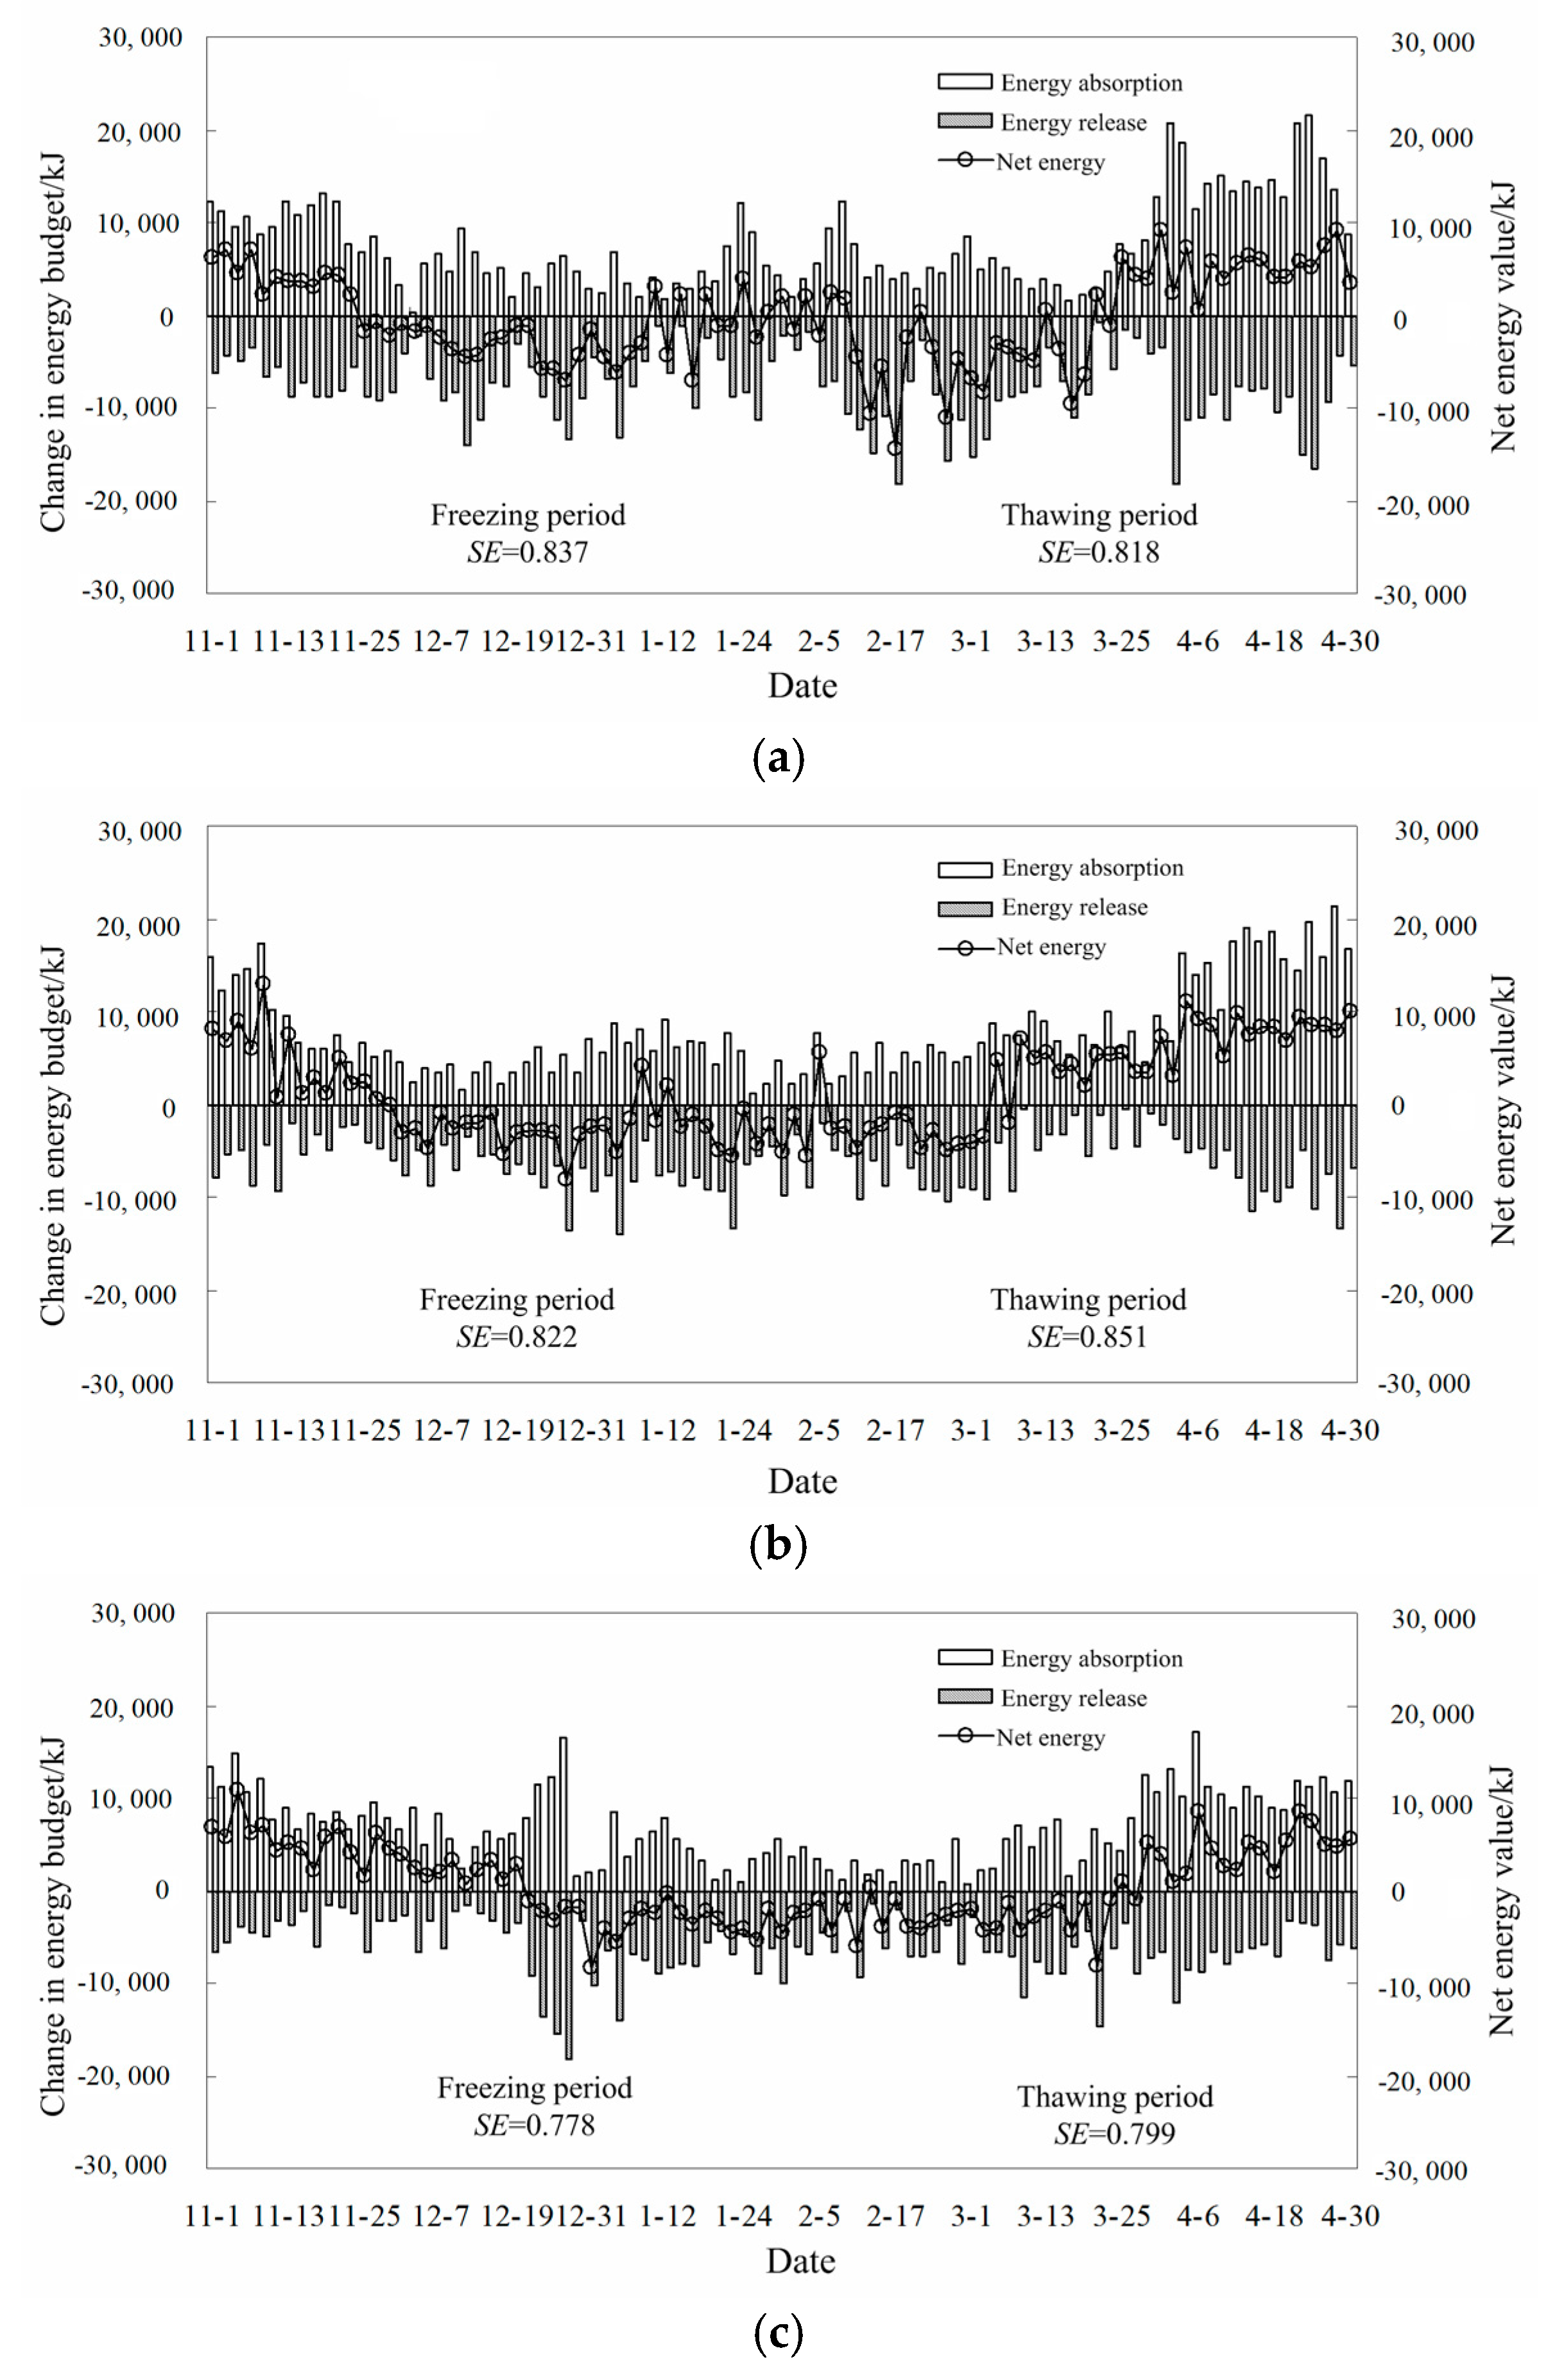
The aforementioned equations were used to calculate the values of the daily heat absorption, daily heat release, and daily net energy at a soil depth of 10 cm during different periods. Meanwhile, to analyze the fluctuation of the soil energy budget, the spectral entropy (SE) of the net energy time series was calculated using the Fourier-transformation-based spectral entropy theory [29]. The specific results can be seen from Figure 4 and Table 2. The specific comparative analysis showed the following:
(1)
During the freezing period, the soil energy absorption gradually decreased, and the release gradually increased, while the net energy value exhibited a gradual decreasing trend. Under the BL treatment, the average net soil energy was −763 kJ, indicating an energy deficit. Under the CS treatment, the average soil net energy was −667 kJ; the regulation of biochar increased the soil energy absorption and thus decreased the energy deficit in the net soil energy. Under the JS and CJS treatments, the average net soil energies were further reduced, and the negative energy budget was gradually reduced. Under the BL treatment, the spectral entropy of a time series of the net soil energy was 0.837, which indicated strong fluctuations, and the energy exchange process between the soil and the environment was frequent. Under the CS, JS, and CJS treatments, the spectral entropies decreased differently, and their fluctuations followed the descending order of BL > CS > CJS > JS.
(2)
During the thawing period, as the ambient temperature and the atmospheric radiation increased, the net soil energy showed a gradually increasing trend. Specifically, the average net soil energies were 771, 951, 703, and 837 kJ under the BL, CS, JS, and CJS treatments, respectively, indicating that, during the thawing period, the CS treatment exacerbated the fluctuation of the net soil energy, while the JS treatment had the opposite trend.
(3)
During the freezing period, under the BL treatment, the spectral entropy of the time series of the net soil energy was 0.811 at a soil depth of 20 cm; as the soil depth increased, the spectral entropy gradually decreased, and the energy exchange between the soil and the external environment was weakened. Likewise, the other three treatments also showed similar patterns. Specifically, the BL treatment had the most significant fluctuations, and the JS treatment had the weakest fluctuations. During the thawing period, the spectral entropies of the net energy in the vertical profile under the CS and CJS treatments had an overall greater variation than that under the BL treatment, while the JS treatment had a lower spectral entropy of the net energy than the BL treatment.

3.3. Response Function of Soil Energy Transfer

To reveal the relationship between the soil energy budget and the environmental factors, the grey relational analysis (GRA) method was adopted [30]. Specifically, six meteorological indexes, including the ambient temperature (x1), the dew point temperature (x2), the ambient humidity (x3), the saturated water vapor pressure (x4), the total radiation (x5), and the net radiation (x6), were selected as independent variables, and the energy change characteristics at a depth of 10 cm were taken as the dependent variable for constructing the soil energy transfer functions, as shown in Table 3.
It can be seen from Table 3, all the soil energy transfer functions under different treatments during different periods passed the significance test (p < 0.05). Specifically, during the freezing period, the soil energy response function under the BL treatment had the largest determination coefficient (R2), while that under the JS treatment had the smallest R2. During the thawing period, the soil energy response function under the CS treatment had the largest R2, while that under the JS treatment had the smallest R2.
The test results of the soil energy transfer functions at different depths are shown in Table 4. It can be seen from Table 4 that, during the freezing period, the soil energy transfer function at a depth of 20 cm under the BL treatment had an R2 of 0.96. As the soil depth increased, the accuracies of the functions decreased. When the soil depth reached 100 cm, the R2 of the soil energy transfer function decreased to 0.79. Under the CS, JS, and CJS treatments, the overall accuracies of the constructed functions were lower than those under the BL treatment. During the thawing period, the accuracies of the soil energy transfer functions under the CS and CJS treatments were better than those under the BL treatment, while the overall accuracy of the soil energy transfer functions under the JS treatment was slightly reduced.
In summary, the soil energy budget was significantly affected by the environmental factors. During the freezing period, the regulation of both biochar and straw could reduce the response relationship between the soil energy and the environmental factors. During the thawing period, biochar could promote the exchange of energy between the environment and the soil. The effect of the straw was opposite that of the biochar.

4. Discussion

4.1. Effect of Biochar and Straw on Soil Water and Heat Variation

During the soil freezing process, energy in the soil is gradually transferred to the atmospheric environment, and the soil temperature is lowered accordingly; as a result, the liquid water in the soil is transformed into solid ice, and a frozen front is formed at the ground surface. Driven by the temperature gradient, the unfrozen water gradually migrates to the frozen front and accumulates at the ground surface [31]. Therefore, during the freezing period, the liquid water content in the frozen soil layer decreased significantly, while the total water content showed an upward trend, and the hydrological environment in the frozen soil region fluctuated to a certain extent. Due to the insulation and low thermal conductivity of plant straw, straw inhibits the decrease in soil temperature and reduces the freezing rate of the soil to a certain extent [32]. Therefore, with the JS treatment, the liquid water content of the soil and the total water content at the soil surface are high. In this study, the comparative analysis showed that, during the freezing period, the average total water content at a depth of 20 cm under the JS treatment was increased by 2.31%, 1.85%, and 0.56% compared to that under the BL, CS, and CJS treatments, respectively, which is consistent with the research conclusions of San et al. [33]. Simultaneously, the application of biochar reduces the thermal conductivity and thermal diffusivity of the soil, hinders the heat loss of the soil, weakens the phase transformation ability of the liquid water in the soil, and most of the liquid water continuously accumulates to the surface layer [34]. Under the CS treatment, the total water content of soil at 20 cm soil layer was also increased compared with the BL treatment, and the water storage capacity of the surface soil was increased. During the thawing period, as the ambient temperature and atmospheric radiation increase, the soil draws a large quantity of energy from the environment and begins to melt, and the solid ice is converted into liquid water. Meanwhile, the infiltration of snowmelt water can also replenish the water content in the soil. When biochar, which has a strong water-holding capacity, is coupled with straw, which increases the temperature and preserves the soil moisture, the synergistic effect of this combination can effectively increase the soil water content [35]. As Wu et al. [36] found, biochar can effectively improve soil and water loss on sloping farmland in black soil areas, and the soil saturated water content, field capacity and soil water storage capacity were enhanced with the increase in biochar application.

4.2. Effects of Biochar and Straw on Soil Energy Budget

During the freezing period, as the ambient temperature decreases, the soil heat flux increases, and energy is gradually dissipated. At the same time, with the increase of ambient temperature, the radiation effect of the atmosphere effectively replenishes the energy in the soil, which effectively stimulates the soil energy budget cycle. In the process of energy transfer in the soil, there is a lot of loss phenomena, which leads to the weakening of the energy budget effect in deep soil. During the freezing period, with the decrease of ambient temperature, soil and atmosphere exchange energy frequently; however, biochar has low thermal conductivity and low specific heat capacity, which leads to a decrease in the fluctuation of the soil energy budget, and weakens the response relationship between soil energy and environmental factors. As an inadequate conductor of heat, straw hinders the energy exchange between the soil and the external environment and thus minimizes the fluctuation of the net soil energy time series [37]. As Zhao et al. [38] found, in the northern cold region, the application of biochar reduced the soil bulk density, and the thermal conductivity of the soil was weakened, resulting in the reduction of the response relationship between the soil and the environment. Singh et al. [39] Also confirmed through field experiments that straw-mulched farmland weakened the driving effect of environmental factors on soil water and heat, reduced the evaporation rate of soil water, and weakened the energy transfer effect. During the thawing period, as the ambient temperature increases, atmospheric radiation replenishes the energy in the soil, accelerating the cycling process of the soil energy budget [40]. A large quantity of energy is lost during the soil transfer process, resulting in a weakened energy budget in deep soils [1]. Biochar promotes the accumulation of soil energy, and its heat absorption is far greater than its heat release. Therefore, in this study, under the conditions of the CS and CJS treatments, the frequency of energy exchange between the soil and the environment was increased, leading to an increased fluctuation. In contrast, the straw covering hindered energy transfer, and the fluctuation of the soil energy decreased.

5. Conclusions

Biochar and straw effectively regulate soil hydrothermal conditions. During the freezing period, straw mulching effectively promoted the accumulation of water content in the frozen area, and the decreased amplitude in soil temperature was weakened. During the thawing period, the combined regulation of biochar and straw most effectively inhibited the migration and diffusion of soil moisture and improved the water-holding capacity of topsoil.
During the freezing period, the soil energy showed a deficit state, and the straw most effectively suppressed the energy loss and reduced the soil net energy fluctuation. During the thawing period, the endothermic property of biochar promoted the absorption of soil energy to the atmosphere, enhanced the energy exchange effect between soil and the environment, and increased the spectral entropy of soil net energy time series. However, straw hindered the absorption of environmental energy by soil, and then reduced the variation of the soil energy budget.
This study revealed the effect of biochar and straw mulch on soil water heat and energy transfer and provided technical support for soil water and heat regulation in a seasonal frozen soil area. At present, this study only calculates the energy change process from the perspective of soil water phase change, while the quantitative description of energy transfer effect from the perspective of energy conservation needs further exploration.

Author Contributions

Conceptualization, F.M. and T.L.; Formal analysis, R.H.; Methodology and writing—original draft, F.M. and Q.F.; Writing—review and editing, T.L. and R.H. All authors have read and agreed to the published version of the manuscript.

Funding

This research was funded by the National Science Fund for Distinguished Young Scholars (No. 51825901), the National Natural Science Foundation of China (No. 51679039 and No. 51909033), the Youth Talents Foundation Project of NEAU (No. 18QC28) and the China Postdoctoral Science Foundation Grant (No. 2019M651247).

Acknowledgments

The authors appreciate the anonymous reviewers for their valuable comments and suggestions.

Conflicts of Interest

The authors declare no conflict of interest.

References

  1. Hou, R.J.; Li, T.X.; Fu, Q.; Liu, D.; Cui, S.; Zhou, Z.Q.; Yan, P.R.; Yan, J.W. Effect of snow-straw collocation on the complexity of soil water and heat variation in the Songnen Plain, China. Catena 2019, 172, 190–202. [Google Scholar] [CrossRef]
  2. Li, R.; Zhao, L.; Wu, T.H.; Ding, Y.J.; Xiao, Y.; Hu, G.J.; Zou, D.F.; Li, W.P.; Yu, W.J.; Jiao, Y.L.; et al. The impact of surface energy exchange on the thawing process of active layer over the northern Qinghai-Xizang Plateau, China. Environ. Earth Sci. 2014, 72, 2091–2099. [Google Scholar] [CrossRef]
  3. Brown, D.R.N.; Jorgenson, M.T.; Douglas, T.A.; Romanovsky, V.E.; Kielland, K.; Hiemstra, C.; Euskirchen, E.S.; Ruess, R.W. Interactive effects of wildfire and climate on permafrost degradation in Alaskan lowland forests. J. Geophys. Res. Biogeosci. 2015, 120, 1619–1637. [Google Scholar] [CrossRef]
  4. Fu, Q.; Zhao, H.; Li, T.X.; Hou, R.J.; Liu, D.; Ji, Y.; Zhou, Z.Q.; Yang, L.Y. Effects of biochar addition on soil hydraulic properties before and after freezing-thawing. Catena 2019, 176, 112–124. [Google Scholar] [CrossRef]
  5. Roxy, M.S.; Sumithranand, V.B.; Renuka, G. Soil heat flux and day time surface energy balance closure at astronomical observatory, Thiruvananthapuram, south Kerala. J. Earth Sys. Sci. 2014, 123, 741–750. [Google Scholar] [CrossRef] [Green Version]
  6. Maurer, G.E.; Bowling, D.R. Seasonal snowpack characteristics influence soil temperature and water content at multiple scales in interior western US mountain ecosystem. Water Resour. Res. 2014, 50, 5216–5234. [Google Scholar] [CrossRef]
  7. Fu, Q.; Hou, R.J.; Li, T.X.; Yan, P.R.; Ma, Z.A. The critical depth of freeze-thaw soil under different types of snow cover. Water 2017, 9, 370. [Google Scholar]
  8. Zhang, X.; Sun, S.F. The impact of soil freezing/thawing processes on water and energy balances. Adv. Atmos. Sci. 2011, 28, 169–177. [Google Scholar] [CrossRef]
  9. Fu, Q.; Hou, R.J.; Li, T.X.; Wang, M.; Yan, J.W. The functions of soil water and heat transfer to the environment and associated response mechanisms under different snow cover conditions. Geoderma 2018, 325, 9–17. [Google Scholar] [CrossRef]
  10. Flint, A.L.; Flint, L.E.; Dettinger, M.D. Modeling soil moisture processes and recharge under a melting snowpack. Vadose Zone J. 2008, 7, 350–357. [Google Scholar] [CrossRef]
  11. Yang, K.; Wang, C.H. Water storage effect of soil freeze-thaw process and its impacts on soil hydro-thermal regime variations. Agric. For. Meteorol. 2019, 265, 280–294. [Google Scholar] [CrossRef]
  12. Zhang, Y.Y.; Zhao, W.Z. Effects of variability in land surface characteristics on the summer radiation budget across desert-oasis region in Northwestern China. Theor. Appl. Climatol. 2015, 119, 771–780. [Google Scholar] [CrossRef]
  13. Tang, A.C.I.; Stoy, P.C.; Hirata, R.; Musin, K.K.; Aeries, E.B.; Wenceslaus, J.; Shimizu, M.; Melling, L. The exchange of water and energy between a tropical peat forest and the atmosphere: Seasonal trends and comparison against other tropical rainforests. Sci. Total Environ. 2019, 683, 166–174. [Google Scholar] [CrossRef] [PubMed]
  14. Hallsted, A.L.; Mathews, O.R. Soil moisture and winter wheat with suggestions on abandonment. Kans. Agr. Exp. Stn. Bull 1936, 273, 46. [Google Scholar]
  15. Nagare, R.M.; Schincariol, R.A.; Quinton, W.L.; Hayashi, M. Moving the Field into the Lab: Simulation of Water and Heat Transport in Subarctic Peat. Permafr. Periglac. Process. 2012, 23, 237–243. [Google Scholar] [CrossRef]
  16. Guglielmin, M.; Evans, C.J.E.; Cannone, N. Active layer thermal regime under different vegetation conditions in permafrost areas. A case study at Signy Island (Maritime Antarctica). Geoderma 2008, 144, 73–85. [Google Scholar] [CrossRef]
  17. Chen, J.F.; Xie, X.; Zheng, X.Q.; Xue, J.; Miao, C.Y.; Du, Q.; Xu, Y.X. Effect of Straw Mulch on Soil Evaporation during Freeze-Thaw Periods. Water 2019, 11, 1689. [Google Scholar] [CrossRef] [Green Version]
  18. Xu, H.N.; Spitler, J.D. The relative importance of moisture transfer, soil freezing and snow cover on ground temperature predictions. Renew. Energy 2014, 72, 1–11. [Google Scholar] [CrossRef]
  19. Yang, J.F.; Zheng, X.Q.; Sun, M. The Effect of Different Surface Mulchings on Soil Temperature During Seasonal Freezing-thawing Period. J. Taiyuan Univ. Technol. 2006, 37, 358–360. [Google Scholar]
  20. Tang, W.Z.; Wang, C.X.; Lan, M.J.; Fan, W.B. An experimental research on surface cover’s effects on the temperature of the soil plough layer in the freezing and thawing period of the northern Xinjiang area. China Rural Water Hydropower 2016, 8, 44–49. [Google Scholar]
  21. Jarraud, M. Guide to Meteorological Instruments and Methods of Observation, 7th ed.; World Meteorological Organisation: Geneva, Switzerland, 2008; pp. 29–30. [Google Scholar]
  22. Fu, Q.; Ma, Z.A.; Li, T.X.; Hou, R.J. Influence of Different Covers on Heat Spatial Distribution and Transfer Efficiency of Freezing-thawing Soil. Trans. Chin. Soc. Agric. Mach. 2018, 49, 292–298. [Google Scholar]
  23. Istomin, V.A.; Chuvilin, E.M.; Sergeeva, D.V.; Bukhanov, B.A.; Badetz, C.; Stanilovskaya, Y.V. Thermodynamics of freezing soil closed system saturated with gas and water. Cold Reg. Sci. Technol. 2020, 170, 102901. [Google Scholar] [CrossRef]
  24. Taylor, R.T.; Luthin, J.N. A model for coupled heat and moisture transfer during soil freezing. Can. Geotech. J. 1978, 15, 548–555. [Google Scholar] [CrossRef]
  25. Ma, T.; Tang, T.; Huang, X.M.; Wang, H. Numerical analysis on thermal regime of wide embankment in permafrost regions of Qinghai−Tibet Plateau. J. Cent. South Univ. 2017, 23, 3346–3355. [Google Scholar] [CrossRef]
  26. Miescke, K.J.; Liese, F. Statistical Decision Theory-Estimation, Testing, and Selection; Springer: New York, NY, USA, 2008; pp. 198–232. [Google Scholar]
  27. Kiusalaas, J. Numerical Methods in Engineering With MATLAB; Cambridge University Press: New York, NY, USA, 2005; pp. 26–27. [Google Scholar]
  28. Systat Software, Inc. Using SigmaStat Statistics in SigmaPlot; Systat Software, Inc.: Chicago, IL, USA, 2012; pp. 416–430. [Google Scholar]
  29. Stanek, J.; Koźmiński, W. Iterative algorithm of discrete Fourier transform for processing randomly sampled NMR data sets. J. Biomol. NMR 2010, 47, 65–77. [Google Scholar] [CrossRef] [PubMed]
  30. Gau, H.S.; Hsieh, C.Y.; Liu, C.W. Application of grey correlation method to evaluate potential groundwater recharge sites. Stoch. Environ. Res. Risk Assess. 2006, 20, 407–421. [Google Scholar] [CrossRef]
  31. Larsbo, M.; Holten, R.; Stenrod, M.; Eklo, O.M.; Jarvis, N. A Dual-Permeability Approach for Modeling Soil Water Flow and Heat Transport during Freezing and Thawing. Vadose Zone J. 2019, 18, 190012. [Google Scholar] [CrossRef]
  32. Hou, R.J.; Li, T.X.; Fu, Q.; Liu, D.; Li, M.; Zhou, Z.Q.; Li, L.Q.; Zhao, H.; Yu, P.F.; Yan, J.W. The effect on soil nitrogen mineralization resulting from biochar and straw regulation in seasonally frozen agricultural ecosystem. J. Clean. Prod. 2020, 255, 120302. [Google Scholar] [CrossRef]
  33. Shan, X.Q.; Zheng, X.Q. Impacts of Surface Covering on Soil Water Characteristics during Seasonal Freeze-thaw Period. Water Res. Power 2018, 36, 99–103. [Google Scholar]
  34. Li, Q.L.; Li, H.; Fu, Q.; Li, T.X.; Liu, D.; Hou, R.J.; Cui, S.; Ji, Y.; Cai, Y.P. Effects of different biochar application methods on soybean growth indicator variability in a seasonally frozen soil area. Catena 2020, 185, 104307. [Google Scholar] [CrossRef]
  35. Bao, W.M.; Bai, Y.R.; Zhao, Y.P.; Zhang, X.; Wang, Y.Q.; Zhong, Y.X. Effect of Biochar on Soil Water Infiltration and Water Holding Capacity in the Arid Regions of Middle Ningxia. Chin. J. Soil Sci. 2018, 49, 1326–1332. [Google Scholar]
  36. Wu, Y.; Xu, G.; Lv, Y.C.; Shao, H.B. Effects of biochar amendment on soil physical and chemical properties: Current status and knowledge gaps. Adv. Earth Sci. 2014, 29, 68–79. [Google Scholar]
  37. Kustas, W.P.; Daughtry, C.S.T. Estimation of the soil heat flux/net radiation ratio from spectral data. Agric. For. Meteorol. 1990, 49, 205–223. [Google Scholar] [CrossRef]
  38. Zhao, J.K.; Ren, T.S.; Zhang, Q.Z.; Du, Z.L.; Wang, Y.D. Effects of Biochar Amendment on Soil Thermal Properties in the North China Plain. Soil Sci. Soc. Am. J. 2016, 80, 1157–1166. [Google Scholar] [CrossRef]
  39. Singh, B.; Eberbach, P.L.; Humphreys, E.; Kukal, S.S. The effect of rice straw mulch on evapotranspiration, transpiration and soil evaporation of irrigated wheat in Punjab, India. Agric. Water Manag. 2011, 98, 1847–1855. [Google Scholar] [CrossRef]
  40. Zhao, J.H.; Zhang, Q.; Wang, S.; Liu, H.Y. Effect of Soil Heat Slow Transmission Process on Surface Energy Balance in Semi-Arid Area. Chin. J. Soil Sci. 2013, 44, 1321–1331. [Google Scholar]
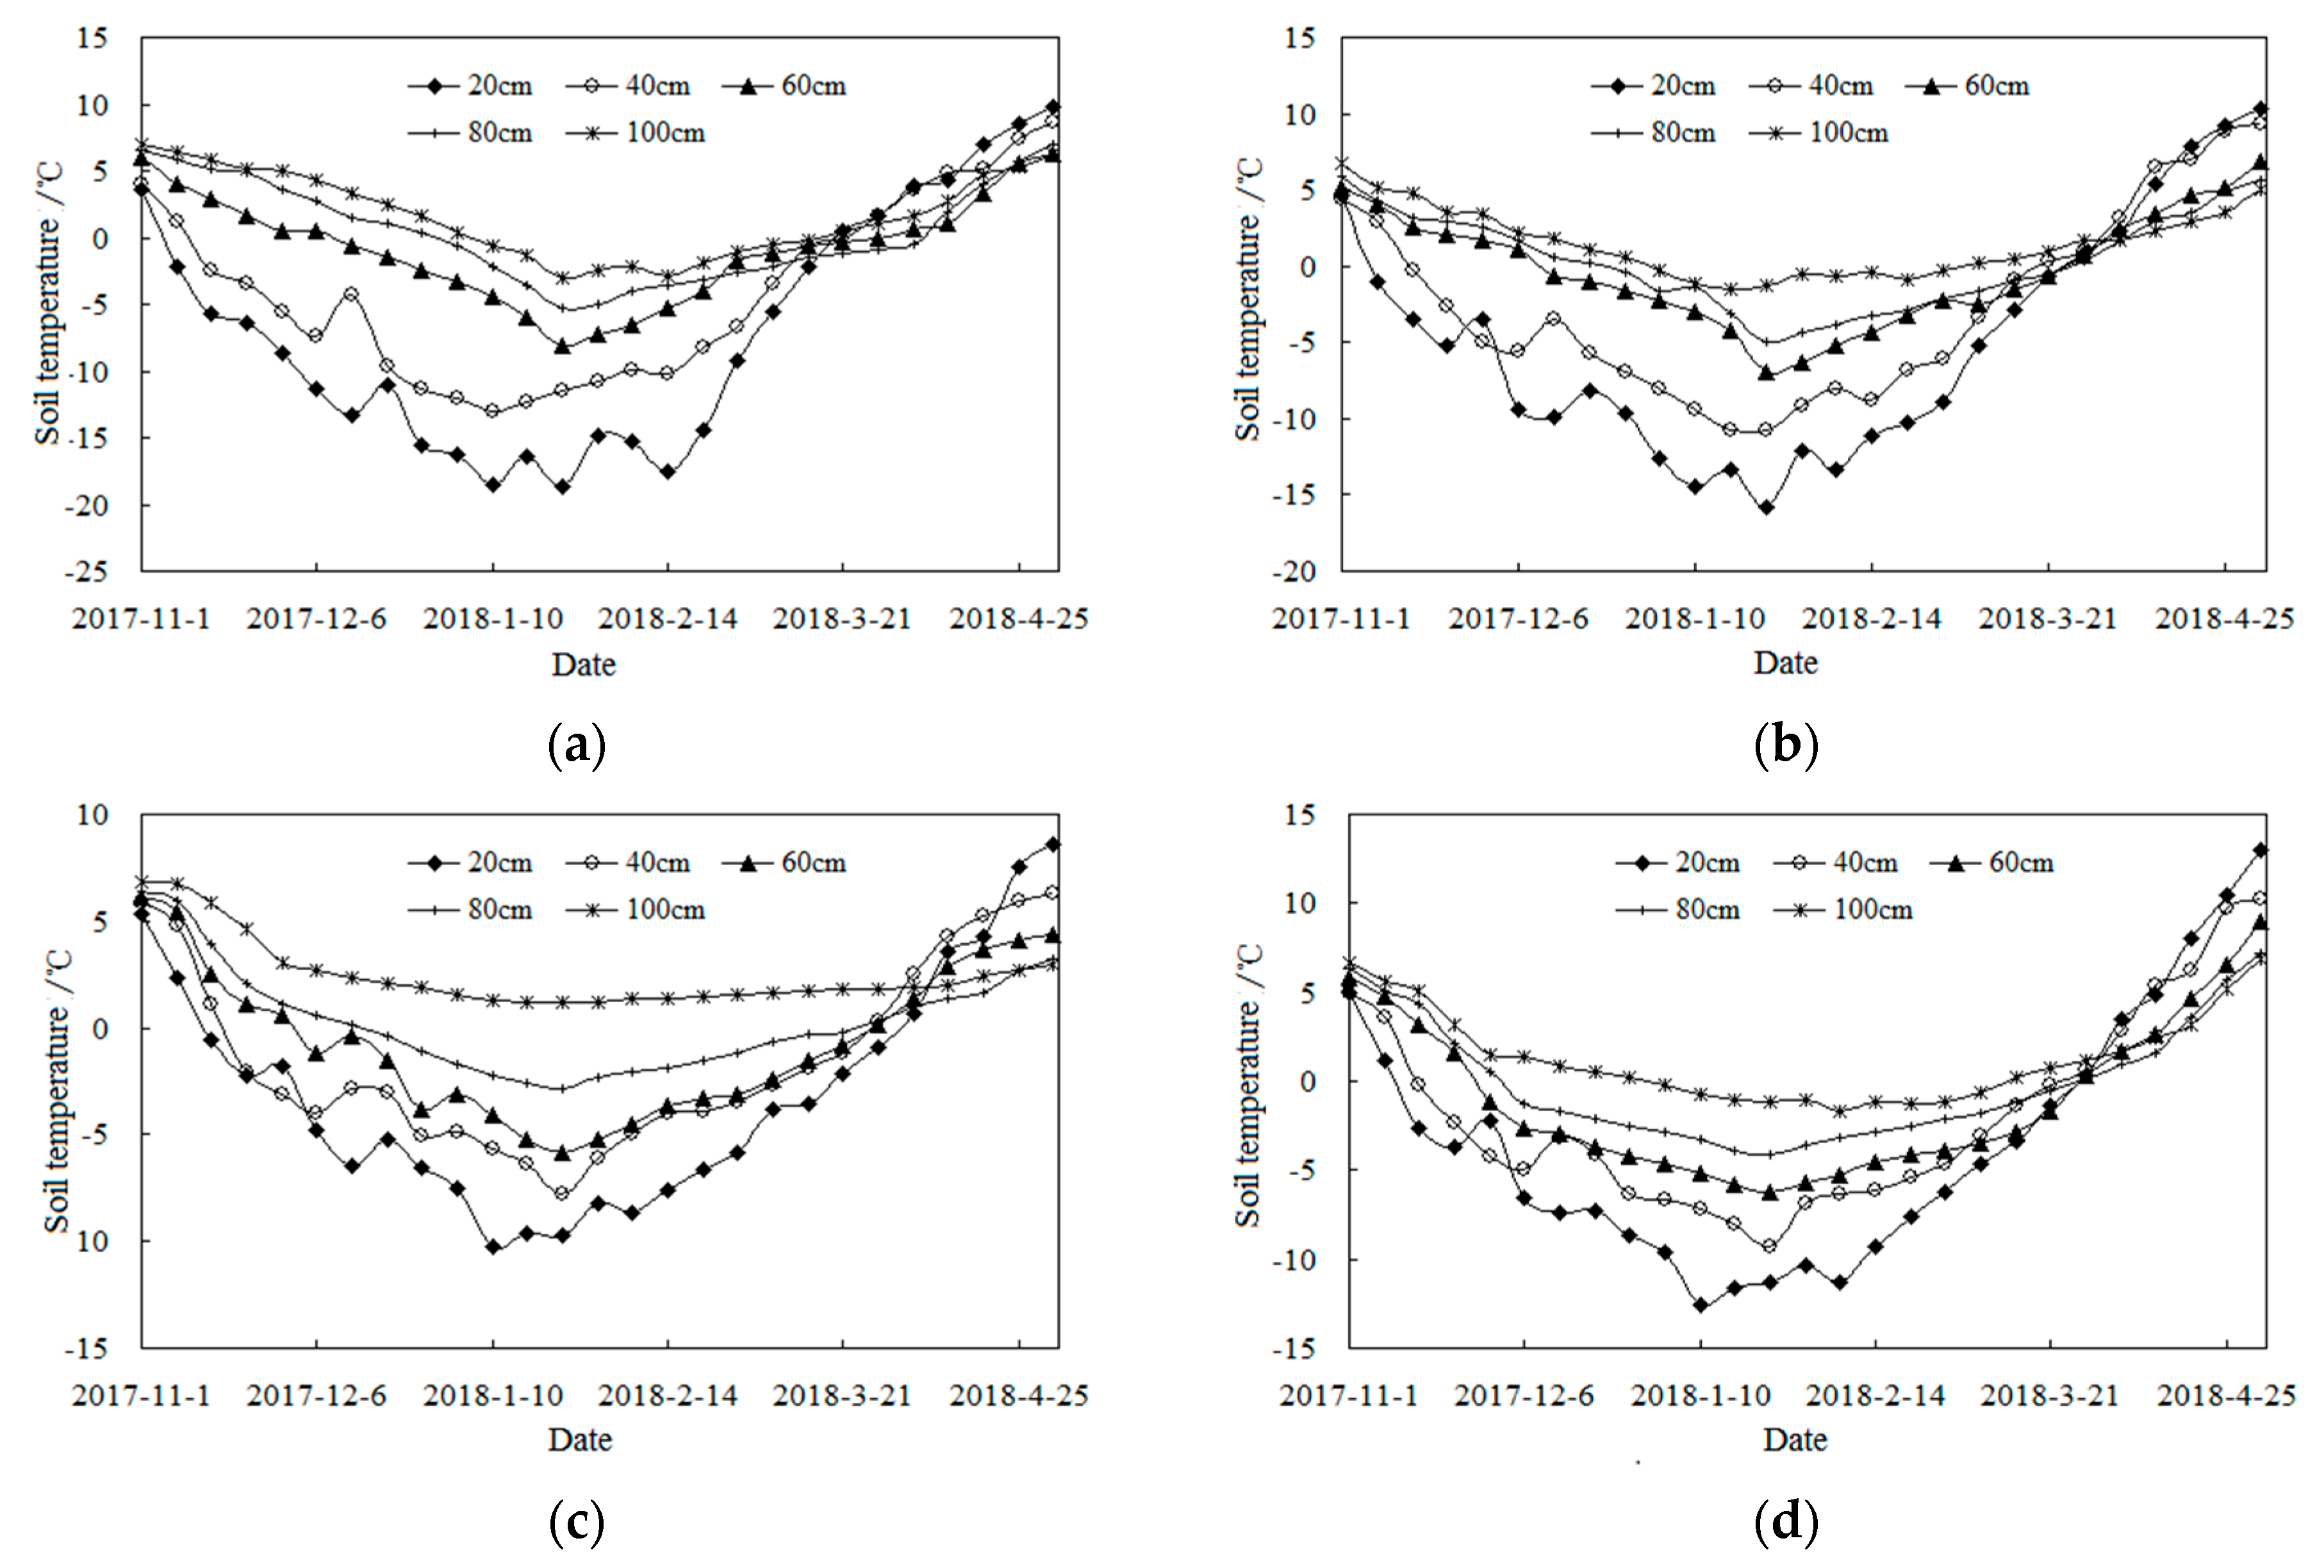
Figure 1. Variability of soil temperature of different soil depths under four treatment conditions. (a) represents the BL treatment; (b) represents the CS treatment; (c) represents the JS treatment; (d) represents the CJS treatment.
Sustainability 12 01782 g001
Figure 2. Variability of soil liquid water content of different soil depths under four treatment conditions. (a) represents the BL treatment; (b) represents the CS treatment; (c) represents the JS treatment; (d) represents the CJS treatment.
Sustainability 12 01782 g002aSustainability 12 01782 g002b
Figure 3. Variability of soil total water content of different soil depths under four treatment conditions. (a) represents the BL treatment; (b) represents the CS treatment; (c) represents the JS treatment; (d) represents the CJS treatment.
Sustainability 12 01782 g003
Figure 4. Effects of the soil energy budget under four treatment conditions during the freezing–thawing period. (a) represents the BL treatment; (b) represents the CS treatment; (c) represents the JS treatment; (d) represents the CJS treatment.
Sustainability 12 01782 g004aSustainability 12 01782 g004b
Table 1. Soil physical characteristic parameters of different soil depths under four treatment conditions.
Soil
Depth
(cm)
BLCSJSCJS
Field Water
Holding
Capacity (%)
Soil Bulk
Density
(g/cm3)
Field Water
Holding
Capacity (%)
Soil Bulk
Density
(g/cm3)
Field Water
Holding
Capacity (%)
Soil Bulk
Density
(g/cm3)
Field Water
Holding
Capacity (%)
Soil Bulk
Density
(g/cm3)
2031.221.3433.151.3331.851.3632.981.39
4030.641.3632.151.3530.211.3733.141.36
6031.211.3233.901.3230.111.3932.561.34
8030.971.3731.871.3130.411.3431.091.39
10028.951.3630.531.2829.351.4132.791.41
Table 2. Spectral entropy (SE) of the soil energy budget of different soil depths under four treatment conditions during the freezing–thawing period.
Soil
Depth/cm
Freezing PeriodThawing Period
BLCSJSCJSBLCSJSCJS
200.8110.8030.7520.7750.7910.8220.7630.807
300.7950.7860.7280.7510.7620.7940.7340.773
400.7720.7650.7110.7360.7350.7710.7010.749
500.7540.7490.6980.7150.7030.7460.6810.721
600.7370.7310.6810.7020.6820.7210.6520.694
700.7150.7040.6640.6820.6510.6930.6230.661
800.6980.6870.6490.6650.6230.6670.5940.638
900.6820.6730.6370.6480.5960.6420.5820.622
1000.6740.6650.6220.6370.5880.6310.5730.611
Table 3. Response function of soil energy transfer and meteorological factors in 10 cm soil layer under four treatment conditions during the freezing–thawing period.
TreatmentFreezing PeriodThawing Period
Response FunctionR2pResponse FunctionR2p
BL Q BL = 0.38 x 1 + 0.17 x 2 0.0083 x 3 + 0.41 x 4 + 0.025 x 5 0.014 x 6 + 0.0043 0.980.004 Q BL = 0.084 x 1 0.024 x 2 + 0.0017 x 3 0.065 x 4 0.016 x 5 + 0.091 x 6 + 0.0011 0.940.012
CS Q CS = 0.34 x 1 + 0.17 x 2 + 0.029 x 3 + 0.33 x 4 + 0.053 x 5 0.046 x 6 + 0.071 0.960.007 Q CS = 0.057 x 1 0.075 x 2 + 0.074 x 3 0.023 x 4 0.051 x 5 + 0.087 x 6 + 0.0037 0.980.003
JS Q JS = 0.302 x 1 + 0.13 x 2 0.041 x 3 + 0.42 x 4 + 0.095 x 5 + 0.016 x 6 + 0.0071 0.910.015 Q JS = 0.052 x 1 0.068 x 2 + 0.0033 x 3 0.025 x 4 0.0015 x 5 + 0.047 x 6 + 0.0025 0.920.014
CJS Q CJS = 0.27 x 1 + 0.17 x 2 0.041 x 3 + 0.45 x 4 + 0.054 x 5 + 0.067 x 6 + 0.0051 0.930.011 Q CJS = 0.035 x 1 + 0.047 x 2 + 0.041 x 3 + 0.034 x 4 0.056 x 5 + 0.079 x 6 + 0.0062 0.960.008
Table 4. Test results of response function of soil energy transfer and meteorological factors of different soil depths under four treatment conditions during the freezing–thawing period.
Soil Depth/cmFreezing PeriodThawing Period
BLCSJSCJSBLCSJSCJS
R2pR2pR2pR2pR2pR2pR2pR2p
200.960.0070.940.0070.900.0120.920.0090.930.0080.960.0050.920.0090.940.006
300.940.0090.920.0100.890.0150.910.0120.920.0140.940.0080.910.0160.930.009
400.930.0120.910.0140.880.0190.900.0160.910.0190.930.0110.890.0240.920.014
500.910.0190.900.0210.860.0250.880.0230.890.0260.910.0160.870.0290.900.021
600.900.0210.880.0250.840.0350.850.0310.860.0370.890.0270.850.0420.880.031
700.870.0280.860.0320.830.0470.840.0420.830.0450.870.0340.810.0480.850.039
800.840.0370.830.0420.810.0580.820.0480.820.0560.850.0410.800.0540.830.046
900.800.0450.790.0480.770.0710.780.0610.800.0630.840.0460.790.0620.820.052
1000.790.0640.780.0690.760.0780.760.0720.790.0750.820.0490.780.0830.810.067