Article

Experimental Investigation on the Discharge of Pollutants from Tunnel Fires

1
Guangzhou Metro Design and Research Institute Co., Ltd., Guangzhou 510000, China
2
Key Laboratory of Road and Traffic Engineering of Ministry of Education, Tongji University, Shanghai 201804, China
3
Institute of Disaster Prevention Science and Safety Technology, Central South University, Changsha 410075, China
*
Author to whom correspondence should be addressed.
Sustainability 2020, 12(5), 1817; https://doi.org/10.3390/su12051817
Submission received: 18 January 2020 / Revised: 15 February 2020 / Accepted: 26 February 2020 / Published: 28 February 2020

Abstract

:
Many pollutants are generated during tunnel fires, such as smoke and toxic gases. How to control the smoke generated by tunnel fires was focused on in this paper. A series of experiments were carried out in a 1:10 model tunnel with dimensions of 6.0 m × 1.0 m × 0.7 m. The purpose was to investigate the smoke layer thickness and the heat exhaust coefficient of the tunnel mechanical smoke exhaust mode under longitudinal wind. Ethanol was employed as fuel, and the heat release rates were set to be 10.6 kW, 18.6 kW, and 31.9 kW. The exhaust velocity was 0.32–3.16 m/s, and the longitudinal velocity was 0–0.47 m/s. The temperature profile in the tunnel was measured, and the buoyant flow stratification regime was visualized by a laser sheet. The results showed that the longitudinal ventilation leads to a secondary stratification of the smoke flow. In the ceiling extract tunnel under longitudinal ventilation, considering the research results of the smoke layer height and the heat exhaust coefficient, a better scheme for fire-producing pollutants was that an exhaust velocity of 1.26–2.21 m/s (corresponding to the actual velocity of 4.0–7.0 m/s) should be used. The longitudinal velocity should be 0.16–0.32 m/s (corresponding to the actual velocity of 0.5–1.0 m/s).

1. Introduction

The terrain environment in different regions was usually distinct. The complex terrain environment leads to inconvenient traffic conditions in the region. People use tunnels to alleviate this problem [1]. As of April 12, 2019, there were 17,738 highway tunnels in China with a length of 17.2361 million meters, an increase of 1509 places and 1.951 million meters, including 1058 long tunnels with a length of 0.47066 million meters, an increase of 156 places and 693,400 m, and 4315 long tunnels with a total length of 0.74218 million meters, an increase of 474 places and 822,500 m [2].
The tunnel is a long, narrow, semi-enclosed space. When a fire breaks out in a tunnel, the consequences would be even more serious if it is not controlled properly. According to incomplete statistics, more than 16 major tunnel fire accidents occurred in China between 2000 and 2016 [3]. In these fire cases, the smoke was the biggest threat to personnel safety and structural facilities. In order to control the smoke, predecessors invented a variety of smoke exhaust methods, such as a full transversal smoke extraction system, ceiling smoke extraction, longitudinal ventilation, vertical shaft smoke exhaust, combined smoke exhaust, and so on.
In order to investigate the longitudinal ventilation mode, Memorial tunnel studied this mode early, the results showed that the control effect of smoke in the tunnel was not good because there was almost no longitudinal wind in the tunnel. This phenomenon was the balance between air supplement and smoke exhaust in the full transverse smoke exhaust system. It was illustrated that longitudinal wind played a key role in smoke control [4]. Ventilation alms arrangement was studied in the model-scale tunnel of “air + helium” and it was found that the installation of the fan at the top was better than the side suspension to exhaust smoke [5]. Then, the distribution of temperature field and the length of smoke recirculation in the tunnel under normal and blocked scenarios were studied extensively [6,7,8].
In order to investigate the ceiling smoke extraction, the Zhejiang Provincial Transportation Planning and Design Research Institute of China and Central South University jointly carried out scientific research to jointly tackle the key technologies of central smoke extraction, structure fire resistance, and the concentrated smoke exhaust schemes in independent smoke exhaust pipes of highway tunnels [9]. They used a combined mode of tunnel operation shaft with jet fan, and the concept of central smoke extraction with independent smoke exhaust pipes at the top in tunnel fires [10]. Based on the practical projects such as QianJiang tunnel and Hong Kong–Zhuhai–Macao tunnel, the temperature distribution, smoke emissions, and other technical parameters of different smoke emission models were obtained through numerical simulation [11,12]. The influence of induced wind speed on the control effect of the central smoke extraction tunnel was investigated through numerical simulation [13,14]. In recent years, the extent of backflow length downstream of the dampers, the “confinement velocity” (suppressing the back-layering flow downwind of the vents), and the stability of the smoke stratification was investigated in the transverse ventilation system [15,16,17].
In order to investigate the vertical shaft smoke exhaust, the influence of vertical wind, vertical shaft layout, strong environmental wind, and vertical shaft structure on the air entraining-suction model was investigated through scale-model test, numerical simulation, and theoretical analysis [18,19,20]. Given the possibility of smoke emission in the vertical shaft tunnel, the prediction model of smoke back-layering length was established [21]. Then, the relationship between the horizontal driving force and longitudinal inertial force during the smoke movement was investigated; the critical criterion Ri which was used to determine whether the smoke outlet was plug holing was proposed [22]. The distribution of smoke in railway tunnels under natural ventilation mode was investigated in a 1:15 model-scale tunnel, and the corresponding empirical formula was derived. The formula could be used to predict ceiling temperature distribution and smoke exhaust [23]. The tunnel fire smoke exhaust system under the coupling of longitudinal ventilation and shaft mechanical smoke exhaust was investigated through a scaled (1:5) model; this combined method was beneficial to smoke exhaust and evacuation [24].
In addition, the influence of induced ventilation on the smoke exhaust effect under the mode of centralized exhaust was studied extensively [25,26,27]. The variation of system heat efficiency under different semi-transverse smoke exhaust modes, different opening modes of smoke exhaust vents, and different ventilation forms was studied [28,29]. Some scholars also investigated the fire spread of materials [30].
This paper mainly investigated the combined model of the longitudinal ventilation + ceiling smoke extraction, the diagram shown in Figure 1. Based on the analysis of the buoyancy plume structure, the smoke layer height, and the exhaust efficiency, the characteristics and ventilation scheme of smoke exhaust were determined.

2. Experimental Setup

2.1. Experimental Rigs

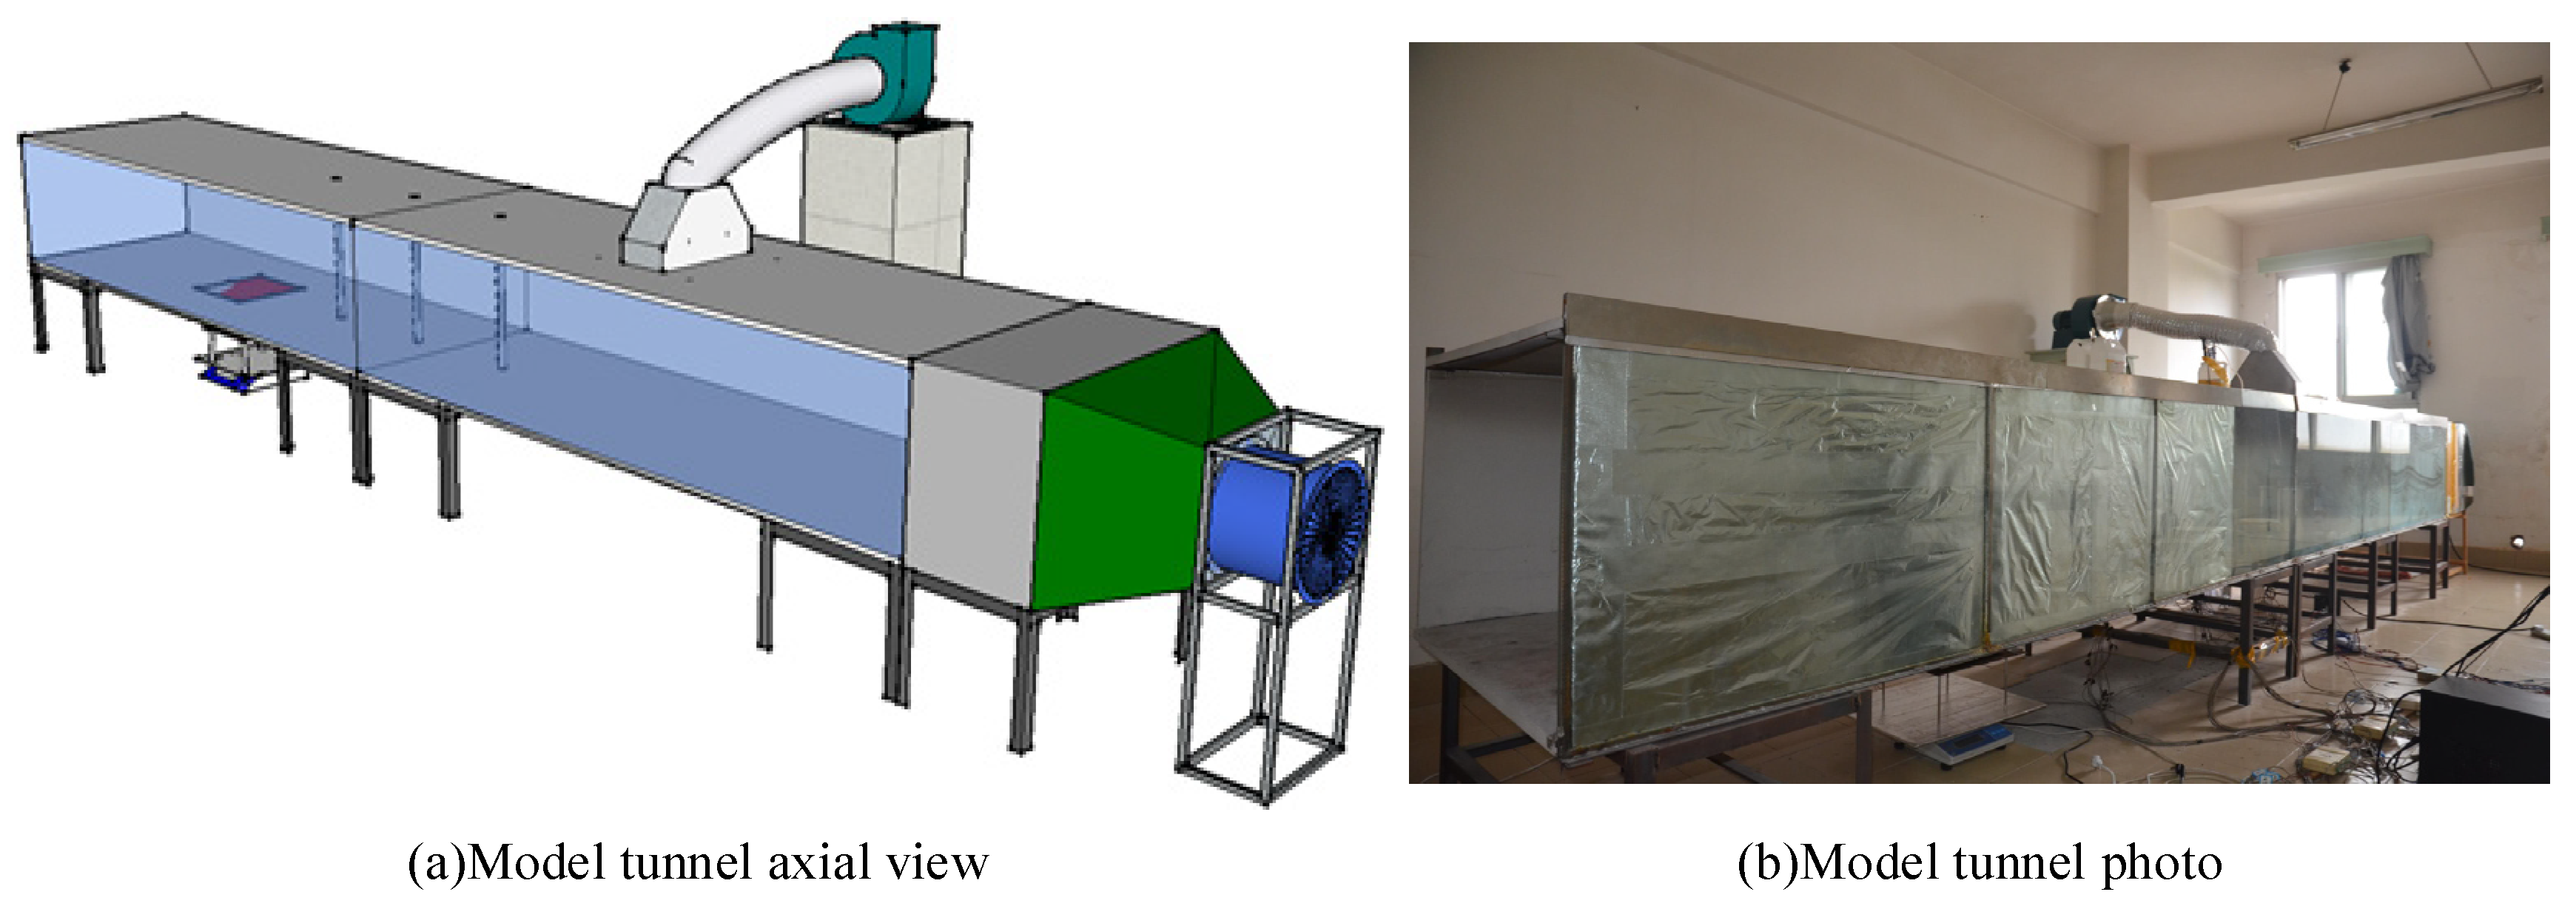
Froude scaling was a common scaling method in tunnel smoke experiments [31]. According to the Froude modeling, the heat release rate (HRR), test time, flow rates, the energy content, and mass are scaled. A reduced-scale tunnel (1:10 scale) was used in this paper, as shown in Figure 2, which length, width, and height were 6.0 m, 1.0 m, and 0.7 m, respectively. This model tunnel was introduced in our previous research [32]. It was constructed by using a fireproof steel frame structure, fireproof slab, and fireproof glass. The ambient temperature during the experiment was 13 °C to 20 °C.
The experimental tunnel was equipped with a mechanical exhaust system, and the exhaust vent was located on the tunnel ceiling. The exhaust vent was rectangular, the size was 0.4 m × 0.125 m (3 m away from the fire source). The ventilation system was arranged at one end of the tunnel, including the axial fan and the steady flow section. The exhaust velocity in the test model was 0–3.16 m/s, which corresponds to the exhaust velocity of 0–10 m/s in the actual tunnel, and the longitudinal wind speed in the test model was 0–0.47 m/s, which was equivalent to the longitudinal wind speed of 0–1.5 m/s in the actual tunnel.

2.2. Measurement

The data of the fuel mass change, smoke temperature, and smoke flow velocity were determined in the experiment. As shown in Figure 3, 39 K-type thermocouples were used to collect the temperature along the longitudinal central section of the tunnel and the vertical temperature in the one-dimensional horizontal spread stage.
Generally, the maximum uncertainty error of the thermocouple was lower than 6% [33]. In this work, the uncertainty of the measured temperature was determined to be approximately 6.5% through comparison of two repeated experiments running under the same conditions. The distance between the thermocouple and the top of the tunnel was 0.03 m, and the distance between the thermocouples on the thermocouple tree was 0.06 m.
The mass data were measured by an electronic balance placed at the bottom of the tunnel. A camera was placed on the side of the observation window to capture the buoyancy flow stratification. And three velocity measuring points and three temperature measuring points were arranged in the exhaust vent. An armored K-type thermocouple with a diameter of 0.1 mm was adopted to be the thermocouple, the diameter of the K-type thermocouple was very small, and the response time was about 0.01 s, which satisfied the experimental requirements in this study. The range of wind speed acquisition sensor was 0–25 Pa.

2.3. Experimental Procedure

The longitudinal wind was generated by a fan set downstream of the mechanical exhaust vent. The mechanical exhaust was produced by a centrifugal fan that was connected to the top of the tunnel model. They could be controlled by adjusting the frequency converter. In this paper, the actual longitudinal velocity of tunnel engineering was 0 m/s, 0.5 m/s, 1.0 m/s and 1.5 m/s, and the mechanical smoke exhaust velocity was 1 m/s, 2 m/s, 4 m/s, 7 m/s and 10 m/s. According to the Froude scaling, the longitudinal ventilation velocity of the test model (1:10) was 0 m/s, 0.16 m/s and 0.32 m/s, and the mechanical smoke exhaust velocity of the test model (1:10) was 0.32 m/s, 1.26 m/s, 2.16 m/s and 3.16 m/s. The longitudinal ventilation velocity and the mechanical exhaust smoke velocity were the velocity without fire source. In this paper, the parameters of the scale model were utilized.
The size of the oil pan was 15 × 15 cm, 20 × 20 cm, 25 × 25 cm, the fuel was anhydrous ethanol. The average mass loss rate in the stable section of the oil pan of different sizes was 0.0004 kg/s, 0.0007 kg/s, and 0.0012 kg/s. The heat release rate was calculated by the following formula:
Q ˙ = η × m f × Δ H
where η is the combustion efficiency, mf is the mass loss, and ΔH is the combustion heat of absolute anhydrous ethanol and is 26.78 kJ/g, and the combustion efficiency of absolute ethanol is 0.994, The selection of parameters has been mentioned in previous studies [32]. The heat release rates of the fire source were calculated as 10.6 kW, 18.6 kW, and 31.9 kW.
Under the conditions of different smoke exhaust velocity and different longitudinal velocity, 60 groups of test conditions were carried out. Table 1 was an experimental test condition.

3. Results and Discussion

Buoyant Flow Stratification Regimes Visualizations

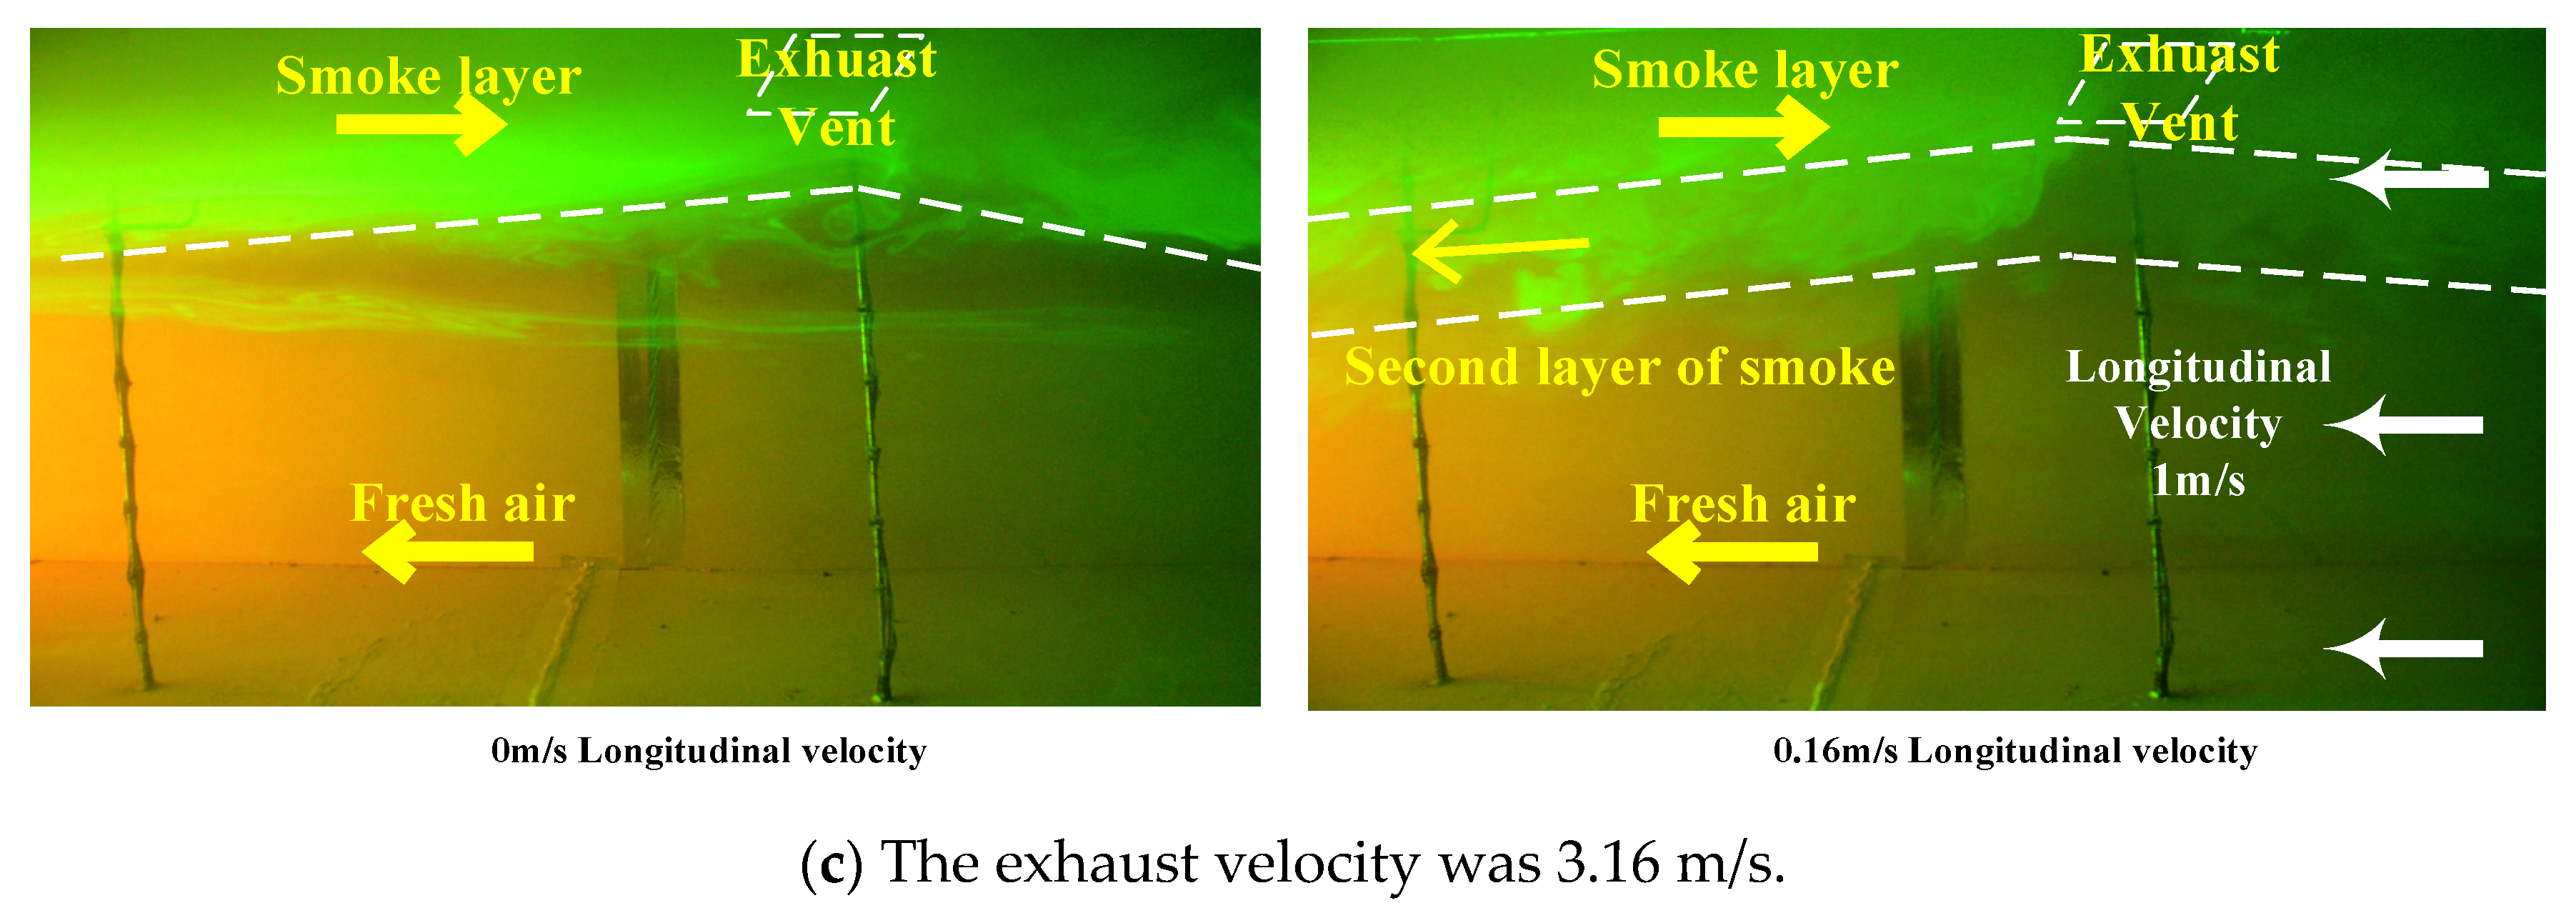
Analyzing the buoyant flow structure was beneficial to investigate the influence of airflow on smoke. Taking the heat release rate of 31.9 kW, the exhaust velocity of 0.32 m/s, 1.26 m/s, 3.16 m/s, the longitudinal velocity of 0 m/s, 0.16 m/s as examples, the buoyant flow structure was visualized by a laser sheet with the cold smoke test. The upper green was hot smoke layer and the lower was fresh air.
As shown in Figure 4, as the exhaust velocity increases, the depression was occurred under the exhaust vent. The phenomenon was mentioned in previous studies on plug-holing [22,34]. This phenomenon became more pronounced as the exhaust wind speed increases.
In this experiment, it was also observed that the smoke movement was more pronounced in the downstream of the vent than the upstream. Because of the coupling effect of the longitudinal velocity and the smoke exhaust velocity, the smoke entrainment downstream of the exhaust hole increases.
Noteworthy, under the action of longitudinal wind, the back-layering of smoke formed a new stratification under the effect of thermal buoyancy. In addition, the air entrapment phenomenon existed on the interface of the two layers, which reduced the depression area below the smoke vent to a certain extent.
As shown in Figure 5, according to the phenomenon observed in the experiment, the smoke movement process was summarized into four sections: (a) the stable section, in which the mechanical smoke exhaust and longitudinal velocity were small; (b) the secondary stratification section, in which the mechanical smoke exhaust velocity was small and the longitudinal velocity was large; (c) the concave section, the mechanical smoke exhaust velocity was relatively large and the longitudinal velocity was relatively low; (d) the complex moving section, both the mechanical smoke exhaust velocity and the longitudinal velocity were relatively high.

4. Smoke Layer Height Changes

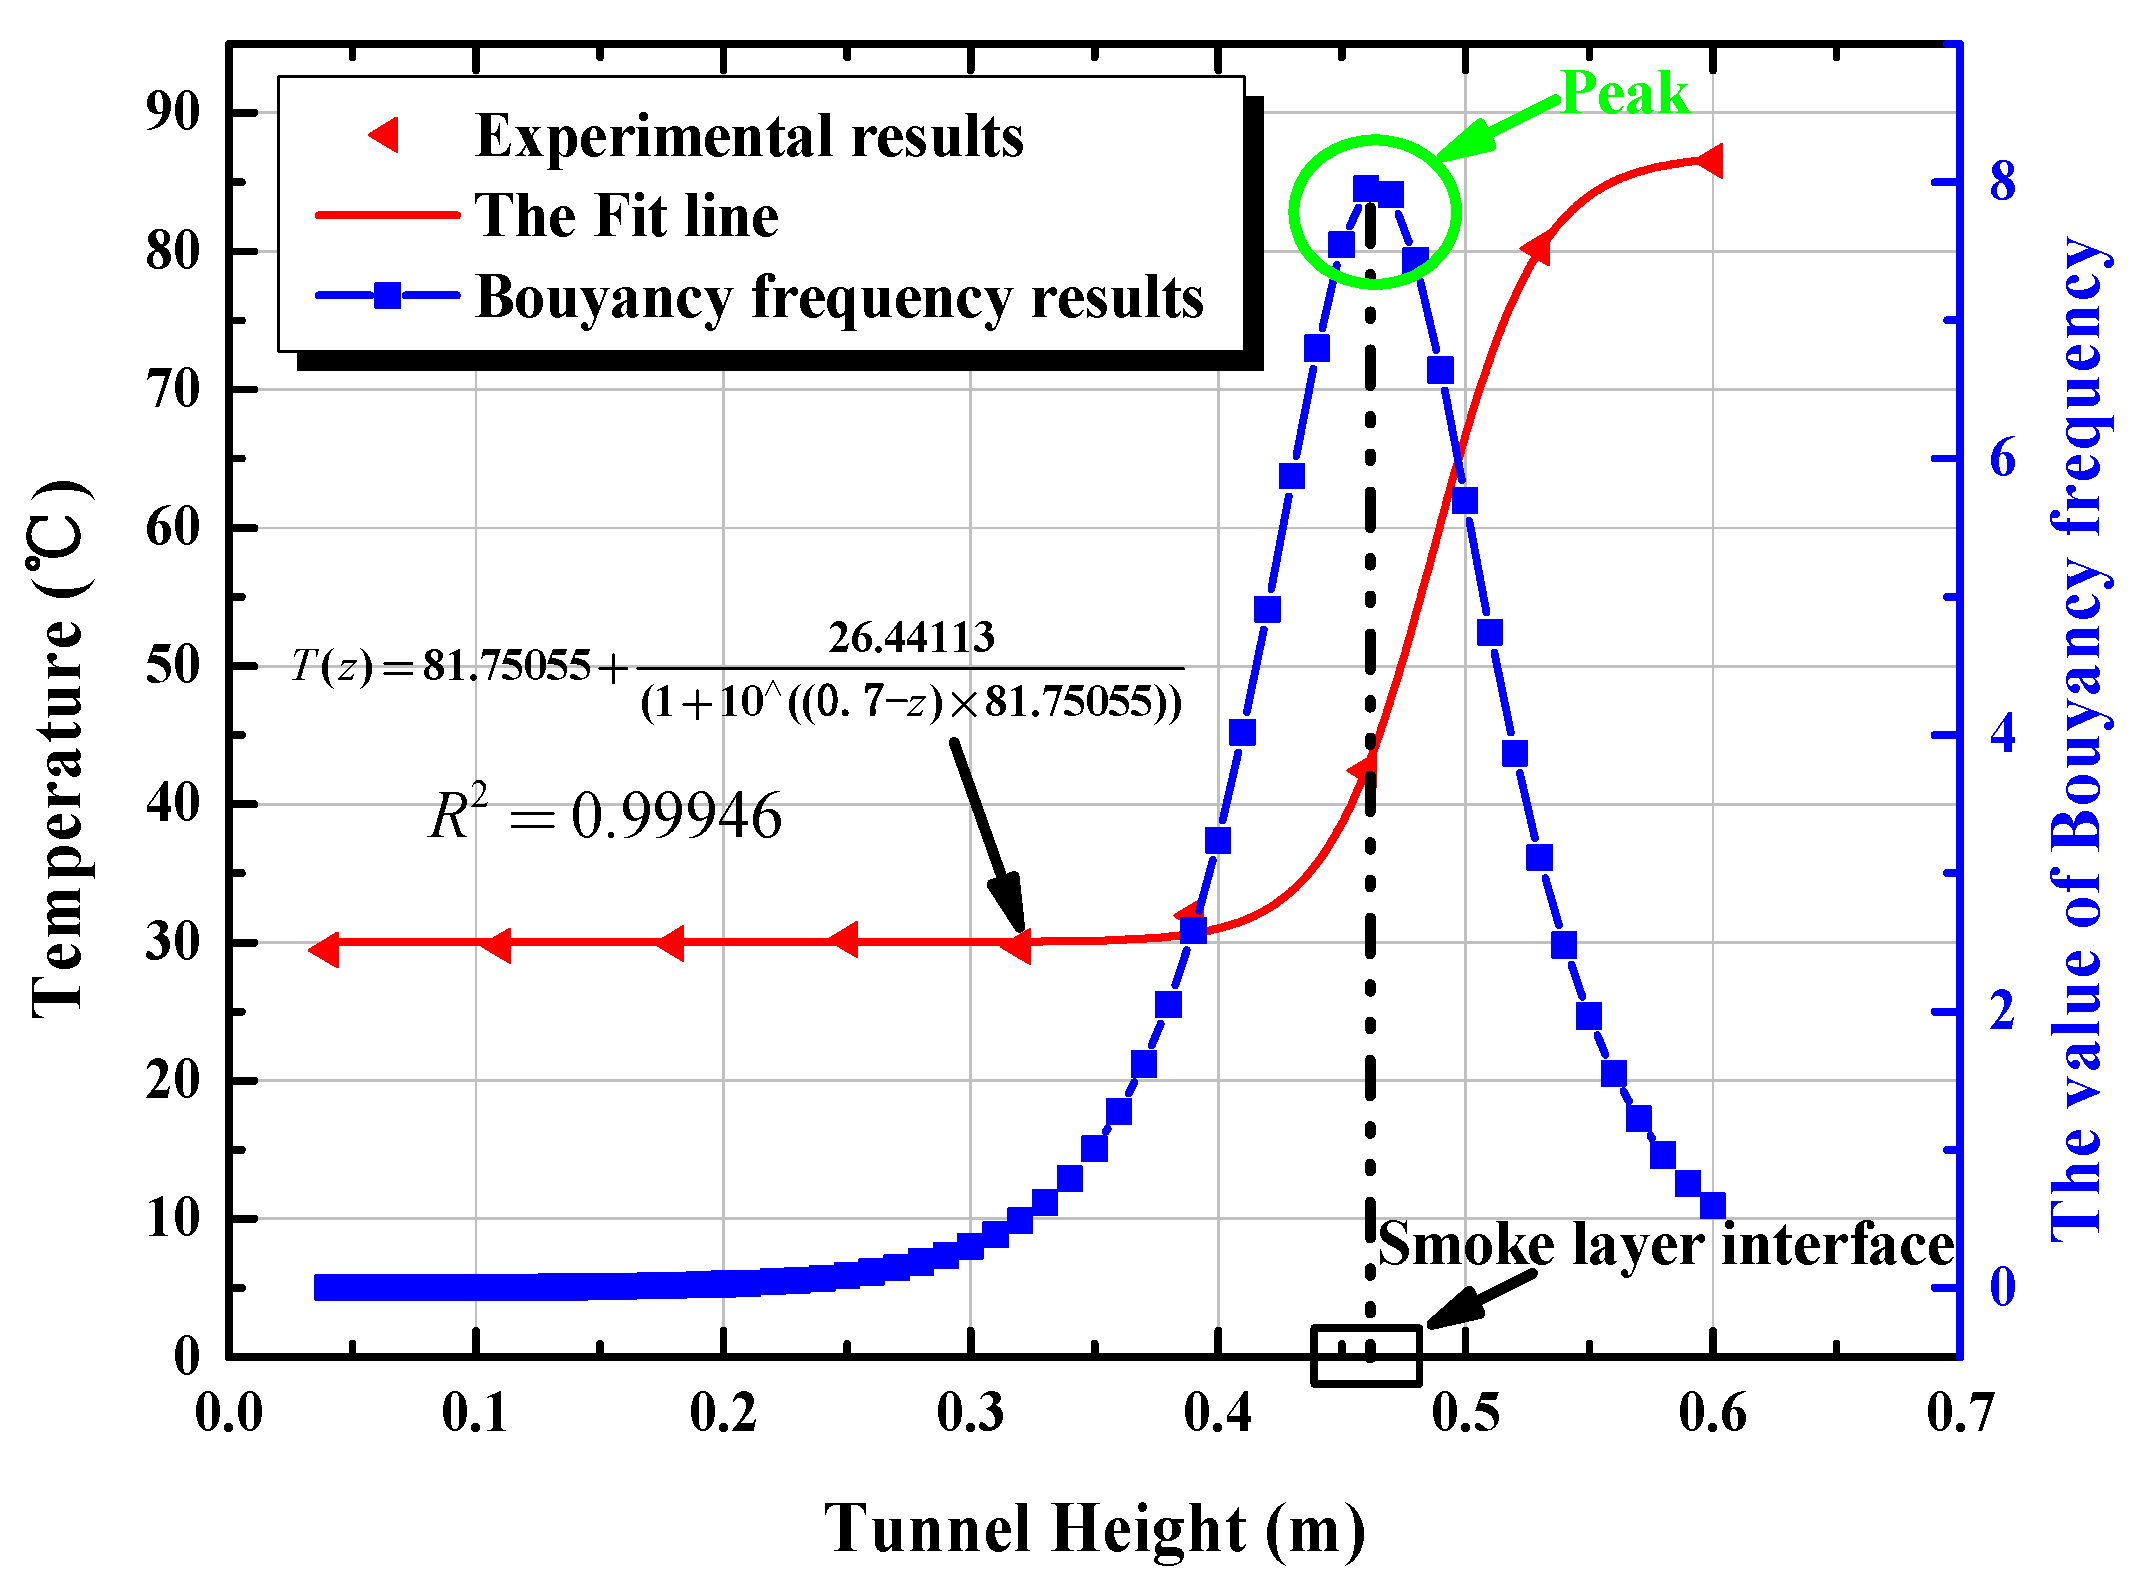
The finite-current motion in stably stratified fluids and turbulent shear flow in stratified fluids was mentioned [35], with amplitude motion defined as l:
2 l t 2 = g ρ z l
The concept of buoyancy frequency for thermal stratification, and the buoyancy frequency refers to the rate of change of buoyancy in the vertical direction proposed [36], the formula is:
N l = ( g ρ s z / ρ a ) 1 2
Usually, the fire plume could be always considered as the ideal gas ( ρ s T s = ρ a T a ) [37], then the Equation (3) becomes:
N l = ( g T a ( 1 / T ( z ) ) z ) 1 2
NL is the value of the buoyancy frequency in the vertical direction, Ta is the ambient air temperature, g is the gravitational acceleration, T(z) is the vertical temperature distribution function, ρa is the air density, and ρs is the smoke density.
An example is shown in Figure 6.
The changes in the smoke layer height upstream of the smoke vent under different fire scenes are shown in Figure 7.
As the longitudinal velocity increases, for Figure 7A, when the smoke exhaust velocity was 0.32 m/s, the smoke layer height of the three heat release rates first decreases and then increases slightly; as for Figure 7B, when the smoke exhaust velocity was 0.63 m/s and the heat release rate was 10.6 kW, the smoke layer height was basically unchanged. When the heat release rate was 18.6 kW and 31.9 kW, the smoke layer height was slightly decreased.
For Figure 7C, when the smoke exhaust velocity was 1.26 m/s and the heat release rate was 10.6 kW and 18.6 kW, the smoke layer height decreases slightly, the heat release rate was 31.9 kW, the smoke layer height was basically unchanged; for Figure 7D, when the smoke exhaust velocity was 2.21 m/s, the variation rule of smoke layer thickness was the same as when the smoke exhaust velocity was 1.26 m/s; as for Figure 7E, the smoke layer thickness of the three heat release rates had the same variation rule, first increasing and then decreasing. When the longitudinal velocity was 0.16 m/s, the smoke layer thickness was the thinnest.
In conclusion, under different conditions of smoke exhaust velocity, the smoke layer thickness in the upstream of the smoke exhaust vent did not change significantly, and it remained within the range of 0.45 m ± 0.5 m, mainly due to the influence of heat release rate. Under the same conditions of smoke exhaust velocity, different longitudinal velocity influences the smoke layer thickness upstream of the smoke exhaust vent.

Heat Exhaust Coefficient Change

Yi Liang studied the heat exhaust coefficient of transversal smoke extraction systems in a tunnel under fire [29]. Tanaka studied the efficiency of exhausting heat in the smoke of the longitudinal smoke temperature distribution during a fire in a road tunnel with vertical shafts [38,39]. According to the thermodynamics theorem and the theoretical research foundation of predecessors, the heat carried by the smoke discharged from the smoke vent could be expressed by the enthalpy value flowing through the section of the smoke vent, the formula is:
Q ˙ E = c p ρ s v s A Δ T s
The heat exhaust coefficient refers to the ratio of the total heat carried by the smoke from the smoke vent to the fire source, the formula is:
δ = Q ˙ E Q ˙
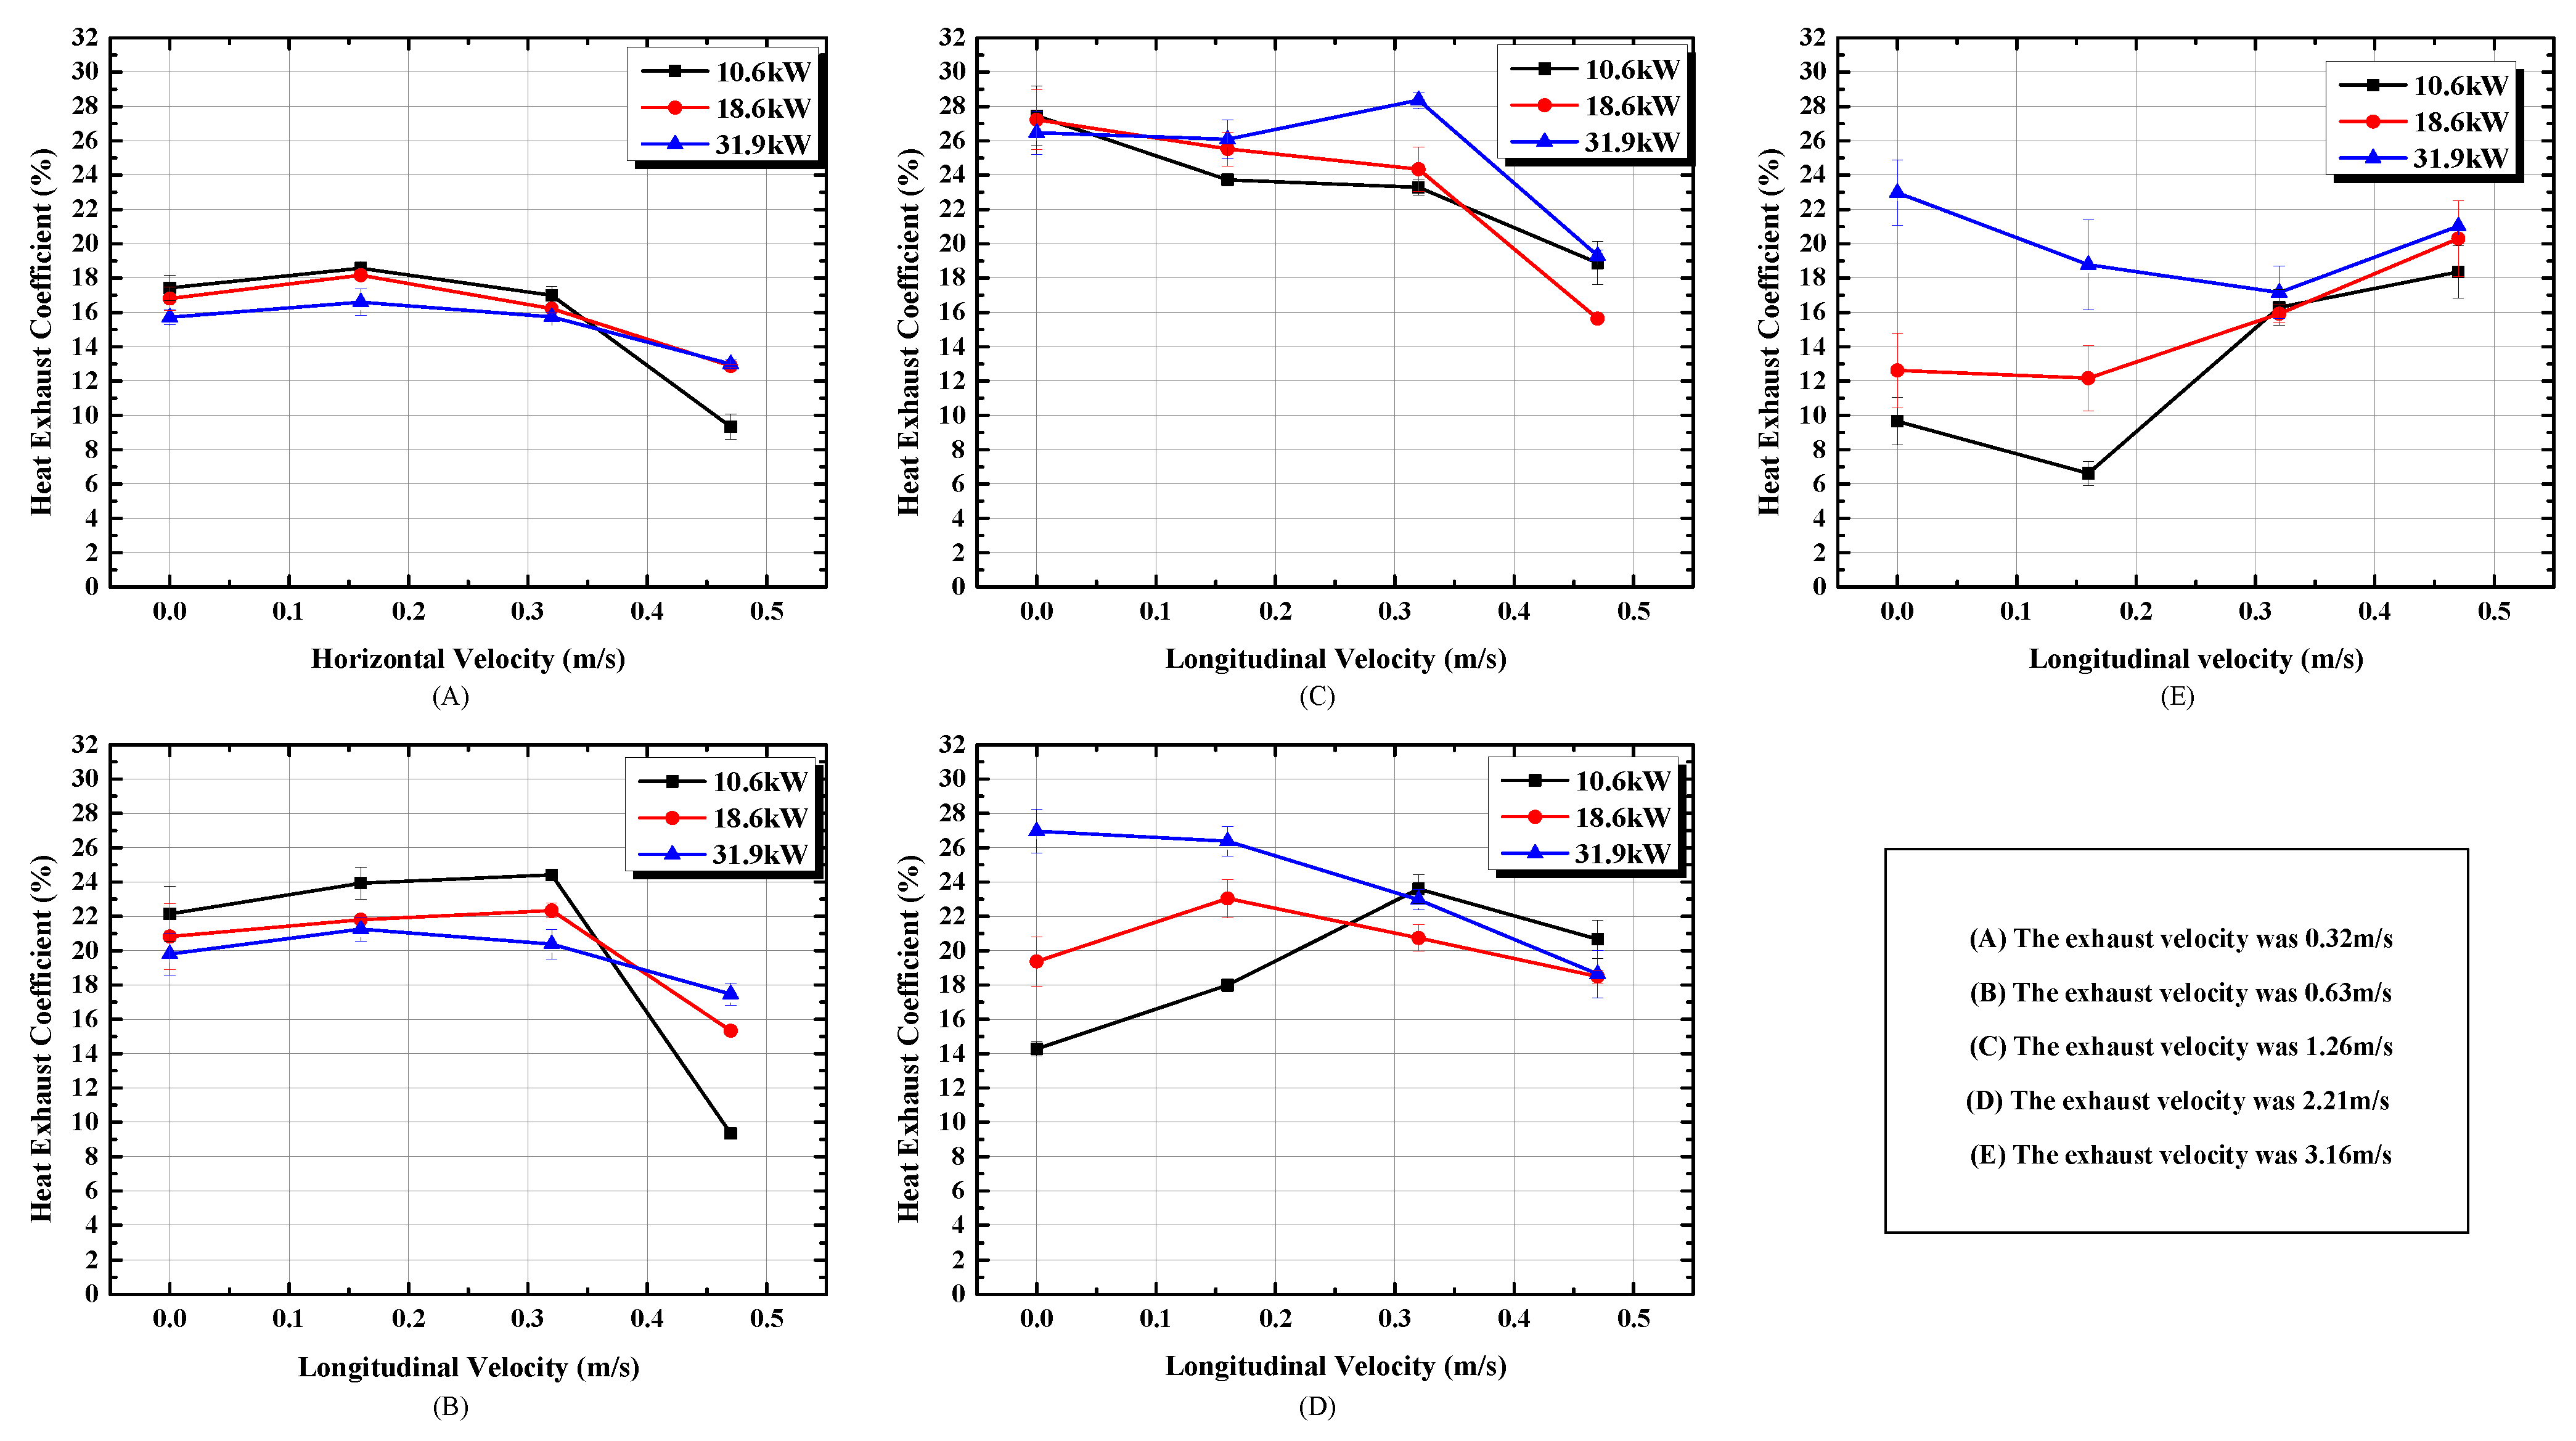
The conditions with different heat exhaust coefficients were shown in Figure 8.
As for Figure 8A, when the smoke exhaust velocity was 0.32 m/s, the changing trend of the three heat release rates was the same, and the heat exhaust coefficient increased slightly and then decreased. When the heat release rate was 10.6 kW, the longitudinal wind had the most obvious influence on the heat exhaust coefficient, and the declining trend of the heat exhaust coefficient was greater than the other two heat release rates. As for Figure 8B, when the exhaust velocity was 0.63 m/s, the changing trend of the heat exhaust coefficient was roughly the same as that in Figure 8A, and the decreasing trend of the heat release rate was more significant when it was 10.6 kW. As for Figure 8C, when the exhaust velocity was 1.26 m/s when the longitudinal velocity increased from 0 m/s to 0.32 m/s, there was no obvious change in the heat exhaust coefficient. When the longitudinal velocity increased to 0.47 m/s, the heat exhaust coefficient was shown as a downward trend. As for Figure 8D, when the exhaust velocity was 3.16 m/s, the heat release rate was 31.9 kW. In the working condition, with the increase of longitudinal velocity, the heat exhaust coefficient was slowly decreased, and the declining trend became obvious. Under the conditions of 10.6 kW and 18.6 kW, with the increase of longitudinal velocity, the heat exhaust coefficient first increased and then decreased. As for Figure 8E, under the three conditions of the heat release rate, the changing trend of heat exhaust coefficient was the same. With the increase of longitudinal velocity, it was first decreased and then increased.
According to Figure 8, the coupling effect of mechanical exhaust velocity and longitudinal velocity on the smoke exhaust system has a certain impact. When the longitudinal velocity was 0 m/s, the mechanical exhaust velocity was 0.32 m/s, 0.63 m/s, and 1.26 m/s, and the difference in heat exhaust coefficient was not obvious. When the mechanical exhaust velocity was 2.21 m/s and 3.16 m/s, the heat exhaust coefficient varied widely. Just like the observed phenomenon, the smoke vent was penetrated, resulting in a decrease in the heat exhaust coefficient of 10.6 kW and 18.6 kW. In the same longitudinal velocity, the increase of the exhaust velocity would lead to the heat exhaust coefficient first being increased and then decreased, because there was a plug-holing at the smoke exhaust vent. In this process, the lower longitudinal velocity (0.16–0.32 m/s) would increase the heat exhaust coefficient to some extent, while the higher smoke exhaust velocity (0.32–0.46 m/s) would decrease the heat exhaust coefficient to some degree.

5. Conclusions

In this paper, the discharge of pollutants from tunnel fires was investigated by the scale-model. Major findings include the following:
(1)
Secondary stratification of smoke caused by longitudinal wind was observed in experimental phenomena.
(2)
At the interface of the two smoke layers, there were both vortex and air entrainment, and the thickness of the overall smoke layer became larger. At the same time, the increase of the exhaust velocity was observed, and the area of the recessed area below the exhaust vent was enlarged, and the longitudinal wind reduced the area of the recessed area at the exhaust vent to a certain extent.
(3)
In the ceiling extract tunnel under longitudinal ventilation, considering the research results of the smoke layer height and the heat exhaust coefficient, a better scheme for fire-producing pollutants was that the exhaust velocity should be 1.26–2.21 m/s (corresponding to the actual velocity of 4.0–7.0 m/s). The longitudinal velocity should be 0.16–0.32 m/s (corresponding to the actual velocity of 0.5–1.0 m/s).
This investigation lacks factors such as the distance from the fire source in the exhaust vent, the area of the exhaust vent, and the size of the tunnel section in the smoke extraction scheme. In order to perfect the ideas of this paper, the author and other related researchers would then investigate the factors which are not involved in the team’s project—new 1:20 tunnel (20 m, 50 m) and the complex tunnel model.

Author Contributions

Conceptualization, L.Z., J.Z. and Z.X.; methodology, J.Z., Z.N., G.H. and B.X.; modeling, Z.X., J.Z., and B.X.; validation, J.Z., Z.N. and G.H.; formal analysis, L.Z. and J.Z.; investigation, L.Z., J.Z., J.Z. and G.H.; writing—original draft preparation, L.Z. and J.Z.; writing—review and editing, L.Z. and J.Z.; visualization, Z.N. and G.H.; project administration, L.Z., Z.N., G.H. and Z.X. All authors have read and agreed to the published version of the manuscript.

Funding

This research was funded by [the National Key R&D Program of China] grant number [No. 2017YFB1201204]; and the project of Guangzhou Metro Rail Transit Line 18 and 22 Special Disaster Prevention and Rescue.

Conflicts of Interest

The authors declare no conflict of interest.

Nomenclature

Greek symbols
Q ˙ heat release rate (kW)loscillating distance
Taambient air temperature (°C)Δdeviation property
Tismoke layer interface temperature (°C)Ρdensity (kg/m3)
Tmaxmaximum temperature of vertical distribution (°C)δpartial derivative
NLsmoke layer height (m)Subscripts
Htunnel height (m)Ssmoke
T(Z)vertical temperature distribution functionAambient air
ggravitational acceleration (m/s2)Iinterface
ΔHcombustion heat of absolute anhydrous ethanol (kJ/g)Pplume
Ffire

References

  1. Wen, T.; Hu, L.H. Review of research on fire prevention of traffic tunnel. China Publ. Secur. 2010, 3, 41–44. [Google Scholar]
  2. Ministry of Transport of the People’s Republic of China. 2018 Transportation Industry Development Statistics Bulletin. Available online: http://xxgk.mot.gov.cn/jigou/zhghs/201904/t20190412_3186720.html (accessed on 28 February 2019).
  3. Ren, R.; Zhou, H.; Hu, Z.; He, S.Y.; Wang, X.L. Statistical analysis of fire accidents in Chinese highway tunnels 2000–2016. Tunn. Undergr. Space Technol. 2019, 83, 452–460. [Google Scholar] [CrossRef]
  4. Bechtel, P.B. Memorial Tunnel Fire Ventilation Test Program; Test Report; Massachusetts Highway Department: Boston, MA, USA, 1995. [Google Scholar]
  5. Vauquelin, O.; Mégret, O. Smoke extraction experiments in case of fire in a tunnel. Fire Saf. J. 2002, 37, 525–533. [Google Scholar] [CrossRef]
  6. Tang, F.; Cao, Z.L.; Chen, Q.; Meng, N.; Wang, Q.; Fan, C.G. Effect of blockage-heat source distance on maximum temperature of buoyancy-induced smoke flow beneath ceiling in a longitudinal ventilated tunnel. Int. J. Heat Mass Tran. 2017, 109, 683–688. [Google Scholar] [CrossRef]
  7. Huang, Y.B.; Li, Y.F.; Dong, B.Y.; Bi, Q.; Li, Y.; Li, J.X. Experimental investigation on temperature profile with downstream vehicle in a longitudinally ventilated tunnel. Exp. Ther. Fluid Sci. 2019, 103, 149–156. [Google Scholar] [CrossRef]
  8. Altay, M.; Surmen, A. Effect of the relative positions of vehicular blockage on the smoke flow behaviour in a scaled tunnel. Fuel 2019, 115694. [Google Scholar] [CrossRef]
  9. Wu, D.X.; Xu, Z.S.; Li, W.P. Fire Smoke Control in Road Tunnels-Research on Multi-Point Smoke Extraction System with Special Exhaust Duct; China Communications Press Co.: Beijing, China, 2013. [Google Scholar]
  10. Wu, D.X.; Li, W.P.; Zheng, G.P. Experimental study on concentration model of concentrated smoke exhaust in independent exhaust flue of highway tunnel. Highway 2011, 8, 307–311. [Google Scholar]
  11. Peng, J.Z.; Xu, Z.S.; Ni, T.X.; Wu, D.X.; Li, W.P. Numerical simulation study on system velocity distribution law of central exhaust mode in highway tunnel. J. Disas. Prev. Mitig. Eng. 2011, 31, 415–422. [Google Scholar]
  12. Jiang, X.P.; Li, X.J.; Chen, S.; Wang, J.; Zhang, S.G. An experimental study on plug-holing in tunnel fire with central smoke extraction. Appl. Therm. Eng. 2018, 138, 840–848. [Google Scholar] [CrossRef]
  13. Jiang, X.P.; Zhang, S.Y.; Xu, Z.S.; Wei, D. Effect of different exhaust rates on fire smoke control in a shield tunnel. Sci. Technol. Rev. 2012, 30, 40–44. [Google Scholar]
  14. Xu, Z.S.; Yu, N.H.; Zhang, X.; Jiang, X.P.; Zhao, H.L.; Li, W.P. Study on induced velocity of highway tunnel entrance fire in centralized smoke exhaust mode. J. Catastr. 2012, 27, 97–101. [Google Scholar]
  15. Vianelloa, C.; Fabianob, B.; Palazzib, E.; Maschioa, G. Experimental study on thermal and toxic hazards connected tofire scenariosin road tunnels. J. Loss Prev. Process. Ind. 2012, 25, 718–729. [Google Scholar] [CrossRef]
  16. Zhu, H.H.; Shen, Y.; Yan, Z.G.; Guo, Q.C.; Guo, Q.H. A numerical study on the feasibility and efficiency of point smoke extraction strategies in large cross-section shield tunnel fires using CFD modeling. J. Loss Prev. Process. Ind. 2016, 44, 158–170. [Google Scholar] [CrossRef]
  17. Chaabata, F.; Salizzonia, P.; Creysselsa, M.; Mosb, A.; Wingravec, J.; Correiaa, H.; Marroa, M. Smoke control in tunnel with a transverse ventilation system: An experimental study. Build. Environ. 2020, 167, 106480. [Google Scholar] [CrossRef]
  18. Ji, J.; Li, K.Y.; Zhong, W.; Huo, R. Experimental investigation on influence of smoke venting velocity and vent height on mechanical smoke exhaust efficiency. J. Hazard. Mater. 2010, 177, 209–215. [Google Scholar] [CrossRef]
  19. Fan, C.G.; Ji, J.; Gao, Z.H.; Han, J.Y.; Sun, J.H. Experimental study of air entrainment mode with natural ventilation using shafts in road tunnel fires. Int. J. Heat Mass Transf. 2013, 56, 750–757. [Google Scholar] [CrossRef]
  20. Fan, C.; Zhang, L.; Jiao, S.; Yang, Z.; Li, M.; Liu, X. Smoke spread characteristics inside a tunnel with natural ventilation under a strong environmental wind. Tunn. Undergr. Space Technol. 2018, 82, 99–110. [Google Scholar] [CrossRef]
  21. Wang, Y.F.; Jiang, J.C.; Zhu, D.Z. Full-scale experiment research and theoretical study for fires in tunnels with roof openings. Fire Saf. J. 2018, 44, 339–348. [Google Scholar] [CrossRef]
  22. Ji, J.; Gao, Z.H.; Fan, C.G.; Zhong, W.; Sun, J.H. A study of the effect of plug-holing and boundary layer separation on natural ventilation with vertical shaft in urban road tunnel fires. Int. J. Heat Mass Transf. 2012, 55, 6032–6041. [Google Scholar] [CrossRef]
  23. Yuan, Z.Y.; Lei, B.; Kashef, A. Experimental and theoretical study for tunnel fires with natural ventilation. Fire Tech. 2015, 51, 691–706. [Google Scholar] [CrossRef]
  24. Tanaka, F.S.; Majima, S.H.; Kato, M.; Kawabata, N. Performance validation of a hybrid ventilation strategy comprising longitudinal and point ventilation by a fire experiment using a model-scale tunnel. Fire Saf. J. 2015, 71, 287–298. [Google Scholar] [CrossRef]
  25. Xu, L.; Zhang, X. CFD analysis on induced velocity of horizontal tunnel exhaust using central smoke extraction system. Chin. J. Undergr. Space Eng. 2007, 3, 555–558. [Google Scholar]
  26. Xu, Z.S.; Zhao, D.; Zhang, X.; Wang, S. Numerical study on effects of induced velocity on central extraction system in large tunnel fire. Procedia Eng. 2012, 45, 678–684. [Google Scholar]
  27. Wang, G.; Zhao, D. Numerical simulation on impact of induced velocity of single-point extraction system on smoke in large tunnel fire. J. Saf. Environ. 2013, 13, 165–169. [Google Scholar]
  28. Wu, C.; Ni, T.X.; Xu, Z.S.; Wu, D.X.; Li, W.P. Experimental study on the heat exhausting efficiency under central exhaust mode prone to tunnel fire. J. Saf. Environ. 2013, 13, 156–160. [Google Scholar]
  29. Yi, L.; Wei, R.; Peng, J.Z.; Ni, T.X.; Xu, Z.S.; Wu, D.X. Experimental study on heat exhaust coefficient of transversal smoke extraction system in tunnel under fire. Tunn. Undergr. Space Technol. 2015, 49, 268–278. [Google Scholar] [CrossRef]
  30. Zhou, Y.; Bu, R.W.; Gong, J.H.; Yan, W.G.; Fan, C.G. Experimental investigation on downward flame spread over rigid polyurethane and extruded polystyrene foams. Exp. Therm. Fluid Sci. 2018, 92, 346–352. [Google Scholar] [CrossRef]
  31. Li, Y.Z.; Fan, C.G.; Ingason, H.; Lönnermark, A.; Ji, J. Effect of cross section and ventilation on heat release rates in tunnel fires. Tunn. Undergr. Space Technol. 2016, 51, 414–423. [Google Scholar] [CrossRef]
  32. Xu, Z.S.; Zhao, J.M.; Liu, Q.L.; Chen, H.G.; Liu, Y.H.; Geng, Z.Y.; He, L. Experimental investigation on smoke spread characteristics and smoke layer height in tunnels. Fire Mater. 2019, 43, 303–309. [Google Scholar] [CrossRef]
  33. Gao, Z.H.; Ji, J.; Wan, H.X.; Zhu, J.P.; Sun, J.H. Experimental investigation on transverse ceiling flame length and temperature distribution of sidewall confined tunnel fire. Fire Saf. J. 2017, 91, 371–379. [Google Scholar] [CrossRef]
  34. He, L.; Xu, Z.S.; Chen, H.G.; Liu, Q.L.; Wang, Y.X.; Zhou, Y. Analysis of entrainment phenomenon near mechanical exhaust vent and a prediction model for smoke temperature in tunnel fire. Tunn. Undergr. Space Technol. 2018, 80, 143–150. [Google Scholar] [CrossRef]
  35. Turner, J.S. Turbulent entrainment: The development of the entrainment assumption, and its application to geophysical flows. J. Fluid Mech. 2006, 173, 431–471. [Google Scholar] [CrossRef]
  36. Strang, E. Entrainment and mixing in stratified shear flows. J. Fluid Mech. 2001, 428, 3284. [Google Scholar] [CrossRef] [Green Version]
  37. Quintiere, J.G. Fundamentals of Fire Phenomena; John Wiley and Sons: New York, NY, USA, 2006; p. 223. [Google Scholar]
  38. Takeuchi, S.; Tanaka, F.; Yoshida, K.; Moinuddin, K. Effects of scale ratio and aspect ratio in predicting the longitudinal smoke temperature distribution during a fire in a road tunnel with vertical shafts. Tunn. Undergr. Space Technol. 2018, 80, 78–91. [Google Scholar] [CrossRef]
  39. Takeuchi, S.; Aoki, T.; Tanaka, F.; Moinuddin, K.A.M. Modeling for predicting the temperature distribution of smoke during a fire in an underground road tunnel with vertical shafts. Fire Saf. J. 2017, 91, 312–319. [Google Scholar] [CrossRef]
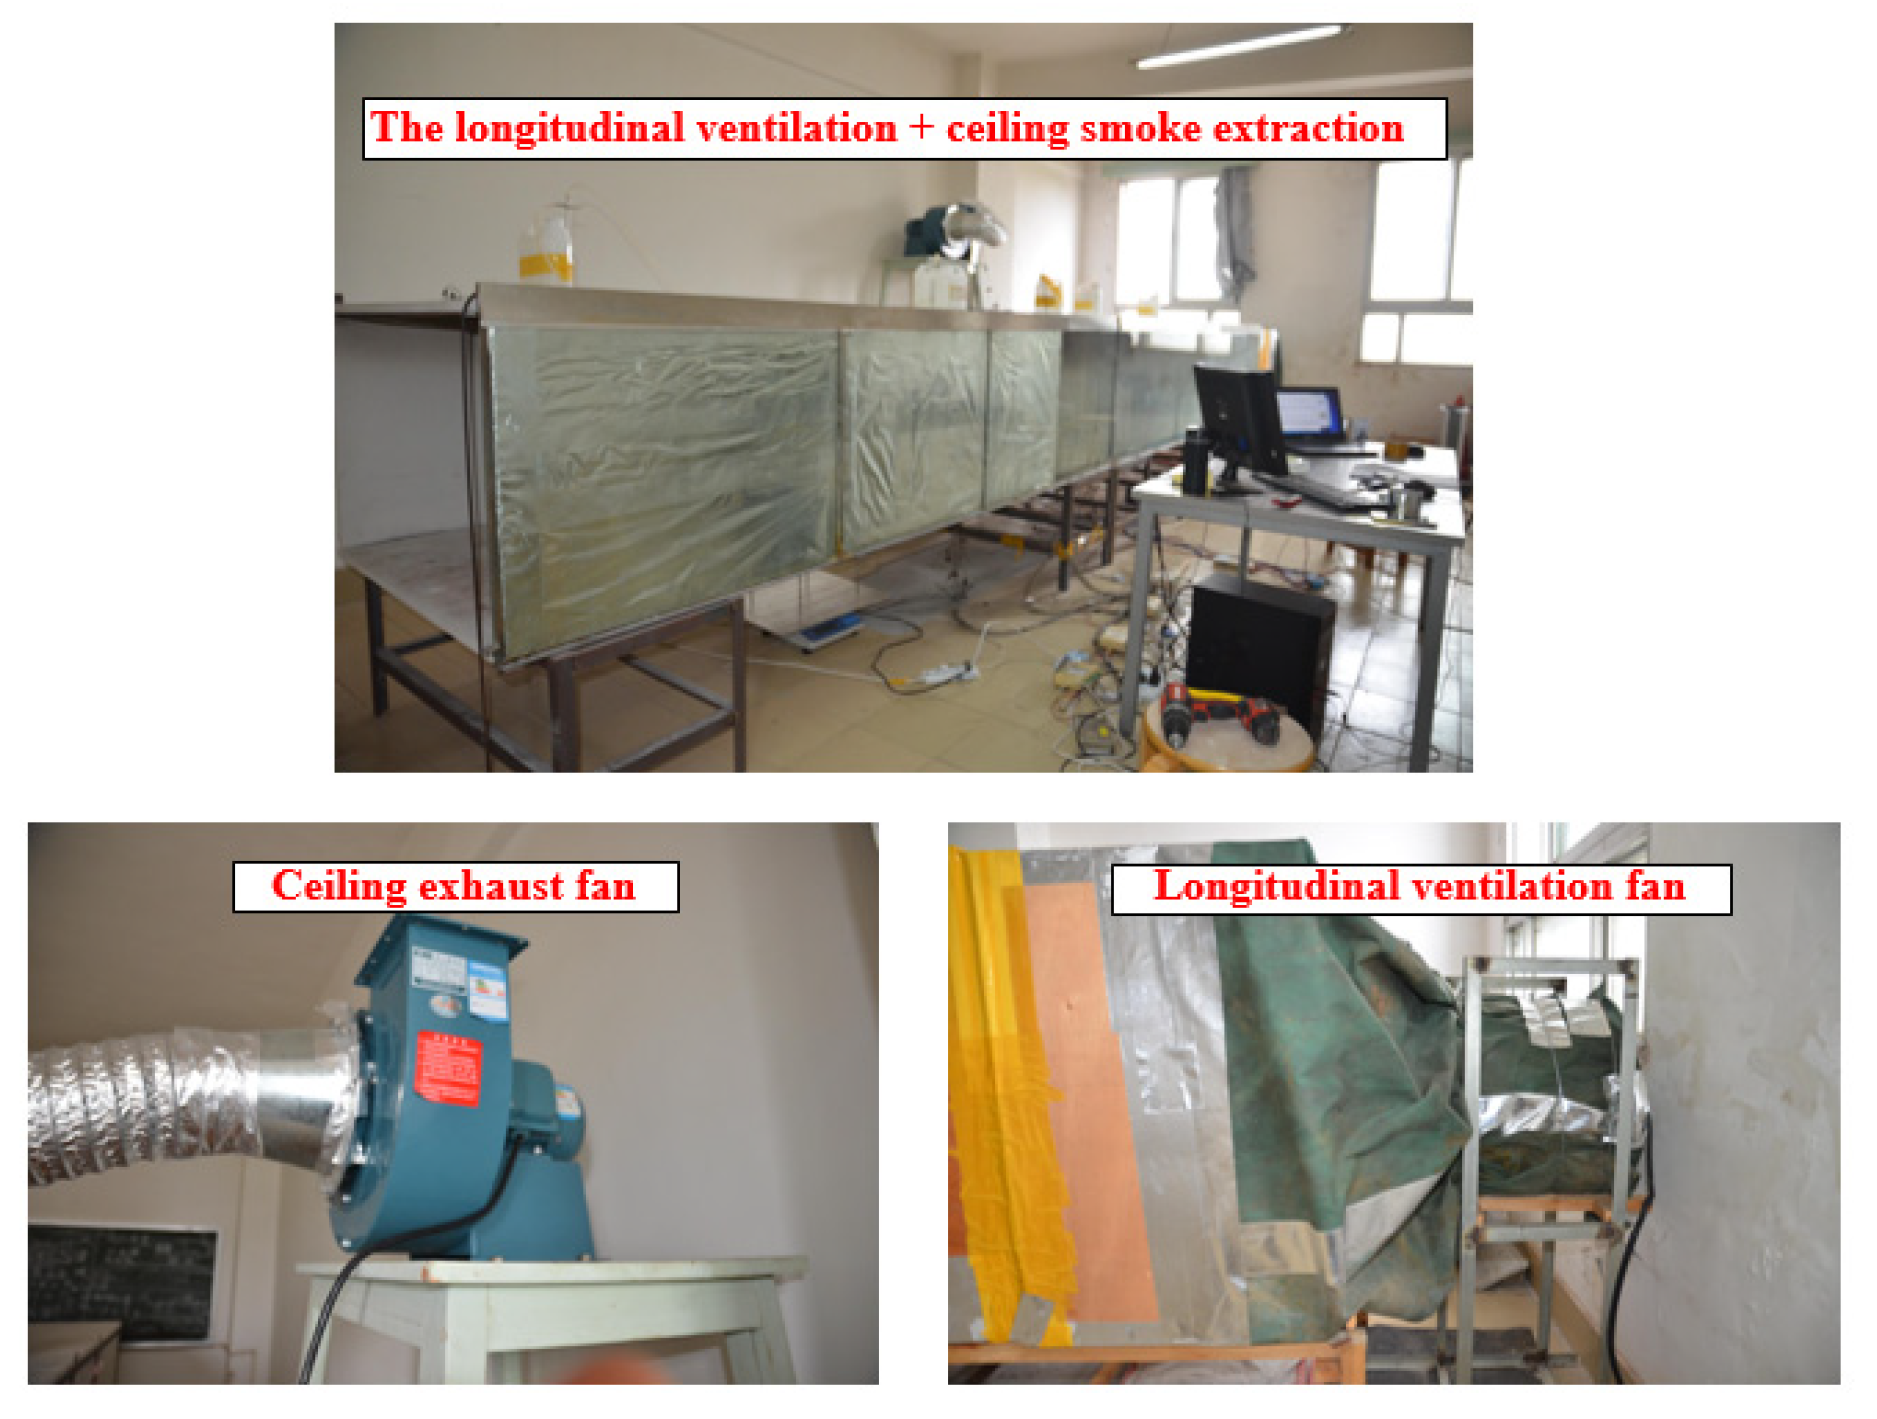
Figure 1. Schematic diagram of the longitudinal ventilation + ceiling smoke exhaust mode.
Sustainability 12 01817 g001
Figure 2. Experimental setup. ((a) Model tunnel axial view; (b) Model tunnel photo)
Sustainability 12 01817 g002
Figure 3. Schematic diagrams for the measurement positions.
Sustainability 12 01817 g003
Figure 4. 31.9 kW configurations of buoyant flow stratification. ((a) The exhaust velocity was 0.32 m/s; (b) The exhaust velocity was 0.63 m/s; (c) The exhaust velocity was 3.16 m/s)
Sustainability 12 01817 g004aSustainability 12 01817 g004b
Figure 5. Smoke movement at different stages. ((a) the stable section; (b) the secondary stratification section; (c) the concave section; (d) the complex moving section)
Sustainability 12 01817 g005
Figure 6. The curve of temperature upstream the exhaust vent and NL values under HRR = 10.6 kW, Ve = 0.32 m/s, VL = 0.16 m/s.
Sustainability 12 01817 g006
Figure 7. Smoke layer height change. ((A) The exhaust velocity was 0.32 m/s; (B) The exhaust velocity was 0.63 m/s; (C) The exhaust velocity was 1.26 m/s; (D) The exhaust velocity was 2.21 m/s; (E) The exhaust velocity was 3.16 m/s)
Sustainability 12 01817 g007
Figure 8. Heat exhaust coefficient. ((A) The exhaust velocity was 0.32 m/s; (B) The exhaust velocity was 0.63 m/s; (C) The exhaust velocity was 1.26 m/s; (D) The exhaust velocity was 2.21 m/s; (E) The exhaust velocity was 3.16 m/s)
Sustainability 12 01817 g008
Table 1. Experimental test condition.
Test SeriesHeat Release Rate (kW)Exhaust Velocity (m/s)Longitudinal Velocity (m/s)
V1–V2010.60.32, 0.63, 1.26, 2.21, 3.160, 0.16, 0.32, 0.47
V21–V4018.60.32, 0.63, 1.26, 2.21, 3.160, 0.16, 0.32, 0.47
V41–V6031.90.32, 0.63, 1.26, 2.21, 3.160, 0.16, 0.32, 0.47