Article

Development of an Assessment Method for Evaluation of Sustainable Factories

1
Department of Mechanical, Energy and Management Engineering, University of Calabria, 87036 Rende, Italy
2
Department of Computer Engineering, Modelling, Electronics and Systems Engineering, University of Calabria, 87036 Rende, Italy
3
Department of Civil Engineering, University of Calabria, 87036 Rende, Italy
4
Department of Environment Engineering and the Territory and Chemical Engineering, University of Calabria, 87036 Rende, Italy
*
Author to whom correspondence should be addressed.
Sustainability 2020, 12(5), 1841; https://doi.org/10.3390/su12051841
Submission received: 21 January 2020 / Revised: 17 February 2020 / Accepted: 27 February 2020 / Published: 29 February 2020
(This article belongs to the Special Issue Industry 4.0 and Industrial Sustainability)

Abstract

:
The role of the industrial sector in total greenhouse gas (GHG) emissions and resource consumption is well-known, and many industrial activities may have a negative environmental impact. The solution to decreasing the negative effects cannot be effective without the consideration of sustainable development. There are several methods for sustainability evaluation, such as tools based on products, processes, or plants besides supply chain or life cycle analysis, and there are different rating systems suggesting 80, 140, or more indicators for assessment. The critical point is the limits such as required techniques and budget in using all indicators for all factories in the beginning. Moreover, the weight of each indicator might change based on the selected alternative that it is not a fixed value and could change in a new case study. In this regard, to determine the impact and weight of different indicators in sustainable factories, a multi-layer Triangular Fuzzy Analytic Hierarchy Process (TFAHP) approach was developed, and the application of the method was described and verified. The defined layers are six; for each layer, the pairwise comparison matrix was developed, and the total aggregated score concerning the sustainability goal for each alternative was calculated that shows the Relative Importance Coefficient (RIC). The method is formulated in a way that allows adding the new indicators in all layers as the verification shows, and thus, there are no limits for using any green rating systems. Therefore, the presented approach by TFAHP would provide an additional tool toward the sustainable development of factories.

1. Introduction

In 2008, the total emitted CO2e (CO2 equivalent) from multiple sources was about 27 × 109 tones with a 37% share of electrical origin [1]. In 2016, the total emitted greenhouse gases (GHGs) had increased to about 49.3 × 10⁹ tones CO2e [2]. Carbon Dioxide (CO2) accounts for 76% of total GHGs, and about 65% of that comes from fossil fuel and industrial processes. Analysis of the GHG emissions by different sectors shows that the third one is Industry [3]. The analysis of GHGs by a source such as electrical origin cannot be practical without the consideration of sustainable developments since the footprint of other sections will change the values [4]. Furthermore, research shows that about 11% of total freshwater consumption is used by municipal, about 19% by industrial section, and 70% by agricultural activities [5]. It means that water consumption in the industrial sector is more than the municipal. There are many methods for sustainable water management that depend on the goal and can be different in each case study [6,7,8,9]. The combined effect of climate change and urbanization produces several negative environmental impacts, such as the urban heat island effect, urban flooding, and air pollution. In this context, a transition towards sustainable, smart, and resilient urban development seems necessary [10,11,12,13,14,15,16]. Sustainable development is a method that considers human development while simultaneously analyzing its impact [17]. The main concept of sustainable development is the development by consideration of the triple bottom line (TBL), including environmental, social, and economic aspects [18]. There are many methods for sustainability evaluation in the previous literature, such as tools based on product, process, or plants besides supply chain or life cycle analysis [19,20,21,22]. In 1999, the Global Reporting Initiative (GRI) provided a framework based on the TBL to assess the sustainability of companies which could be used to evaluate different types of industries with 81 indicators. However, various measuring units are required to collect a large amount of data [23]. In 2001, the UN Commission on Sustainable Development suggested 140 indicators to assess the progress of sustainable development [24]. Green rating systems are another sustainable development approach for factories, such as the Green Star Rating system in Australia, the LEED system by the U.S. Green Building Council (USGBC), and the ISO 50001 [25,26]. A different section of green rating for factories may contain many components. For example, energy management can be done in different sectors, including lighting and heating, ventilation, and air conditioning (HVAC) equipment utilization, equipment operation time, [25] and through different practices such as green roofs [27,28], zero-energy buildings (ZEBs), and nearly-zero energy buildings (NZEBs) [29].
The studies showed that multi-objective models could be used in the sustainable development of the industrial sector by considering most indicators [30]. Moreover, mathematical optimization methods can be used for all selected approaches [31,32]. However, one of the prevailing gaps in most of the previous frameworks about sustainable development is the absence of an aggregated method to assess the results [19]. Moreover, the strategies and indicators proposed by the academic sector, industrial sector, and policy-makers might be different [33].
To evaluate the indicators and to apply the most important indicator in the first stage toward sustainable factories, a comparison method is required, and the analytic hierarchy process (AHP) methodology is one of them [34,35]. Qualitative evaluations of the experts by Fuzzy logic can convert the qualitative judgments into evaluable numbers which allow the Fuzzy AHP to perform an extensive analysis and feasibility studies on existing projects [19,36]. Identifying and ranking strategies to implement green supply chain management using the analytical hierarchy process can help to increase efficiency and lower the cost [37]. For the analysis of complex multi-criteria decision-making problems, the AHP can be used as a reliable method to analyze different scenarios since it provides optimal solutions [38,39]. Moreover, many recent studies applied the AHP method successfully in manufacturing sectors [40,41].
According to the research reviews, there are many components and indices to be considered in sustainable factories. The meaning of sustainability is comprehensive and could include energy management, decreasing GHG emissions, reducing negative environmental impact, decreasing the use of raw materials, water resource management, social and economic development, and even the life cycle assessment (LCA). In the factories, sustainability also depends on the production line, which makes the analysis more complicated since there are many types of factories. There are many standards and guidelines for buildings, such as the NZEBs or green rating systems. However, one of the prevailing gaps in most of the previous frameworks of sustainable factories is the absence of an aggregated method for assessing the decisions or selecting the alternatives. In addition, the proposed indicators are different for the industrial sector and policy-makers besides the limits such as the required technique and budget which make it impossible to apply all the indices for all factories. Therefore, an assessment and ranking method based on the sustainability goal seems necessary. In this regard, in order to show the impact and weight of the different components in sustainable factories, a multi-layer AHP approach was developed, and the application of mathematical evaluation by the Triangular Fuzzy AHP method was described and verified. The developed method is formulated in a way that allows adding the new factors in each layer easily, and therefore, it is not limited to the elements in any particular green rating system or specific factories.

2. Materials and Methods

The studies show that by using the Fuzzy Analytical Hierarchy Process method, the sustainability factors can be formulated and the weighting system and priority scale can be developed [42]. Therefore, in this part, the base of the AHP method, Triangular Fuzzy Number, and the Triangular Fuzzy AHP were described.

2.1. AHP Method

Analytic Hierarchy Process (AHP) considers a set of evaluation criteria and alternative options to achieve the best decision [43]. The three main steps in the AHP are:
  • Calculation of the criteria weights;
  • Calculation of the matrix of assessment scores;
  • Ranking the options according to the weighted scores.

2.2. Triangular Fuzzy Number (TFN)

A fuzzy set M on a set X is a function M: X [0,1]. A type of fuzzy number that can better match with real-life applications is a triangular fuzzy number [44,45]. This type of fuzzy number has a triangle-shaped membership function, as shown in Figure 1.
The membership function of a triangular fuzzy m is as follows:
U m ( x ) = { 0 , x < l   o r   x > u , x l m l , l x m u x u m , m < x < u

2.3. Triangular Fuzzy AHP

The major scale of the Triangular Fuzzy AHP is presented in Table 1 and Figure 2.

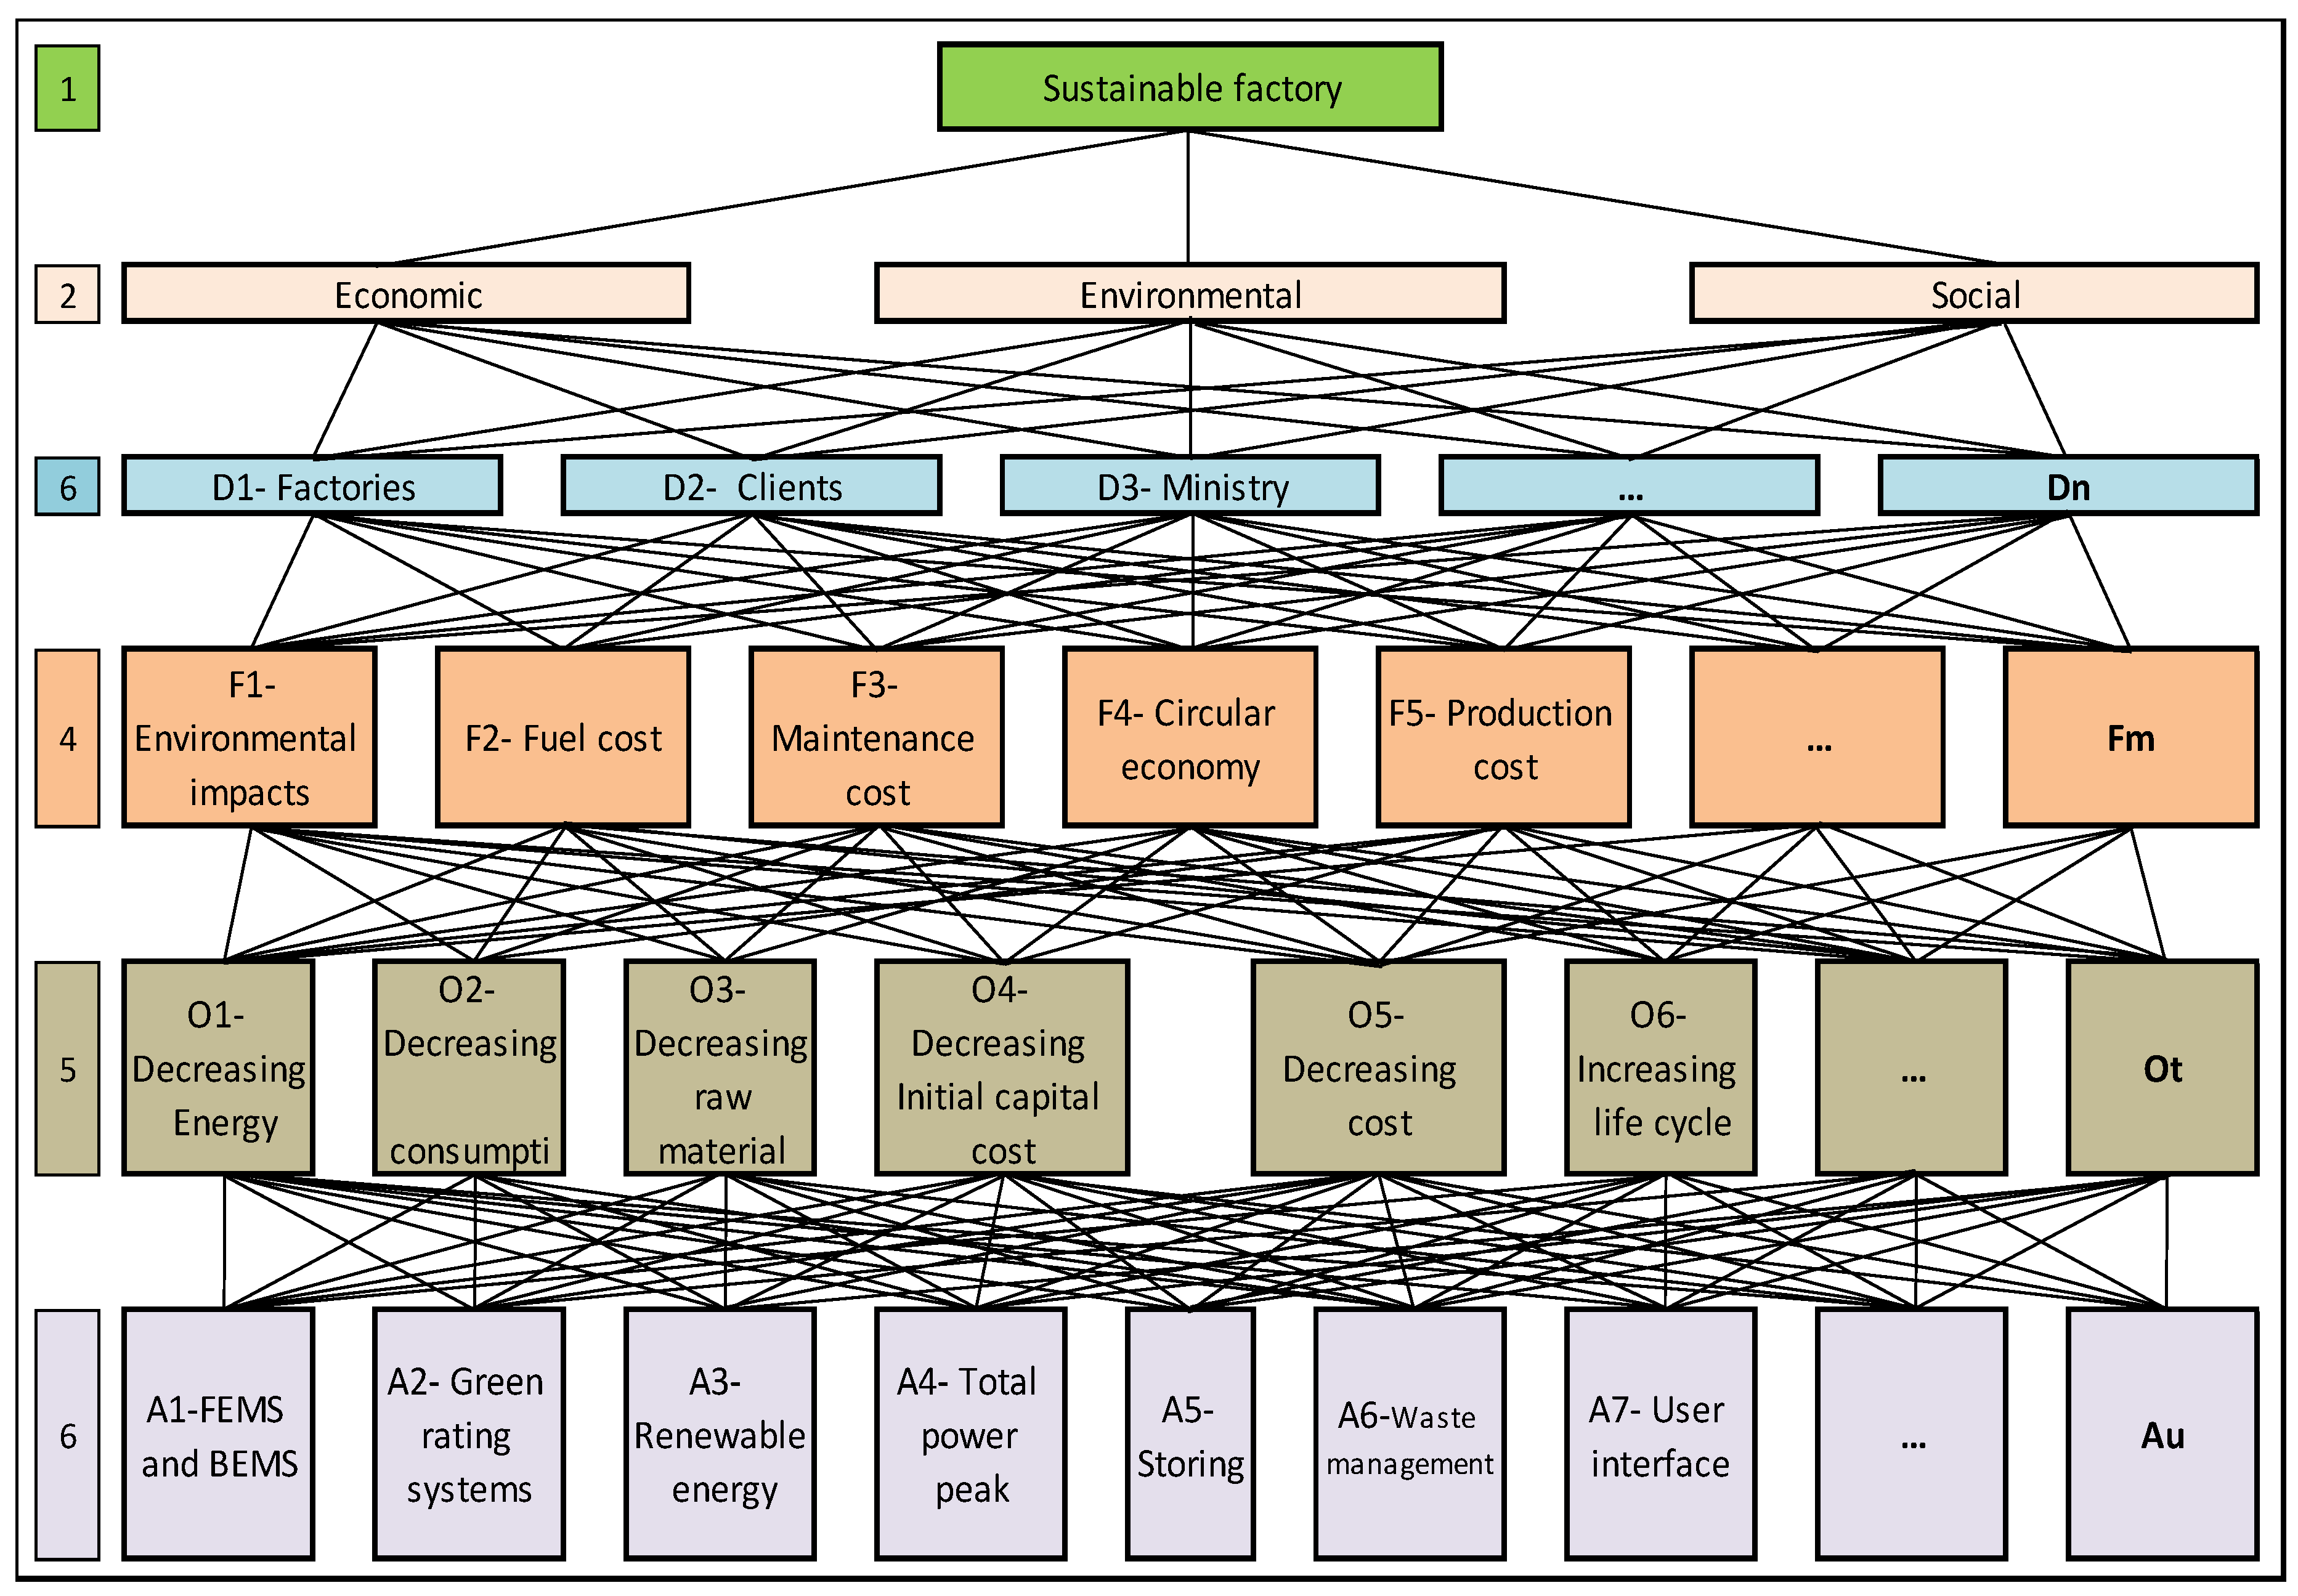
2.4. The Developed Multi-Layer AHP

The developed multi-layer AHP for sustainable factories is shown in Figure 3. The parameters and indices are based on sustainable development approaches such as different green rating systems and standards by considering the role of the decision-makers. As it can be seen, it is possible to add new factors and indices to each layer based on the factory type and production line that is necessary since there are many types of factories, each producing different products. In this regard, by this multi-layer method, it would be possible to rank the decisions based on their final weight according to the upper layer and according to the main goal that is sustainability.
The analytic hierarchy process (AHP) in the present paper consists of six levels as follows:
  • Level 1 (Goal): Sustainable Factory;
  • Level 2 (Criteria): C1) Economic, C2) Environmental, C3) Social;
  • Level 3 (Decision Makers, D1 to Dn): D1) Factories, D2) Clients, D3) Ministry, D4) International conventions, D5) Regional organizations… Dn;
  • Level 4 (Factors, F1 to Fm): F1) Environmental impacts, F2) Fuel cost, F3) Maintenance cost, F4) Circular economy, F5) Production cost, F6) Initial capital cost, F7) Life cycle GHGs … Fm;
  • Level 5 (Objectives, O1 to Ot): O1) Decreasing energy consumption, O2) Decreasing water consumption, O3) Decreasing the use of raw materials, O4) Decreasing initial capital cost, O5) Decreasing production cost, O6) Increasing life cycle, O7) Increasing the profits, O8) Decreasing Environment impacts … Ot;
  • Level 6 (Alternatives, A1 to Au): A1) Factory Energy Management System (FEMS) and Building Energy Management System (BEMS), A2) Green rating systems, A3) Renewable energy, A4) Total power peak, A5) Storing of productions, A6) Energy waste management, A7) User interface, A8) Direct and indirect energy flow, A9) water management, A10) Lid methods, A11) Reusing and recycling … Au.

3. Results

  • In this part, the TFAHP approach was formulated for the evaluation of sustainable factories. The developed method allows adding the new indicators to all layers, and thus there are no limits for using any unique green rating systems or standards that are vital for the industrial sector with different types of factories and products.
The assessment methods by the Fuzzy AHP is based on several main stages, including:
  • Normalized weight of components in each layer;
  • Pairwise comparison matrix of layers, under the correlated components in the upper layer;
  • Normalized weight of components, under the correlated components in the upper layer;
  • Total aggregated score concerning the sustainability goal;
  • Ranking of the alternatives according to the final score.

3.1. Computing the Pairwise Comparison Matrix for Criteria

The defined criteria are based on the triple bottom line of sustainable development mentioned in Level 2, and the pairwise comparison matrix (PCM) is as shown in Table 2.
Suppose in Table 2, v p , q = ( x p , q , y p , q , z p , q ) is the pairwise comparison of criteria p and q, then:
For   p q :   v q , p = v p , q 1 = ( 1 z p , q ,   1 y p , q ,   1 x p , q ) For   p = q :   v p , q = ( 1 , 1 , 1 ) .

3.2. Computing the Normalized Weight for Criteria

The normalized weight of criteria can be calculated in six steps as follows:
Step 1: Calculation of M:
M = ( M 1 , M 2 , M 3 ) = [ p = 1 3 q = 1 3 ( x p , q , y p , q , z p , q ) ] 1 .
Step 2: Calculation of Ap:
For   p = 1 ,   2 ,   3 :   A p = ( A 1 p , A 2 p , A 3 p ) = q = 1 3 ( x p , q , y p , q , z p , q ) .
Step 3: Calculation of Sp:
For   p = 1 ,   2 ,   3 :   S p = ( S 1 p , S 2 p , S 3 p ) = A p × M .
Step 4: Calculation of V   ( S p S q ) :
For   p ,   q = 1 , 2 ,   3 ,   p q   V   ( S p S q ) = S 3 p S 1 q ( S 3 p S 1 q ) ( S 2 q S 2 p ) .
Step 5: Calculation of W p :
For   p = 1 ,   2 ,   3 :   W p = min q = 1 ,   2 ,   3 , q p ( V   ( S p S q ) ) .
Step 6: Calculation of the normalized weight for all criteria W p :
For   p = 1 ,   2 ,   3 :   W p = W p p = 1 3 W p .
According to the calculated values, the normalized weight vector of criteria (W) can be presented as:
W = ( W 1 , W 2 , W 3 ) T ,
where: W i = Weight of ith (i = 1, 2, 3) component of Criteria.
By using these six steps, the initial normalized fuzzy weight of each component will be determined that can be used for Pairwise comparisons in the next stage.

3.3. Computing the Pairwise Comparison Matrix for Decision-Maker

The components of decision-makers are according to Level 3 from D1 to Dn, and PCM will be as presented in Table 3. The Pairwise comparison matrix for the component of each layer would be related to the correlated components in an upper layer, for example, the components of “Decision-Makers” depends on the components of “Criteria.”
Suppose in Table 3, v p , q i = ( x p , q i ,   y p , q i ,   z p , q i ) is the pairwise comparison of Decision-Maker p , q = D 1 ,   ,   D n , concerning the ith components of Criteria (i = 1, 2, 3), then:
For   p q :   v q , p i = ( v p , q i ) 1   and   For   p = q :   v p , q i = ( 1 , 1 , 1 ) .

3.4. Computing the Pairwise Comparison Matrix for Factors

The components of Factors is according to Level 4 from F1 to Fm, and PCM will be as shown in Table 4.
Suppose in Table 4, v p , q j = ( x p , q j ,   y p , q j ,   z p , q j ) is the pairwise comparison of Factors p , q = F 1 ,   ,   F m , concerning the jth component of Decision-Maker ( j = D 1 ,   ,   D n ), then:
For   p q :   v q , p j = ( v p , q j ) 1   and   For   p = q :   v p , q j = ( 1 , 1 , 1 ) .

3.5. Computing the Pairwise Comparison Matrix for Objectives

The components of Factors are according to Level 5 from O1 to Ot, and PCM will be as in Table 5.
Suppose in Table 5, v p , q k = ( x p ,   q k ,   y p , q k ,   z p , q k ) is the pairwise comparison of objectives p , q = O 1 ,   ,   O t , concerning the kth component of Factors ( k = F 1 ,   ,   F m ), then:
For   p q :   v q , p k = ( v p , q k ) 1   and   For   p = q :   v p , q k = ( 1 , 1 , 1 ) .

3.6. Computing the Pairwise Comparison Matrix for Alternatives

The components of the final level, which is the Alternatives, are according to Level 6 from A1 to Au, and PCM will be as in Table 6.
Suppose in Table 6, v p , q l = ( x p ,   q l ,   y p , q l ,   z p , q l ) is the pairwise comparison of alternatives p , q = A 1 ,   ,   A u , concerning the kth component of objectives ( l = O 1 ,   ,   O t ), then:
For   p q v q , p l = ( v p , q l ) 1   and   For   p = q :   v p , q l = ( 1 , 1 , 1 ) .

3.7. Calculation of Normalized Weight of Components in Each Layer

With an algorithm similar to the mentioned steps in Equations (3) to (8), the normalized weight of each layer can be calculated as follows:
• A: Normalized weight of components in Layer 2 (criteria):
Suppose W i = Weight of the ith component of criteria (i = 1, 2, 3), the weight vector of the component in Layer 2 will be:
W = ( W 1 , W 2 , W 3 ) T ;
• B: Normalized weight of components in Layer 3 (Decision-Maker):
Suppose W j i = Weight of the jth component of the decision-maker ( j = D 1 ,   ,   D n ), under the ith component of criteria (i = 1, 2, 3). The weight vector of the component in Layer 3 will be:
W i = ( W D 1 i ,   ,   W D n i ) T ;
• C: Normalized weight of components in Layer 4 (Factors):
Suppose W k j = Weight of the kth component of factors ( k = F 1 ,   ,   F m ), under the jth component of decision-maker ( j = D 1 ,   ,   D n ). The weight vector of the component in Layer 4 will be:
W   j = ( W F 1 j ,   ,   W F m j ) T ;
• D: Normalized weight of components in Layer 5 (Objectives):
Suppose W l k = Weight of the lth component of Objectives ( l = O 1 ,   ,   O t ), under the kth component of factors ( k = F 1 ,   ,   F m ). The weight vector of the component in Layer 5 will be:
W   k = ( W O 1 k ,   ,   W O t k ) T ;
• E: Normalized weight of components in Layer 6 (Alternatives):
Suppose W r l = Weight of the rth component of alternatives ( r = A 1 ,   ,   A u ), under the lth component of objectives ( l = O 1 ,   ,   O t ). The weight vector of the component in Layer 6 will be:
W l = ( W A 1 l ,   ,   W A u l ) T .

3.8. Total Aggregated Score Concerning the Sustainability Goal

The total aggregated score for each component of alternatives ( r = A 1 ,   ,   A u ) concerning the sustainability goal can be given by Equation (19):
( R I C ) r = i = 1 3 W i ( j = D 1 D n W j i ( k = F 1 F m W k j ( l = O 1 O t W l k W r l ) ) ) .
Therefore, the Relative Importance Coefficient (RIC) can determine the final rank of each alternative by consideration of all components in the upper layers. In this way, it would be possible to check the impact of each alternative (Layer 6) on the final goal that is sustainability (Layer 1) by consideration of different parameters and factors (Layers 2 to 5).

3.9. Verification of the Provided Method

The provided approach verified by an example with simplified elements, as shown in Figure 4.
The analysis, according to the formulated triangular fuzzy multi-layer AHP, was done and the results presented in Table 7, Table 8, Table 9, Table 10 and Table 11. In the verification part, some factors in each layer were selected, and using the developed formulations, the impact of chosen alternatives on the sustainability goal was evaluated. According to the main stages, it is necessary to provide and calculate the normalized weight of components in each layer, the pairwise comparison matrix for each component, under the correlated components in the upper layer, and finally, the total aggregated score concerning the sustainability goal.
Table 12 presents the Relative Importance Coefficient (RIC) of each alternative concerning the sustainability goals. According to the results of this table, alternative A1 (green rating systems) has the highest score for Sustainable Factories.
As it is clear from this part, the developed TFAHP can be applied in different case studies (different factories and production lines) with several layers and components that verify the method. In this regard, for each factory, the correlated components could be selected and added based on the local conditions and products, and then the specialized matrix for the selected factory and in localized conditions can be provided.

3.10. The Advantages of the Provided Assessment Approach

The comparison and advantages of the current approach in the consideration of the sustainability goal are presented in Table 13. The comparison was made with the presented method with four other approaches in the field of sustainable factories.

4. Discussion and Conclusions

In the industrial sector, sustainability depends not only on the construction of the factory but also on the production line, manufacturing, raw materials, and many other parameters which make the analysis of sustainability more complicated since there are many types of factories with different production. The analysis showed that there are many factors for sustainability evaluation of factories and even more than 140 indicators suggested in different green rating systems to assess the progress on sustainable development. In addition, the proposed indicators might be different by the industrial sector and policy-makers besides the limits such as the required technique and budget, which make it impossible to apply all the indices to all factories. To find out the best decision, the rank of each alternative can be useful, and the weight of them must be calculated according to the different objectives and sustainability factors, which is not a fixed value and might be different for a new factory with another production line.
In this research, a multi-layer Triangular Fuzzy Analytic Hierarchy Process (TFAHP) approach was developed for evaluation of the sustainability indicators in the factories with six layers, including Level 1: Goal, Level 2: Criteria, Level 3: Decision-Makers, Level 4: Factors, Level 5: Objectives, and Level 6: Alternatives. The approach was developed in a way that made it possible to add new elements and indices in each layer based on the factory type and production line that is vital for the industrial section with different kinds of factories and products. Then, the normalized weight of components in each layer, pairwise comparison matrix of layers under the correlated components in the upper layer, and the normalized weight of components under the correlated components in the upper layer were formulated that can make a comparison among the components. By the pairwise comparison, it would be possible to calculate the total aggregated score concerning the sustainability goal and by the Relative Importance Coefficient (RIC) rank concerning the alternatives accordingly. Therefore, the Relative Importance Coefficient (RIC) can determine the final rank of each alternative by considering all components in the upper layers. In this way, it would be possible to assess the impact of each alternative on the final goal that is sustainability by consideration of different parameters and factors such as the role of decision-makers or objectives.
For verification of the presented approach, an example with simplified elements was provided, then by use of the developed formulations, the normalized weight of components in each layer was calculated, and the pairwise comparison matrix for each layer was produced, and finally, the impact of chosen alternatives on the sustainability goal was evaluated.
In addition, a comparison of the method with four similar approaches in the field of sustainable factories shows the limits of those methods which mainly concern specific factories or products. However, one of the advantages of the provided approach is easy to add of the new indicators in all layers, as the verification showed, and thus, there are no limits for using any particular green rating systems or standards.
In conclusion, the presented analytical assessment approach by the Triangular Fuzzy AHP method will provide an additional tool toward the sustainable development of factories and can improve the previous studies of green factories. In this way, after gathering the required data in a new case study, the weighted rank of the indices and alternatives by the presented method would provide priority solutions. In addition, the method can be used to evaluate the existing project.

Recommendations

Since in each location and country, the standards and codes might be different, providing the basis of location-based software is suggested for future studies. In addition, the experience-based methods such as rough set theory can be joint to TFAHP to improve the judgment in future sustainability evaluation and thus is suggested for future studies.

Author Contributions

The author’s contributions in the paper are as follows: conceptualization, B.P. (Behrouz Pirouz), M.M., and N.A.; methodology, B.P. (Behrouz Pirouz), B.P. (Behzad Pirouz), and M.T.; formal analysis, B.P. (Behrouz Pirouz), S.A.P., and B.P. (Behzad Pirouz); investigation, S.A.P., and M.T.; writing—original draft preparation, B.P. (Behrouz Pirouz), and S.A.P.; writing—review and editing, B.P. (Behrouz Pirouz) and B.P. (Behrouz Pirouz); supervision: M.M. and N.A. All authors have read and agreed to the published version of the manuscript.

Funding

This research received no external funding.

Conflicts of Interest

The authors declare no conflict of interest.

References

  1. International Energy Agency, Energy Technology Perspectives. 2017. Available online: http://www.iea.org/ (accessed on 28 October 2019).
  2. Olivier, J.G.J.; Schure, K.M.; Peters, J. Trends in Global CO2 and Total Greenhouse Gas 2017 Report; PBL Netherlands Environment Assessment Agency: Den Haag, The Netherlands, 2017. [Google Scholar]
  3. Ritchie, H.; Roser, M. CO2 and Greenhouse Gas Emissions. Our World Data 2018. Available online: https://ourworldindata.org/ (accessed on 21 October 2019).
  4. Pirouz, B.; Maiolo, M. The role of power consumption and type of air conditioner in direct and indirect water consumption. J. Sustain. Dev. Energy Water Environ. Syst. 2018, 6, 665–673. [Google Scholar] [CrossRef] [Green Version]
  5. Shiklomanov, I. World fresh water resources, Water in Crisis: A Guide to the World’s Fresh Water Resources; Oxford University Press: New York, NY, USA, 1993; pp. 13–24. [Google Scholar]
  6. Maiolo, M.; Carini, M.; Capano, G.; Piro, P. Synthetic sustainability index (SSI) based on life cycle assessment approach of low impact development in the Mediterranean area. Cogent Eng. 2017, 4, 1410272. [Google Scholar] [CrossRef]
  7. Piro, P.; Carbone, M.; Morimanno, F.; Palermo, S.A. Simple flowmeter device for LID systems: From laboratory procedure to full-scale implementation. Flow Meas. Instrum. 2019, 65, 240–249. [Google Scholar] [CrossRef]
  8. Carbone, M.; Turco, M.; Brunetti, G.; Piro, P. A Cumulative Rainfall Function for Subhourly Design Storm in Mediterranean Urban Areas. Adv. Meteorol. 2015. [Google Scholar] [CrossRef] [Green Version]
  9. Kates, R.W.; Parris, T.M.; Leiserowitz, A.A. What is sustainable development? Goals, indicators, values, and practice. Environment 2005, 47, 8–21. [Google Scholar]
  10. Palermo, S.A.; Zischg, J.; Sitzenfrei, R.; Rauch, W.; Piro, P. Parameter Sensitivity of a Microscale Hydrodynamic Model. In New Trends in Urban Drainage Modelling. UDM 2018; Mannina, G., Ed.; Green Energy and Technology; Springer: Cham, Switzerland, 2019; pp. 982–987. [Google Scholar] [CrossRef]
  11. Oberascher, M.; Zischg, J.; Palermo, S.A.; Kinzel, C.; Rauch, W.; Sitzenfrei, R. Smart Rain Barrels: Advanced LID Management Through Measurement and Control. In New Trends in Urban Drainage Modelling. UDM 2018; Mannina, G., Ed.; Green Energy and Technology; Springer: Cham, Switzerland, 2019; pp. 777–782. [Google Scholar] [CrossRef]
  12. Giordano, A.; Spezzano, G.; Vinci, A.; Garofalo, G.; Piro, P. A Cyber-Physical System for Distributed Real-Time Control of Urban Drainage Networks in Smart Cities. In Internet and Distributed Computing Systems. IDCS 2014; Fortino, G., Di Fatta, G., Li, W., Ochoa, S., Cuzzocrea, A., Pathan, M., Eds.; Lecture Notes in Computer Science; Springer: Cham, Switzerland, 2014; Volume 98, pp. 87–98. [Google Scholar] [CrossRef]
  13. Piro, P.; Turco, M.; Palermo, S.A.; Principato, F.; Brunetti, G. A Comprehensive Approach to Stormwater Management Problems in the Next Generation Drainage Networks. In The Internet of Things for Smart Urban Ecosystems; Cicirelli, F., Guerrieri, A., Mastroianni, C., Spezzano, G., Vinci, A., Eds.; Internet of Things (Technology, Communications and Computing); Springer: Cham, Switzerland, 2019; pp. 275–304. [Google Scholar] [CrossRef]
  14. Turco, M.; Brunetti, G.; Palermo, S.A.; Capano, G.; Grossi, G.; Maiolo, M.; Piro, P. On the environmental benefits of a permeable pavement: metals potential removal efficiency and Life Cycle Assessment. Urban Water J. 2020, 1–9. [Google Scholar] [CrossRef]
  15. Palermo, S.A.; Turco, M.; Principato, F.; Piro, P. Hydrological effectiveness of an extensive green roof in Mediterranean climate. Water 2019, 11, 1378. [Google Scholar] [CrossRef] [Green Version]
  16. Turco, M.; Brunetti, G.; Carbone, M.; Piro, P. Modelling the hydraulic behaviour of permeable pavements through a reservoir element model. In Proceedings of the International Multidisciplinary Scientific GeoConference Surveying Geology and Mining Ecology Management, Sofia, Bulgaria, 28 June–7 July 2018; Volume 18, pp. 507–514, Fasc. 3.1. [Google Scholar] [CrossRef]
  17. Blewitt, J. Understanding Sustainable Development; Routledge: Abingdon upon Thames, UK, 2012; ISBN 9781849773645. [Google Scholar]
  18. Jayal, A.D.; Badurdeen, F.; Dillon, O.W.; Jawahir, I.S. Sustainable manufacturing: Modeling and optimization challenges at the product, process and system levels. CIRP J. Manuf. Sci. Technol. 2010, 2, 144–152. [Google Scholar] [CrossRef]
  19. Jayawickrama, H.M.M.M.; Kulatunga, A.K.; Mathavan, S. Fuzzy AHP based Plant Sustainability Evaluation Method. Procedia Manuf. 2017, 8, 571–578. [Google Scholar] [CrossRef]
  20. Chen, D.; Schudeleit, T.; Posselt, G.; Thiede, S. A state-of-the-art review and evaluation of tools for factory sustainability assessment. Procedia CIRP 2013, 9, 85–90. [Google Scholar] [CrossRef] [Green Version]
  21. Noori, A.M.; Mikaeil, R.; Mokhtarian, M.; Haghshenas, S.S.; Foroughi, M. Feasibility of Intelligent Models for Prediction of Utilization Factor of TBM. Geotech. Geol. Eng. 2020, 1–19. [Google Scholar] [CrossRef]
  22. Mehdi Hosseini, S.; Ataei, M.; Khalokakaei, R.; Mikaeil, R.; Shaffiee Haghshenas, S. Study of the effect of the cooling and lubricant fluid on the cutting performance of dimension stone through artificial intelligence models. Eng. Sci. Technol. Int. J. 2019. [Google Scholar] [CrossRef]
  23. Withers, S.; Demediuk, P. Sustainability Reporting Guidelines. Int. J. Sustain. Econ. Soc. Cult. Context 2014, 9, 44–60. [Google Scholar] [CrossRef]
  24. Singh, R.K.; Murty, H.R.; Gupta, S.K.; Dikshit, A.K. An overview of sustainability assessment methodologies. Ecol. Indic. 2009, 9, 189–212. [Google Scholar] [CrossRef]
  25. ISO. ISO 50001:2011—Energy Management Systems: Requirements with Guidance for Use; ISO: Geneva, Switzerland, 2011. [Google Scholar]
  26. Green Star rating, Multi-Unit Residential v1. 2014. Available online: https://www.gbca.org.au/green-star/ (accessed on 20 October 2019).
  27. Maiolo, M.; Pirouz, B.; Bruno, R.; Palermo, S.A.; Arcuri, N.; Piro, P. The role of the extensive green roofs on decreasing building energy consumption in the mediterranean climate. Sustainability 2020, 12, 359. [Google Scholar] [CrossRef] [Green Version]
  28. Bevilacqua, P.; Bruno, R.; Arcuri, N. Green roofs in a Mediterranean climate: Energy performances based on in-situ experimental data. Renew. Energy 2020. [Google Scholar] [CrossRef]
  29. Bruno, R.; Bevilacqua, P.; Cuconati, T.; Arcuri, N. Energy evaluations of an innovative multi-storey wooden near Zero Energy Building designed for Mediterranean areas. Appl. Energy 2019, 238, 929–941. [Google Scholar] [CrossRef]
  30. Pirouz, B.; Arcuri, N.; Maiolo, M.; Talarico, V.C.; Piro, P. A new multi-objective dynamic model to close the gaps in sustainable development of industrial sector. IOP Conf. Ser. Earth Environ. Sci. 2020, 410, 012074. [Google Scholar] [CrossRef] [Green Version]
  31. Pirouz, B.; Palermo, S.A.; Turco, M.; Piro, P. New Mathematical Optimization Approaches for LID Systems. In Numerical Computations: Theory and Algorithms. NUMTA 2019; Sergeyev, Y., Kvasov, D., Eds.; Lecture Notes in Computer Science; Springer: Cham, Switzerland, 2020; Volume 11973, pp. 583–595. [Google Scholar] [CrossRef]
  32. Palermo, S.A.; Talarico, V.C.; Pirouz, B. Optimizing Rainwater Harvesting Systems for Non-potable Water Uses and Surface Runoff Mitigation. In Numerical Computations: Theory and Algorithms. NUMTA 2019; Sergeyev, Y., Kvasov, D., Eds.; Lecture Notes in Computer Science; Springer: Cham, Switzerland, 2020; Volume 11973, pp. 570–582. [Google Scholar] [CrossRef]
  33. May, G.; Stahl, B.; Taisch, M. Energy management in manufacturing: Toward eco-factories of the future—A focus group study. Appl. Energy 2016, 164, 628–638. [Google Scholar] [CrossRef]
  34. Wong, J.K.W.; Li, H. Application of the analytic hierarchy process (AHP) in multi-criteria analysis of the selection of intelligent building systems. Build. Environ. 2008, 43, 108–125. [Google Scholar] [CrossRef]
  35. Zarghami, E.; Azemati, H.; Fatourehchi, D.; Karamloo, M. Customizing well-known sustainability assessment tools for Iranian residential buildings using Fuzzy Analytic Hierarchy Process. Build. Environ. 2018, 128, 107–128. [Google Scholar] [CrossRef]
  36. Shirani Faradonbeh, R.; Shaffiee Haghshenas, S.; Taheri, A.; Mikaeil, R. Application of self-organizing map and fuzzy c-mean techniques for rockburst clustering in deep underground projects. Neural Comput. Appl. 2019. [Google Scholar] [CrossRef]
  37. Luthra, S.; Garg, D.; Haleem, A. Identifying and ranking of strategies to implement green supply chain management in Indian manufacturing industry using analytical hierarchy process. J. Ind. Eng. Manag. 2013, 6, 930–962. [Google Scholar] [CrossRef] [Green Version]
  38. Lee, D.M.; Drake, P.R. A portfolio model for component purchasing strategy and the case study of two South Korean elevator manufacturers. Int. J. Prod. Res. 2010, 48, 6651–6682. [Google Scholar] [CrossRef] [Green Version]
  39. Ishizaka, A.; Pearman, C.; Nemery, P. AHPSort: An AHP-based method for sorting problems. Int. J. Prod. Res. 2012, 50, 4767–4784. [Google Scholar] [CrossRef]
  40. Shankar, K.M.; Kumar, P.U.; Kannan, D. Analyzing the drivers of advanced sustainable manufacturing system using AHP approach. Sustainability 2016, 8, 824. [Google Scholar] [CrossRef] [Green Version]
  41. Song, Y.; Li, J.; Wang, J.; Hao, S.; Zhu, N.; Lin, Z. Multi-criteria approach to passive space design in buildings: Impact of courtyard spaces on public buildings in cold climates. Build. Environ. 2015, 89, 295–307. [Google Scholar] [CrossRef]
  42. Javiri, F.; Aminullah, A.; Triwiyono, A. Assessment system of condition of typical building infrastructure using fuzzy analitical hierarchy procces (FAHP) method. In Proceedings of the MATEC Web of Conferences; EDP Sciences: Les Ulis, France, 2019; Volume 258. [Google Scholar] [CrossRef]
  43. Saaty, T.L. The Analytic Hierarchy Process; McGraw-Hill: New York, NY, USA, 1980. [Google Scholar]
  44. Akyar, E.; Akyar, H.; DÜzce, S. Al A new method for ranking triangular fuzzy numbers. Int. J. Uncertain. Fuzziness Knowl.-Based Syst. 2012, 20, 729–740. [Google Scholar] [CrossRef]
  45. Büyüközkan, G.; Kahraman, C.; Ruan, D. A fuzzy multi-criteria decision approach for software development strategy selection. Int. J. Gen. Syst. 2004, 33, 259–280. [Google Scholar] [CrossRef]
  46. Saaty, T.L.; Vergas, L.G. Models, Methods, Concepts & Applications of the Analytic Hierarchy Process; Springer: Cham, Switzerland, 2012; ISBN 978-1-4614-3597-6. [Google Scholar] [CrossRef] [Green Version]
  47. Saaty, T.L. Decision making with the analytic hierarchy process. Int. J. Serv. Sci. 2008, 1, 83–98. [Google Scholar] [CrossRef] [Green Version]
  48. Chen, Z.; Bidanda, B. Sustainable manufacturing production-inventory decision of multiple factories with JIT logistics, component recovery and emission control. Transp. Res. Part E Logist. Transp. Rev. 2019, 128, 356–383. [Google Scholar] [CrossRef]
  49. Terkaj, W.; Danza, L.; Devitofrancesco, A.; Gagliardo, S.; Ghellere, M.; Giannini, F.; Monti, M.; Pedrielli, G.; Sacco, M.; Salamone, F. A semantic framework for sustainable factories. Procedia CIRP 2014, 17, 547–552. [Google Scholar] [CrossRef] [Green Version]
  50. Lu, T.; Gupta, A.; Jayal, A.D.; Badurdeen, F.; Feng, S.C.; Dillon, O.W.; Jawahir, I.S. A Framework of Product and Process Metrics for Sustainable Manufacturing. In Advances in Sustainable Manufacturing; Springer: Berlin/Heidelberg, Germany, 2011. [Google Scholar]
Figure 1. Triangular Fuzzy Number [46].
Sustainability 12 01841 g001
Figure 2. Triangular Fuzzy AHP Scale [47].
Sustainability 12 01841 g002
Figure 3. The developed multi-layer AHP for sustainable factories in current research.
Sustainability 12 01841 g003
Figure 4. The developed example to verify the method.
Sustainability 12 01841 g004
Table 1. The fundamental scale in the analytic hierarchy process (AHP) and triangular fuzzy analytic hierarchy process (TFAHP) [42,47]. TFN: triangular fuzzy number.
Linguistic Scales for the ImportanceTFN ScaleTFN Reciprocal Scale
Just equal(1,1,1)(1,1,1)
Equal importance(1/2,1,3/2)(2/3,1,2)
Moderate importance(1,3/2,2)(1/2,2/3,1)
Strong importance(3/2,2,5/2)(2/5,1/2,2/3)
Very strong importance(2,5/2,3)(1/3,2/5,1/2)
Extreme importance(5/2,3,7/2)(2/7,1/3,2/5)
Table 2. Pairwise comparison matrix of the ith component of Criteria (i = 1, 2, 3).
EconomicEnvironmentalSocial
Economic ( x 1 ,   1 , y 1 ,   1 , z 1 ,   1 ) ( x 1 ,   2 , y 1 ,   2 , z 1 ,   2 ) ( x 1 ,   3 , y 1 ,   3 , z 1 ,   3 )
Environmental ( x 2 ,   1 , y 2 ,   1 , z 2 ,   1 ) ( x 2 ,   2 , y 2 ,   2 , z 2 ,   2 ) ( x 2 ,   3 , y 2 ,   3 , z 2 ,   3 )
Social ( x 3 ,   1 , y 3 ,   1 , z 3 ,   1 ) ( x 3 ,   2 , y 3 ,   2 , z 3 ,   2 ) ( x 3 ,   3 , y 3 ,   3 , z 3 ,   3 )
Table 3. Pairwise comparison matrix of the jth component of Decision-Maker ( j = D 1 ,   ,   D n ), concerning the ith component of Criteria (i = 1, 2, 3).
j D 1 D n
D 1 ( x D 1 ,   D 1 i ,   y D 1 ,   D 1 i ,   z D 1 ,   D 1 i ) ( x D 1 ,   D n i ,   y D 1 ,   D n i ,   z D 1 ,   D n i )
j = D 2 ,   D n 1
D n ( x D n ,   D 1 i ,   y D n ,   D 1 i ,   z D n ,   D 1 i ) ( x D n ,   D n i ,   y D n ,   D n i ,   z D n ,   D n i )
Table 4. Pairwise comparison matrix of the kth component of Factors ( k = F 1 ,   ,   F m ), under the jth component of Decision-Makers ( j = D 1 ,   ,   D n ).
k F 1 F m
F 1 ( x F 1 ,   F 1 j ,   y F 1 ,   F 1 j ,   z F 1 ,   F 1 j ) ( x F 1 ,   F m j ,   y F 1 ,   F m j ,   z F 1 ,   F m j )
k = F 2 ,   ,   F m 1
F m ( x F m ,   F 1 j ,   y F m ,   F 1 j ,   z F m ,   F 1 j ) ( x F m ,   F m j ,   y F m ,   F m j ,   z F m ,   F m j )
Table 5. Pairwise Comparison of the lth component of objectives ( l = O 1 ,   ,   O t ), under the kth component of Factors ( k = F 1 ,   ,   F m ).
l O 1 O t
O 1 ( x O 1 ,   O 1 k ,   y O 1 ,   O 1 k ,   z O 1 ,   O 1 k ) ( x O 1 ,   O t k ,   y O 1 ,   O t k ,   z O 1 ,   O t k )
l = O 2 ,   ,   O t 1
O t ( x O t ,   O 1 k ,   y O t ,   O 1 k ,   z O t ,   O 1 k ) ( x O t ,   O t k ,   y O t ,   O t k ,   z O t ,   O t k )
Table 6. Pairwise Comparison of the rth component of alternatives ( r = A 1 ,   ,   A u ), under the lth component of objectives ( l = O 1 ,   ,   O t ).
r A 1 A u
A 1 ( x A 1 ,   A 1 l ,   y A 1 ,   A 1 l ,   z A 1 ,   A 1 l ) ( x A 1 ,   A u l ,   y A 1 ,   A u l ,   z A 1 ,   A u l )
r = A 2 ,   ,   A u 1
A u ( x A u ,   A 1 l ,   y A u ,   A 1 l ,   z A u ,   A 1 l ) ( x A u ,   A u l ,   y A u ,   A u l ,   z A u ,   A u l )
Table 7. Pairwise comparison matrix of the components of Criteria.
iEconomicEnvironmentalSocialWeight
Economic(1,1,1)(1,3/2,2)(1,3/2,2)0.45
Environmental(1/2,2/3,1)(1,1,1)(1,3/2,2)0.35
Social(1/2,2/3,1)(1/2,2/3,1)(1,1,1)0.21
Table 8. Pairwise comparison matrix of the components of Decision-Maker concerning the component of Criteria.
Component of CriteriajD1-FactoryD2-ClientsWeight
EconomicD1-Factory(1,1,1)(2,5/2,3)1
D2-Clients(1/3,2/5,1/2)(1,1,1)0
EnvironmentalD1-Factory(1,1,1)(2,5/2,3)1
D2-Clients(1/3,2/5,1/2)(1,1,1)0
SocialD1-Factory(1,1,1)(1/2,1,3/2)0.5
D2-Clients(2/3,1,2)(1,1,1)0.5
Table 9. Pairwise comparison matrix of the components of Factors concerning the component of Decision-Makers.
Component of Decision-MakerskF1-Environmental ImpactsF-2 Maintenance CostWeight
D1F1-Environmental impacts(1,1,1)(2/5,1/2,2/3)0
F-2 Maintenance cost(3/2,2,5/2)(1,1,1)1
D2F1-Environmental impacts(1,1,1)(2,5/2,3)1
F-2 Maintenance cost(1/3,2/5,1/2)(1,1,1)0
Table 10. Pairwise Comparison of the components of objectives, under the component of Factors.
Component of FactorslO1-Decreasing EnergyO2-Decreasing Raw MaterialO3-Decreasing Production CostO4-Increasing Life CycleWeight
F1O1-Decreasing Energy(1,1,1)(1/2,1,3/2)(2,5/2,3)(1,3/2,2)0.38
O2-Decreasing raw material(2/3,1,2)(1,1,1)(3/2,2,5/2)(1,3/2,2)0.35
O3-Decreasing production cost(1/3,2/5,1/2)(2/5,1/2,2/3)(1,1,1)(2/5,1/2,2/3)0.01
O4-Increasing life cycle(1/2,2/3,1)(1/2,2/3,1)(3/2,2,5/2)(1,1,1)0.26
F2O1-Decreasing Energy(1,1,1)(1/2,1,3/2)(1/2,2/3,1)(1/2,2/3,1)0.19
O2-Decreasing raw material(2/3,1,2)(1,1,1)(1/2,1,3/2)(1,1,1)0.25
O3-Decreasing production cost(1,3/2,2)(2/3,1,2)(1,1,1)(1,1,1)0.28
O4-Increasing life cycle(1,3/2,2)(1,1,1)(1,1,1)(1,1,1)0.28
Table 11. Pairwise Comparison of the component of alternatives under the component of objectives.
Component of ObjectivesrA1-Green Rating SystemsA2-Decrease of Total Power PeakA3-Creating User InterfaceWeight
O1A1-Green rating systems(1,1,1)-(3/2,2,5/2)1
A3-Creating user interface(2/5,1/2,2/3)-(1,1,1)0
O2A1-Green rating systems(1,1,1)-(1,3/2,2)0.68
A3-Creating user interface(1/2,2/3,1)-(1,1,1)0.32
O3A1-Green rating systems(1,1,1)(1,3/2,2)-0.68
A2-Decrease of total power peak(1/2,2/3,1)(1,1,1)-0.32
O4A3-Creating user interface--(1,1,1)1
Table 12. The Relative Importance Coefficient (RIC) of alternatives concerning the sustainability goal.
AlternativesRPS
A1-Green rating systems0.62
A2-Decrease of total power peak0.03
A3-Creating user interface0.37
Table 13. The comparisons of the other techniques with current approach concerning the sustainability goal.
MethodSustainabilityMain Focus ParametersLimits
SocialEconomicEnvironment
Current approach (TFAHP)In 6 levels tried to consider all correlated factors in Sustainability of factoriesNo limit in adding new parameters
Advanced Sustainable
Manufacturing System Using AHP Approach [40]
Based on 15 parameters such as; Quality
Market capabilities
Financial benefit
Green innovation
The method limited to 15 defined criteria and the role of decision-makers and objectives missed in the evaluation.
The production-inventory decision of multiple factories
JIT logistics (Just-in-Time) [48]
xResource recycling and emission reduction. Optimization based on minimum cost and minimum emission.New modeling must be done for optimizing further case studies and is not a general assessment.
Sustainable Factory Semantic Framework [49]xEnergy and Environmental.The role of many factors missed according to the main focuses.
Product and Process Metrics for Sustainable Manufacturing [50]Correlated parameters in product and process metrics.The role of decision-makers missed in the evaluation.

