Article

Spatial Dimension of the Employment Market Exposition to Digitalisation—The Case of Austria

Institute of Spatial Planning, Environmental Planning and Land Rearrangement, University of Natural Resources and Life Sciences Vienna, Peter-Jordan-Strasse 82, 1190 Vienna, Austria
*
Author to whom correspondence should be addressed.
Sustainability 2020, 12(5), 1852; https://doi.org/10.3390/su12051852
Submission received: 9 December 2019 / Revised: 26 February 2020 / Accepted: 27 February 2020 / Published: 1 March 2020

Abstract

:
Digitalisation, referred to as the fourth industrial revolution, is gradually becoming part of all areas of life. The progressing digitalisation inspires new business models, restructures production processes and provides new revenue and value-producing opportunities. Simultaneously jobs are becoming abdicable and livelihoods can get threatened. To analyse the spatial context of the susceptibility of regional labour markets to 4.0 technology in Austria, the occupation-based assessment of digitalisation probability was projected on the industry standard classification and linked to the statistical employee data at the municipal level. The outcomes reveal to what extent the economic sections and divisions are exposed to digitalisation. Results representing spatial distribution reveal that digitalisation risks cannot be explicitly assigned to certain spatial structures or localities. Still, it can be stated that urban areas and small towns are relatively less exposed to disappearing of existing jobs. Municipalities with the highest vulnerability to labour replaceability are located mainly in rural areas. The discussion focuses on regional resilience, social vulnerability and possible development paths for different frameworks and spatial context of consequences. The study emphasizes the importance of digitalisation processes for regional development and presents an approach of analysing their territorial dimensions.

1. Introduction

Digitalisation describes the process of integrating digital technologies into business as well as everyday life. It changes the economy, creates new ways for generating revenue, opens up possibilities that did not exist without networked automation [1,2]. The development of new business models and restructuring of production processes as a consequence of digital transformation and its disruptive occurrences like Internet of Things, internet of people and internet of services are recognized as the fourth industrial revolution [3]. The first Industrial Revolution mechanized the production by use of water and steam power. The second introduced mass production thanks to the use of electric power. Production automation by means of electronics and information technology resulted in the third industrial revolution. Industry 4.0 is characterized through the digital networked access to and between things, customers and services. The computerisation of reality together with artificial intelligence leads to a blurring of borders between physical and cyber realities. It changes the industry, business and whole economic system and affects the way we learn and how we organize our work and private lives [4,5,6].
Technological development enables networked machines, computers and algorithms to take over anew considerable parts of work currently done by humans. It transforms the tasks needed to be performed to complete the work and the work processes. A demand for new work that has never been needed before is being created [3,7,8,9,10]. The development of digital technologies and the increasing internetworking of the past decades have already significantly changed the economy and business models. The significance of distance has changed, it is less and less considered to be a barrier for cooperation or delivery of goods and services. Changed accessibility opens up new markets for the companies and at the same time makes more goods and services available to the consumers. Digitalisation stimulates further development, demanding more innovative approaches in order to be capable of actively participating and shaping the digital transformation. It influences the expectations for the competencies of both the employers and employees [11,12]. The projections on the future demand for knowledge and skills reveal that digital technology is more likely to displace primarily routinized work than low-skilled work [13], and therefore can be the first revolution that takes away middle-class jobs. Consequently, it can lead to the point where the worse jobs, not only in terms of income but more demanding physically and less safe, are left for humans [14,15]. In the past substitution and abandonment of tasks have normally been accompanied by the continuous adjustment and emergence of other economic activities and tasks [16]. Although these processes take place concurrently, it is also evident that new digital technologies are observed to have a potentially positive influence on employment in the long-term, but short-term consequences are rather negative [17].
As for the emerging professional activities on a country or regional scale, only vague presumptions are possible, though the dimension of substitutability potential of humans through new digital technologies can be assessed based on the statistical data on the current structure of the labour market and has already been done by a number of studies. It is recognised that by 2035 47% of total U.S. employment is at risk of being taken over by computers and algorithms [18]. Considering all paid work activities executed by people nowadays on a global scale, 49% have the potential to be automated by currently known technologies [19]. The studies for Austria and Germany indicate the range of 10% to 40% of employees being directly affected by high digitalisation risk [20,21].
For most people a job is necessary to generate a financial basis for living, provide development perspectives and create opportunities to participate in social life. From the perspective of the spatial planning sciences, fulfilling these basic needs of living is considered to be one of the basic functions of a regional system [22,23]. The described developments—both positive and negative—influence the society [24] and consequently may affect the associated spatial systems and their developments (the infrastructure, connections, residential areas, workplaces, etc.). The already existing spatial disparities in distribution of human and nonhuman resources lead to undesired inequalities in living conditions [25,26]. Digital technology 4.0 is theoretically available everywhere, independent of other resources, as far as appropriate high-speed internet connections and the capacity of adaptation are locally provided.
The goal of this study is to investigate local and regional spatial patterns based on the existing studies about labour market effects of digitalisation in the example of Austria. This study aims to assess the exposition of the employment market to digitalisation in Austrian municipalities with a time horizon of 20 years. The study is grounded in spatial analysis and planning, and therefore, deals with spatial effects of digitalisation. It is not an aim to question existing economic studies on digitalisation effects, but to take them for granted and examine the spatial distribution of digitalisation effects in the light of sustainable development. Therefore, we address sustainable spatial planning, which aims at consciously planning certain spatial structures as preconditions for the economic, social, and cultural needs of the population, the free development of personalities in society, and the protection of the environment and conservation of nature. These objectives are, for instance, stated in Section 1 of the Upper Austrian Spatial Planning Act. In spatial planning, this value base is related to certain planning principles that include the balancing of regional disparities [27], polycentric regional development (decentralized concentration and transit-oriented development), mixed-use, appropriately dense, compact spatial fabrics in cities, towns and villages based on the principle of nearness and oriented on public transport, walking and cycling [28]. If a certain environmental, social, or economic development acts as a driver for change, the planning principles have to be adjusted in concrete local and regional planning situations and processes. As already stated, the revolution of the labour market can be at the same time beneficial and disadvantageous. Therefore, this study aims at providing a knowledge base to integrate digitalisation in sustainable spatial planning by, for the first time, trying to estimate the exposition of labour markets to digitalisation on a municipal scale in order to show which dynamics and transformation needs for society might arise and to give hints which spatial frameworks should be applied in order to enable this transformation to be (spatially) sustainable. The results map reveals the spatial distribution of digitalisation risks for the labour market on the municipal level. The findings answer the questions of (1) whether there are any recognizable spatial patterns of digitalisation risk; and (2) whether this technological innovation contributes to convergent regional development or the deepening of existing or emergence of new inequalities.
The rapid digitalisation not only raises questions concerning the employment rates directly. There are differences in ability to cope with the adverse effects of a change, depending on the conditions of individuals or communities [15]. The differences in the susceptibility to be harmed are embedded in the concept of social vulnerability [29,30]. A deterioration of system functions happens due to its sensitivity to negative effects of a stress to which the system is exposed and its lack of adaptive capacity [31,32]. Exposition refers to the intensity and duration of the threatening environmental, economic, or social change. Sensitivity in some approaches, combined with exposure, represents the degree to which a system loses its functions due to external or internal disturbance. Adaptive capacity or capacity to respond is also considered to be a component of resilience [33] and a means to survive the disturbance in the short-term and restructure by implementing sustainable adjustments with a long-term time perspective [31,34,35]. Social vulnerability is related to economic, demographic, and housing conditions [30]. The most relevant factors increasing vulnerability refer to limitations in access to resources (natural resources, knowledge, information, and technology); insufficient access to representation and political power; lack of social strength, capital, and networks; a high share of socially dependent populations; insufficient provision of functional infrastructure; lack of preparedness, institutions, and training [30,36,37]. The geographical distribution of social vulnerability is linked with spatial disparities [38]. The social impact depends on where the changes are occurring and differs regionally. More understanding of the origin and distribution of different aspects of spatial inequalities helps to anticipate the disruptions related to digitalisation. The structural transformation of the labour market can change the living conditions for better or for worse, reducing or deepening spatial disparities. The real concern of inequality regards not so much the labour hours, but the distribution of income, wealth, and leisure quality. Decision makers can be supported in addressing the most vulnerable areas and susceptible social groups [30]. The identification of the spatial distribution of the exposition to digitalisation allows active support of the affected societies, increasing the ability to cope with the impact of the technological disruption in a sustainable way.

2. Materials and Methods

Spatial planning science is a discipline that refers to and connects elements from other specialist fields in order to explore the complex interrelationships within the analysed spatial systems, e.g., states, regions, or municipalities. To assess the exposition of the labour market to digitalisation the following steps are carried out: (1) desk research concerning literature review and data analysis on possible changes of the labour market due to digitalisation. Current projections of the labour market development in the coming decades are explored. Detailed information on classification systems of the labour market and economy necessary to project selected estimations on the statistical data of the Austrian labour market are set for the second step. (2) The input information on possible developments of the labour market due to digitalisation is translated to the classification system of the statistical data and linked with the employee census on the municipal level (see Figure 1).
Interpretation and discussion of the results are based on the quantitative analyses of the output data and qualitative examination of the result map. The interdisciplinary approach of embedding the outcomes of economic sciences discussion on the impact of digitalisation on the labour market into the local and regional context is completed by formulating scenarios for possible development paths. The significance of the labour market exposition to digitalisation and further aspects of spatial development and planning process are discussed.

2.1. The Future of Labour?

Digitalisation is expected to imply a significant transformation of the labour market and therefore a number of future development assessments were conducted in recent years. The most discussed is the comprehensive assessment of susceptibility to computerisation completed by Frey and Osborne (2013) for the U.S. labour market. In the occupation-based approach the authors deliver a calculation of the digitalisation probability of 702 U.S. occupations. Development of an algorithm for probabilistic evaluation of work automatability by assigning hardly replaceable tasks to the following digitalisation bottlenecks: perception and manipulation, creative intelligence, and social intelligence, resulted in 47% of U.S. employment being estimated to be at high risk of automation. The following minor groups of occupations were pointed out as the most susceptible to digitalisation: communication equipment operators, retail sales workers, printing workers, woodworkers, secretaries and administrative support workers, ground maintenance workers, food and beverage serving workers, sales representatives and services, and rail transportation workers. Those less exposed to automation are: supervisors of different groups of workers (installation, maintenance, repair, protective services, office and administrative support, production, construction, transportation, sales), advertising, marketing, promotions, public relations, and sales managers, counsellors, social workers, and other community and social service specialists, health diagnosing and treating practitioners, teachers (postsecondary, other, and instructors), scientists (agricultural and food, social, physical), art and design workers, engineers, and top executives [18].
Despite the uncertainties of the exact quantification, the study can still be interpreted as an approximation of digitalisation of jobs. In this way the delivered list of occupations was used by several studies on a country level. Conversion of the list to compatible national classifications resulted in the estimation of one-third Finnish and Norwegian employment being highly exposed to digitalisation in the next 10 to 20 years [39]. The same list, together with the occupational activity profiles from PIAAC (Programme for the International Assessment of Adult Competencies), provided a reference for the study by Nagl et al. (2017) on the replaceability of jobs in Austria. It revealed that 9% of employees are at high risk of substitution by already known digital technology. According to this study, the majority of jobs of Austrian employees are at average automation risk from 30% to 70%. The authors assigned a general estimation of digitalisation risk to the branches of economy in Austria, revealing the highest probability of automation for employees currently working in administrative and support service activities, construction, manufacturing, and accommodation and food service activities. At the lowest risk of automation are people employed in education, electricity, gas, steam and air conditioning supply, human health and social work activities, and professional, scientific and technical activities [21].
The occupation-based approach was questioned by Bonin et al. (2015) and Arntz et al. (2016), arguing that summing up heterogeneous tasks of each occupation leads to massive overestimation of automation risk. Applying the task based-approach based on the PIAAC classification for Germany [20] and for 21 OECD countries [40] resulted in an average of 9%, and in Austria 12%, of jobs being automatable. The task-based approach was already applied by Autor et al. (2003), who divided the activities into routine and non-routine tasks. The study also handled the point of task shift within occupations over time, which leads to partial replacement of the occupation but overall change of the job character, meaning an evolution of demanded knowledge, skills, and abilities [41]. In order to react to the changing reality it is important to understand not only how many but also which areas of occupational activities are the most exposed to substitution by digitalisation, as well as to assess the future demand.
The process of labour market transformation is based on substitution of singular tasks needed to be performed to complete the work. Automation always reduces the prevailing labour and employment. It is a process lasting since the first Industrial Revolution, when jobs started to disappear due to the progressive process of transfer of tasks from humans to machines. At the same time new work assignments are emerging due to innovation and progress, generating demand for new versions of existing tasks and tasks accompanying the technology. The complementarities between automation and labour can raise productivity, increase earnings, and extend demand for labour [8]. Furthermore, the process can contribute to increasing inequalities as the new tasks require mainly high-skilled employees who may benefit from new and complex tasks, while substituted tasks demand predominantly lower-skills. In the short term the high-skilled workers are favoured, but in the long run the initially new tasks also become standardised, creating the chance for the low-skilled workers again [7].
As has been happening until now, the future following developments are expected: (1) a task will be passed on to a machine or algorithm (automatisation by networked computerisation); (2) some tasks will be executed somewhere else (geographical change in the course of more and more networked markets); (3) no longer needed tasks will be disappearing and not executed anymore (less demand due to systemic change); (4) the task will continue being done by a human (no change); (5) evolution will lead to new versions of existing tasks (change in character, other skills demanded to complete); and (6) completely new tasks will be created or get new importance (emerging jobs, current tasks being complemented by digital technology, e.g., AI assistance) [3,7,9,10,40,41,42]. It is highly probable that most of the routinized jobs and predictable work processes will be gradually digitalised. On the other side of the transformation process there are activities gaining relevance for the future labour market. They demand originality, complex approaches, social competences, non-routine thinking, new solution inventions, expression, and interpersonal skills. The lists in Table 1 demonstrate the expected changes concerning job demands and characteristics in the coming decades.

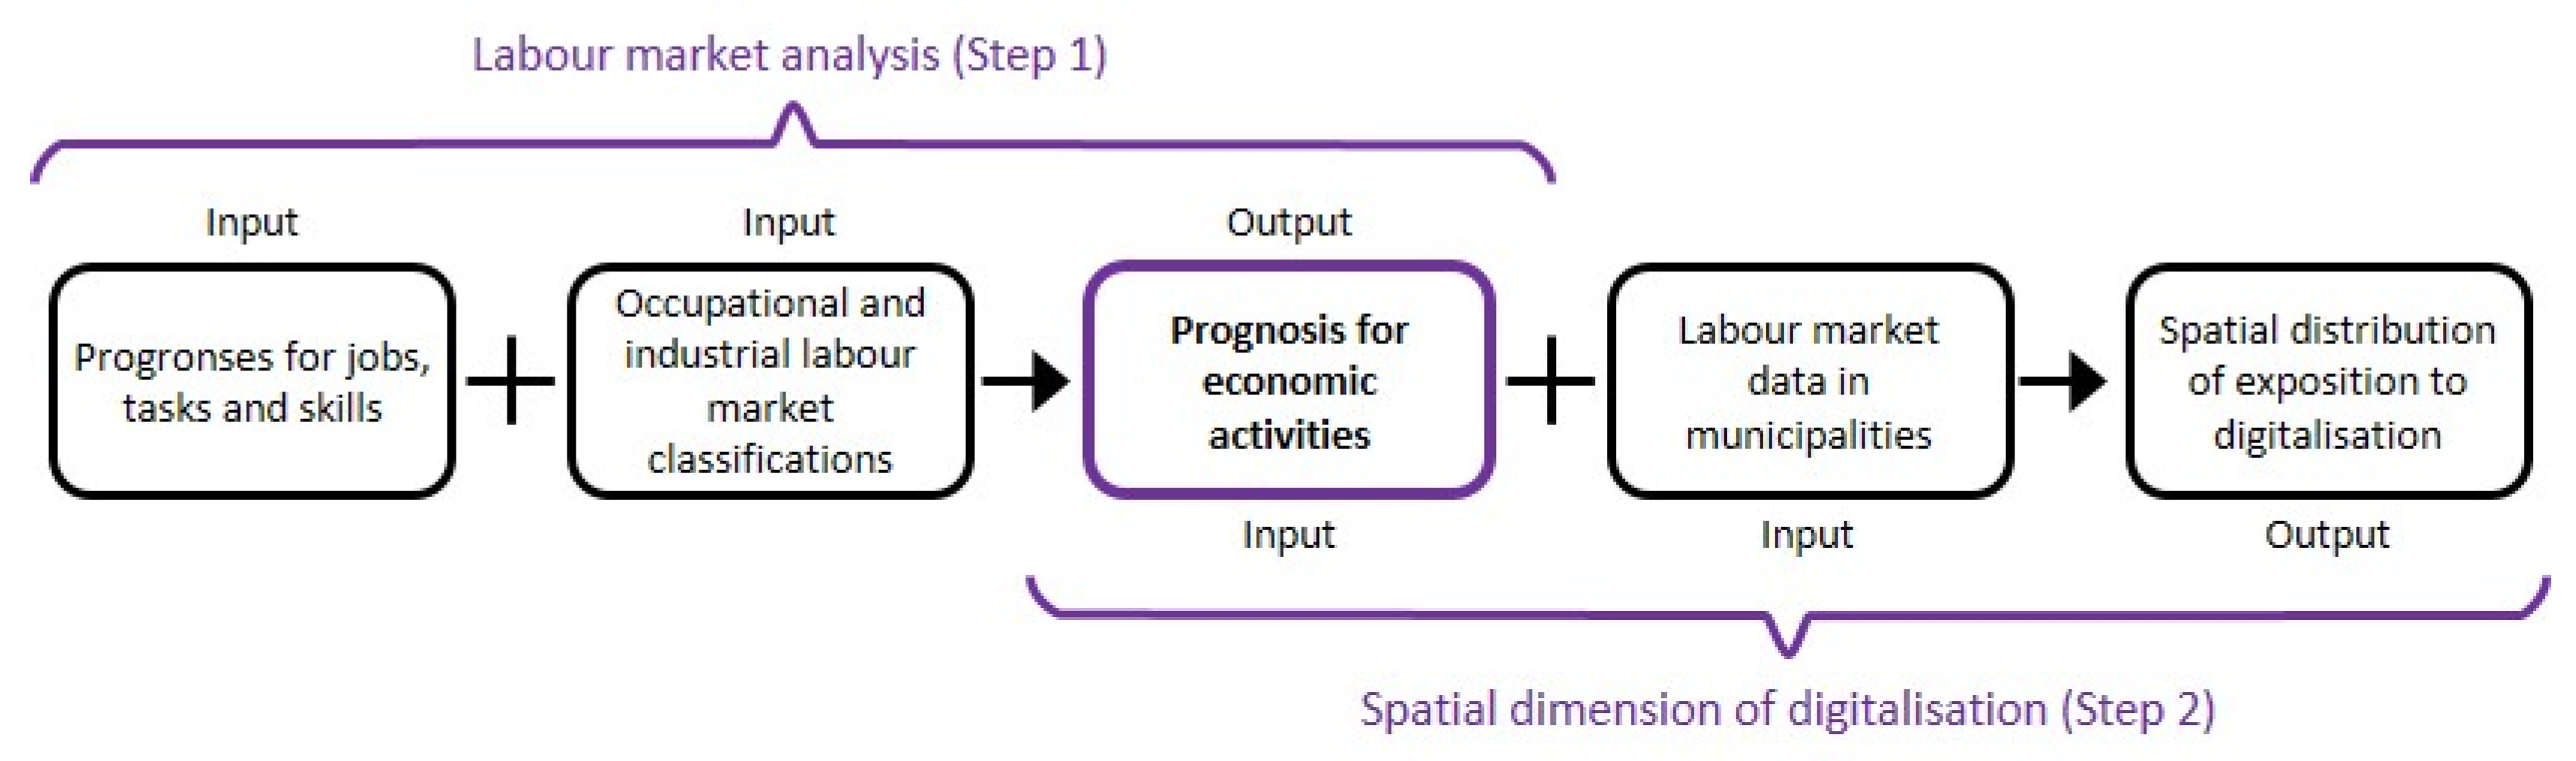
2.2. Input Data and Modelling the Spatial Distribution of Digitalisation Risks

The spatial assessment of the exposition to labour market digitalisation is based on the probability of human labour substitution by networked automation. The calculation of the probability itself is not part of this study. After the survey of existing studies on the subject (see Section 2.1.), it is apparent that the Frey and Osborne (2013) study provides the most comprehensive basis for further analysis. It covers the entire spectrum of possible occupations of the current state of the labour market under conditions comparable to the Austrian situation [21,45]. The authors delivered a list of clearly defined 702 detailed occupations in SOC (Standard Occupational Classification), considering all major and minor groups of the SOC systematics [46]. Numerous further studies refer to this primary approach and results. The outputs have been broadly discussed and revised, including studies based on approaches evaluating a wider variety of tasks, questioning the exact time scale due to the economic profitability slowing the process. Most cases delivered general confirmations of the distribution of the digitalisation probability among the occupations [3,20,21,39,40,47,48]. The calculated probabilities give an overview and orientation of exposition to digitalisation through the occupational groups.
To project the probability of labour market digitalisation on the Austrian municipalities the employee data from the register census were used. The newest data set available represents the status from the year 2011. The input data include the number of employees by municipality and by economic divisions in the ÖNACE classification—the Austrian refinement of the NACE (Nomenclature statistique des activités économiques dans la Communauté européenne) classification of economic activities. The economic divisions correspond to Level 2 of the NACE hierarchy. By using the NACE-classification, the approach can be also used in other EU-countries. The administrative municipal boundaries corresponding with the statistical labour market data as of 1 January 2011 deliver a sample size of 2379 administrative units, covering the whole country [49]. It should be noted that due to the administrative border reform in 2015 there are currently (December 2019) 2096 municipalities in Austria.
In the first step the occupation based classification (SOC) was translated to the NACE classification. The conversion was based on the analysis of the documentations of the considered classifications [50,51] and further comprehensive desktop research, including analyses of job profiles, career advising, job orientation information, job-oriented education guidance. Fields of activities of specific occupations and structures of different sizes of enterprises were also referred to. The list of occupations (702) was matched with the list of economic divisions (85) in a matrix. The conversion was done in two stages: (1) Assignment of occupations to economic divisions. At this stage it was decided whether tasks specified that an occupation contribute to executing the considered economic activities. First, for each occupation it was decided, one by one for each economic division, whether the occupational activity belonged to the economic division or not. Secondly, each economic division was controlled if all related occupations were properly assigned and the occasional shortcomings were corrected.
After this first stage the second stage, (2) classification of importance of the assigned occupations for the individual branches of the economy, was executed. The relevant occupations filtered in the first stage were classified into four groups: core occupational activities (I), important occupational activities (II), secondary occupational activities (III), marginal occupational activities (IV). It was done according to following criteria: frequency of execution of the activities, time expenditure of the activity for the economic division, and the relevance for the economic division where the question—How high would be the impact on the NACE classification if the occupational activity was potentially outsourced or ceased?—was answered. The rating of the importance was done using ordinal grading in four levels, where the highest frequency of execution, the highest time expenditure and the most likely change of assignment to economic division if outsourced or ceased meant the highest importance for the economic division. The ratings for each criterion were equally weighted and the final class assignment was determined (I-IV). The irrelevant occupational activities excluded for each economic division in the first stage were assigned to class V (see Table 2). In case of any initial uncertainties job profiles of the illustrative examples given in the documentation [51] were additionally explored. At the end, each economic division was controlled if the selected and rated occupations represented the entire range of occupational activities necessary to execute the economic activities assigned to the economic division.
To finalise the conversion, the contribution to the workload of occupational activities of each class was estimated. The core occupational activities of class I, representing the most specific and relevant tasks, were assessed to comprise 60% and the important occupational activities of class II to comprise 30% of the total workload needed to execute the economic activities of the respective division. Secondary and further additional occupational activities were estimated to comprise the remaining 10% of the working hours, divided respectively into 7.5% (class III) and 2.5% (class IV) (see Table 2). The weighting of the occupation’s importance for economic divisions reflected the actual share of the tasks necessary to perform the economic activities assigned to each division. The final results represent the economic divisions with all associated occupations sorted according to their relevance.
The probability of digitalisation for each of the listed economic divisions (85) was calculated proportionally to the weighted share of all contributing occupations. The determined probability of digitalisation was subsequently linked to the statistical data at the administrative municipal level. The digitalisation probability of the labour market was calculated proportionally to the number of employees assigned to each economic division in a municipality and resulted in digitalisation probability for each municipality (P). The calculation was done for each municipality using the following expression:
P = D j * j ( A i * B j ) j B j G ,
where Ai—digitalisation probability of an occupation; Bj—hours per week (workload) of the occupational activity in the economic division, Dj—number of employees in an economic division in the municipality, G—total number of employees in the municipality. The outcomes were joined to the administrative municipal boundaries and a map of the distribution of susceptibility to digitalisation was created in a geographical information system.

3. Results

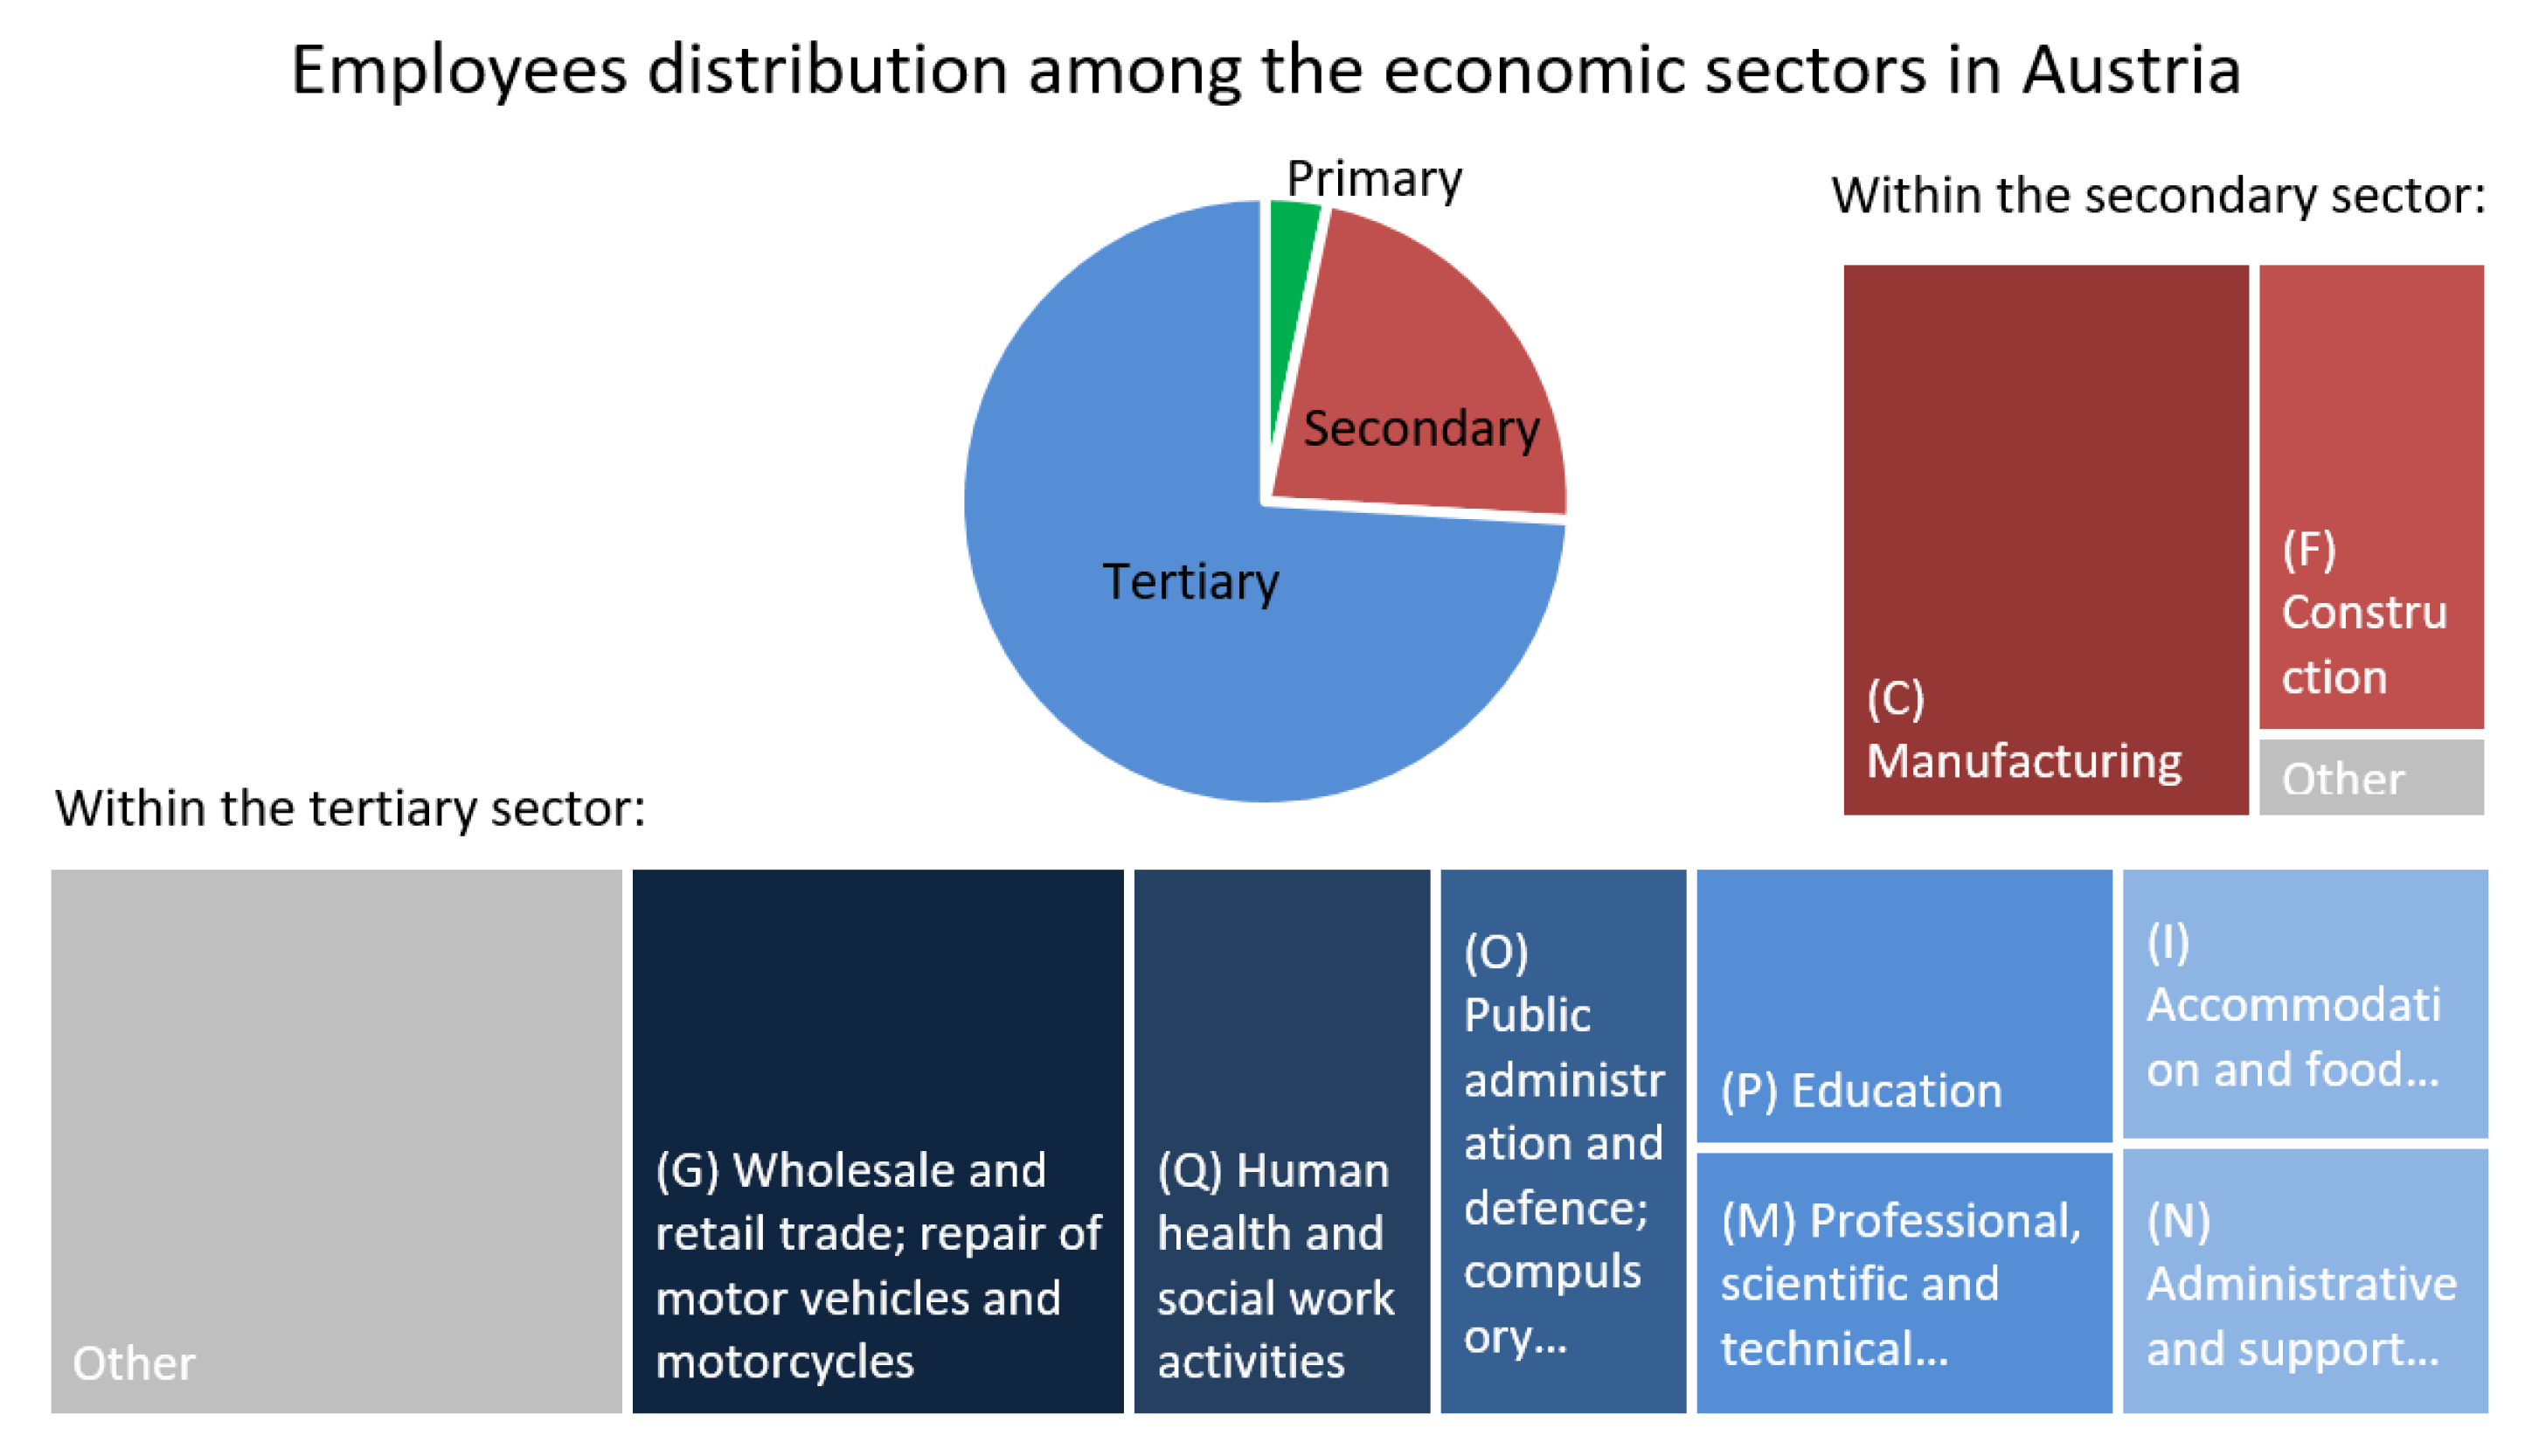
3.1. Background Information on the Austrian Labour Market

Before proceeding with the analyses, the current situation of the Austrian economy, the labour market, its innovation and adaptation potential as well as spatial characteristics of the municipalities are shortly introduced. Of the 8.8 million people living in Austria [52], 4.3 million are employed, of which 53% are male and 47% female (2017). The economic activity rate is 76.6% (2018), the share of part-time employees who are actively employed has been increasing for some years and is now 31.2%. The unemployment rate is 4.9% (2018) and shows a slightly downward trend [53,54]. The employees are distributed among the economic sectors as follows (see Figure 2): primary sector 3.3%, secondary sector 22.5%, tertiary sector 73.4%. Using the NACE 2008 industry standard classification, the following economic sections dominate the secondary sector: manufacturing (NACE Code C) with the share of 64% and construction (F) with 31%. In the tertiary sector, 21% are employed in wholesale and retail trade, repair of motor vehicles and motorcycles (G); 13% in human health and social work activities (Q); 10% in public administration and defence, compulsory social security (O); 9% in education (P); 9% in professional, scientific and technical activities (M); 8% in accommodation and food service activities (I); 8% in administrative and support service activities (N) [54].
Considering the skills and occupational classifications of employees in Austria, the most represented occupational groups according to ISCO-08 Classification are technicians and associate professionals, service and sales workers, and professionals (see Table 3) [45].
Austria is ranked within the 20 most competitive countries in the world and belongs to the 10 most competitive countries in Europe [55]. The country has a stable economy with a very small variation of regional competitiveness among its federal states [56]. Austria is classified as a strong innovator, according to the European Innovation Scoreboard 2019. The relative expenditure on research and development is one of the highest in the EU and amounts 3.16% of GDP (2017) [57]. The digital competitiveness ranking also gives Austria a very high (15th) position, thanks to the scores in the categories of knowledge and future readiness [58].
Based on the population data, location, institutional affiliation and balance of commuter flows, Austrian municipalities are differentiated into the following spatial archetypes: urban areas, suburban areas, small towns in suburban or rural areas, and rural areas [59]. According to this classification, 2% of Austrian municipalities belong to urban areas. Suburban areas account for 29%, small towns are almost evenly distributed between suburban and rural areas and altogether represent 12% of municipalities. Rural areas dominate in number and represent 57% of Austrian municipalities. Spatial and proportional distribution are presented in Figure 3.

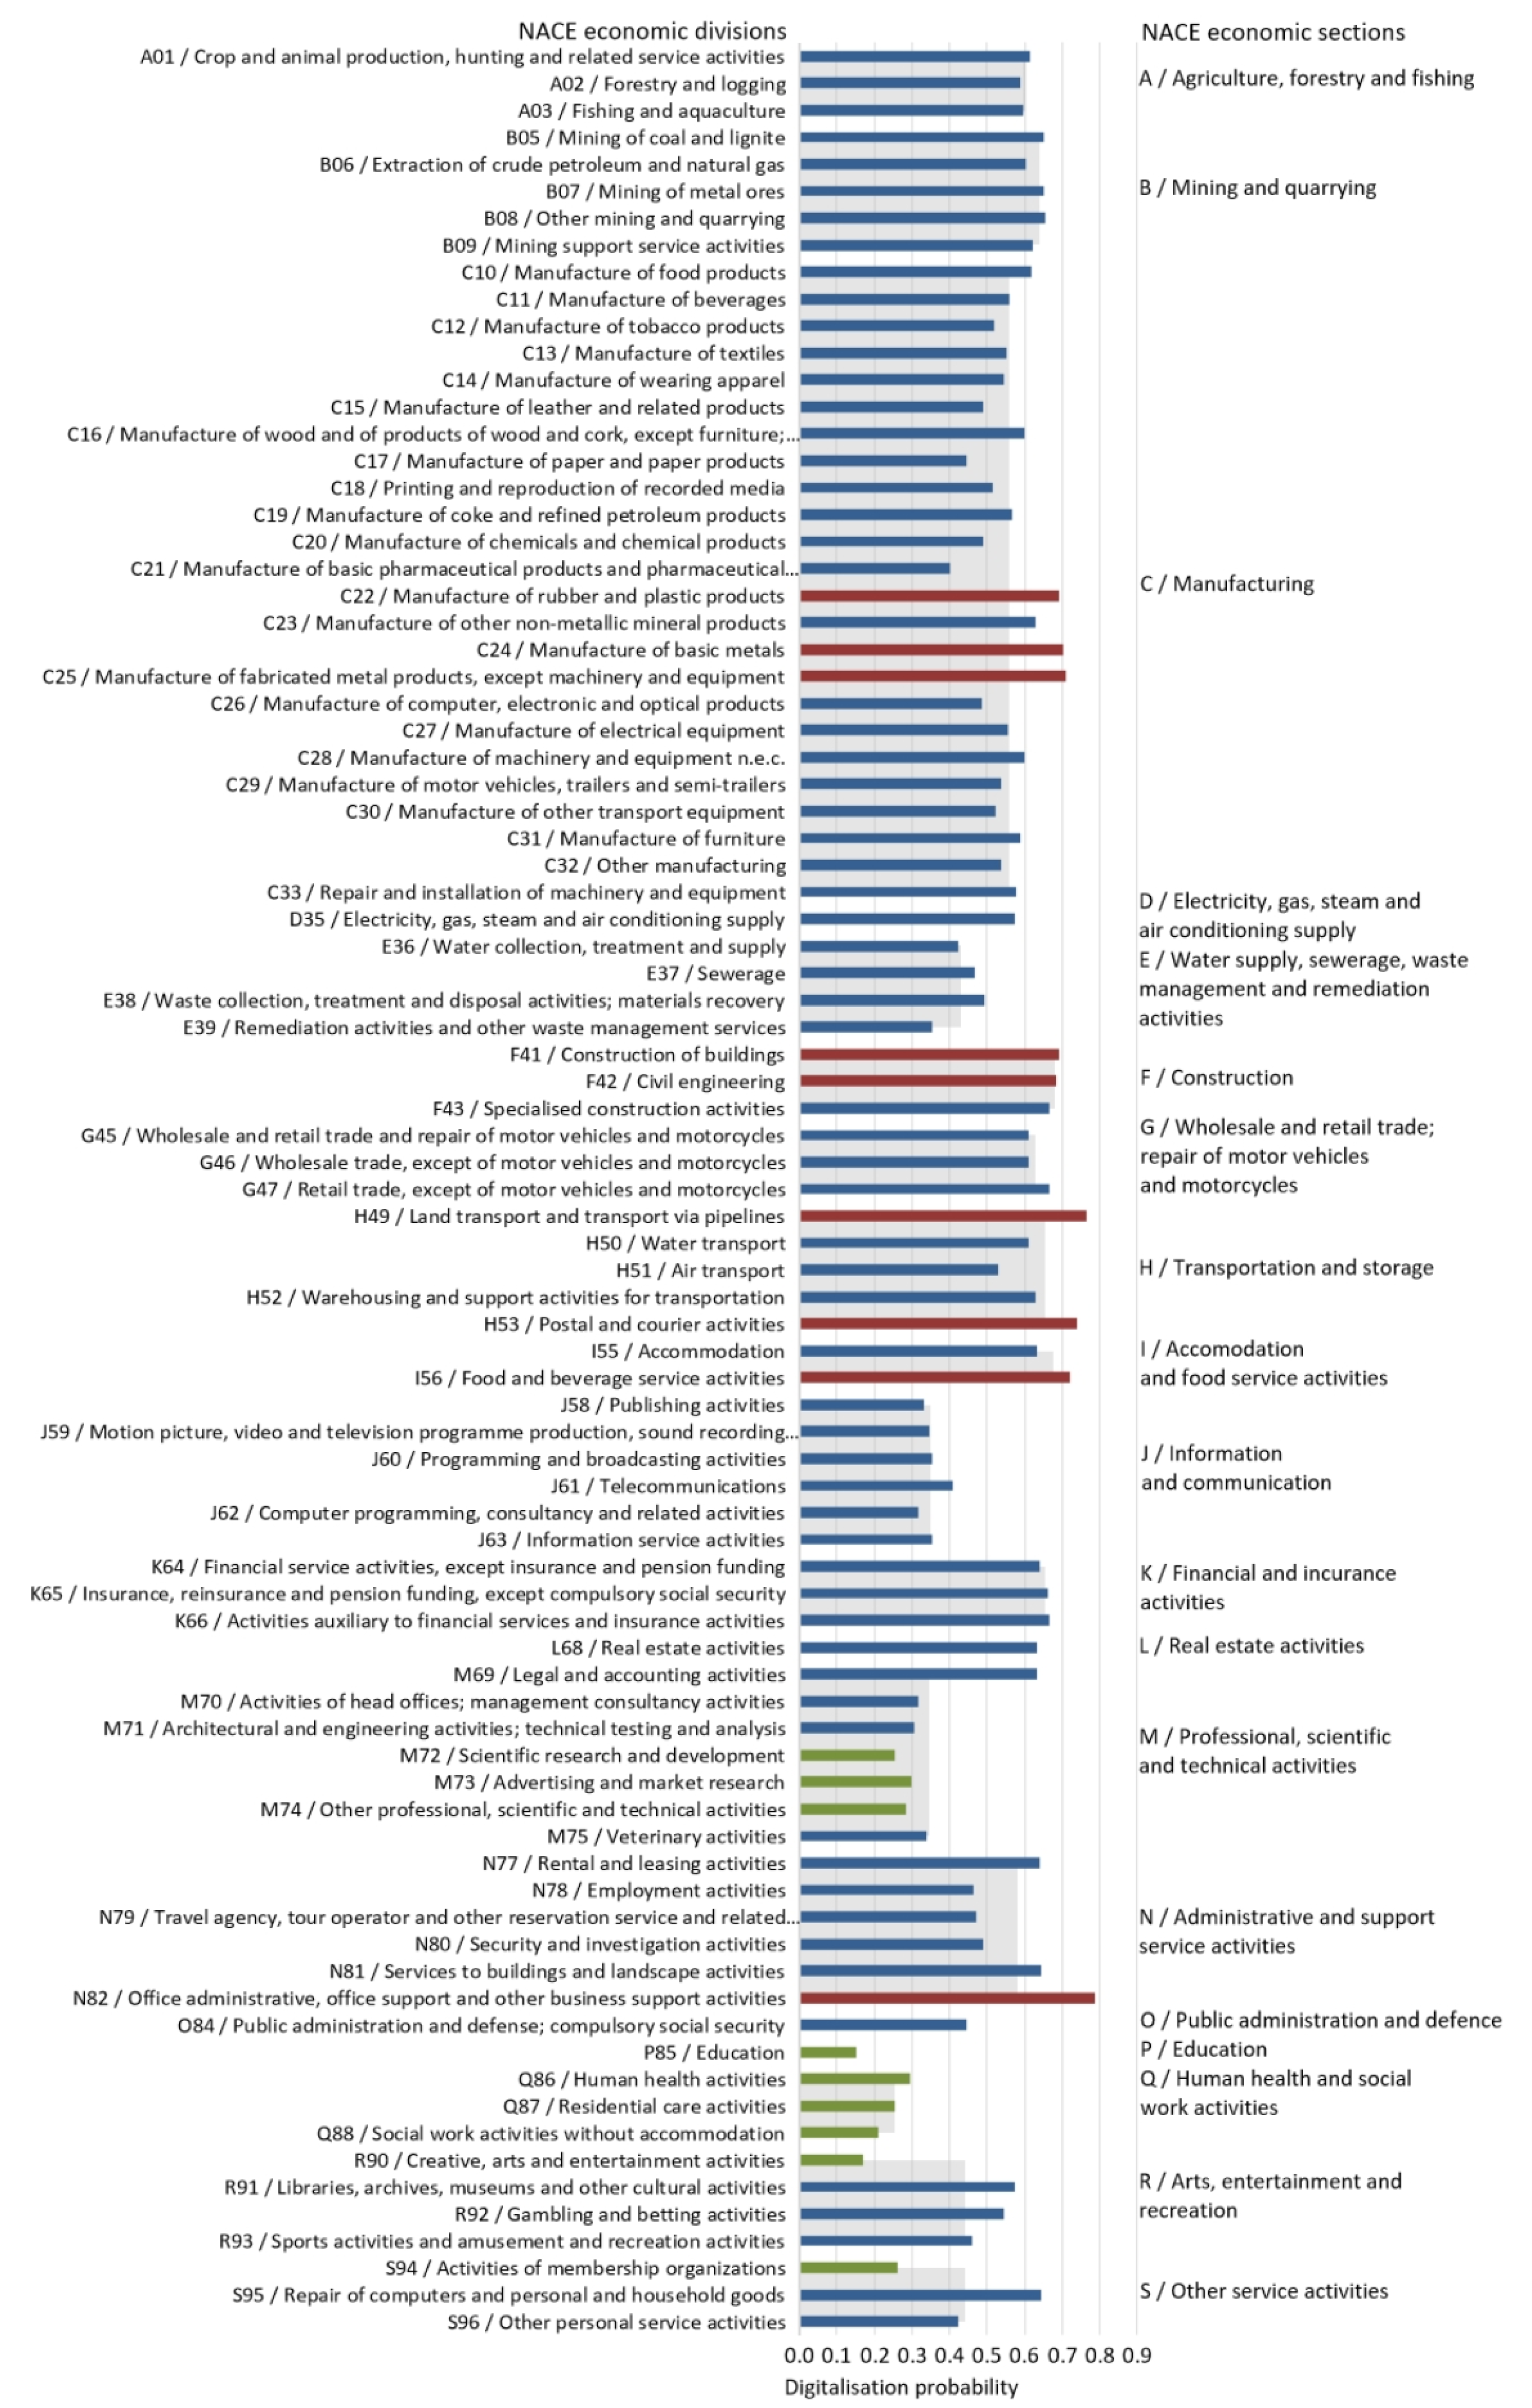
3.2. Probability of Digitalisation by Economic Branches

This section reveals the probability of digitalisation of economic activities according to the NACE classification. The details for all sections and divisions can be seen in Figure 4 and Appendix A (Table A1), the description highlights the most noticeable findings regarding the highest and the lowest vulnerability to digitalisation.
The presentation begins with the superior classification units that are the economic sections. The lowest probability of digitalisation is assessed for education (P) with 0.15, followed by 0.25 for human health and social work activities (Q), and 0.35 for professional, scientific and technical activities (M), and information and communication (J). The most susceptible to digitalisation are construction (F), accommodation and food service activities (I), financial and insurance activities, transportation and storage (H), mining and quarrying (B), real estate activities (L), and wholesale and retail trade and repair of motor vehicles and motorcycles (G), all with a probability of digitalisation from 0.63 to 0.68. The remaining sections demonstrate mean exposure to digitalisation (probability between 0.43 and 0.60) (see the right side of Figure 4).
The economic sections comprise partly various divisions and, therefore, within a section the overall results can lie within a small range, e.g., construction (F), information and communication (J); or vary from low to high, e.g., manufacturing (C), administrative and support service activities (N). Additionally to the divisions included in the previously mentioned sections, several very highly exposed divisions from the manufacturing section are noteworthy: manufacture of fabricated metal products (C25), manufacture of basic metals (C24), manufacture of rubber and plastic products (C22), which are rated with 0.69–0.71 probability of digitalisation. On the other hand, low probability of digitalisation (0.40) is observed for manufacture of basic pharmaceutical products and pharmaceutical preparations (C21), and 0.44 for manufacture of paper and paper products (C17). Noteworthy is also the division comprising activities of membership organisations (S94) and remediation activities and other waste management services (E39) with very low (0.26 and 0.35) probability of digitalisation.

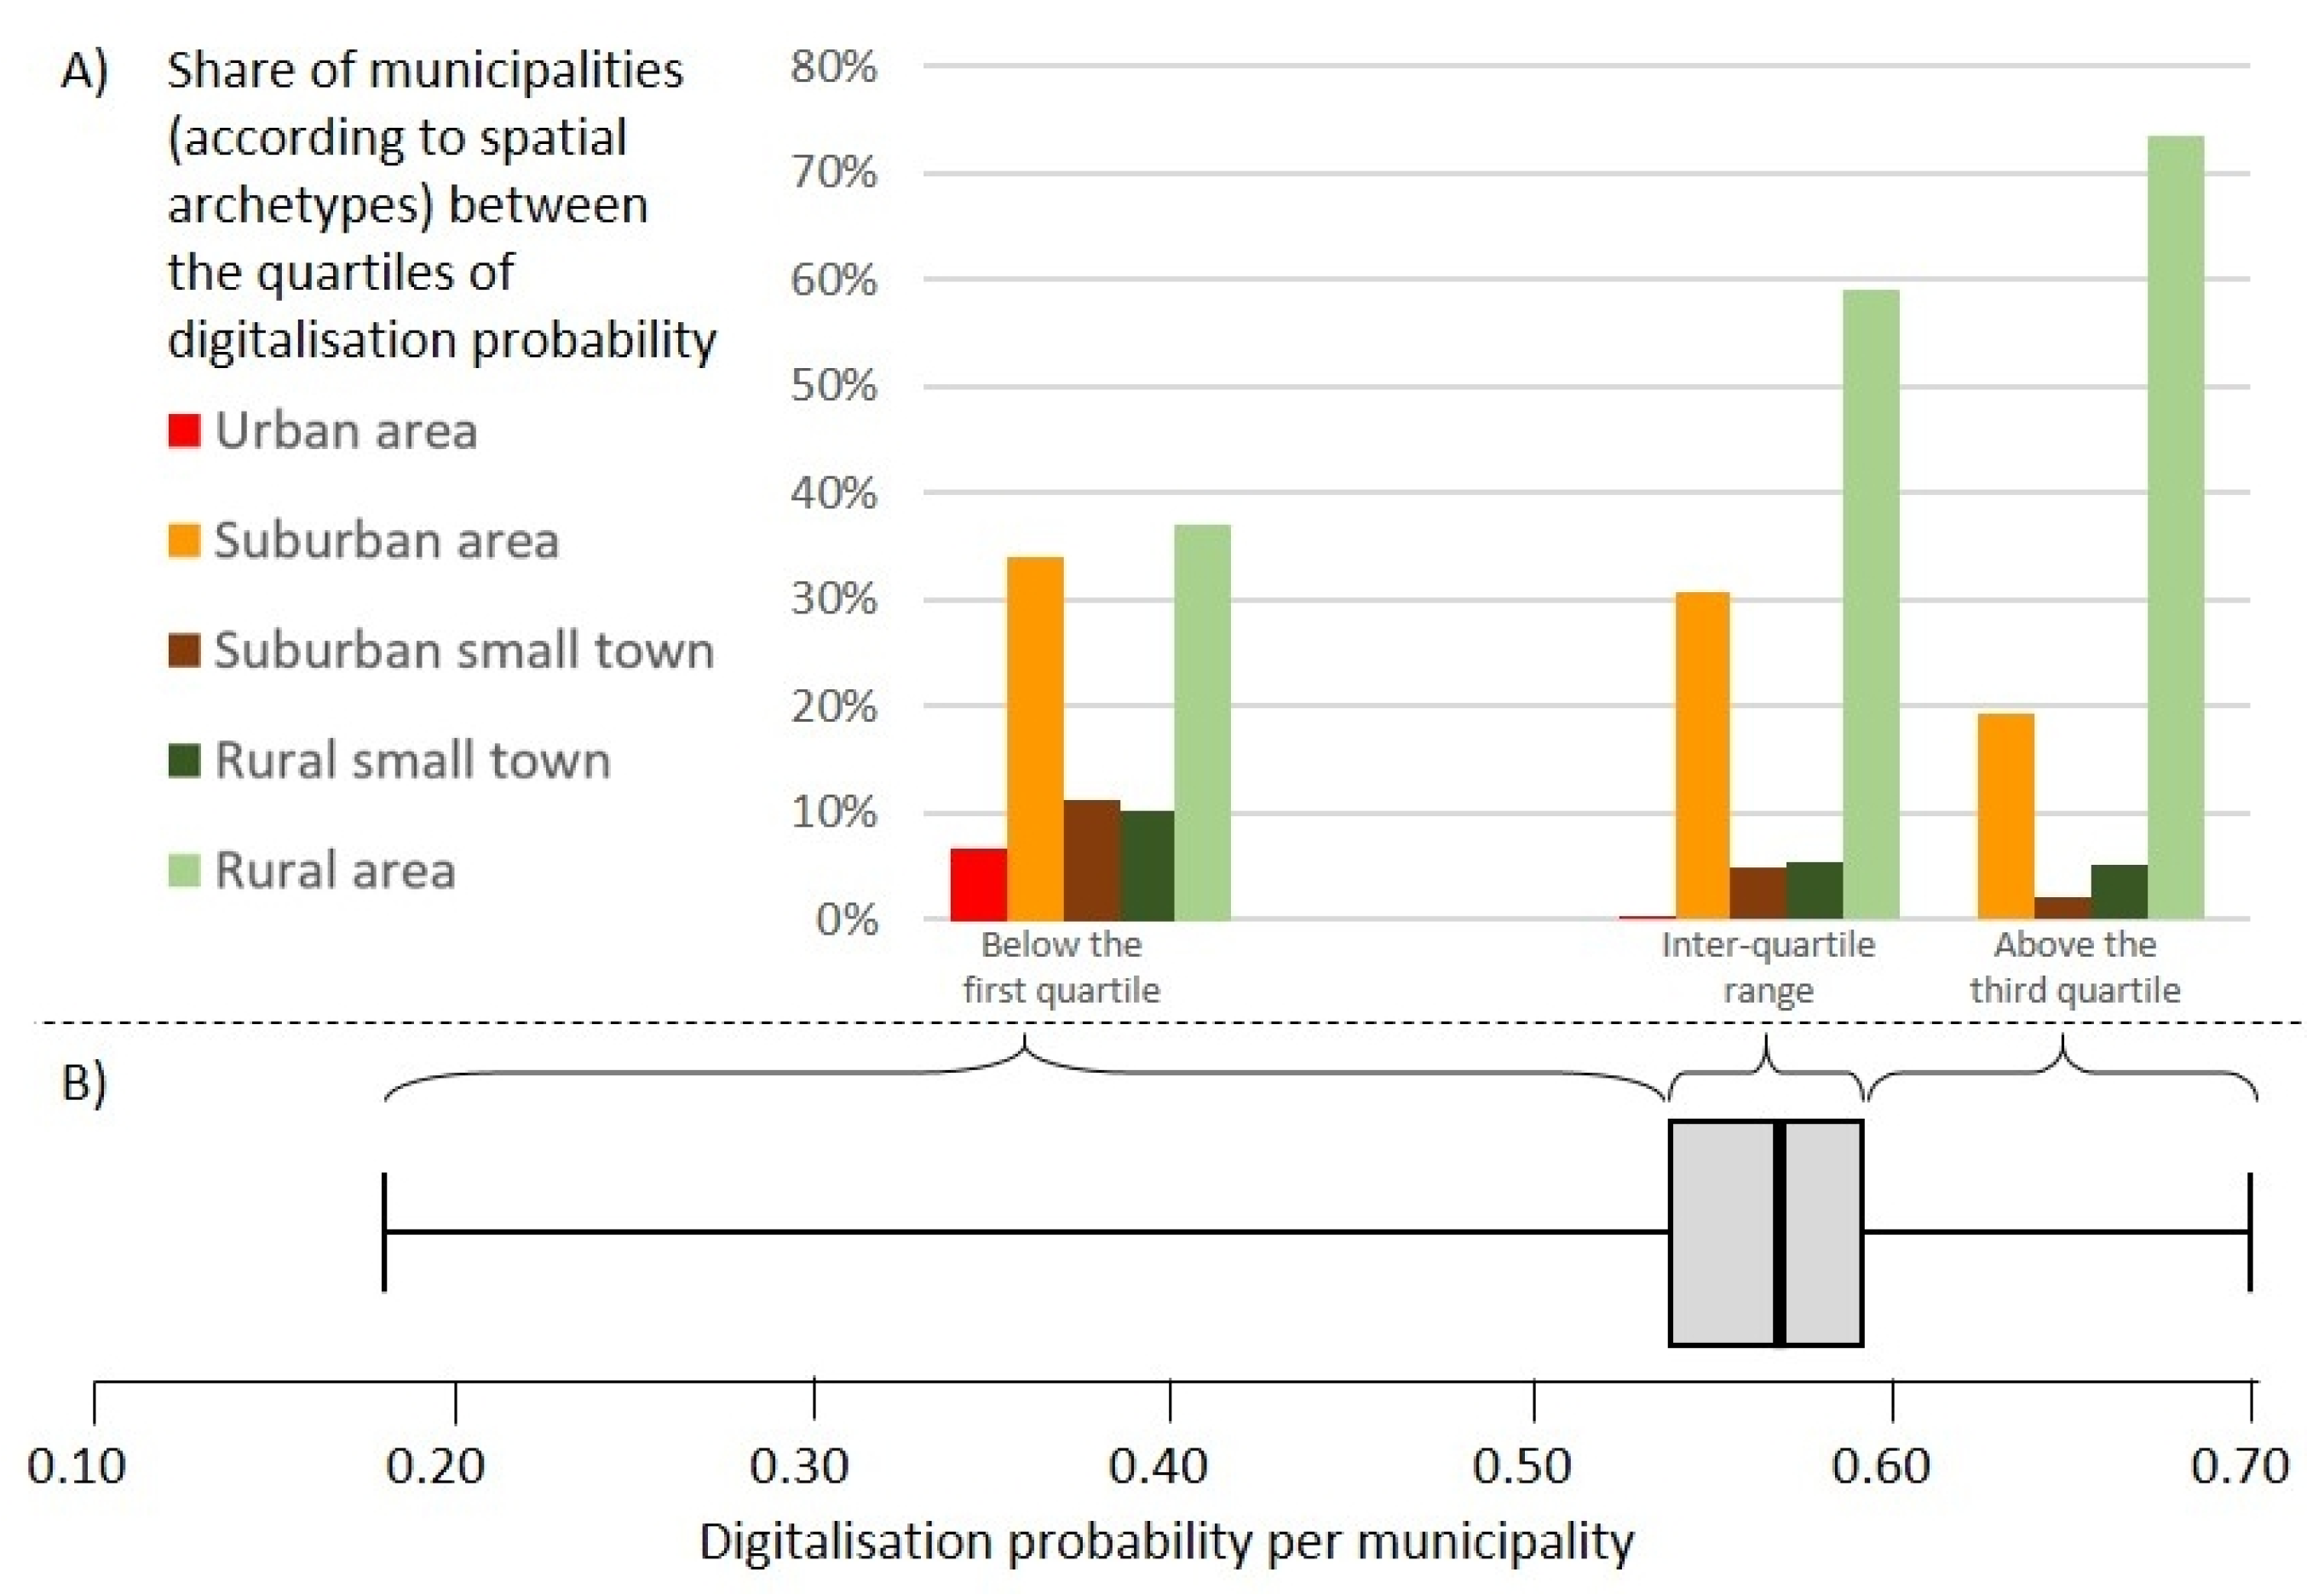
3.3. Probability of Digitalisation by Municipality

The results reveal the digitalisation probability of labour for each municipality in Austria, depending on the local job market structure. The calculation is based on the detailed statistical information about the number of employees in each of the economic divisions. Through the combination of a task-oriented basis of calculation and economy based input data the outcomes refer to the tasks needed to complete the respective economic activities in each municipality. The calculated probabilities are expressed in percentages. They can be interpreted as percentages of all present professional activities that can be substituted or become obsolete. The results consider only the potential destructive impact of digitalisation on the labour market and do not necessarily mean subsequent loss of jobs, but point out the possible reduction of human effort involved directly into completing work tasks. Other processes leading to creation of new tasks compensating or even exceeding the predicted losses are not considered in the assessment. As already pointed out, such data are not available.
Depending on the municipality, 18% to 70%, with 56% on the average, of current labour is most likely to be digitalised in the next two decades. As shown in Figure 5B the interquartile range is very narrow and reveals that the middle 50% of the municipalities have very close results from 54% to 59%. The low extreme values reach 18% and the high extreme values end at 70%. Further analysis reveals that the outliers of the low values have the most employees in three economic sections: education (P), human health and social work activities (Q), and also professional, scientific and technical activities (M), mainly in scientific research and development (M72). When municipalities with higher shares of replaceable jobs are considered (results above the 75th percentile) it is observed that employees belonging to the sections of education, social work, and professional, scientific and technical activities (P, Q, M) are in a clear minority and employees working in other, more vulnerable economic sections prevail in number.
The normality test delivers the following results: the data is negatively skewed with a skewness of −1.015 by standard error of 0.050. Since the data is non normally distributed, a Spearman’s correlation analysis was executed to determine the relationship between the digitalisation probability of the municipalities and the share of employees in the economic sections. For interpreting the sizes of the digitalisation effects the values of the correlation coefficient (rs) are classified as follows: ±0.00−0.19 as very weak, ±0.20−0.39 as weak, ±0.40−0.59 as moderate, ±0.60−0.79 as strong and ±0.80−1.00 as very strong [60]. Strong negative correlation is observed between the digitalisation probability and the section of human health and social work activities (rs = −0.61). Moderate correlation is identified with education (rs = −0.57) and professional, scientific and technical activities (rs = −0.41), and weak with information and communication (rs = −0.33). Positive correlation is noted only to a weak extent with agriculture, forestry and fishing (rs = 0.29) and transportation and storage (rs = 0.20).

3.4. Spatial Distribution of Labour Market Susceptibility to Digitalisation in Austria

The map in Figure 6 shows the spatial distribution of the employment digitalisation probability per municipality. It is a differentiated picture, without substantial spatial clusters of high and low values. A clearly recognisable pattern applies to capital cities of the federal states. Labour markets in all of the nine cities are estimated to have a probability of automation between 45% and 50%, with an average of 48%, and are all in the first quartile of probability values.
Considering all municipalities, but excluding the capital city of Vienna (Wien), there is little distinction in the results between the federal states, as the digitalisation probability ranges between 56% und 57% and the difference does not exceed 1%. The only exception is observed in Vienna, which is a federal state itself, where probability of digitalisation is on average 8% lower than in other federal states. The minor differentiated results can be explained by the dispersion of the data presented in Section 3.3. However, when values outside the interquartile range are considered, differentiated spatial patterns can be identified. The lower and upper 25 percentiles are analysed separately and compared.
Table 4 reveals that there are federal states with presumably lower exposition to digitalisation like Vienna, Lower Austria, Burgenland and Carinthia, as the share of highly susceptible municipalities is low and the share of little susceptible municipalities is high. Furthermore, Styria, Tyrol, and Vorarlberg seem to be more exposed to the labour market digitalisation, as many of their municipalities are ranked above the 75th percentile and relatively few below the 25th percentile.
Result classification according to the spatial archetypes urban areas, suburban areas, small towns, and rural areas reveals moderate differentiation. When applied to the whole Austrian territory there is relatively low differentiation, however there are some recognizable patterns (see Figure 7). Urban areas can be distinguished by a 5–8% lower exposition than the other spatial types of municipalities. The evaluation presented in Figure 5A in Section 3.3 and Table 5 indicates that those most exposed to digitalisation are labour markets in rural areas. Apart from urban areas, small towns also appear to be less susceptible to digitalisation. When the interquartile range of the results is excluded, there is a remarkable difference between small towns and the surrounding area (suburban area or rural area, respectively) in the distribution of the highest and the lowest results. The distinction in favour of small towns from the direct neighbourhood is even clearer in the rural than in suburban areas.

4. Discussion

The results of the study provide an insight into the spatial distribution of the local labour market exposition to digitalisation. The outcomes confirm that all municipalities will be confronted with the transformation due to Industry 4.0 to a significant extent. It was revealed that the grade of susceptibility to digitalisation cannot be explicitly linked to location or spatial archetype. However, there are strong indications that can be derived from these attributes. Urban areas, suburban areas and small towns appear to be less susceptible to digitalisation, while rural areas are generally much more exposed, which is consistent with OECD analyses on the regional economic development, also identifying the strongly urbanised areas to be generally at lower risk of automation by digitalisation [61]. The actual course of changes depends yet on many factors (social, demographic, education, national and international competition and cooperation, other global trends). Therefore, in order to avoid the risk of simplification through too much generalisation of the results, and to deal with the uncertainty and unpredictability of the positive effects of digitalisation, further interpretation is formulated as scenarios. The scenario method is used in strategic planning and combines the established development trends with supposable future possibilities. In this way the scenarios are identified from the invented “storylines” for the uncertain developments to come. They contribute to identification of potential future determining factors, as well as to uncovering the links between changes in factors’ values and directions of future development. Furthermore, building scenarios reveals the interactions between these identified factors and other existing development drivers. Creation of scenarios also points out completely new possibilities for the course of development. The aim is to unfold positive and negative, desirable and undesirable scenarios. Addressing various aspects or diverse possible development paths shall allow to identify fields of action for desired developments. The scenarios consider different frameworks and spatial context of consequences [62]. The scenarios are built on the results of the study at hand and on the existing literature on the parameters discussed in the scenarios. The exposition of the labour market to digitalisation is considered as the data-based part in the scenario building. The less defined components of future development are the interrelations of the exposition with the adaptive capacity determining factors, different economy structures, and geographical locations of the municipalities. The scenarios elaborated are in some cases interdependent, in others also contradictory. Most probably none of the scenarios will occur as described hereafter and the developments will vary from region to region or will happen one after the other (e.g., difficulties at the beginning but followed by effective solutions). Therefore, the scenarios serve the purpose to start discussion about digitalisation effects, exposition of labour markets, and their relevance for sustainable spatial development.
The breakdown into singular scenarios demonstrates the tendencies and provides the recording of the considerable spatial, economic, and social consequences of digitalisation. It is crucial to account for the identified outcomes at the political and strategic level, otherwise the changes will be driven by the free market principles, which consider mainly the economical profit, overlooking the social and environmental components, which poses major constraints for sustainable development. Sustainability needs conscious and evidence-based governance and support [63]. First of all, governmental subsidised high-speed internet infrastructure is crucial for digital transformation in remote rural areas [64]. Further need for governance for sustainability can be derived from the scenarios described hereafter. Uncontrolled digitalisation may lead to inequalities, deepening of existing disparities, and emergence of new or accelerated regional unbalances, especially between urban and rural areas. The scenarios signal that a sustainable solution leading to reduction of spatial disparities needs to be consciously and effectively managed by governmental action. The data on coming challenges and the consideration of specified settings can support the local and regional administration and political decision makers in formulating and implementing appropriate strategies.

4.1. Scenarios for Possible Digitalisation Impact on Spatial Development and Social Vulnerability

The scenarios presented here deal with the decreased demand of human labour, with labour market characteristics, and with potential spatial impacts of digitalisation. By no means shall these scenarios be understood as prediction or prognosis, but as potential development paths that allow decision makers and society to incorporate digitalisation effects in policy making and planning, and scientists to draw research agendas for future work.

4.1.1. Decreased Demand for Human Labour

Depending on the societal frameworks a potential decreased demand for human labour might result in a range of effects between giving people more individual freedom, leisure, and the possibility to strengthen their relations, or threatening the existence of many, as can be shown in three scenarios:
  • Reduction of regular working hours and increase of part-time jobs:
    • Decreased demand for human labour can lead to reduction of regular working hours per person and consequently in a change of the definition of the full-time job (e.g., 25–35 h per week instead of 40) and further increase part-time employment. Provided the income level does not deteriorate and the quality of gained leisure time is high, this trend can have a positive impact on the quality of life [65]. When people have their livelihoods provided for, their spare time can be invested into social voluntary work, which contributes to more bonding and bridging in the community, consequently decreasing social vulnerability [66]. In this case the spatial structures remain predominantly stable. Moreover, fewer working hours per person lower the occupancy of available workstations and consequently reduce the demand in square meters, e.g., office area per employee. This trend could lead to more shared offices, co-workings and sharing of office premises.
  • Increase of unemployment:
    • Reduced demand for human labour can lead to a reduction in numbers of employees, resulting in dismissals. The subsequent destruction of the current employment situation and the ruin of prospects for a stable future for many can result in the deterioration of living conditions. It may cause a migration leading to depopulation, initiating a sequence of negative consequences such as further infrastructure downsizing or withdrawal. This development is more probable to occur in communities with lower adaptive capacities due to lack of innovation potential and social strength. Furthermore, it can increase the vacancy rate of the business, commercial, and residential areas without real prospects for a subsequent use.
  • Increase of new occupational tasks and activities, business innovation and adaptation, retraining and requalifying of employees:
    • The restructuring processes set in motion by Industry 4.0 induces emerging of new job activities and tasks. If the processes of employment reduction and increase of new employment progress concurrently, the transformation has little or only temporal negative impact on the society. To make it happen, it demands a high level of understanding for the digitalisation process and thereby to benefit from its solutions. The innovation ability is needed to use and create new business opportunities. Though, a period of temporary technological unemployment can be expected as one of the steps in the transition [10]. The adaptive capacity is essential for the quick response to the challenges of new situations, keeping up the existing structures, or, in case of negative developments, being able to make up for possible deterioration of living conditions. Opportunities for lifelong learning assure the access to requalification and targeted retraining, which helps the employees to actively contribute to further implementation of innovations [67,68]. The change in qualification demands can be covered by gaining new skills and knowledge or by accessing the workforce from outside. Digitalisation eliminates territorial restrictions in access to talents. Involving external resources can contribute to the economic success of an enterprise [69]. In the same time, it decomposes the social structure of the local community and brings additional insecurity for the usage of technical and social infrastructure on site. In relation to the built environment’s possible changing requirements, it can increase the demand for more flexible forms of buildings that are able to offer appropriate working environments for various forms of economic activities, and also for shorter periods of work time. The quality of the centres of towns and also rural communities as business locations may gain importance as the high-speed internet belongs to the hard location factors as part of the communication system. Landlines of broadband internet are first provided in the central or already settled locations [64]. Consequently, a new factor with the potential to counteract the trends of dispersal settlements and donut effects is introduced. It is also possible that through the emerging technological solutions as well as the corresponding market characteristics, the increasing demand for highly flexible manufacturing of individualized products, the non-distant production sites can gain back their attractiveness. Additionally, the reduction of jobs needed in production contributes to the decrease of total salary costs, and the production previously relocated in the low-wage countries might settle down in Europe again. The efficiency, quality control opportunities, and reliability of manufacturing, as well as quick delivery associated with mass customization can intensify the backshoring decisions of businesses [70,71]. Consequently, it can bring new jobs composed of non-substitutable tasks and increase the demand for building land for industry and commerce.

4.1.2. Labour Market Characteristics

On a local scale, the change of labour market characteristics might vary considerably depending on the existing state. There are possible scenarios ranging from no major changes—which can be only expected in a low number of municipalities with certain spatial structures—high vulnerability or high adaptive capacity.
  • No major changes:
    • The results reveal that in municipalities with low probability of digitalisation of the labour market the biggest share of employees belongs to the public sector of the economy. The least exposed municipalities represent one of the two possible types: first, small municipalities without well-developed, diversified labour markets based on the business or private sector. The case occurs mainly in rural areas. The second case refers to city districts or towns in suburban areas with more diversified labour market structures, but accommodating important public institutions and authorities. In both cases the changes due to digitalisation are expected to have only a minor extent and less significance, provided the existing administrative, educational, or health institutions are kept in the area.
  • Loss of jobs in the most vulnerable municipalities:
    • Municipalities with an extended business and private sector are expected to be more affected by digitalisation. At the highest risk are smaller municipalities where, due to the size, the differentiation of the labour market is low. They are focused on few activities from the predominantly manufacturing economic section. Lack of differentiation of the labour market means lower resilience and higher vulnerability [72]. If the production gets digitised, which can be crucial for maintaining the enterprise, besides the advantage of maintaining the production site and providing the income for the community it could consequently mean that many especially lower qualified workers are left without livelihoods. If, in addition to the replacement of the local jobs, the needed (IT) services are outsourced and the company capital is located outside the region, there is no prospective benefit for the location where the land and infrastructure are actually engaged. This is a case of a combination of the highest exposure and the lowest adaptive capacity, as especially lower qualified groups of employees have potentially the lowest capability of professional reorientation [73].
  • Adaptation to and shaping a new regional labour market:
    • Municipalities with or without an established business and private sector may be able to adjust, actively reshape, and profit from the structure of regional industry and service sectors. Independent of location, it can mean an increase of life quality and more opportunities available in the associated regions. If the municipality is big enough to have a diversified labour market it still can be resilient to digitalisation transformation as the high exposure can be balanced by apposite diversity. The time needed for adaptation to the new situation can therefore be bridged, many different qualifications already exist in the community, openness for innovation is easier as the human resources are on site [38,74]. Most probably at the beginning only a limited group could profit from the restructured economic activity but if the community is able to activate endogenous circular processes and capitalize, it can enable further economic prosperity for the region (in accordance with [75]).
      In Austria, the selection of commercial or industrial areas with good location factors is done in municipal spatial planning. However, inter-municipal cooperation in spatial planning allows selection of the best potential sites, contributing to more prosperity of the whole region. Cooperation between municipalities bands the talents and potentials together making the whole region more attractive for possible investments. It has a bigger innovation potential, which is one of the most important features for an area in times of digitalisation. Possible competition between neighbouring communities can be limited, the joint consideration and also actual cooperation allow a higher diversity of the labour market and thus a lower vulnerability. If the cooperation is successful and good transportation and communication infrastructure is provided, the variety of qualifications at hand can attract further innovative approaches resulting in higher social strength and decrease of social vulnerability. Derived from the results, which show that small towns are less vulnerable to digitalisation than suburban and rural areas, and based on further analysis of population numbers in relation to digitalisation probability, it is likely that units with more than 5000 inhabitants are generally less vulnerable to digitalisation than smaller municipalities.
The described development paths are similar in communities with the economy based on sections of the service or production sector. If the estimated probability of digitalisation is comparable, the main difference is in the temporal aspect. Generally less time and expenditure are needed to digitalise a service sector enterprise [19]. Apparently, along with easier adaptation of the enterprise comes also its easier possible disappearance.

4.1.3. Spatial Archetype of Municipalities

Whether a municipality is located in urban, suburban, or rural areas, or a small town with suburban or rural surroundings significantly determines the social vulnerability to digitalization. For each of these spatial archetypes both positive and negative development paths are thinkable.
  • Urban areas. Digitalisation as urbanisation driver:
    • Urban areas, due to the size and thus possible diversity of market, talents, knowledge and skills, offer the widest variety of opportunities both for implementation of and adaptation to digitalisation. New investments developing and implementing the solutions of the Industry 4.0 can be very profitable, positive developments can lead to cumulative growth and contribute to the attractiveness of the agglomeration, reinforcing the role of digitalisation as the key driver of urbanisation. Thereby the existing drivers of urbanisation are strengthened. The production, capital, and potential profit are higher and more concentrated in the cities than in the suburban and rural areas. It attracts people to work and to move to the cities, strengthening the global urban expansion trend.
  • Suburban areas benefit from the proximity of the city, but digitalisation leads to suburbanisation and urban sprawl:
    • The importance of distance decreases as a result of the progressive networking of business, supply, and social life. Professional relationships extend far beyond the region, but other basic needs must be provided within an accessible distance. Suburban areas, thanks to their proximity to urban infrastructure, fulfil this demand and in most European cities allow one to avoid the high costs of living in the city itself. To a larger extent, people can live in an area without establishing a real relation with the direct surroundings. Building personal relationships can take longer due to impersonality in the area, or, thanks to technology, like-minded neighbours can find each other more quickly. The digitalisation-induced deterritorialisation of work-related activities changes the cost of commuting (time, distance, and money) and, together with the already mentioned contribution to urbanisation, can likewise strengthen the suburbanisation and contribute to spread settlement development.
  • Rural areas. Deterioration of living conditions and disadvantages in provision with infrastructure:
    • The expenditures for provision of high-speed internet connection for remote areas are higher and the expected profit lower than in more central locations. It takes longer for the rural areas to get connected to broadband internet infrastructure [64]. However, the appropriate internet connection is just the beginning. Instead of increasing the attractiveness of rural areas as business locations and places of living, it can induce imbalance effects, disadvantaging the periphery like any other infrastructure that increases the accessibility and enlarges the influence area of bigger centres [76,77,78]. People are not likely to stay in a region if they do not have an appropriate job or at least realistic chances of finding it [79]. The current pattern of spatial disparities cannot be changed if the inhabitants are not prepared or not able to get qualified for the new demands of the labour market. The present regional disparities can deepen and together with the employment digitalisation can cause new deterioration and unbalances.
  • Rural areas benefit from digitalisation:
    • Intercommunal cooperation is necessary to oppose the negative digitalisation effects. As explained in Section 4.1.2., a small region composed of several municipalities is able to provide sufficient diversity to stand with and profit from the increasing complexity of the market and requirements for labour. Good broadband connections enable networked remote working. It opens up access to human resources from outside and the resources from the rural area can be mutually engaged, regardless the distance to the customer or employer. The access to knowledge and professional experience is thus also expanded and enables gaining new qualifications that correspond with the demands of the changing labour market. Furthermore, the improved location attractiveness can encourage the companies to go back or settle new business locations in the rural areas [70,80]. Decentralised production and service provision contribute to reduction of spatial disparities. They create new opportunities and if the capital thus obtained is deployed locally the endogenous development processes can be ensured [81].
  • Small towns gain importance as regional centers:
    • Both in suburban but especially in rural areas small towns can become stronger in the role of driving units of development. Therefore, it is crucial to support the small towns and provide appropriate infrastructure. The digitalisation impact is interdependent with accessibility to all kinds of infrastructure (transportation, education, health, culture, entertainment). Small towns can have advantageous or disadvantageous effects on the rural periphery, but still they are closer to the affected periphery than bigger cities. It means the infrastructure is closer to the inhabitants and contributes to the quality of life in the whole enclosed region. Decentralisation can also be beneficial as the positioning of public institutions and financial resources together with provision of good transportation and communication infrastructure contributes to transit-oriented development, helps to create functionally mixed and moderately dense spatial structures, and offloads the cities, preventing the development of agglomeration disadvantages [82,83]. A further significant factor determining the regional performance is the managerial competence. If the administrative and political regional and local management is well prepared for the future challenges it can contribute to successful participation of the considered area in transition and innovation [84].
  • Small towns. Negative effects of digitalisation; deterioration of living conditions:
    • If small towns are not able to participate in the transition they can experience negative effects of Industry 4.0. In cases of short distances to the urban areas they can lose their identity and importance to the benefit of the bigger centre. Longer distance to a city can cause stagnation or even depopulation and outmigration of enterprises to locations situated closer to the city or to the city itself. Psychosocial aspects such as general attitude to changes and self-assessment, together with the subjective perception of the chances for success, also play essential roles in the development [85]. If the society together with the governance level do not believe and do not activate the innovation potential of the area, it is hardly possible to dare to take the initiative and to progress.

4.1.4. Resume

The scenarios show that digitalisation is a development driver, but the effects might vary between opposite poles of development. Digitalisation might bridge existing gaps in the prosperity of regions or be associated with enormous threats. The results reveal that digitalisation is not going to balance or strengthen the distribution of existing spatial disparities on its own. It shall be considered that digitalization will interact with other grand challenges like, among others, demographic change, the climate crisis, energy transition, knowledge based bio-economy, globalization and urbanization and will affect the sustainability of environmental, societal and economic development [86,87,88]. The scenarios indicate that there are development paths possible where digitalization might address different challenges simultaneously, or spur inequality, poverty, environmental pressures, etc. Which of the storylines presented in the scenarios will become true depends on the political and planning frameworks, as well as on the research agendas that will be put in place in future.
The scenarios visualize potential digitalisation impacts on the regional development. Even though little is known about the possible future jobs emerging in the ongoing transformation to Industry 4.0, it seems very likely that to a great extent the new jobs will be created elsewhere than the ones prone to disappear. Urban areas offer location advantages for highly digitalized jobs [17] and at the same time, the results of the study reveal that those areas are significantly less exposed to digitalisation than other spatial archetypes. Recognition of digitalisation as a further urbanization driver supports the idea that sustainable development calls for further decentralized concentration [89] on the regional scale. This vision of sustainable regional development emphasizes the importance of strengthening small towns to provide balanced, adaptive, and innovative structures dispersed throughout the regions. Such centres of development contribute to avoid loss of identity and attractiveness, stagnation, low utilization level of infrastructure, depopulation, etc. A polycentric system of towns supports the peripheries and takes the urbanization pressure off the cities (especially the capital city of Vienna), counteracting the development of agglomeration disadvantages.
The scenarios also give hints as to how digitalisation can affect land use planning on the local level. On one hand, it can cause lower capacity utilization or even abandonment of commercial spaces (e.g., retail areas), on the other hand, there is a growing demand for more co-working and shared offices offering space for different and varying working groups, but also more space for concentrated and undisturbed work. It results in a postulate for more flexibility in the design of buildings. Furthermore, new criteria for determining the future demands of building land are needed. Digitalisation effects make clear that the now practiced planning methods relying on the extrapolation of trends of demand for commercial land will not be sufficient in future, as digitalisation will lead to major restructuring of workflows, the possibility to integrate housing and working, and the respective land use demands will very likely change. This will very likely be true for location factors for businesses and housing, as well. At the same time, digitalisation will offer new possibilities to support the revitalisation of vacancies, for example, in the centres of towns and settlements, leading to more sustainable settlement developments in mixed-use, moderately dense and compact spatial fabrics. Furthermore, less need of retail areas because of online trade might offer free space for automated production. In order to focus such developments on brownfields, the spatial planning frameworks, e.g., legal frameworks and subsidies that are more suitable for steering greenfield development in a growing society in respect to population and economy, have to be adjusted. The planning practitioners and spatial planning decision makers have to be prepared to integrate digitalisation into their considerations beyond provision of digital infrastructure. Future research should also address the questions of new planning methodologies to address the spatial effects of digitalisation.

4.2. Strengths and Weaknesses of the Study Approach

The considered development scenarios and their relation to local and regional vulnerability are further interrelated with spatial development drivers belonging to domains such as demographics, geographical location, politics, transportation infrastructure and further land uses, economy, sociology, and culture. There is much need for further research to support spatial planners and decision makers in the incorporation of the digitalisation challenges and opportunities into the local and regional planning process. The investigation of possible developments of the labour market done within the study revealed how much influence the digitalisation of current workplaces can have on the local labour markets and the respective municipalities. Farsighted consideration of digitalisation can make a significant contribution to sustainable development and efficient use of resources, especially while planning new commercial and industrial settlements.
One of the major strengths of the study is the level of detail and the extent of the input data. Consideration of the classification on the level of economic divisions delivers a thorough insight into the situation on the labour market and allows us to keep the differences between the particularities of the economic situation in the municipalities. Data extension covering the entire country enables a comparison of consistent results without gaps. A further strength of the study is the method of conversion between the labour market classification systems. A variety of included sources ranging from the official documentations to the current commercial job descriptions enabled the consideration of practically all tasks, skills and abilities needed to perform economic activities. All possible combinations of each occupation within each division were analysed separately without any generalisation. Classification of the share of each occupation’s contribution to execution of economic activities led to create a comprehensive translation system from SOC to NACE classification.
There are also limitations to be mentioned. Although the very high level of detail of the documentations of the labour market classifications allow the conversion from one classification system to the other, the rating process that was performed by the authors as described in the methods section cannot exclude some minor misinterpretation of economic activities. However, a comparison with another study done for Austria without a detailed spatial analysis and based on a different methodological approach [21] shows only minor discrepancies on the provided NACE economic section level of detail of the outcomes.
Nonetheless, the input data represent the most current available state at this level of detail, but it is based on the employee census from 2011, which does not include possible changes of the most recent years. Due to this data’s unavailability, the extension and impact of broadband internet coverage of recent years was not considered in the analyses. There is also no information available on the current grade of digitalisation of workplaces. Enterprises are at various stages of automation, which influences further digitalisation potentials. Consequently, there are no data available to judge if some of the digitalisation effects are already seen in actual developments. When looking at the employment data of Austria, so far the digitalisation already happening has not had an overall negative impact on the number of people participating in the labour market, which increased from 4.05 million (2011) people to 4.32 million (2018) people [90]. Of course, this is no indicator if certain occupations have already started to disappear. Since future developments are regarded, it is only possible to work with prognosis and therefore a calculation of the number of jobs that will actually disappear is not applicable. The study results on the municipal level should be seen in relation to each other, pointing out where the labour markets are more or less exposed to digitalisation regarding the existing work profiles. It should be mentioned again that the study focuses only on one of the global trends and any other of the currently progressing changes, e.g., globalisation, urbanisation, increasing inequality, demographic change, and environmental sustainability, were not included in the analysis. The complexity of interrelations with system drivers associated with other development domains could be approached by further research.

5. Conclusions

The digitalisation of the economy, called also the fourth industrial revolution is estimated to have a significant impact on the labour market. Like the preceding three industrial revolutions, the current one will also influence the established spatial structures and their functioning, especially when it comes to workplaces and their location. This study gives an insight into the spatial dimension of the replaceability of jobs by digitalisation in the case of Austria. It confirms that all municipalities in Austria are exposed to digitalisation and are expected to experience the disappearing of existing occupational activities as the transformation progresses. Based on the outcomes several hypotheses on possible development paths were discussed, pointing out the meaning of local and regional social vulnerability in answering to the challenges and opportunities of digitalisation. Additional to the calculated probability of digitalisation of existing jobs, the potential impact was differentiated by the characteristics of the current situation on the local labour market and spatial archetype of the municipalities. It allowed us to identify which spatial development trends can be supported or induced by digitalisation. It can be concluded that digitalisation belongs to the key driving forces of urbanisation and suburbanisation. Rural municipalities, due to the high sensitivity and lower adaptation capability, are potentially the most vulnerable to destructive digitalisation effects. To reach sustainable benefits the cooperation within small regions of several communities should be strengthened. Small towns can be reinforced in their roles as regional centres sustaining the periphery and providing the required infrastructure. The communication and high quality public transportation infrastructure between bigger cities and small towns can be an incentive for transit-oriented development. From this perspective, digitalisation effects should become a prominent spatial planning issue.
The research approach assessing spatial distribution of a technological transformation using the example of digitalisation of the labour market clearly shows that emerging technological trends should be integrated into policy making and planning by an extension of knowledge and understanding of the complexity of possible impacts from the very beginning. Thus, to achieve the best framework for strengthening the communities and ensuring equal living conditions, it is of utmost importance that further studies and observations should be conducted and published so that the knowledge basis for sustainable development can be continuously enhanced.

Author Contributions

Conceptualization, K.H. and G.S.; methodology, K.H.; software, K.H.; validation, K.H.; formal analysis, K.H.; investigation, K.H.; data curation, K.H.; writing—original draft preparation, K.H.; writing—review and editing, G.S. and K.H.; visualization, K.H.; supervision, G.S.; project administration, K.H. All authors have read and agreed to the published version of the manuscript.

Funding

This research received no external funding. The article processing was supported by BOKU Vienna Open Access Publishing Fund.

Acknowledgments

We would like to thank Bernhard Spangl for his valuable advice on statistical data evaluations.

Conflicts of Interest

The authors declare no conflict of interest.

Appendix A

Table A1. Probability of digitalisation in NACE Statistical classification of Economic Activities in the European Community.
NACE CodeEconomic Section/DivisionProbability of Digitalisation
AAgriculture, forestry and fishing0.60
A01Crop and animal production, hunting and related service activities0.62
A02Forestry and logging0.59
A03Fishing and aquaculture0.60
BMining and quarrying0.64
B05Mining of coal and lignite0.65
B06Extraction of crude petroleum and natural gas0.60
B07Mining of metal ores0.65
B08Other mining and quarrying0.65
B09Mining support service activities0.62
CManufacturing0.56
C10Manufacture of food products0.62
C11Manufacture of beverages0.56
C12Manufacture of tobacco products0.52
C13Manufacture of textiles0.55
C14Manufacture of wearing apparel0.54
C15Manufacture of leather and related products0.49
C16Manufacture of wood and of products of wood and cork, except furniture; manufacture of articles of straw and plaiting materials0.60
C17Manufacture of paper and paper products0.44
C18Printing and reproduction of recorded media0.52
C19Manufacture of coke and refined petroleum products0.57
C20Manufacture of chemicals and chemical products0.49
C21Manufacture of basic pharmaceutical products and pharmaceutical preparations0.40
C22Manufacture of rubber and plastic products0.69
C23Manufacture of other non-metallic mineral products0.63
C24Manufacture of basic metals0.70
C25Manufacture of fabricated metal products, except machinery and equipment0.71
C26Manufacture of computer, electronic and optical products0.49
C27Manufacture of electrical equipment0.56
C28Manufacture of machinery and equipment n.e.c.0.60
C29Manufacture of motor vehicles, trailers and semi-trailers0.54
C30Manufacture of other transport equipment0.52
C31Manufacture of furniture0.59
C32Other manufacturing0.54
C33Repair and installation of machinery and equipment0.58
DElectricity, gas, steam and air conditioning supply0.57
D35Electricity, gas, steam and air conditioning supply0.57
EWater supply; sewerage, waste management and remediation activities0.43
E36Water collection, treatment and supply0.42
E37Sewerage0.47
E38Waste collection, treatment and disposal activities; materials recovery0.49
E39Remediation activities and other waste management services0.35
FConstruction0.68
F41Construction of buildings0.69
F42Civil engineering0.69
F43Specialised construction activities0.66
GWholesale and retail trade; repair of motor vehicles and motorcycles0.63
G45Wholesale and retail trade and repair of motor vehicles and motorcycles0.61
G46Wholesale trade, except of motor vehicles and motorcycles0.61
G47Retail trade, except of motor vehicles and motorcycles0.66
HTransportation and storage0.65
H49Land transport and transport via pipelines0.76
H50Water transport0.61
H51Air transport0.53
H52Warehousing and support activities for transportation0.63
H53Postal and courier activities0.74
IAccommodation and food service activities0.68
I55Accommodation0.63
I56Food and beverage service activities0.72
JInformation and communication0.35
J58Publishing activities0.33
J59Motion picture, video and television programme production, sound recording and music publishing activities0.35
J60Programming and broadcasting activities0.35
J61Telecommunications0.41
J62Computer programming, consultancy and related activities0.32
J63Information service activities0.35
KFinancial and insurance activities0.66
K64Financial service activities, except insurance and pension funding0.64
K65Insurance, reinsurance and pension funding, except compulsory social security0.66
K66Activities auxiliary to financial services and insurance activities0.67
LReal estate activities0.63
L68Real estate activities0.63
MProfessional, scientific and technical activities0.35
M69Legal and accounting activities0.63
M70Activities of head offices; management consultancy activities0.32
M71Architectural and engineering activities; technical testing and analysis0.30
M72Scientific research and development0.26
M73Advertising and market research0.30
M74Other professional, scientific and technical activities0.28
M75Veterinary activities0.34
NAdministrative and support service activities0.58
N77Rental and leasing activities0.64
N78Employment activities0.46
N79Travel agency, tour operator and other reservation service and related activities0.47
N80Security and investigation activities0.49
N81Services to buildings and landscape activities0.64
N82Office administrative, office support and other business support activities0.79
OPublic administration and defence; compulsory social security0.44
O84Public administration and defence; compulsory social security0.44
PEducation0.15
P85Education0.15
QHuman health and social work activities0.25
Q86Human health activities0.30
Q87Residential care activities0.26
Q88Social work activities without accommodation0.21
RArts, entertainment and recreation0.44
R90Creative, arts and entertainment activities0.17
R91Libraries, archives, museums and other cultural activities0.57
R92Gambling and betting activities0.55
R93Sports activities and amusement and recreation activities0.46
SOther service activities0.44
S94Activities of membership organizations0.26
S95Repair of computers and personal and household goods0.65
S96Other personal service activities0.42

References

  1. Gartner Digitalization-Gartner IT Glossary. Available online: https://www.gartner.com/it-glossary/digitalization/ (accessed on 8 January 2019).
  2. WEF Digital Transformation Initiative. Executive Summary; World Economic Forum: Geneva, Switzerland, 2018. [Google Scholar]
  3. WEF. The Future of Jobs Report 2018; World Economic Forum: Geneva, Switzerland, 2018; ISBN 978-1-944835-18-7. [Google Scholar]
  4. Conti, M.; Passarella, A.; Das, S.K. The Internet of People (IoP): A new wave in pervasive mobile computing. Pervasive Mob. Comput. 2017, 41, 1–27. [Google Scholar] [CrossRef]
  5. INFRAS. Digitalisierung und Neue Regionalpolitik (NRP); INFRAS, Ed.; Staatssekretariat für Wirtschaft SECO, Direktion für Standortförderung, Regional- und Raumordnungspolitik: Zürich, Switzerland, 2018. [Google Scholar]
  6. Soriano, J.; Heitz, C.; Hutter, H.-P.; Fernández, R.; Hierro, J.J.; Vogel, J.; Edmonds, A.; Bohnert, T.M. Internet of Services. In Evolution of Telecommunication Services: The Convergence of Telecom and Internet: Technologies and Ecosystems; Bertin, E., Crespi, N., Magedanz, T., Eds.; Lecture Notes in Computer Science; Springer: Berlin/Heidelberg, Germany, 2013; pp. 283–325. ISBN 978-3-642-41569-2. [Google Scholar]
  7. Acemoglu, D.; Restrepo, P. The Race between Man and Machine: Implications of Technology for Growth, Factor Shares, and Employment. Am. Econ. Rev. 2018, 108, 1488–1542. [Google Scholar] [CrossRef] [Green Version]
  8. Autor, D.H. Why Are There Still So Many Jobs? The History and Future of Workplace Automation. J. Econ. Perspect 2015, 29, 3–30. [Google Scholar] [CrossRef] [Green Version]
  9. Kim, Y.J.; Kim, K.; Lee, S. The rise of technological unemployment and its implications on the future macroeconomic landscape. Futures 2017, 87, 1–9. [Google Scholar] [CrossRef]
  10. Vermeulen, B.; Kesselhut, J.; Pyka, A.; Saviotti, P.; Vermeulen, B.; Kesselhut, J.; Pyka, A.; Saviotti, P.P. The Impact of Automation on Employment: Just the Usual Structural Change? Sustainability 2018, 10, 1661. [Google Scholar] [CrossRef] [Green Version]
  11. Azmi, A.N.; Kamin, Y.; Noordin, M.K.; Nasir, A.N.M. Towards Industrial Revolution 4.0: Employers’ Expectations on Fresh Engineering Graduates. Int. J. Eng. Technol. 2018, 7, 267–272. [Google Scholar]
  12. Hanley, T.; Daecher, A.; Cotteleer, M.; Sniderman, B. The Industry 4.0 paradox. Available online: https://documents.deloitte.com/insights/DeloitteReview24 (accessed on 20 January 2020).
  13. Goos, M.; Manning, A.; Salomons, A. Job Polarization in Europe. Am. Econ. Rev. 2009, 99, 58–63. [Google Scholar] [CrossRef] [Green Version]
  14. Degryse, C. Digitalisation of the Economy and its Impact on Labour Markets. SSRN J. 2016. [Google Scholar] [CrossRef] [Green Version]
  15. Loi, M. Technological unemployment and human disenhancement. Ethics Inf. Technol. 2015, 17, 201–210. [Google Scholar] [CrossRef]
  16. Acemoglu, D. Restrepo, Pascual Robots and Jobs: Evidence from US Labor Markets. J. Political Econ. 2019. [Google Scholar] [CrossRef] [Green Version]
  17. Firgo, M.; Mayerhofer, P.; Peneder, M.; Piribauer, P.; Reschenhofer, P. Beschäftigungseffekte der Digitalisierung in den Bundesländern sowie in Stadt und Land; Österreichisches Institut für Wirtschaftsforschung: Vienna, Austria, 2018. [Google Scholar]
  18. Frey, C.B.; Osborne, M.A. The future of employment: How susceptible are jobs to computerisation? University of Oxford: Oxford, UK, 2013. [Google Scholar]
  19. McKinsey Global Institute. A Future That Works: Automation, Employment and Productivity; McKinsey & Company: New York, NY, USA, 2017. [Google Scholar]
  20. Bonin, H.; Gregory, T.; Zierahn, U. Kurzexpertise Nr. 57 Übertragung der Studie von Frey/Osborne (2013) auf Deutschland; Zentrum für Europäische Wirtschaftsforschung GmbH: Mannheim, Germany, 2015; p. 50. [Google Scholar]
  21. Nagl, W.; Titelbach, G.; Valkova, K. Digitalisierung der Arbeit: Substituierbarkeit von Berufen im Zuge der Automatisierung durch Industrie 4.0; Institut für Höhere Studien: Wien, Austria, 2017; p. 45. [Google Scholar]
  22. Partzsch, D. Daseinsgrundfunktionen. In Handwörterbuch der Raumforschung und Raumordnung; Verlag der Akademie für Raumforschung und Landesplanung: Hannover, Germany, 1970; pp. 424–430. [Google Scholar]
  23. Läpple, D. Essay über den Raum. Für eingesellschaftswissenschaftliches Raumkonzept. In Stadt und Raum: Soziologische Analysen; Häussermann, H., Ed.; Stadt, Raum und Gesellschaft; Centaurus-Verlagsgesellschaft: Pfaffenweiler, Germany, 1991; pp. 157–207. ISBN 978-3-89085-552-3. [Google Scholar]
  24. Gladden, M.E. Who Will Be the Members of Society 5.0? Towards an Anthropology of Technologically Posthumanized Future Societies. Soc. Sci. 2019, 8, 148. [Google Scholar] [CrossRef] [Green Version]
  25. ARL. Handwörterbuch der Stadt- und Raumentwicklung Band 1 Band 1; ARL, Ed.; Akademie für Raumforschung und Landesplanung: Hannover, Germany, 2018; ISBN 978-3-88838-560-5. [Google Scholar]
  26. EU. Territoriale Agenda der Europäischen Union 2020 - Für ein integratives, intelligentes und nachhaltiges Europa der vielfältigen Regionen; Treffen der für Raumordnung und territoriale Entwicklung zuständigen Ministerinnen und Minister: Gödöllő, Ungarn, 2011. [Google Scholar]
  27. ARL. Daseinsvorsorge und gleichwertige Lebensverhältnisse neu denken. Perspektiven und Handlungsfelder. Positionspapier aus der ARL 108; ARL, Ed.; Akademie für Raumforschung und Landesplanung: Hannover, Germany, 2016. [Google Scholar]
  28. Stöglehner, G. Conceptualising Quality in Spatial Planning. Spat. Res. Plan. 2019, 77, 1–15. [Google Scholar] [CrossRef] [Green Version]
  29. Miller, F.; Osbahr, H.; Boyd, E.; Thomalla, F.; Bharwani, S.; Ziervogel, G.; Walker, B.; Birkmann, J.; van der Leeuw, S.; Rockström, J.; et al. Resilience and Vulnerability: Complementary or Conflicting Concepts? Ecol. Soc. 2010, 15. [Google Scholar] [CrossRef]
  30. Cutter, S.L.; Boruff, B.J.; Shirley, W.L. Social Vulnerability to Environmental Hazards*. Soc. Sci. Q. 2003, 84, 242–261. [Google Scholar] [CrossRef]
  31. Adger, W.N. Vulnerability. Glob. Environ. Chang. 2006, 16, 268–281. [Google Scholar] [CrossRef]
  32. McCarthy, J.J.; Canziani, O.F.; Leary, N.A.; Dokken, D.J.; White, K.S. Climate Change 2001: Impacts, Adaptation, and Vulnerability: Contribution of Working Group II to the Third Assessment Report of the Intergovernmental Panel on Climate Change; Cambridge University Press: Cambridge, UK; New York, NY, USA, 2001; ISBN 978-0-521-80768-5. [Google Scholar]
  33. Turner, B.L.; Kasperson, R.E.; Matson, P.A.; McCarthy, J.J.; Corell, R.W.; Christensen, L.; Eckley, N.; Kasperson, J.X.; Luers, A.; Martello, M.L.; et al. A framework for vulnerability analysis in sustainability science. Proc. Natl. Acad. Sci. USA 2003, 100, 8074–8079. [Google Scholar] [CrossRef] [Green Version]
  34. Gallopín, G.C. Linkages between vulnerability, resilience, and adaptive capacity. Glob. Environ. Chang. 2006, 16, 293–303. [Google Scholar] [CrossRef]
  35. Smit, B.; Wandel, J. Adaptation, adaptive capacity and vulnerability. Glob. Environ. Chang. 2006, 16, 282–292. [Google Scholar] [CrossRef]
  36. Wisner, B.; Blaikie, P.; Cannon, T.; Davis, I. At. Risk: Natural Hazards, People’s Vulnerability and Disasters; Taylor & Francis: Abingdon, UK, 1994; ISBN 978-0-203-44423-8. [Google Scholar]
  37. Woolcock, M. Social capital and economic development: Toward a theoretical synthesis and policy framework. Theory Soc. 1998, 27, 151–249. [Google Scholar] [CrossRef]
  38. Hat, K.; Stöglehner, G. How Resilient is Growth? Resilience Assessment of Austrian Municipalities on the Basis of Census Data from 1971 to 2011. Sustainability 2019, 11, 1818. [Google Scholar] [CrossRef] [Green Version]
  39. Pajarinen, M.; Rouvinen, P.; Ekeland, A. Computerization Threatens One-Third of Finnish and Norwegian Employment; Brief. No 34; ETLA: Helsinki, Finland, 2015. [Google Scholar]
  40. Arntz, M.; Gregory, T.; Zierahn, U. The Risk of Automation for Jobs in OECD Countries: A Comparative Analysis; OECD Social, Employment and Migration Working Papers, No. 189; OECD Publishing: Paris, France, 2016. [Google Scholar]
  41. Autor, D.H.; Levy, F.; Murnane, R.J. The skill content of recent technological change: An empirical exploration. Q. J. Econ. 2003, 1279–1333. [Google Scholar] [CrossRef]
  42. Berger, T.; Frey, C.B. Future Shocks and Shifts: Challenges for the Global Workforce and Skills Development; OECD Research Paper EDU/EDPC/RD(2015)20; OECD Publishing: Paris, France, 2017. [Google Scholar]
  43. Bakhshi, H.; Downing, J.M.; Osborne, M.A.; Schneider, P. The Future of Skills: Employment in 2030; Pearson: United Kingdom, 2017; ISBN 978-0-9924259-5-1. [Google Scholar]
  44. Scholz, R.W.; Bartelsman, E.J.; Diefenbach, S.; Franke, L.; Grunwald, A.; Helbing, D.; Hill, R.; Hilty, L.; Höjer, M.; Klauser, S.; et al. Unintended Side Effects of the Digital Transition: European Scientists’ Messages from a Proposition-Based Expert Round Table. Sustainability 2018, 10, 2001. [Google Scholar] [CrossRef] [Green Version]
  45. OECD. OECD Skills Outlook 2013: First Results from the Survey of Adult Skills; OECD: Paris, France, 2013; ISBN 978-92-64-20398-3. [Google Scholar]
  46. U.S. Bureau of Labor Statistics Standard Occupational Classification (SOC) System. Available online: https://www.bls.gov/soc/2010/#classification (accessed on 28 August 2019).
  47. Nedelkoska, L.; Quintini, G. Automation, Skills Use and Training; OECD Social, Employment and Migration Working Papers, No. 202; OECD Publishing: Paris, France, 2018. [Google Scholar]
  48. OECD. OECD Skills Strategy 2019: Skills to Shape a Better Future; OECD: Paris, France, 2019; ISBN 978-92-64-31382-8. [Google Scholar]
  49. Arbeitsstätten und Beschäftigte nach Abschnitten der ÖNACE 2008 2015. Available online: https://www.wien.gv.at/statistik/pdf/wirtschaft2017.pdf (accessed on 27 February 2020).
  50. Statistik Austria. Systematik der Wirtschaftstätigkeiten, ÖNACE 2008; Statistik Austria, Ed.; Verl. Österreich: Wien, Austria, 2008; ISBN 978-3-902587-74-9. [Google Scholar]
  51. U.S. BLS 2010 Standard Occupational Classification System. Available online: https://www.bls.gov/soc/2010/2010_major_groups.htm (accessed on 16 June 2019).
  52. Statistik Austria Bevölkerung. Available online: https://www.statistik.at/web_de/statistiken/menschen_und_gesellschaft/bevoelkerung/index.html (accessed on 7 August 2019).
  53. Statistik Austria Arbeitsmarkt. Available online: http://www.statistik.at/web_de/statistiken/menschen_und_gesellschaft/arbeitsmarkt/index.html (accessed on 7 August 2019).
  54. Statistik Austria Abgestimmte Erwerbsstatistik und Arbeitstättenzählung 2017 2017. Available online: https://www.zbw.eu/econis-archiv/bitstream/handle/11159/2026/arbeitsmarktstatistiken_2017.pdf?sequence=1&isAllowed=y (accessed on 27 February 2020).
  55. WEF. The Global Competitiveness Report 2017-2018; Klaus Schwab; World Economic Forum: Geneva, Switzerland, 2017. [Google Scholar]
  56. European Commission. The EU Regional Competitiveness Index 2016; Working Papers 02/2017; European Union: Brussels, Belgium, 2017; ISBN 978-92-79-65839-6. [Google Scholar]
  57. Eurostat First Estimates If Research & Development Expenditure. Available online: https://ec.europa.eu/eurostat/documents/2995521/9483597/9-10012019-AP-EN.pdf/856ce1d3-b8a8-4fa6-bf00-a8ded6dd1cc1 (accessed on 28 August 2019).
  58. Bris, A.; Cabolis, C. IMD World Digital Competitiveness Ranking 2018; IMD World Competitiveness Center: Lausanne, Switzerland, 2018. [Google Scholar]
  59. Stöglehner, G. Raum- und Siedlungstypen. In Grundlagen der Raumplanung 1 Theorien, Methoden, Instrumente.; Stöglehner, G., Ed.; Facultas: Wien, Austria, 2019; pp. 149–168. ISBN 978-3-7089-1382-7. [Google Scholar]
  60. Akoglu, H. User’s guide to correlation coefficients. Turk. J. Emerg Med. 2018, 18, 91–93. [Google Scholar] [CrossRef] [PubMed]
  61. OECD. Job Creation and Local Economic Development 2018: Preparing for the Future of Work; Job Creation and Local Economic Development; OECD: Paris, France, 2018; ISBN 978-92-64-30533-5. [Google Scholar]
  62. Mäntysalo, R.; Grišakov, K. Framing ‘evidence’ and scenario stories in strategic spatial planning. In Situated Practices of Strategic Planning: An International Perspective; Albrechts, L., Balducci, A., Hillier, J., Eds.; Routledge Taylor & Francis Group: London, UK; New York, NY, USA, 2017; ISBN 978-1-138-93256-2. [Google Scholar]
  63. UN General Assembly Transforming Our World: The 2030 Agenda for Sustainable Development, A/RES/70/1. Available online: https://sustainabledevelopment.un.org/content/documents/21252030%20Agenda%20for%20Sustainable%20Development%20web.pdf (accessed on 23 November 2017).
  64. BMVIT Breitbandatlas Österreich. Available online: https://breitbandatlas.info/ (accessed on 5 November 2019).
  65. Mokyr, J.; Vickers, C.; Ziebarth, N.L. The History of Technological Anxiety and the Future of Economic Growth: Is This Time Different? J. of Econ. Perspect. 2015, 29, 31–50. [Google Scholar] [CrossRef] [Green Version]
  66. Putnam, R.D. What makes democracy work? Natl. Civ. Rev. 1993, 82, 101–107. [Google Scholar] [CrossRef]
  67. Euracademy Association. The Role of Education and Lifelong Learning in Sustainable Rural Development; European Academy for Sustainable Rural Development: Athens, Greece, 2009; p. 74. [Google Scholar]
  68. Meyer, J.; Pillei, M.; Zimmermann, F.; Stöglehner, G. Customized Education as a Framework for Strengthening Collaboration between Higher Education Institutions and Regional Actors in Sustainable Development—Lessons from Albania and Kosovo. Sustainability 2018, 10, 3941. [Google Scholar] [CrossRef] [Green Version]
  69. Keupp, M.M.; Gassmann, O. Resource constraints as triggers of radical innovation: Longitudinal evidence from the manufacturing sector. Res. Policy 2013, 42, 1457–1468. [Google Scholar] [CrossRef]
  70. Dachs, B.; Kinkel, S.; Jäger, A. Bringing it all back home? Backshoring of manufacturing activities and the adoption of Industry 4.0 technologies. J. World Bus. 2019, 54, 101017. [Google Scholar] [CrossRef] [Green Version]
  71. Tate, W.L.; Ellram, L.M.; Schoenherr, T.; Petersen, K.J. Global competitive conditions driving the manufacturing location decision. Bus. Horiz. 2014, 57, 381–390. [Google Scholar] [CrossRef]
  72. Wink, R.; Kirchner, L.; Koch, F.; Speda, D. Wirtschaftliche Resilienz in deutschsprachigen Regionen; Springer Fachmedien Wiesbaden: Wiesbaden, Germany, 2016; ISBN 978-3-658-09822-3. [Google Scholar]
  73. Balsmeier, B.; Woerter, M. Is this time different? How digitalization influences job creation and destruction. Res. Policy 2019, 48, 103765. [Google Scholar] [CrossRef]
  74. Norris, F.H.; Stevens, S.P.; Pfefferbaum, B.; Wyche, K.F.; Pfefferbaum, R.L. Community Resilience as a Metaphor, Theory, Set of Capacities, and Strategy for Disaster Readiness. Am. J. Community Psychol. 2008, 41, 127–150. [Google Scholar] [CrossRef] [PubMed]
  75. Romer, P.M. Endogenous Technological Change. J. Political Econ. 1990, 98, 71–102. [Google Scholar] [CrossRef] [Green Version]
  76. Kim, J.Y.; Han, J.H. Straw effects of new highway construction on local population and employment growth. Habitat Int. 2016, 53, 123–132. [Google Scholar] [CrossRef]
  77. Myrdal, G. Economic Theory and Underdeveloped Regions; Duckworth: London, UK, 1957. [Google Scholar]
  78. Prebisch, R. Commercial Policy in the Underdeveloped Countries. Am. Econ. Rev. 1959, 49, 251–273. [Google Scholar]
  79. Peer, V.; Penker, M. Higher Education Institutions and Regional Development: A Meta-analysis. Int. Reg. Sci. Rev. 2016, 39, 228–253. [Google Scholar] [CrossRef]
  80. Stadtgemeinde Lienz Zukunftsraum Lienzer Talboden. Available online: http://www.zukunftsraumlienzertalboden.at/ (accessed on 26 November 2019).
  81. Tödtling, F. Endogenous approaches to local and regional development policy. In Handbook of Local and Regional Development; Routledge: Abingdon-on-Thames, UK, 2014; ISBN 978-0-203-84239-3. [Google Scholar]
  82. Śleszyński, P. Polska średnich miast. Założenia i koncepcja deglomeracji w Polsce; Klub Jagielloński: Warszawa, Poland, 2018. [Google Scholar]
  83. Stöglehner, G.; Manhart, V. Leitbilder in der Planung. In Grundlagen der Raumplanung 1 Theorien, Methoden, Instrumente.; Stöglehner, G., Ed.; Facultas: Wien, Austria, 2019; pp. 121–148. ISBN 978-3-7089-1382-7. [Google Scholar]
  84. Robinson, M. Does Decentralisation Improve Equity and Efficiency in Public Service Delivery Provision? IDS Bull. 2007, 38, 7–17. [Google Scholar] [CrossRef] [Green Version]
  85. Rosenthal, R.; Jacobson, L. Pygmalion in the classroom. Urban. Rev. 1968, 3, 16–20. [Google Scholar] [CrossRef]
  86. Kallerud, E.; Amanatidou, E.; Upham, P.; Nieminen, M.; Klitkou, A.; Sutherland Olsen, D.; Toivanen, M.L.; Oksanen, J.; Scordato, L. Dimensions of Research and Innovation Policies to Address Grand and Global Challenges; Working Paper 13/2013; Nordisk institutt for studier av innovasjon, forskning og utdanning: Oslo, Norway, 2013. [Google Scholar]
  87. Kuhlmann, S.; Rip, A. Next-Generation Innovation Policy and Grand Challenges. Sci. Public Policy 2018, 45, 448–454. [Google Scholar] [CrossRef] [Green Version]
  88. National Research Council. Understanding the Changing Planet: Strategic Directions for the Geographical Sciences; National Research Council: Washington, DC, USA, 2010; ISBN 978-0-309-15075-0. [Google Scholar]
  89. Motzkus, A.H. Dezentrale Konzentration--Leitbild für eine Region. der kurzen Wege? auf der Suche nach einer verkehrssparsamen Siedlungsstruktur als Beitrag für eine nachhaltige Gestaltung des Mobilitätsgeschehens in der Metropolregion Rhein-Main; Bonner geographische Abhandlungen; In Kommission bei Asgard-Verlag: Sankt Augustin, Germany, 2002; ISBN 978-3-537-87657-7. [Google Scholar]
  90. Statistik Austria Erwerbstätige. Available online: http://www.statistik.at/web_de/statistiken/menschen_und_gesellschaft/arbeitsmarkt/erwerbstaetige/index.html (accessed on 17 February 2020).
Figure 1. Study inputs and outputs overview.
Sustainability 12 01852 g001
Figure 2. Distribution of employees by economic sector and NACE economic sections in Austria.
Sustainability 12 01852 g002
Figure 3. Spatial (A) and proportional (B) distribution of spatial archetypes in Austria.
Sustainability 12 01852 g003
Figure 4. Probability of digitalisation assigned to the NACE economic sections and divisions. The green colour is used for the 10% lowest exposed divisions, the red colour for the 10% highest exposed divisions. The grey colour illustrates the results for the economic sections.
Sustainability 12 01852 g004
Figure 5. (A) Share of municipalities by spatial archetype below the 25th percentile, in the interquartile range, and above the 75th percentile. (B) Digitalisation probability per municipality.
Sustainability 12 01852 g005
Figure 6. Vulnerability of the labour market to digitalisation.
Sustainability 12 01852 g006
Figure 7. Digitalisation probability by spatial archetypes.
Sustainability 12 01852 g007
Table 1. Projection for future development of the most clearly affected tasks, skills, and abilities due to digital transformation after [3,10,11,42,43,44].
Easily Substitutable, Decreased Future DemandGaining Importance, Emerging, Increased Future Demand
TasksRoutine work (well-defined procedures and complex tasks definable into repeatable procedures)
Accessing and storing information
Routine analytic work
Administrative and clerking tasks
Office and administrative support/tasks
Manual tasks (with high predictability)
Routine technical and mechanical tasks
Tasks with marginal importance of face-to-face interactions
Transportation and material moving
Elementary storage and sales tasks
Executing rules
Manufacturing and production tasks
Process, plant, machine and system operation
Repeatable procedures with high predictability
Non-routine social and higher-order cognitive skills
Therapy
Sports and fitness
Complex problem solving
Mathematical reasoning
Specialised digital skills
Judgement, reasoning and decision making
Writing
Systems analysis
System evaluation
Science, research, engineering and technology tasks
Coordination
Teaching and education, instructing
Development and accompanying of AI and machine learning
Service and solution designing
Skills and AbilitiesOperation and control/monitoring
Equipment maintenance
Equipment selection
Installation
Precision
Static strength
Control precision
Oral expression
Active listening
Active learning
Socio-emotional skills and ability to care for others
Social perceptiveness
Interpersonal skills (teamwork and communication)
Originality, creative thinking and fluency of ideas
Design
Critical thinking, inductive reasoning
Learning strategies
Leadership, entrepreneurship
Service orientation
Advanced IT skills
Table 2. Classification of share of the occupational activities for the respective branches of economy.
ClassImportance of the Occupational ActivityEstimated Share in the Economic Division (%)Estimated Workload per Week (Full Time Week of 40 h as Basis) (h)
ICore occupational activity60.024
IIImportant occupational activity30.012
IIISecondary occupational activity7.53
IVMarginal occupational activity2.51
VIrrelevant occupational activity0.00
Table 3. Major occupation groups according to ISCO-08 Classification.
Major Occupational GroupShare of Employees
Armed forces Occupations0.5%
Managers6.0%
Professionals15.5%
Technicians and Associate Professionals20.2%
Clerical Support Workers10.8%
Services and Sales Workers16.0%
Skilled Agricultural, Forestry and Fishery Workers4.0%
Craft and Related Trades Workers11.7%
Plant and Machine Operators, and Assemblers6.0%
Elementary Occupation7.3%
Source: OECD 2013.
Table 4. Share of the municipalities with the lowest and the highest results proportionally to the number of municipalities in each federal state.
Federal StateMunicipalities
below the 25th Percentile
Municipalities
above the 75th Percentile
Burgenland30%17%
Carinthia23%14%
Lower Austria31%15%
Upper Austria23%19%
Salzburg21%22%
Styria19%40%
Tirol20%37%
Vorarlberg25%33%
Vienna91%0%
Table 5. Share of the municipalities of each spatial archetype in the lowest and the highest results.
Spatial ArchetypeMunicipalities
below the 25th Percentile
Municipalities
above the 75th Percentile
Urban area93%0%
Suburban area30%17%
Suburban small town49%9%
Rural small town40%19%
Rural area16%32%

