Article

Heavy-Metal Pollution Characteristics and Influencing Factors in Agricultural Soils: Evidence from Shuozhou City, Shanxi Province, China

1
School of Land Science and Technology, China University of Geosciences, No. 29, Xueyuan Road, Haidian District, Beijing 100083, China
2
Key Lab of Land Consolidation and Rehabilitation, the Ministry of Natural Resources, Beijing 100035, China
3
Technical Centre for Soil, Agricultural and Rural Ecology and Environment, Ministry of Ecology and Environment, Beijing 100012, China
*
Authors to whom correspondence should be addressed.
Sustainability 2020, 12(5), 1907; https://doi.org/10.3390/su12051907
Submission received: 10 February 2020 / Revised: 1 March 2020 / Accepted: 2 March 2020 / Published: 3 March 2020

Abstract

:
Although soil quality can be highly altered by mining activities, there are few reports on soil pollution in mining cities. We systematically characterized the heavy metals (HMs) pollution, risks, sources, and influencing factors in the surrounding soils of Shuozhou. Specifically, 146 samples were collected, and the potential ecological risk index (RI) and the single-factor index were jointly used to understand the environmental risk of HMs. Meanwhile, correlation analysis was applied to find the influencing factors of HMs. The results of the soil pollution risk assessment in the entire area of Shuozhou were compared with those in the open-pit mine area. (1) The mean concentrations of Cr, As, Cd, Pb, and Hg in our study were found to be higher than the background value. The RI results indicated that most soil samples (82.88%) in Shuozhou had a low potential ecological risk. Compared with the Pingshuo open-pit mine (average RI value: 200.07), the potential ecological RI was lower. (2) The HM correlation indicated that Cr and As were associated with the parent rock, whereas Cd, together with Hg and Pb, were associated with anthropic activities. (3) There was no significant correlation between HM concentrations and farmland slope. Located in the Datong Basin, the terrain of Shuozhou is relatively flat and open and has little impact on the distribution of HMs. (4) Only Hg and Pb have a negative correlation with pH. This suggests that soil with a lower pH value may be beneficial to the accumulation of Hg and Pb in soil. (5) Among the eight industry types examined, the pollution capacity level of the leather, fur, feather, and footwear industries is the strongest, indicating that HMs around LI industry sites represent the maximum level among the eight types.

1. Introduction

Soil heavy metal (HM) pollution accompanies rapid urbanization and industrialization and has attracted increasing attention [1]. Levels exceeding the standard rates of HMs are related to the industrialization of cities in China. The sources of HMs in soil include both natural and anthropogenic ones; the natural sources are influenced by the parent materials in the soil, while human activities are becoming more complex with increasing urbanization and industrialization [2]. Therefore, the issue of HM pollution related to human activities is even more complex [3]. HMs in urban soil have a direct impact on human health owing to their presence in floating dust, and their accumulation in plant parts such as fruits [4]. In addition, long-term HM emissions lead to a decline in soil buffer capacity and groundwater pollution [5]; thus, industrial modernization and human activities intensify soil pollution. In these areas, more attention should be paid to soil HM pollution management [6].
Accumulations of HMs have high spatial heterogeneity and are affected by multiple factors, such as land-use patterns, population, and industrialization [7]. Urbanization not only affects the content of HMs in soil but also affects the spatial distribution pattern of HMs in the soil [8]. Due to the different industry types and magnitudes of emissions, the pollution characteristics of HMs are different in different cities. In most urban areas in China, the concentrations of HMs exceed background values. Except for cities such as Lhasa, Xining, and Urumqi, most cities have HM contamination in urban areas [9]. Farmland is viewed as a large and long-term sink for metal elements and other pollutants. In recent decades, heavy metal contamination in farmland has drawn public attention globally due to its potential effects on food safety and human health. (A comprehensive mitigation strategy for heavy metal contamination of farmland around mining areas is needed—screening of low accumulated cultivars, soil remediation, and risk assessment). Many researchers have investigated the potential influencing factors of HM pollution in farmland. In Beijing, China, the accumulation of Cd and Hg was found to be affected by the density of industry [10]. In Changzhou and Taiyuan, agricultural production was the main influencing factor of farmland HM pollution [11,12]. Traffic conditions were proved to be a factor that influences HM concentrations in terms of spatial distribution. For example, an early study [13] found that the distribution of HMs was related to the railway distribution in the farmland of Chaohu Lake. HM concentrations in subsurface soils were also found to be associated with mining activities [14], such as rock blasting, stripping transportation, and solid waste disposal. In a retired uranium mine, the main sources of HM pollution were the mine tailing, electroplating process, and chemical industries [15]. Around a molybdenum mine, barren land was the most polluted [16].
The existing studies have mainly focused on the influencing factors from the point of view of their different types, such as industry, agriculture, and traffic activities. Few studies have focused on specific factors. In this study, the farmland soils of Shuozhou City in Shanxi Province were used as the research object to test and analyze the contents of five HMs—Cd, Hg, As, Pb, and Cr—and to evaluate the pollution degree and potential ecological risk, as well as to discuss the main influencing factors. The objectives were to: (1) understand the pollution status of HMs in the soils of Shuozhou, (2) identify natural and anthropogenic sources of these HMs, and (3) analyze the correlation between HM concentrations and different soil factors. This study will provide a reference for the study of soil HM pollution and soil environmental quality management in mining cities.

2. Materials and Methods
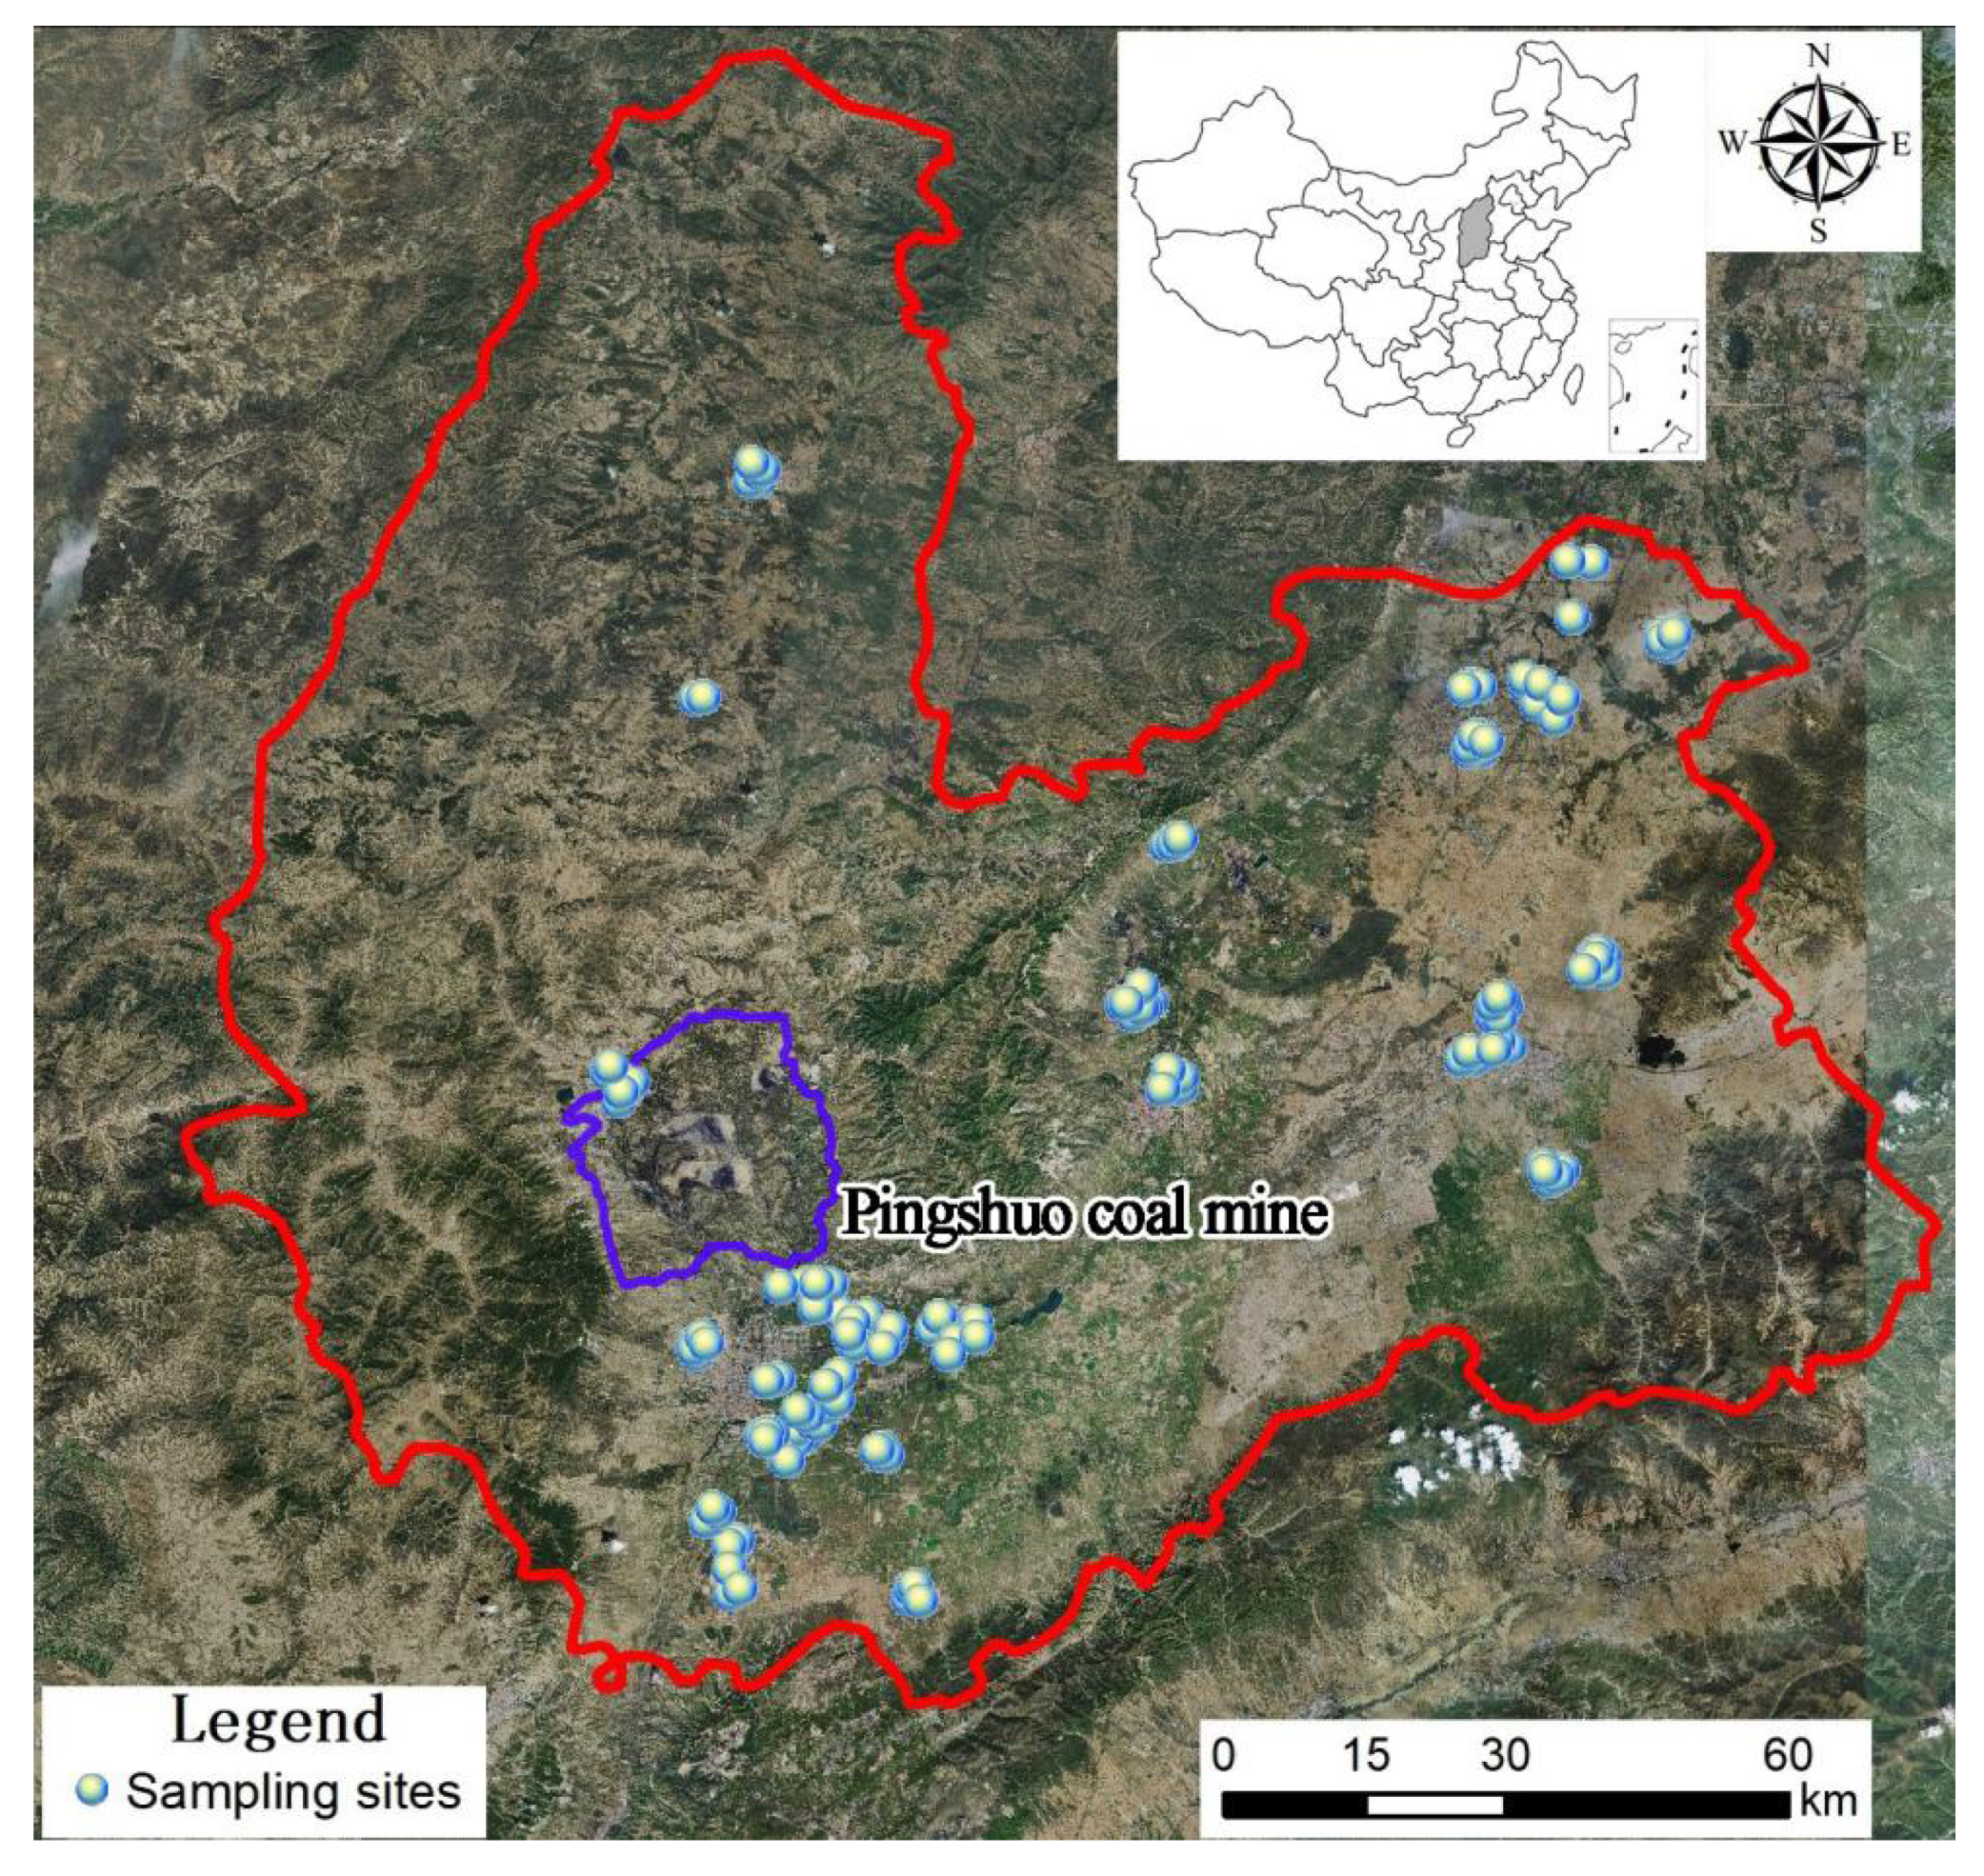
2.1. Study Area

Shuozhou, located in the northwest of Shanxi Province, is one of the 63 coal-resource-based cities in the national sustainable development plan of resource-based cities (2013–2020). Pingshuo open-pit mine, located in Pinglu district of Shuozhou city, is one of the largest open-pit coal mines in China.

2.2. Collection of Soil Samples

From 2016 to 2017, 146 soil samples (0–20 cm) were collected from typical large-scale agricultural land near the industrial site, with the support of the national open pit ecological environment research plan. Sample locations and site conditions, including the types of farmland, industry, and parent material, were recorded during the sampling. The sample sites are shown in Figure 1.

2.3. Data Sources

According to Landsat 7 ETM Remote sensing images (http://www.gscloud.cn), the boundary of the Pingshuo open pit coal mine was delineated. We used ArcGIS 10.2 (ESRI, 2009) to derive terrain factors from DEM (http://www.resdc.cn/) and to calculate slope data.

2.4. Methods

2.4.1. Processing of Soil Samples

After the process of air-drying, grinding, and sieving through 100-mesh sieves (0.15 mm), the concentrations of HMs were analyzed by using inductively coupled plasma mass spectrometry (7900, Thermo Electron Corporation). In order to ensure the measurement quality, the HM concentration in the blank and sample (in duplicate) was measured according to the standard reference obtained from the China National Standard Substance Center.

2.4.2. Potential Ecological Risk Assessment

The potential ecological risk index (RI) [17] was used to evaluate the potential ecological risk of HMs in farmland in Shuozhou City. This method not only reflects the impact of all pollutants in a particular environment, but also reveals the substances that should be paid special attention to through the RI, which is especially instrumental for the control of pollution. Its calculation formula is:
C f i = C s i / C n i ,   C d = i n C f i ,   E r i = T r i C f i R I = i n E r i = i n T r i C f i / C n i
where C f i is the pollution coefficient of an HM, C s i is the measured value of HM I, and C n i is the reference value needed for the calculation. Here, C d is the degree of contamination from HMs, T r i is the toxic response factor of HM I, and E r i is the potential ecological risk factor of a single HM. The RI indicates the comprehensive potential ecological risk index, and the classification criteria of pollution degree are shown in Table 1
Scholars in various countries select different reference values. Some use the mean concentration of HMs in shale as the global reference value. Some use the local sediment HM background value as the reference value. However, Hakanson (1980) proposed adopting the maximum value of HMs in sediments before the advent of modern industry as the reference value. To reflect the HM pollution of reclaimed soil in the study area better, the soil background value of the Yanbei area of Shanxi Province, where the Antaibao open-pit coal mine was built, was selected as the reference value (see Table 2).
The toxicity coefficient of metal reveals their harmful effects on the human body and aquatic ecosystems and reflects their toxicity levels as well as the sensitivity of organisms to HM pollution. Based on the standardized HM toxicity coefficients developed by Hakanson (1980), the biotoxicity coefficients of Cd, Cr, Pb, Hg, and As were set to 20, 2, 5, 28, and 10, respectively.

2.4.3. Statistical Analysis

Using SPSS 22.0 and Excel 2013, statistical analysis was performed. Pearson correlation analysis was applied to find the influencing factors of HMs. A one-way ANOVA with the LSD post-hoc test was used to test the significant differences between the mean values of soil parameters. A P value ≤ 0.05 was considered statistically significant.
Accounting for the large fluctuations in different HM concentrations, the data were standardized according to a data standardization method (min-max normalization) [18]; the formula is as follows:
y i = x i min [ x ] max [ x ] min [ x ]
where max[x] and min[x] are the maximum and minimum values of the sample data, respectively.

3. Results and Discussion

3.1. Soil HM Content

The comparison of HM concentrations in sampling soils with background values is a direct reflection of local HM pollution. The background values of HMs in Shuozhou were taken from existing research which has given the background values of the Yanbei area of Shanxi Province (the area includes the Pingshuo open-pit mine and Shuozhou) [19]. The mean concentrations of HMs higher than the background values were Cd: 0.117 ± 0.042, Hg: 0.03 ± 0.21, As: 9.629 ± 1.704, Pb: 21.328 ± 3.827, and Cr: 55.609 ± 8.924 mg kg-1 (Table 2). Compared with Chinese environmental quality standards for soils (GB15618-2018), five HMs did not exceed the limit values. According to the classification of the coefficient of variation (CV) by Nielsen and Bouma (1985), it was found that the concentrations of As, Pb, and Cr show low variability (CV < 0.2), whereas Cd showed moderate variability (CV = 0.358) and Hg showed high variability (CV = 0.7) [20], implying that human activities may be an important pollution source for Cd and Hg.

3.2. Soil Pollution Level and Potential Ecological Risk Assessment

The mean Er values followed a sequence of Hg > Cd > As > Pb > Cr. The mean Er of Hg was 71.28, including extreme risk (14.1%), high risk (35.2%), and considerable risk (46.5%). The mean Er values of As, Pb, Cr, and Cd were lower than 40, presenting a low risk. The RI index of the five HMs ranged from 66.64 to 498.39, with a mean value of 124.27 and a highest value of 497. Additionally, 50% of the samples presented moderate potential ecological risk (110 ≤ RI < 220), and 44.5% presented a low potential ecological risk (RI < 110). There was only one point with a high potential ecological risk, accounting for 0.68% (RI ≥ 440).
Referring to the sampling data of the Pingshuo open-pit mine [12], the pollution situations of the Shuozhou and Pingshuo open-pit mines were compared and analyzed (Table 3). The mean value of RI in the mining area (200.07) of the Pingshuo open-pit mine was higher than that for Shuozhou (124.27). Although the two areas had a moderate potential ecological risk, HM pollution in the mining area was more serious. The sequence of the mean pollution coefficient index in the mining area was the same as that in Shuozhou (Hg > Pb > As > Cr > Cd). HM pollution caused by mining activities in the open-air mine was more serious than that in Shuozhou, but both had the same pollution characteristics.

3.3. Correlation Analysis of HMs and Environmental Variables

3.3.1. Correlation Analysis between HMs and pH

The significant relationship between HMs suggested that they may derive from the same source [21]. The Pearson correlation coefficient was applied to examine the relationships between the concentrations of HMs. If the correlation coefficient between HMs was found to be positive, it would mean there is a common source and interdependence between these HMs [22]. The results are shown in Table 4. In Shuozhou, most mining types were nonmetallic minerals, such as coal, limestone, refractory clay, and iron bauxite. There were no obvious regional accumulation characteristics of HMs. There were significant correlations between Pb and Cd, Hg, As, and Cr and the correlation between Pb and Cd was the strongest with a correlation coefficient of 0.566. Pb was significantly correlated with other HMs, indicating that the sources of Pb were diverse. The common source with the Cd element may be the largest source of Pb elements. Among the five HMs, the correlation between As and Cr was the strongest, with a correlation coefficient of 0.569, indicating the same source of HMs As and Cr. With a correlation coefficient of 0.226, this indicated that Hg was only significantly correlated with Pb, which means that Hg and Pb were homologous.
The mechanism of HM transmission was different in soils because of complex reactions (such as dissolution and sedimentation) in the soil system. A large number of studies have demonstrated the importance of soil properties in regulating speciation and mobility [23,24,25,26]. Some researchers have found that the correlation between HMs and pH is not very significant [27]. Other researchers have found that there is a significant negative correlation between HMs and pH values [28]. According to the correlation analysis results between pH and HMs, only Hg and Pb were significantly correlated with pH. The lower the soil pH, the higher the concentration of the water-soluble and exchangeable components of HMs. This indicated that decreasing soil pH may decrease the adsorption of HMs and subsequently increase their mobility.

3.3.2. Variation of HM Content in Soil at Different Slopes

The migration and distribution of HMs are also affected by a terrain factor: slope. HMs can be transported as elements through the runoff of rainfall, and then transfer from upstream to downstream [29]. In accordance with the slope classification standards of the international geographic society [30], the statistical results of HM concentration in different slopes are shown in Table 5. There were no significant correlations between HMs and slope factors. In different slopes, the HMs concentration was not much different. On the basis of existing research [31,32,33], it is feasible that the slope could affect the accumulation of HMs. Some studies [34,35] have found that HM concentration is significantly negatively correlated with slope. Some studies [31,33] have found that the concentration of HMs is higher in the zones with greater slope. However, the results of this research showed that there was no significant correlation between HMs and slope. Located in the Datong Basin, the terrain of Shuozhou is relatively flat and open, and the slope of the farmland is not large; the slope of the sampled farmland ranged mainly between 0–5°, accounting for 76% of all the sampled farmland. This indicates that on flat terrain the slope has little effect on the distribution of HMs.

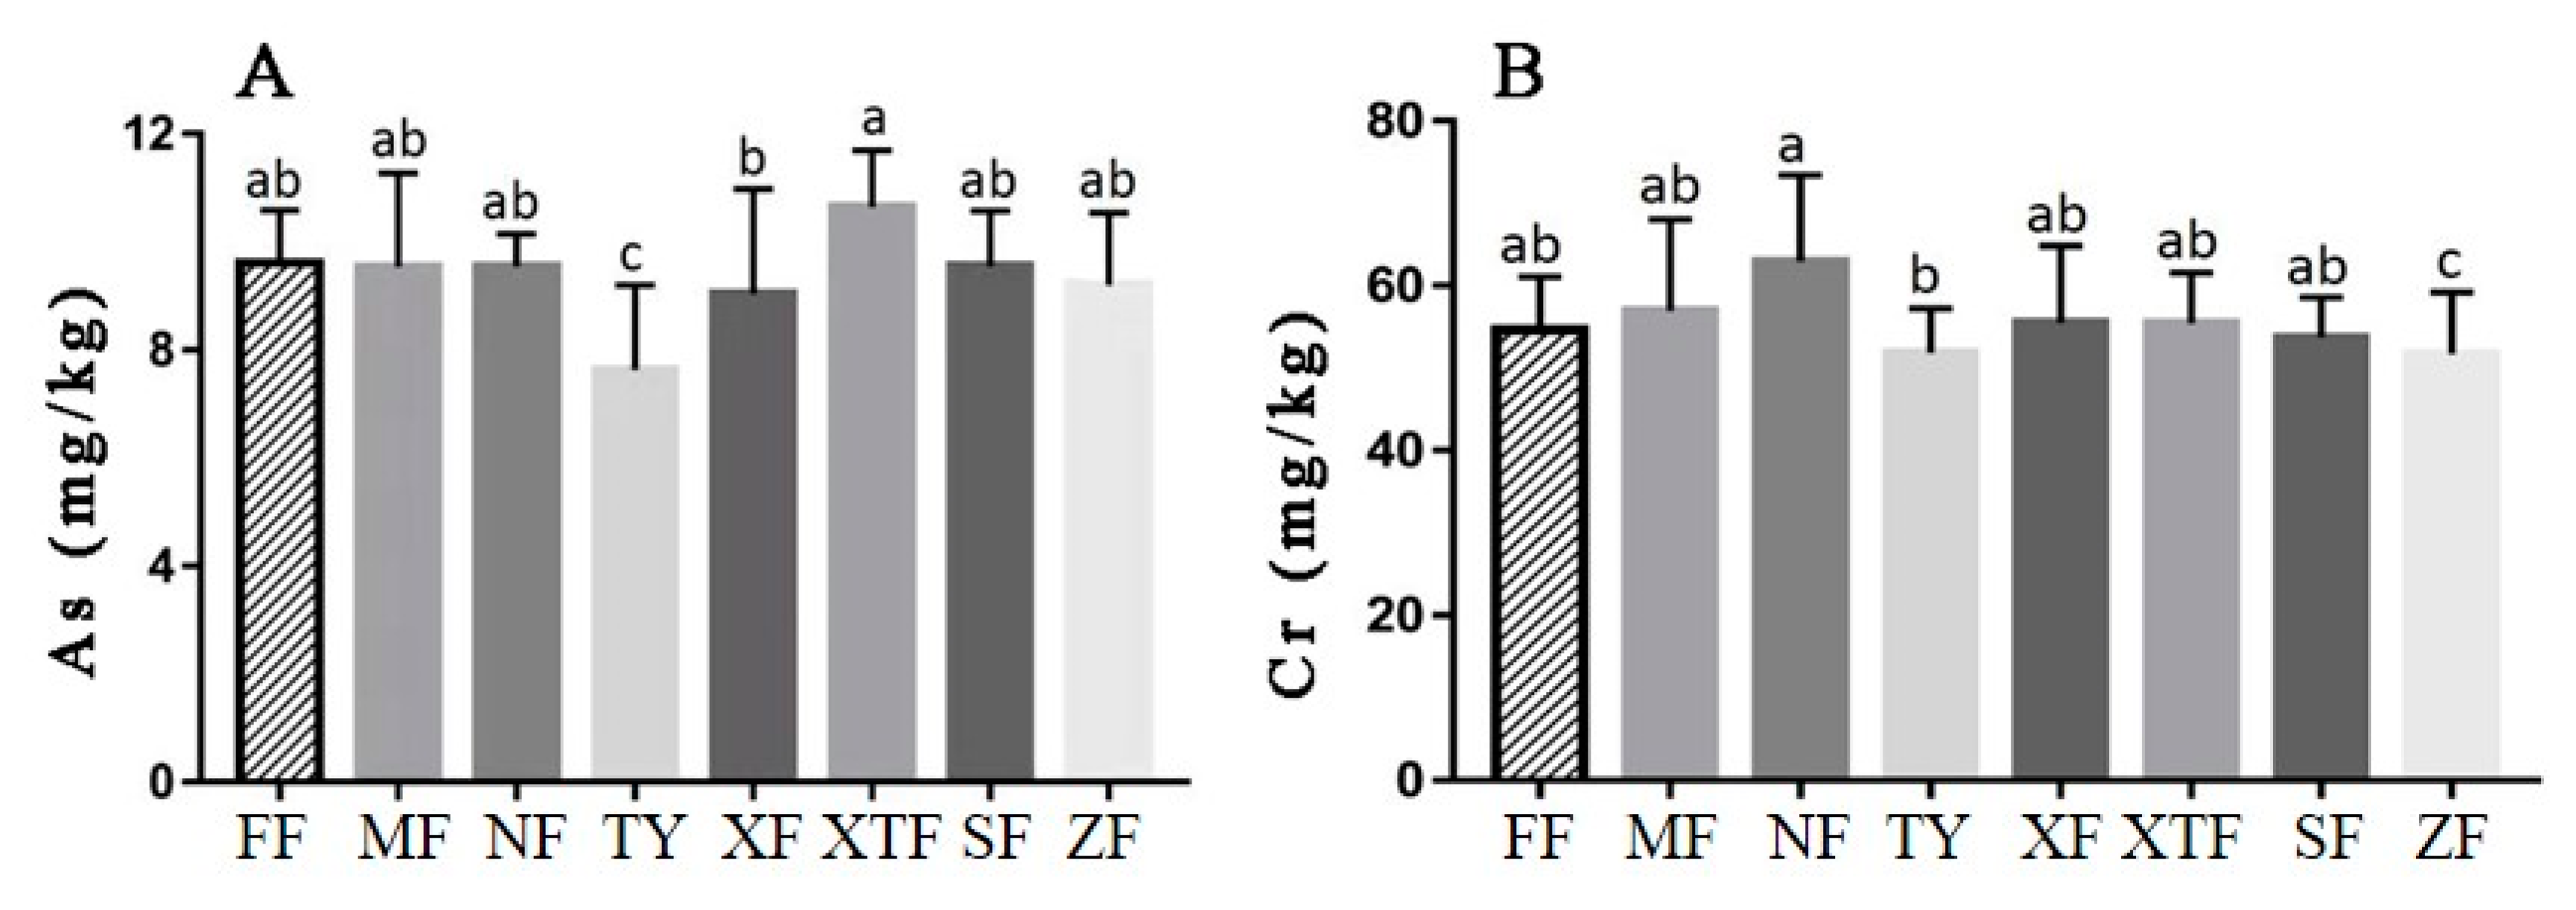
3.3.3. Variation of HM Content in Soil for Different Farmland Types

Among the sampling sites, the farmland types were dry land, irrigated land, and artificial pasture. Using the single-factor test in SPSS, the correlation between HM concentrations and the farmland types could be examined. There was no significant relationship between the farmland type and HM concentrations (Table 6). Artificial pastureland had the lowest concentration of HMs, which was lower than the mean value of Shuozhou. However, the HM concentration difference between the three farmland types was small. Some research has found that HM concentration has a significant relationship with different land-use types [36,37,38]. The land-use types were classified according to the type of land use activities, such as farm, residual, and industrial lands. Compared with broad (such as ecoregion) and specific (such as soil physical properties) natural factors, farmland use type has little impact on HM concentrations.

3.3.4. Correlation Analysis between HMs and the Geochemical Background of the Parent Rock

HM in soil mostly come from two sources: natural and anthropogenic. Almost all of the existing statistical studies on the natural sources of HMs are based on PCA and CA results [39]. Soil parent materials mainly depend on the geochemical background of the parent rock (GR), which varies by geological characteristics [40].
Using the single-factor test in SPSS, the correlation between HMs and GR was examined (Figure 2). As was significantly correlated with the Xuanren Formation (XF), the Tuoyang Formation (TF), and the combination of the Xuanren and Tuoyang Formations (sXTF). Cr was significantly correlated with the Zhumabao Formation (ZF), Nihewan Formation (NF), and Tuoyang Formation (TF). The lower part of the XF was mainly fine sandy soil, while the upper part was silty sand. The TF is formed by fine sandy soil and silty soil [41]; the sXTF shows a combination of XF and TF. The NF is formed by a combination of sandy clay and silty sand [42]. The ZF has an interbed of sandstone and mudstone [43].
The natural HM concentration in soils mainly depends on the soil material, which is derived from the parent rock [44]. According to the statistical results, Cr and As were significantly correlated with some GR types, which were formed by sandy and silty soil.
This indicates that Cr and As are associated with and controlled by parent rocks, whereas Cd, together with Hg and Pb, are controlled by anthropic activities. Many studies have found that HM concentration is associated with and controlled by parent rocks [45,46,47]. Wazwaz [48] found that different soils achieve different adsorption degrees between different HMs. In other work [49], it was found that the parent material is the main factor influencing the spatial distribution of the HMs Cd and Cr in the surface soil. These results agree with those found in this study, and this approach provided a useful geochemical view to interpret the statistical results.

3.4. Relationship between Soil HMs and Surrounding Enterprise Types

According to the national economy industrial classification standard [50], the enterprises of interest were divided into eight categories. Existing research [51,52] has found that the mean value of HM concentration in the sample plot 2 km away from the pollution source was significantly different. To determine the influence of different enterprises on HM pollution, the mean value of HMs within 2 km of different enterprises was obtained via ArcGIS (Table 7).
The total standardized factor of the eight enterprises followed a decreasing sequence of leather, fur, feathers, and footwear (LI) > other (OI) > public facilities management (PI) > chemical raw materials and chemical manufacturing (CI) > nonferrous metal smelting and rolling processing (NI) > black metal smelting and rolling processing (BI) > ecological protection and environmental management (EI) > medicine manufacturing (MI) (Figure 3).
For the industrial sources of HMs, previous studies have mainly focused on a certain type of activity by using a statistical analysis method. In urban soil, some industrial processes (such as fossil fuel and coal burning) are considered to be major emission sources of HMs [53,54]. In densely populated areas, the HM Pb in agriculture soils is mainly derived from undisposed industrial waste-water [55]. The HM Cr is derived from coal-burning [56]. The use of pesticides and fertilizers and other agricultural activities often lead to Cd pollution [57]. However, few studies have examined the HM pollution characteristics from the point of view of the enterprise.
Except for Hg, the concentrations of the other HMs around the LI industry are the largest among the eight enterprise types. The total standardization factor of the LI industry is the largest (4.43) among the eight enterprises, which indicates that HMs around LI industry sites represent the maximum level among the eight types. The enterprises with the highest Hg concentrations are other enterprises, and the total standardized factor of these enterprises is 2.83, ranking second among the eight enterprises. This indicates that HM Hg pollution of these enterprises is especially serious, and the pollution of other HM elements is also relatively serious. The medicine manufacturing industry has the least pollution, with a total standardized factor of 0.12. Except for As, the concentrations of the other HMs are the smallest among the eight industries, indicating that the HM pollution risk of such enterprises mainly comes from As. Similarly, the pollution capacity level of HMs in other enterprises can be obtained.

4. Conclusions

In this study, the concentration of HMs and the relationship between HM concentration and soil factors in the soils of Shuozhou, Shanxi province, China were analyzed to investigate the contamination, source, human health risks, and influencing factors of HM distribution. Combined with the statistical analysis results, we draw the following conclusions.
The mean value of HMs in Shuozhou was higher than the background value, indicating that human activities can indeed affect the HM concentration in farmland. The comparison of the potential ecological risk index between the Shuozhou and Pingshuo open-pit mines also indicates that open-pit mining activities have a higher impact on HM pollution than general human activities, and have a more profound potential impact on human beings.
Combined with the HM correlation results, we identified the sources of HMs in Shuozhou. For Cr and As, parent materials may contribute more to the concentrations. For Cd, Hg, and Pb, human activities may be the main sources of elevated concentrations in the study area.
The influencing factor analysis results indicated that on flat terrain, the slope has little impact on the distribution of HMs. Compared with broad (such as ecoregion) and specific (such as soil physical properties) natural factors, farmland use types have little impact on HM concentrations. In regions with a lower pH, people should pay more attention to the accumulation of the HMs Hg, and Pb.
Among the eight industry types examined, the pollution capacity level of the leather, fur, feather, and footwear industries is the highest, indicating that HMs around footwear industry sites represent the maximum level among the eight types. Different industries have their own production processes that lead to different levels of soil HM pollution. For the government in Shuozhou, the introduction of stricter policies to control pollutant release from the footwear industry should be considered.

Author Contributions

Funding acquisition, Z.B.; Software, X.L.; Writing – original draft, D.Y. All authors have read and agreed to the published version of the manuscript.

Funding

This research was funded by the National Key Research and Development Program of China, grant number 2017YFF0206804. The APC was funded by Zhongke Bai.

Conflicts of Interest

The authors declare no conflict of interest.

References

  1. Chen, T.; Liu, X.; Li, X.; Zhao, K.; Zhang, J.; Xu, J.; Shi, J.; Dahlgren, R.A. Heavy metal sources identification and sampling uncertainty analysis in a field-scale vegetable soil of Hangzhou, China. Environ. Pollut. 2009, 157, 1003–1010. [Google Scholar] [CrossRef] [PubMed]
  2. Alloway, B.J. Sources of heavy metals and metalloids in soils. In Heavy Metals in Soils; Springer: Dordrecht, The Nederland, 2013; pp. 11–50. [Google Scholar]
  3. Sun, Y.; Zhou, Q.; Xie, X.; Liu, R. Spatial, sources and risk assessment of heavy metal contamination of urban soils in typical regions of Shenyang, China. J. Hazard. Mater. 2010, 174, 455–462. [Google Scholar] [CrossRef] [PubMed]
  4. Madrid, L.; Díaz-Barrientos, E.; Madrid, F. Distribution of heavy metal contents of urban soils in parks of Seville. Chemosphere 2002, 49, 1301–1308. [Google Scholar] [CrossRef]
  5. Ljung, K.; Otabbong, E.; Selinus, O.; Sveriges, L. Natural and anthropogenic metal inputs to soils in urban Uppsala, Sweden. Environ. Geochem. Health 2006, 28, 353–364. [Google Scholar] [CrossRef] [PubMed]
  6. Li, X.; Zhao, Z.; Yuan, Y.; Wang, X.; Li, X. Heavy metal accumulation and its spatial distribution in agricultural soils: Evidence from Hunan province, China. RSC Adv. 2018, 8, 10665–10672. [Google Scholar] [CrossRef] [Green Version]
  7. Liu, R.; Wang, M.; Chen, W.; Peng, C. Spatial pattern of heavy metals accumulation risk in urban soils of Beijing and its influencing factors. Environ. Pollut. 2016, 210, 174–181. [Google Scholar] [CrossRef]
  8. Chamannejadian, A.; Moezzi, A.A.; Sayyad, G.; Jahangiri, A.; Jafarnejadi, A. Effect of soil characteristics on spatial distribution of cadmium in calcareous paddies. Int. J. Agric. 2013, 3, 139. [Google Scholar]
  9. Pan, L.; Wang, Y.; Ma, J.; Hu, Y.; Su, B. A review of heavy metal pollution levels and health risk assessment of urban soils in Chinese cities. Environ. Sci. Pollut. Res. 2018, 25, 1055–1069. [Google Scholar] [CrossRef]
  10. Zou, J.; Liu, X.; Dai, W.; Luan, Y. Pollution assessment of heavy metal accumulation in the farmland soils of Beijing’s suburbs. Environ. Sci. Pollut. Res. 2018, 25, 27483–27492. [Google Scholar] [CrossRef]
  11. Zhang, L.; Zhu, G.; Ge, X.; Xu, G.; Guan, Y. Novel insights into heavy metal pollution of farmland based on reactive heavy metals (RHMs): Pollution characteristics, predictive models, and quantitative source apportionment. J. Hazard. Mater. 2018, 360, 32–42. [Google Scholar] [CrossRef]
  12. Yong, L.; Huifeng, W.; Xiaoting, L.I.; Jinchang, L.I. Heavy Metal Contamination of Agricultural Soils in Taiyuan, China. Pedosphere 2015, 25, 901–909. [Google Scholar]
  13. Xiao, W.; Sui, T.; Wang, X.; Zhu, Q.; Liu, R.; Chen, X. Assessment and Geographical Detection of Heavy Metal Pollution in Typical Farmland Soil in Chaohu Lake Basin; Chinese Society for Agricultural Machinery: Beijing, China, 2018; pp. 144–152. [Google Scholar]
  14. Christou, A.; Theologides, C.P.; Costa, C.; Kalavrouziotis, I.K.; Varnavas, S.P. Assessment of toxic heavy metals concentrations in soils and wild and cultivated plant species in Limni abandoned copper mining site, Cyprus. J. Geochem. Explor. 2017, 178, 16–22. [Google Scholar] [CrossRef]
  15. Liang, J.; Shi, C.; Zeng, G.; Zhong, M.; Yuan, Y. Spatial Variation and Assessment of Heavy Metal and Radioactive Risk in Farmland around a Retired Uranium Mine. IOP Conference Series. Earth Environm. Sci. 2017, 78, 12005. [Google Scholar]
  16. Han, Z.; Wan, D.; Tian, H. Pollution Assessment of Heavy Metals in Soils and Plants around a Molybdenum Mine in Central China. Pol. J. Environ. Stud. 2019, 28, 11. [Google Scholar] [CrossRef]
  17. Hakanson, L. An ecological risk index for aquatic pollution control.a sedimentological approach. Water Res. 1980, 14, 975–1001. [Google Scholar] [CrossRef]
  18. Santamaría, J.M.; Moraza, M.L.; Elustondo, D.; Baquero, E.; Jordana, R.; Lasheras, E.; Bermejo, R.; Ariño, A.H. Diversity of acari and collembola along a pollution gradient in soils of a pre-pyrenean forest ecosystem. Environ. Eng. Manag. J. 2012, 11, 1159–1169. [Google Scholar] [CrossRef]
  19. Fan, W.; Bai, Z.; Li, H. Potential Ecological Risk Assessment of Heavy Metals in Reclaimed Soils. Trans. Chin. Soc. Agric. Eng. 2011, 27, 348–354. [Google Scholar]
  20. Phil-Eze, P.O. Variability of soil properties related to vegetation cover in a tropical rainforest landscape. J. Geogr. Reg. Plan. 2010, 3, 177–184. [Google Scholar]
  21. Huang, Y.; Liu, D.; Wang, Y.; Wang, X.; Li, J. Heavy metals accumulation by hydrophytes. Chin. J. Ecol. 2006, 5, 541–545. [Google Scholar]
  22. Tholkappian, M.; Ravisankar, R.; Chandrasekaran, A.; Jebakumar, J.P.P.; Kanagasabapathy, K.V.; Prasad, M.V.; Satapathy, K.K. Assessing heavy metal toxicity in sediments of Chennai Coast of Tamil Nadu using Energy Dispersive X-Ray Fluorescence Spectroscopy (EDXRF) with statistical approach. Toxicol. Rep. 2018, 5, 173–182. [Google Scholar] [CrossRef]
  23. Sauvé, S.; Hendershot, W.; Allen, H.E. Solid-solution partitioning of metals in contaminated soils:  dependence on pH, total metal burden, and organic matter. Environ. Sci. Technol. 2000, 34, 1125–1131. [Google Scholar] [CrossRef]
  24. Shan, Y.; Shan, Y.; Tysklind, M.; Tysklind, M.; Hao, F.; Hao, F.; Ouyang, W.; Ouyang, W.; Chen, S.; Chen, S.; et al. Identification of sources of heavy metals in agricultural soils using multivariate analysis and GIS. J. Soil Sediment 2013, 13, 720–729. [Google Scholar] [CrossRef]
  25. Zeng, F.; Ali, S.; Zhang, H.; Ouyang, Y.; Qiu, B.; Wu, F.; Zhang, G. The influence of pH and organic matter content in paddy soil on heavy metal availability and their uptake by rice plants. Environ. Pollut. 2011, 159, 84–91. [Google Scholar] [CrossRef] [PubMed]
  26. Liu, Y.; He, Z.; Yang, Z.; Sun, G.; He, J. Variability of heavy metal content in soils of typical Tibetan grasslands. RSC Adv. 2016, 6, 105398–105405. [Google Scholar] [CrossRef]
  27. Chen, X.; Zhu, B.; Yang, W.; Ji, H. Sources, spatial distribution and contamination assessments of heavy metals in gold mine area soils of Miyun Reservoir upstream, Beijing, China. Environ. Chem. 2015, 34, 2248–2256. [Google Scholar]
  28. Likuan, D.; Bin, F. Analysis of spatial heterogeneity of soil heavy metals in tea plantation: Case study of high quality tea garden in Jiangsu and Zhejiang. Geogr. Res. Aust. 2017, 36, 391–404. [Google Scholar]
  29. Qiao, P.; Lei, M.; Guo, G.; Yang, J.; Zhou, X.; Chen, T. Quantitative analysis of the factors influencing soil heavy metal lateral migration in rainfalls based on geographical detector software: A case study in huanjiang county, China. Sustainability 2017, 9, 1227. [Google Scholar] [CrossRef] [Green Version]
  30. Li, F.; He, X.; Zhou, C. Advances in Researches on Slope Gradient Factor in Soil Erosion. Res. Soil Water Conserv. 2008, 15, 229–231. [Google Scholar]
  31. Ding, Q.; Cheng, G.; Wang, Y.; Zhuang, D. Effects of natural factors on the spatial distribution of heavy metals in soils surrounding mining regions. Sci Total Environ. 2017, 578, 577–585. [Google Scholar] [CrossRef]
  32. Kheir, R.B.; Shomar, B.; Greve, M.B.; Greve, M.H. On the quantitative relationships between environmental parameters and heavy metals pollution in Mediterranean soils using GIS regression-trees: The case study of Lebanon. J. Geochem. Explor. 2014, 147, 250–259. [Google Scholar] [CrossRef]
  33. Qiao, P.; Yang, S.; Lei, M.; Chen, T.; Dong, N. Quantitative analysis of the factors influencing spatial distribution of soil heavy metals based on geographical detector. Sci. Total Environ. 2019, 664, 392–413. [Google Scholar] [CrossRef] [PubMed]
  34. Chunjie, C.; Jinfeng, Z. Distribution and pollution of soil heavy metals in hilly upland around Pingdingshan coal mining area. Geogr Res-Aust 2014, 33, 1383–1392. [Google Scholar]
  35. Zhang Yubin, C.N.S.D. Heavy Metal Distribution Feature in Terrace Soil on the Loess Gullied-Hilly Area. Chinese Agricultural Science Bulletin 2009, 25, 252–256. [Google Scholar]
  36. Li, W.; Wang, D.; Wang, Q.; Liu, S.; Zhu, Y.; Wu, W. Impacts from the land-use pattern on the spatial distribution of cultivated soil heavy metal pollution in the typical rural-urban fringe of northeast China. Int. J. Environ. Res. Public Health 2017, 14, 336. [Google Scholar] [CrossRef] [Green Version]
  37. Deng, A.; Wang, L.; Chen, F.; Li, Z.; Liu, W.; Liu, Y. Soil aggregate-associated heavy metals subjected to different types of land use in subtropical China. Glob. Ecol. Conserv. 2018, 16, e465. [Google Scholar] [CrossRef]
  38. Li, S.; Li, S.; Yang, L.; Yang, L.; Chen, L.; Chen, L.; Zhao, F.; Zhao, F.; Sun, L.; Sun, L. Spatial distribution of heavy metal concentrations in peri-urban soils in eastern China. Environ. Sci. Pollut. Res. 2019, 26, 1615–1627. [Google Scholar] [CrossRef]
  39. Hou, D.; O’Connor, D.; Nathanail, P.; Tian, L.; Ma, Y. Integrated GIS and multivariate statistical analysis for regional scale assessment of heavy metal soil contamination: A critical review. Environ. Pollut. 2017, 231, 1188–1200. [Google Scholar] [CrossRef]
  40. Dung, T.T.T.; Cappuyns, V.; Swennen, R.; Phung, N.K. From geochemical background determination to pollution assessment of heavy metals in sediments and soils. Rev. Environ. Sci. Biotechnol. 2013, 12, 335–353. [Google Scholar] [CrossRef]
  41. Li, Q.; Wu, T. The establishment of the Holocene Xuanren And Tuoyang Formations in Shanxi. Reg. Geol. China 1996, 3, 38–41. [Google Scholar]
  42. Min, L.; Zhang, Z.; Wang, X. The basal boundary of the Nihewan Formation at the Taiergou section of Yangyuan, Hebei Province. J. Stratigr. 2006, 30, 103–108. [Google Scholar]
  43. Liyang, D.; Yi, J.; Zhang, C.; Liu, Y.; Xue, P.; Liu, Y.; Li, Y. The discovery of a gigantic sauropord femur in Xinrong area, Shanxi Province. Chin. Geol. 2017, 44, 1037–1038. [Google Scholar]
  44. Roca, N.; Pazos, M.S.; Bech, J. The relationship between WRB soil units and heavy metals content in soils of Catamarca (Argentina). J. Geochem. Explor. 2008, 96, 77–85. [Google Scholar] [CrossRef]
  45. Ali, M.H.; Mustafa, A.A.; El-Sheikh, A.A. Geochemistry and spatial distribution of selected heavy metals in surface soil of Sohag, Egypt: A multivariate statistical and GIS approach. Environ. Earth Sci. 2016, 75, 1–17. [Google Scholar] [CrossRef]
  46. Facchinelli, A.; Sacchi, E.; Mallen, L. Multivariate statistical and GIS-based approach to identify heavy metal sources in soils. Environ. Pollut. 2001, 114, 313–324. [Google Scholar] [CrossRef]
  47. Wu, J.; Song, J.; Li, W.; Zheng, M. The accumulation of heavy metals in agricultural land and the associated potential ecological risks in Shenzhen, China. Environ. Sci. Pollut. Res. Int. 2016, 23, 1428–1440. [Google Scholar] [CrossRef]
  48. Wazwaz, A.; Al-Salaymeh, A.; Khan, M.S. Removing heavy metals through different types of soils and marble powder found in Oman. J. Ecol. Eng. 2019, 20, 136–142. [Google Scholar] [CrossRef]
  49. Zhang, H.; Ma, X.; Shi, X. Influential factors of spatial distribution of Cd and Cr in regional soils. Soils 2018, 50, 989–998. [Google Scholar]
  50. GB/T 4754-2017. China National Industries Classification [S]. 2017.06.30.
  51. Manu, M.; Băncilă, R.I.; Iordache, V.; Bodescu, F.; Onete, M. Impact assessment of heavy metal pollution on soil mite communities (Acari: Mesostigmata) from Zlatna Depression–Transylvania. Process. Saf. Environ. Prot. 2017, 108, 121–134. [Google Scholar] [CrossRef]
  52. Qiu, M.; Wang, Q.; Li, F.; Chen, J.; Yang, G.; Liu, L. Simulation of changes in heavy metal contamination in farmland soils of a typical manufacturing center through logistic-based cellular automata modeling. Environ. Sci. Pollut. Res. 2016, 23, 816–830. [Google Scholar] [CrossRef]
  53. He, K.; Sun, Z.; Hu, Y.; Zeng, X.; Yu, Z.; Cheng, H. Comparison of soil heavy metal pollution caused by e-waste recycling activities and traditional industrial operations. Environ. Sci. Pollut. Res. Int. 2017, 24, 9387–9398. [Google Scholar] [CrossRef]
  54. Cai, L.; Xu, Z.; Ren, M.; Guo, Q.; Hu, X.; Hu, G.; Wan, H.; Peng, P. Source identification of eight hazardous heavy metals in agricultural soils of Huizhou, Guangdong Province, China. Ecotoxicol. Environ. Saf. 2012, 78, 2–8. [Google Scholar] [CrossRef] [PubMed]
  55. Wong, S.C.; Li, X.D.; Zhang, G.; Qi, S.H.; Min, Y.S. Heavy metals in agricultural soils of the Pearl River Delta, South China. Environ. Pollut. 2002, 119, 33–44. [Google Scholar] [CrossRef] [Green Version]
  56. Martínez, J.; Llamas, J.; Miguel, E.; Rey, J.; Hidalgo, M. Soil contamination from urban and industrial activity: Example of the mining district of Linares (southern Spain). Environ. Geol. 2007, 54, 669–677. [Google Scholar] [CrossRef]
  57. Nicholson, F.A.; Smith, S.R.; Alloway, B.J.; Carlton-Smith, C.; Chambers, B.J. An inventory of heavy metals inputs to agricultural soils in England and Wales. Sci. Total Environ. 2003, 311, 205–219. [Google Scholar] [CrossRef]
Figure 1. Study area and sampling sites.
Sustainability 12 01907 g001
Figure 2. Correlation analysis between the geochemical background of the parent rock and HMs. Note: FF = Fangcun Formation; MF = Malan Formation; NF = Nihewan Formation; TY = Tuoyang Formation; XF = Xuanren Formation; XTF = combination of Xuanren and Tuoyang Formation; SF = Shiyu Formation; ZF = Zhumabao Formation.
Sustainability 12 01907 g002
Figure 3. Comparison of the standardization factor of HMs around different enterprises. Note: a = nonferrous metal smelting and rolling processing, b = medicine manufacturing, c = ecological protection and environmental management, d = other, e = leather, fur, feathers, and footwear, f = chemical raw materials and chemical product manufacturing, g = ferrous metal smelting and rolling, and h = public facility management.
Sustainability 12 01907 g003
Table 1. Classifications of the potential ecological risk index (RI).
IndexCategoryDegree
Potential ecological
risk
index (RI)
E r i < 40, RI < 110Low
40 ≤ E r i < 80, 110 ≤ RI < 220Moderate
80 ≤ E r i < 160, 220 ≤ RI < 440Considerable
160 ≤ E r i < 320, RI ≥ 440 High
E r i ≥ 320Extreme
Table 2. Statistical parameters (mg kg-1) of HMs in the agricultural soils of Shuozhou.
CdHgAsPbCr
Mean0.1170.0309.26921.32855.609
Median0.1090.0259.28020.60053.800
Max0.3430.18513.80046.00088.700
Min0.0330.0114.23016.10038.900
SD0.0420.0211.7043.8278.924
CV0.3580.70.1830.1790.1
Background0.1120.0177.813.853
Limit value0.63.425170250
Note: The limit value was adopted from Chinese environmental quality standards (GB 15618—2018).
Table 3. Comparison of pollution in the Shuozhou and Pingshuo open-pit mine areas.
S-minP-minS-maxP-maxS-meanP-mean
Ei-Cd8.8421.4391.8837.531.2730.26
Ei-Hg26.82101.18435.29232.9471.28148.94
Ei-As5.4210.0117.6914.6211.8811.85
Ei-Pb5.835.5816.678.047.726.84
Ei-Cr1.471.963.352.532.092.1
RI66.64156.62498.39283.39124.27200.07
Note: S = Shuozhou, P = Pinshuo open pit mine.
Table 4. Spearman’s correlation matrix of HMs and pH.
CdHgAsCrPbpH
Cd1
Hg0.1021
As0.413**0.0591
Cr0.461**0.0340.569**1
Pb0.566**0.226**0.292**0.461**1
pH−0.062−0.243**−0.022−0.108−0.194*1
Note: ** P < 0.01; * P < 0.05.
Table 5. HM content and correlation coefficients on different slopes.
SlopeCdHgAsPbCr
>150.1140.0187.218.553.8
5–150.1210.0329.35121.49855.935
0–50.1150.0299.26221.30155.525
Correlation coefficient0.069−0.014−0.0120.0110.036
Table 6. HM content and statistical results for different farmland types.
Farmland typeCdHgAsPbCr
Dry land0.120.039.2421.7555.35
Irrigated land0.110.039.3921.1556.64
Artificial pastureland0.100.028.3419.5050.23
Mean value0.120.039.2721.4355.73
Statistical significance0.4920.5920.4880.4090.334
Note: ** correlation is significant at P < 0.01; * correlation is significant at P < 0.05.
Table 7. Mean values of HM concentration in the surrounding soil of different enterprises.
CdHgAsPbCr
Nonferrous metal smelting and rolling processing (n = 4)0.1180.0288.43821.11754.508
Medicine manufacturing (n = 2)0.0800.0198.48918.42948.686
Ecological protection and environmental management (n = 3)0.1030.0217.85721.63550.972
Other (n = 3)0.1230.0459.02722.43456.025
Leather, fur, feathers, and footwear (n = 1)0.1660.03013.15823.95067.883
Chemical raw materials and chemical product manufacturing (n = 8)0.1200.02710.20821.98959.055
Ferrous metal smelting and rolling (n = 6)0.1170.0328.97220.29054.622
Public facility management (n = 2)0.1280.02810.42422.21157.716

