Article

Assessing the Vulnerability of Logistics Service Supply Chain Based on Complex Network

1
School of Economics and Management, Chang’an University, Xi’an 710000, China
2
School of Civil and Environmental Engineering, Nanyang Technological University, Singapore 639798, Singapore
3
Xi’an Traffic Information Center, Xi’an 710049, China
*
Author to whom correspondence should be addressed.
Sustainability 2020, 12(5), 1991; https://doi.org/10.3390/su12051991
Submission received: 12 January 2020 / Revised: 24 February 2020 / Accepted: 29 February 2020 / Published: 5 March 2020
(This article belongs to the Section Sustainable Transportation)

Abstract

:
The reliable operation of a logistics service supply chain (LSSC) is a key factor for improving logistics efficiency and service level, and vulnerability is an important indicator of reliable LSSC operation. Based on complex network theory, we reconstructed the running mechanism of logistics service providers, integrators, and demanders. We constructed an improved structure model of LSSC. By observing the selected three indicators (clustering coefficient, maximum connectivity, and network connectivity efficiency), the influence caused by the problem will continue to spread to more subjects along the network when a problem exists in one part of the network. The results showed that the destructive power of deliberate attacks is far greater than the damage caused by random attacks, and the disruption of logistics service integrators will considerably increase the vulnerability of the LSSC. However, even if logistics service integrators are removed completely, the LSSC still can operate at low efficiency. Through a case analysis, we identified the vulnerable nodes in logistics service, clarify the vulnerable mechanism in LSSC, and provide guidance for the operation of LSSC in real life.

1. Introduction

A complete logistics service activity often requires cooperation between different entities such as suppliers, integrators, and demanders. These entities and their relationship constitute a chain. The logistics service supply chain (LSSC) is a self-contained integrated supply chain led by logistics services. With the progress of productivity, the main forms of logistics have continued to develop from the initial self-operated logistics to the logistics department and to third-party logistics. At present, LSSC is developing rapidly. In the context of economic globalization, companies are competing on a global scale, and the pressure on companies is growing. Whether they can reduce logistics costs and focus on their core competitiveness are key to their survival and development. Hence, professional and efficient institutions must share these companies’ logistics functions. Enterprises are now more closely related, and just-in-time production is the norm, which makes the logistics requirements for enterprises increasingly complicated. In addition, traditional third-party logistics are unable to meet the needs of enterprises [1]. This resulted in the development of LSSC. LSSC was generated in response to the needs of productivity development, and a well-run LSSC promotes further increases in productivity.
The LSSC faces numerous problems in its development process, of which vulnerability is one [2]. In April 2019, in the middle of Chinalco Logistics, a vehicle rushed out of the refuge line and caused the death of six people. In July 2019, a fire broke out in the Mengyuan Logistics, a warehouse in the Yagang Daliu Logistics Park in Bai yun District, Guangzhou, China. The damage caused by this fire was estimated to be over 10 million RMB. These accidents are shocking. In the era of third-party logistics and previously, the impact of these losses was relatively small. However, in the context of the increasingly close relationship between companies, the problems will affect more subjects and cause adverse effects when a problem occurs in one part of the network. Identifying the vulnerable nodes to protect important nodes in advance and forming a precise emergency plan in the event of an accident to prevent further scope expansion have become an important issue for many scholars and company executives [3,4].
Research is urgently needed on the LSSC vulnerability. However, few studies have been published on this aspect because the researchers do not have unified opinions on the structure of LSSC, and improvements to the existing structure are needed. In addition, the data in actual production are not easily available, which complicates empirical research. Based on the above issues, we propose a new multi-line connection structure and constructed an instance to study LSSC vulnerability. Through the case analysis, we identified the vulnerable nodes in logistics service and clarified the vulnerable mechanism in logistics service, and enrich the relevant theories on LSSC vulnerability, providing guidance for real-life LSSC operation [5].
The rest of the paper is composed as follows: Section 2 reviews the relevant literature on LSSC and complex network theory, which laid a foundation for this study. Section 3 develops the new structure of LSSC, constructs the complex network, and determines the measurement indicators and attacking methods. Section 4 proposes an LSSC case and describes the changes in a network’s indicators under random and deliberate attacks. Finally, Section 5 concludes the study and provides corresponding suggestions.

2. Literature Review

2.1. Service Supply Chain

In the 1990s, the concept of LSSC began to emerge. The earliest research focused on the classification of logistics service providers. Muller (1993) pointed out that there are four types of logistics service providers: asset providers, management providers, integrated providers, and administrative providers [6]. Tian et al. (2002) proposed an LSSC model formed by integrated logistics service providers’ suppliers, integrated logistics service providers, and manufacturing and retail companies [7]. Cui et al. (2008) provided a more complete definition: the LSSC takes customer demand as the starting point and integrates all resources on the chain through the control of service flow, logistics, information flow, and capital flow. It integrates service capability management, service process management, service performance management, and customer value management. Thereafter, they created a complete logistics service value-added structure model around the core enterprises of logistics services [8].
At present, the academic community has many different understandings of the service supply chain’s structure and characteristics, which can be divided into three viewpoints: (1) supply chain refers to the links and activities related to services, (2) service supply chain is the service industry or service industry’s supply chain [9], and (3) the service supply chain is an integrated supply chain [10]. We agree with the third viewpoint and consider that a service supply chain is not only attached to some additional features or links of the product but is also a service-oriented and self-contained integrated supply chain.
Discussions on the structure of the LSSC began in 2000. Schmidt et al. (2000) studied the strategic and operational decision-making issues of international logistics, and proposed an LSSC model including functions such as procurement and transportation [11]; Yan et al. (2005) proposed an LSSC consisting of raw material suppliers, secondary suppliers, primary suppliers, manufacturers, distributors, and their customers [12]; Choy et al. (2007) reported that the LSSC consists of "functional logistics service providers, logistics service integrators, and customers" [13]; Gao et al. (2009) proposed that the LSSC consists of “logistics service subcontractors, logistics service integrators, and logistics service demanders”, and stated that the LSSC is a value-added chain of logistics capabilities [14]. Zhang et al. (2016) proposed an LSSC consisting of “functional logistics service provider, logistic service integrator, and logistic service demander” and built a complex network case to study LSSC vulnerability [15]. From the above analysis, the research on the basic structure of the LSSC is basically agrees upon logistics service subcontractor, logistics service integrator, and logistics service demand side.
Yu et al. (2002) studied the supplier selection problem in LSSCs [7]. Yan et al. (2005) studied the LSSC model characteristics and evaluated its performance [12]. Demirkan and Cheng (2008) proposed a service supply chain consisting of a service provider and an infrastructure provider to study the risk and information sharing of the service supply chain [16]. Yan et al. (2019) investigated inventory and order strategies of a two-echelon supply chain; the supply chain was composed of two unreliable suppliers [17]. Based on the definition of LSSC, Hu (2019) constructed an LSSC model that consisted of four types of members [18]. Most of these studies remained at the theoretical level and lacked practical case support. Here, we optimized the LSSC structure with the support of cases and provide a new method for studying the structure of LSSC.

2.2. Complex Network

Complex network research initially formed in the 1960s due to the introduction of the random graph model [19]. With the further development of complex network theory by domestic and foreign scholars, many important characteristics of complex networks, such as the small-world and scale-free network models, were discovered [20]. Complex network theory was abstracted from the real world and describes many real-world relationships, such as the relationship between people, transportation networks, and protein transportation networks [21]. This has become a hot issue in academic research.
Many people use complex networks to study supply chains. Surana et al. conceptualized enterprise integration working in complex networks from the perspective of supply chain management. After defining the integrated framework, Surana et al. validated the framework with the classic case of Shanghai [22]. Moreover, Fridgen et al. studied exogenous shocks in complex supply networks, and used Petri nets to simulate different supply networks to assess the vulnerability of supply chain networks under external shocks [23]. In addition, they conducted detailed modeling and evaluation of the proposed method.
Many studies on logistics supply chain mostly focused on product supply chain. LSSCs exhibit some similarities with the product supply chain; however, the essential differences include intangibility, non-storability of service, simultaneous consumption, and service consumption. Research on the product supply chain cannot be fully applied to the LSSC. Given the rapid development of LSSCs, it is necessary to strengthen the research on LSSCs.

3. Research Methods and Indicators Construction

3.1. LSSC Structure Description

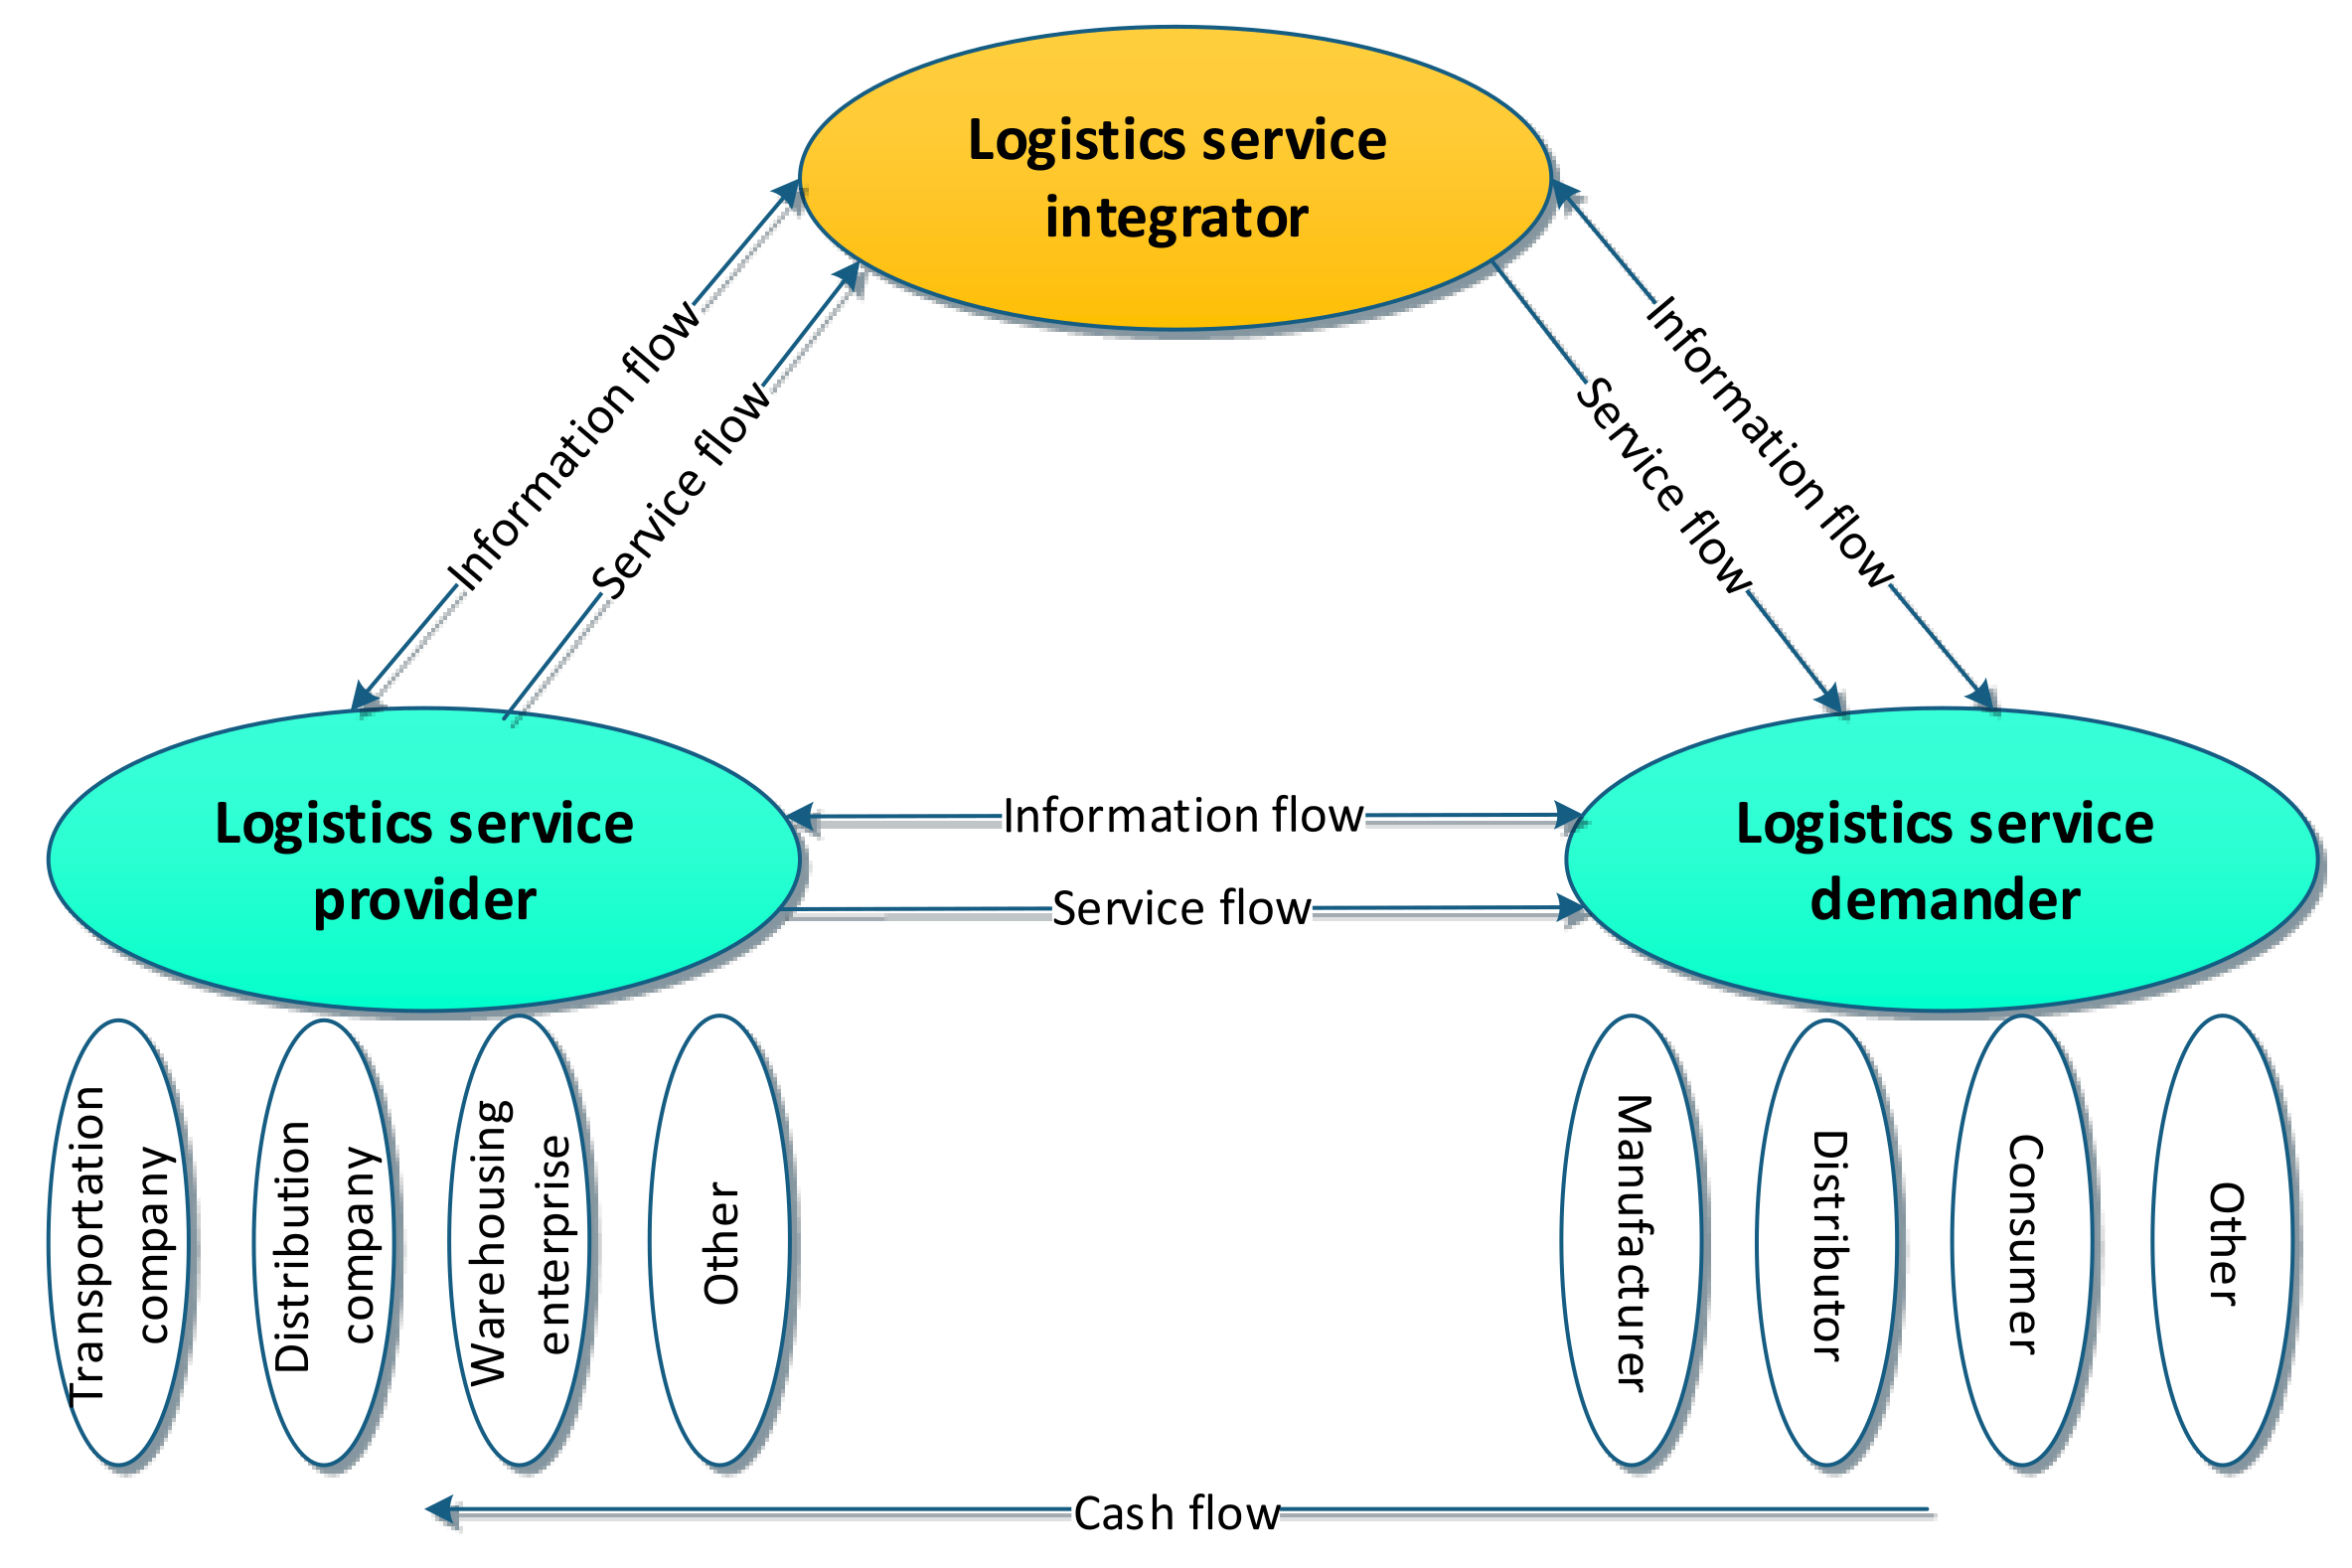
An LSSC is mainly composed of three parts: grid structure, business process, and management components. At present, the academic community is adopting a three-layer network structure consisting of logistics service providers, integrators, and demanders [24]. Figure 1 shows the basic LSSC structure proposed by most scholars.
In the traditional LSSC structure diagram, the logistics service demand side has no direct contact with the supplier. They establish connection through the integrators. Once the integrators are removed, the entire network collapses. However, in real life, demanders are often associated with providers. Based on the above considerations, we optimized the structure of the LSSC; adjusted the relationship between logistics service providers, integrators, and demanders in the original structure; and optimized them into a multi-line relationship. Under this structure, even if the integrator is removed completely, the network can still operate at low efficiency. The new structure is shown in Figure 2.
Service flow, information flow, and cash flow occur in this basic structure of LSSC. In terms of service flow, the logistics service provider can directly provide services to the demander or provide services to the customer after integration by the integrator. In terms of information flow, information is exchanged between providers, integrators, and customers. For the cash flow, in general, cash flows from demanders to supplies. The three can be collectively referred to as the logistics capability flow. Logistics capability is a comprehensive capability formed by layer-by-layer integration based on the basic work and functional areas of logistics. For the entire supply chain, logistics capability is a complex structural system composed of multiple capabilities, which is an organic collection of capabilities.
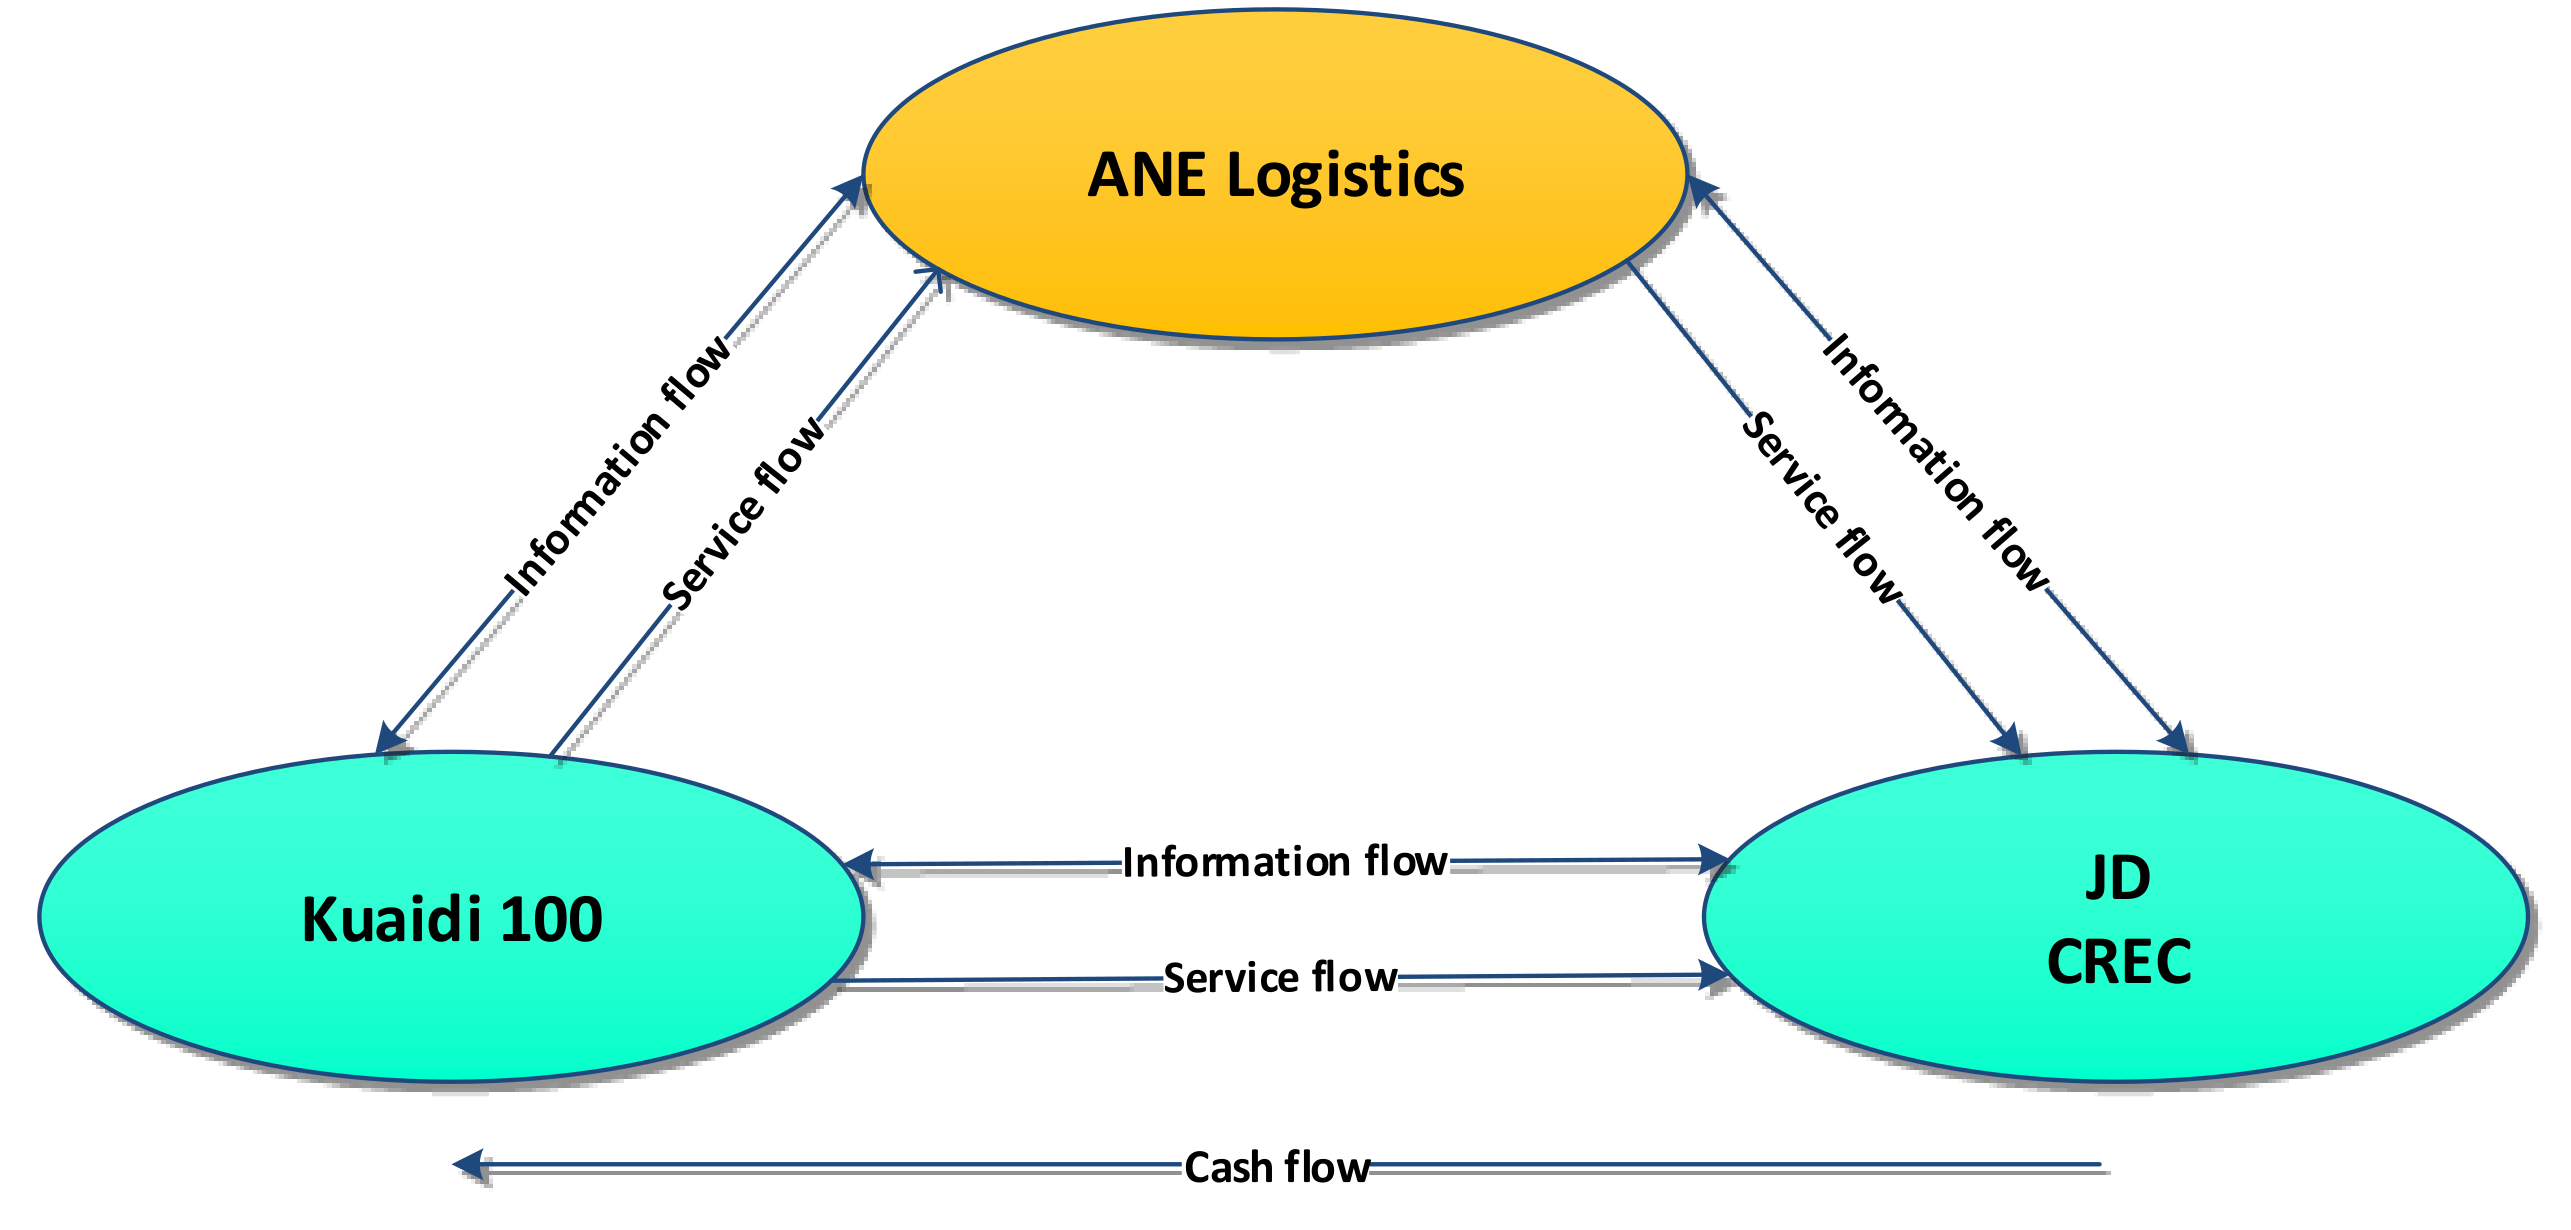
We use a case to illustrate the LSSC structure proposed in this article. ANE Logistics is a national AAAAA-level comprehensive service-oriented logistics enterprise that was established in 2010 [25]. JD and CREC are important customers of ANE Logistics. Kuaidi 100 is a logistics service provider of ANE Logistics [26]. The service flow flows from Kuaidi 100 to ANE Logistics and then to JD and CREC. On the official website of Kuaidi 100, Kuaidi 100 provides services to JD and CREC directly [27]. Their relationship is shown in Figure 3.

3.2. Explanation of the New LSSC Structure

In the original basic model of the LSSC network, there is no direct connection between the provider and demander, only an indirect connection through the logistics service integrator. When the original LSSC structure was proposed, the LSSC was mostly dominated by manufacturing companies. Manufacturing companies contact suppliers, channel providers, retailers, and service providers to play a synergistic role. The LSSC is more focused on the links and activities associated with services in the supply chain. The supply chain is dominated by products, and logistics service providers often play roles in manufacturing and further processing in this supply chain. Their position is important and irreplaceable. In this case, there is little contact between the demander and the provider.
With the development of e-commerce and the logistics industry, the current LSSC is service-oriented and a self-contained integrated supply chain. Although the integrator plays an integrated role, a large number of connections remain between the demander and the provider. From a cost perspective, when the demand side needs comprehensive services, it is more convenient to contact the integrator. When the demand side needs a single service, it is more cost-effective to contact the provider directly. From the perspective of real-life cases, in many cases providers and demanders are connected in real life. From the perspective of network simulation, no direct connection exists between the demander and the supplier of the LSSC built with the original structure. The simulated network is particularly vulnerable. Once the logistics service integrator is removed, the entire LSSC network is paralyzed. The situation is also different from the reality.
Based on the above reasons, we propose an improved LSSC structure that also provides a new direction for the discussion of LSSC’s structure.

3.3. LSSC Evolution Process

Information flow, service flow, and capital flow on exist among logistics service integrators, providers, and demanders [28]. We use Liu’s views to regard these flows as a capability flow [9]. The logistics service integrators are represented by j1, j2, j3, … jn; the logistics service providers are represented by t1, t2, t3, … tn; and the logistics service demanders are represented by x1, x2, x3, … xn. In the early days of network formation, the numbers of integrators, demanders, and providers were very small. With the increase in newly entered nodes, these nodes can only establish contact with some nodes, forming a new LSSC network. We drew upon the evolutionary mechanism of LSSC proposed by Zhang et al. [15] to describe the growth evolution of LSSC networks. When the entered node is a functional logistics service provider, the provider can provide services for the integrator or the customer; the nodes of its local world include integrators and demanders. At this point, the node has d outgoing edges, which is connected to the existing node i in its local world, and the edges’ direction points to the integrator or customer.
When the entered node is a logistics service integrator, the integrator can purchase services from the provider and provide customers with integrated logistics services. At this point, the node has e edges that are connected to node i in its local world.
When the entered node is a logistics customer, logistics customers conduct business activities with integrators and providers, so their local world is integrators and providers in the network. At this point, the node has only f edges and is connected to the existing node i in its local world. The connection direction of the nodes is directed from the integrator and provider to the customer.
The evolution of the network is as follows: (1) In the early days of the LSSC network, there were few nodes in the network. There were only two customers, an integrator, and two suppliers in the network, and they contacted the appropriate nodes in the network. (2) With the increase in customers, more integrators and providers entered the market, the number of connected edges in the network increases, and the network scale further expands. (3) With the continuous expansion of the market scale and the improvement in business level, more customers, integrators, and providers enter the network, and they each select some nodes in the network to contact. These nodes and edges eventually form a complex network structure. The above process is shown in Figure 4.

3.4. LSSC Network Model Construction

LSSC is a logistics service capability chain with logistics demand as the main driving force and logistics service integrators as the center. Logistics service integrators, providers, and demanders form an LSSC network that meets each demanders’ growing logistics needs through direct or indirect means [29]. Accordingly, an LSSC network model can be constructed.
We use G = {V, E, D} to represent the LSSC network. V denotes the network verticals; if ∣V∣ = m, then the quantity of the network’s nodes is m. The number of suppliers, integrators, and demanders are expressed as a, b, and c, respectively. Therefore, a + b + c = m. E represents the edge in LSSC, and ∣E∣ = n denotes the quantity of edges in the LSSC network [30].
D represents the distance of each side; D i , j i , j V , D = l i , j is the adjacency matrix. If a relationship between two nodes exists, then l i , j = 0 ; otherwise, l i , j = 1 .

3.5. LSSC Vulnerability Measurement Indicators and Attack Strategies

To properly evaluate the vulnerability of complex networks, appropriate evaluation indicators must be selected. At present, in the field of complicated networks, network vulnerability, network efficiency, maximum connection subgroups, clustering coefficient connection robustness, etc. are typically used to evaluate complex network vulnerability. The representative meanings of network diameter and average shortest path length are related to network efficiency. Therefore, the changes in the topology of the LSSC network can be studied by evaluating the performance of these indicators:
(1) Clustering coefficient. The clustering coefficient is a common indicator of the degree of aggregation between nodes and nodes in the network. The density of the LSSC network is high; nodes always tend to establish strict organizational relationships. Therefore, clustering coefficients can be used to measure the organization relationship of nodes and analyze the connectivity of the network state after the LSSC network failure [31]. The node clustering coefficient C i is the ratio of the actual number of edges E i between the nodes i and k i adjacent nodes to the total maximum possible edges:
C i = 2 E i k i * k i 1
where i is the node, k i s the number of neighboring nodes of node i,   k i * k i 1 2 is the maximum number of edges connected by node i to its neighboring nodes, and E i is the actual existence between i and k i . The clustering coefficient represents the coefficient of the degree of clustering of nodes in a graph, and can be used to analyze the connectivity of the nodes in the LSSC network after a fault state. The network’s clustering coefficient is obtained by averaging the clustering coefficients of all nodes in the network, which is denoted by C. Here, C is used to indicate the degree of interconnection between the nodes in the LSSC network [32]. The larger the C, the closer the entire network connection. In a LSSC, a large C indicates that the nodes are closely connected, and the communication among nodes is more frequent. The clustering coefficient is located between 0 and 1. When no connection exists between nodes in the network, the clustering coefficient is 0. When all nodes in the network are related to any node except itself, the clustering coefficient is 1.
C = 1 N * i C i
(2) Maximum connectivity. The ratio of the maximum connected subgraph to the total node in the network is the maximum connectivity. The maximum connection subgraph refers to the following: after the network is attacked, some nodes are disconnected from other nodes, and the network is split into several sub-graphs that are not connected to each other. The maximum connectivity can be expressed as follows:
C G = N N
where N’ is the number of nodes in the maximum connected subgraph of the LSSC network after attacks, and N is the total nodes in the LSSC network. After the LSSC network is attacked, some nodes lose contact with other networks. The network is separated into many disconnected areas, causing some network functions to be abnormal. Maximum connectivity can be used to measure the connectivity of the LSSC. The greater the maximum connectivity of the network, the smaller the vulnerability of the network and the better the robustness.
(3) Network connectivity efficiency. After the LSSC network is attacked, some nodes may fail. The optimal path of the network changes, the service duration between nodes increases, and the service efficiency decreases. Therefore, we used the following indicator to study the changes in the network:
E G = 1 / N N 1 i j 1 d i j .
With the rapid development of economic globalization and social division of labor and services, customers are increasingly demanding service. Logistics service integrators must also consider how to determine the shortest effective path of the network and respond to customers’ logistics service needs.
(4) Resilience analysis. Resilience is the ability of a system to survive, adapt, and develop in a volatile and changing environment. It is thought that the resilience of a supply chain is the self-adaptation and self-healing ability of the supply chain in the face of shocks, and it directly affects the core competitiveness of the entire supply chain [33]. This theory is mainly applied in the fields of sociology and ecology, and the application field is still being promoted [34].
In the field of resilience analysis in complex network, we used a proposed formula [35] to calculate the connection elasticity of the LSSC network:
R = C N N r
where C represents the maximum number of connections, N represents the initial network size, and N r represents the number of nodes removed.
(5) Attack strategy. In complex network theory, random and deliberate attacks are two major attacks. In random attacks, the points or edges of the network to destroy are randomly selected. We selected the attacked node with equal probability [29,36,37,38]. The formula is shown in Equation (6). In deliberate attacks, the nodes or edges are sorted according to the importance level from large to small. In this attack mode, the important nodes are attacked first, then the next most important ones, and so on. In real life, the LSSC network may be randomly destroyed due to weather and accidents, or it can be deliberately destroyed due to war, etc. Therefore, we used random and intentional attacks to simulate the attacks faced by LSSCs. In the LSSC network, the capacity flow is the flow of capacity between nodes. We did not consider the situation where the capability flow is damaged and mainly investigated the situation where the nodes are damaged:
P a t t a c k = 1 / V
where P a t t a c k is the selection probability of each attacked node, and V is the number of nodes in the LSSC network.
In the random attack state, nodes in the LSSC network are randomly selected for attack. In contrast, in the deliberate attack state, the attacker first selects the most important nodes in the LSSC network for attack. In the field of complex networks, degrees and intermediaries are often used to represent the importance of nodes. The node number is defined as the number of the shortest paths of all node pairs in the network passing through node i, which can reflect the influence of the node in the network and the network-loaded information. It indicates the importance and influence of the node in the whole network, indicating the node’s hub feature. On this basis, we chose the median-based attack strategy to study the vulnerability of the LSSC. The method sorts the nodes in the order from large to small, and the nodes with a large median are preferentially selected for attack.
The degree of a node is defined as the number of other nodes connected to node i, reflecting the degree of the node’s centering in the network. The degree includes the degree of ingress and outage. The greater the former, the greater the capability flow into this node. Taking the logistics service integrators as an example, the greater the logistics services provided, the more stable its supply side and the more important the nodes. The more the outage, the greater the capability flow that flows out from this node, which indicates high volume customers served. The whole LSSC network is driven by customer demand; therefore, a high volume of customers means that the node has a greater influence in the entire network. However, the indicator of the degree does not consider the traffic and load.
The problems still reflect the importance of the node to a certain extent. In this study, the combination of node number and degree was used to select the important nodes in the network. The medians were sorted in order of largest to smallest, and the nodes with a large median were preferentially selected for attack. When the intermediate of the nodes was the same, we prioritized attacking nodes with larger degrees.

4. Results Analysis and Discussion

4.1. Case Description

To better verify the proposed LSSC model and indicators, we constructed a case study of an LSSC. This case was created based on the previous LSSC with ANE as an integrator, and the important relationships of the original ANE supply chain were retained. The network includes 16 customers (numbers 1–16), three logistics service integrators (numbers 17–19), and eight logistics service providers (numbers 20–27). Among them, the network mainly flows from the provider to the integrators and the customer, and the integrators flows to the customer. Therefore, to improve these flows, we propose the following assumptions:
(1)
Each integrator enters the network and randomly establishes connections with eight customers.
(2)
Each logistics service provider enters the network and randomly establishes connections with two logistics service integrators and six customers.
Based on the two assumptions, the edge rights of the network were identified. Here, the node connections are shown in Table 1.
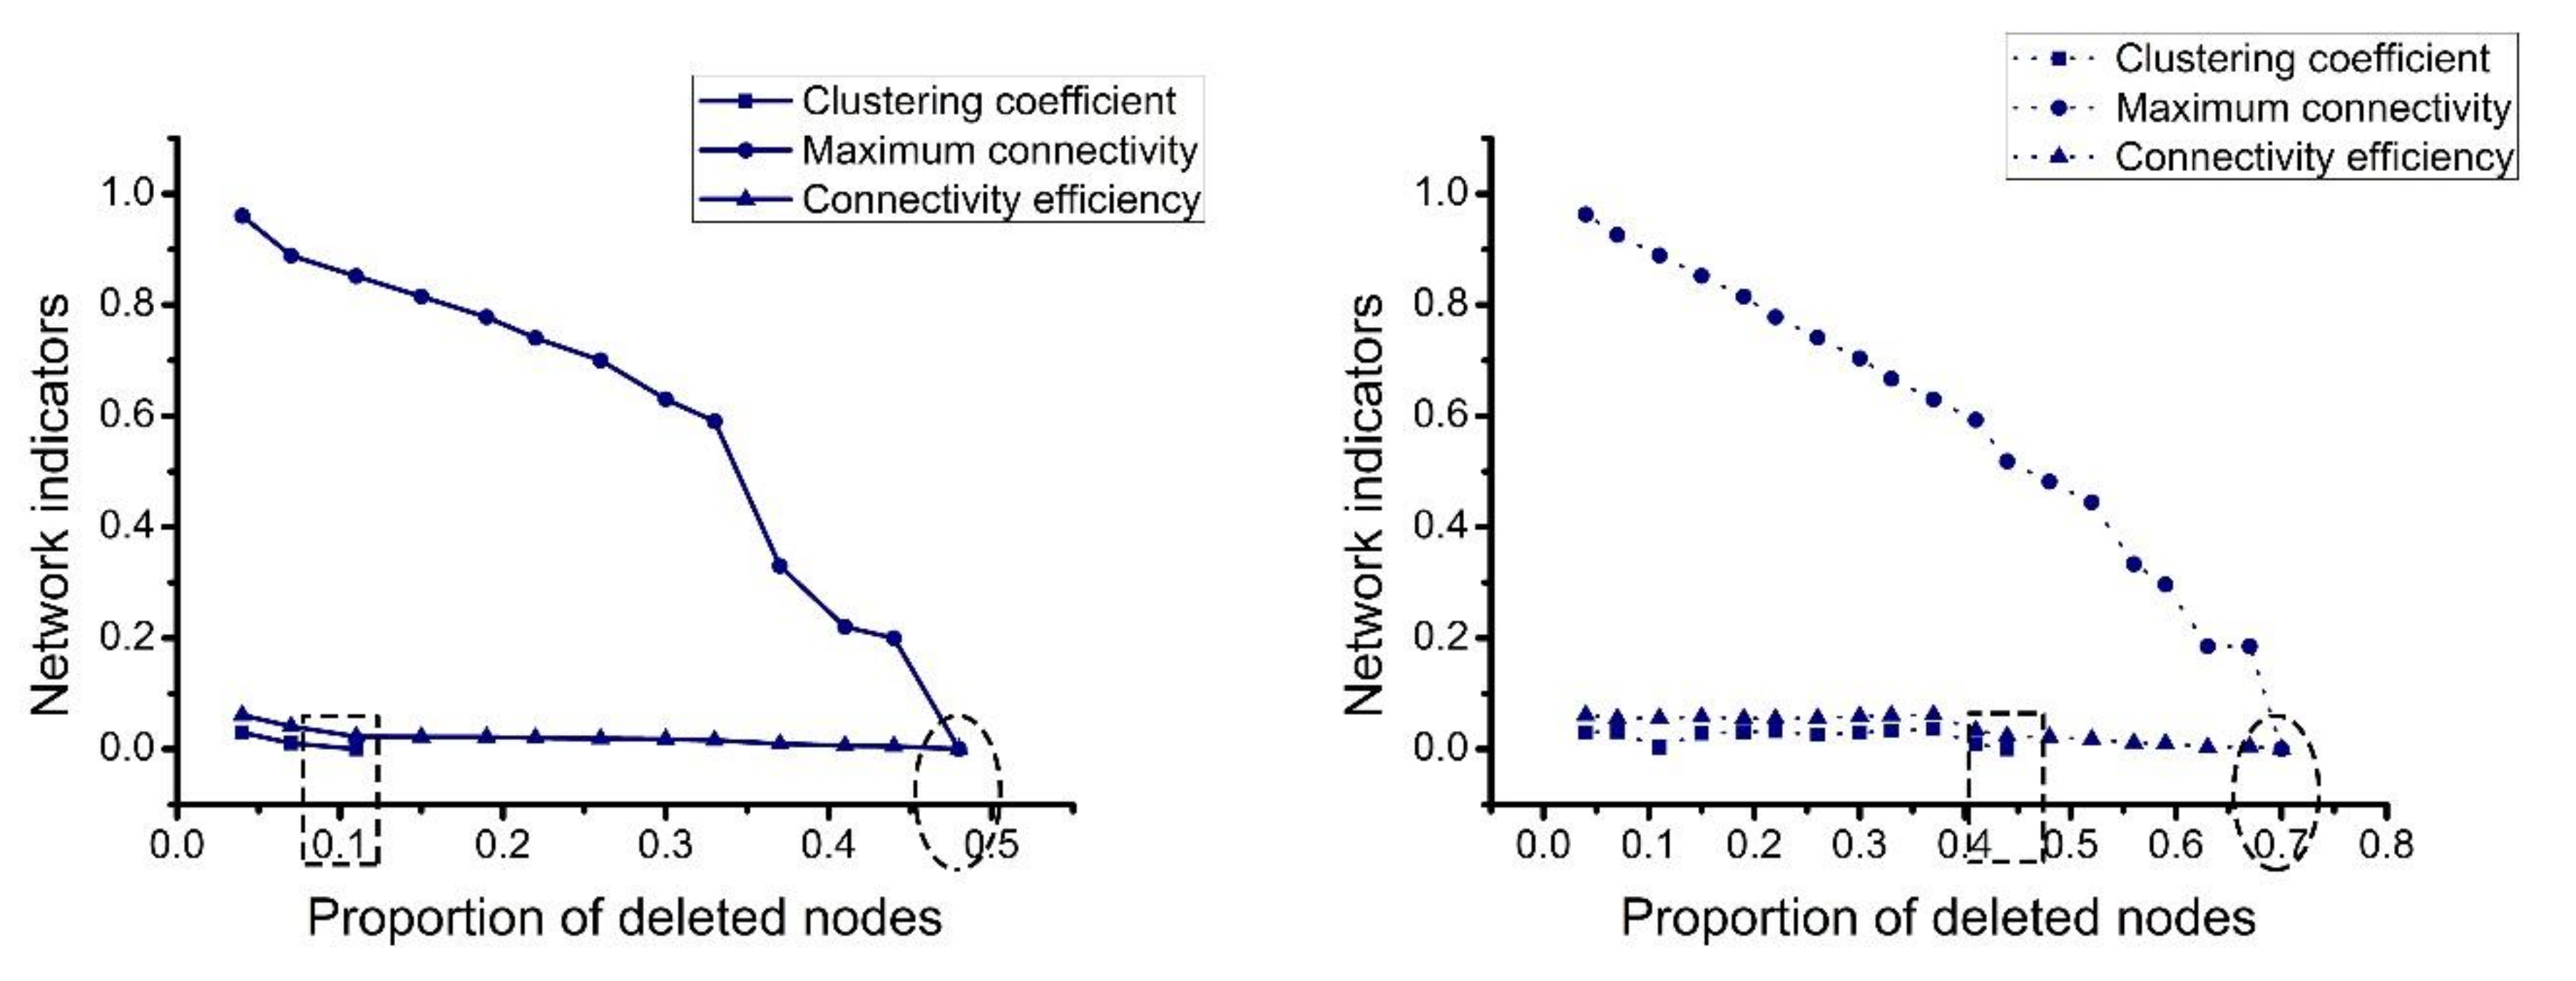
First, we calculated the degree and intermediate of nodes in the network, determined the attack order of deliberate attacks, and performed random attacks on the network. The performance of the network indicators is presented in Figure 5 and Figure 6.
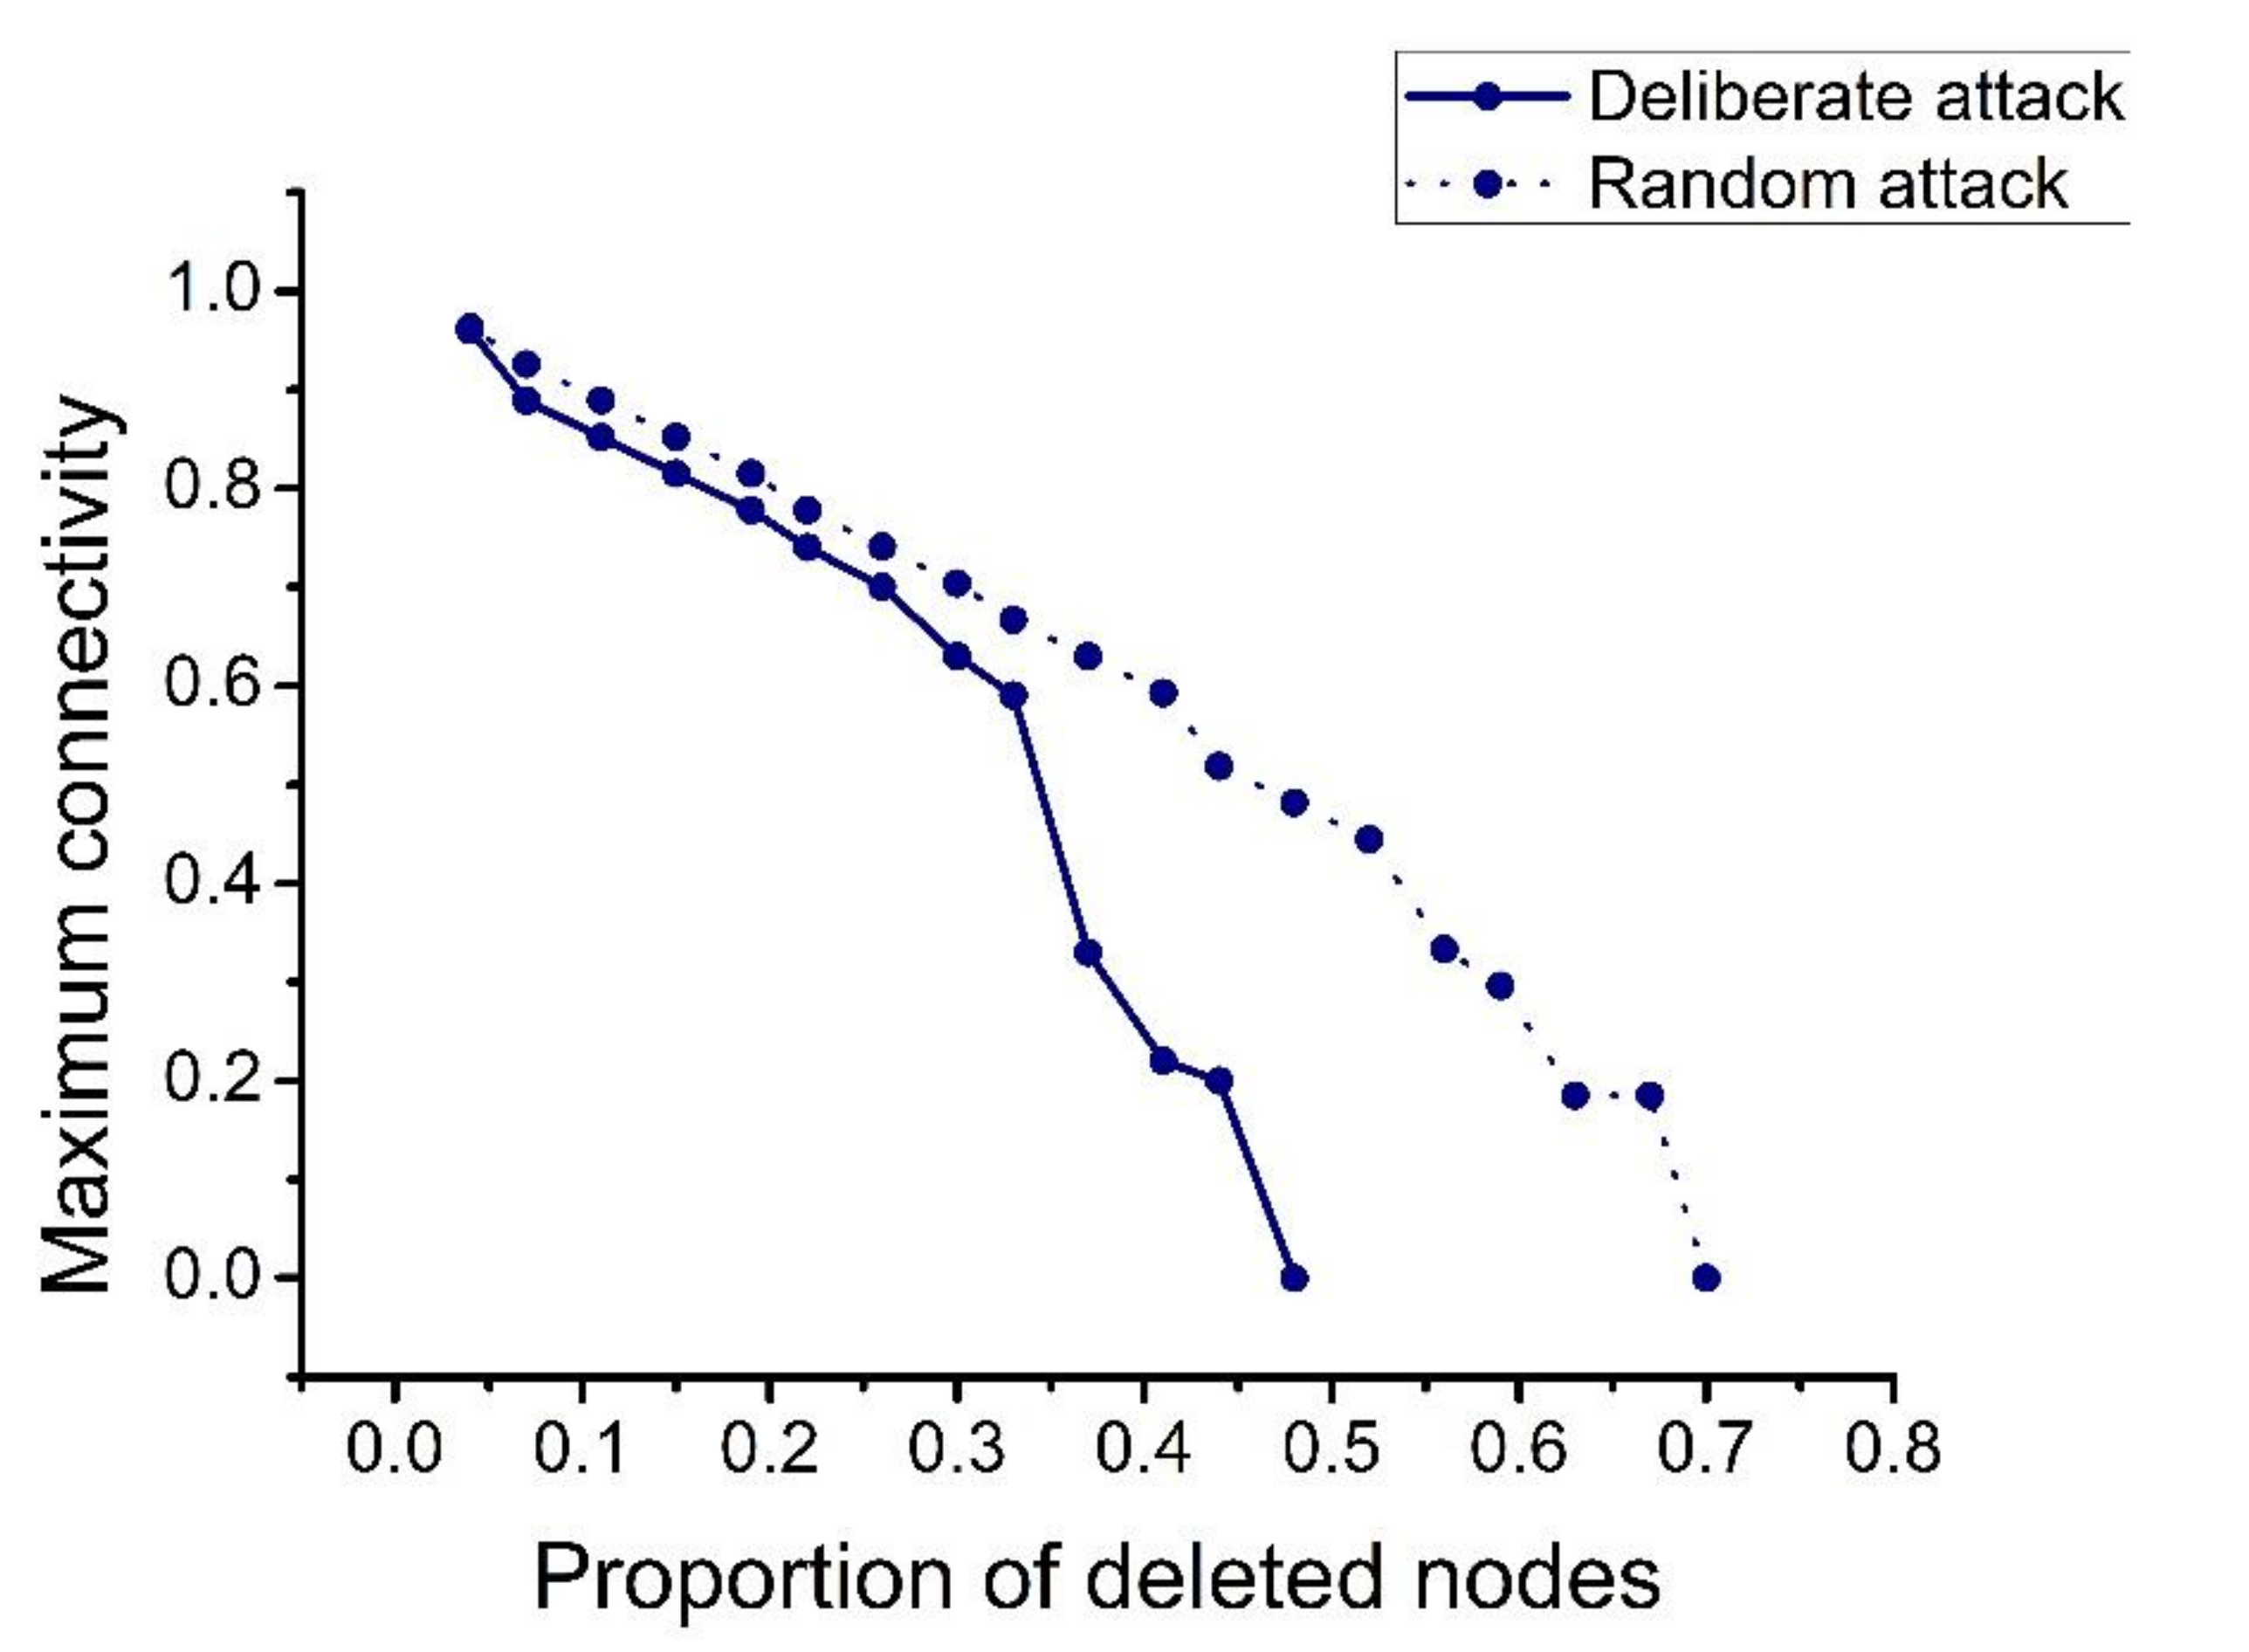
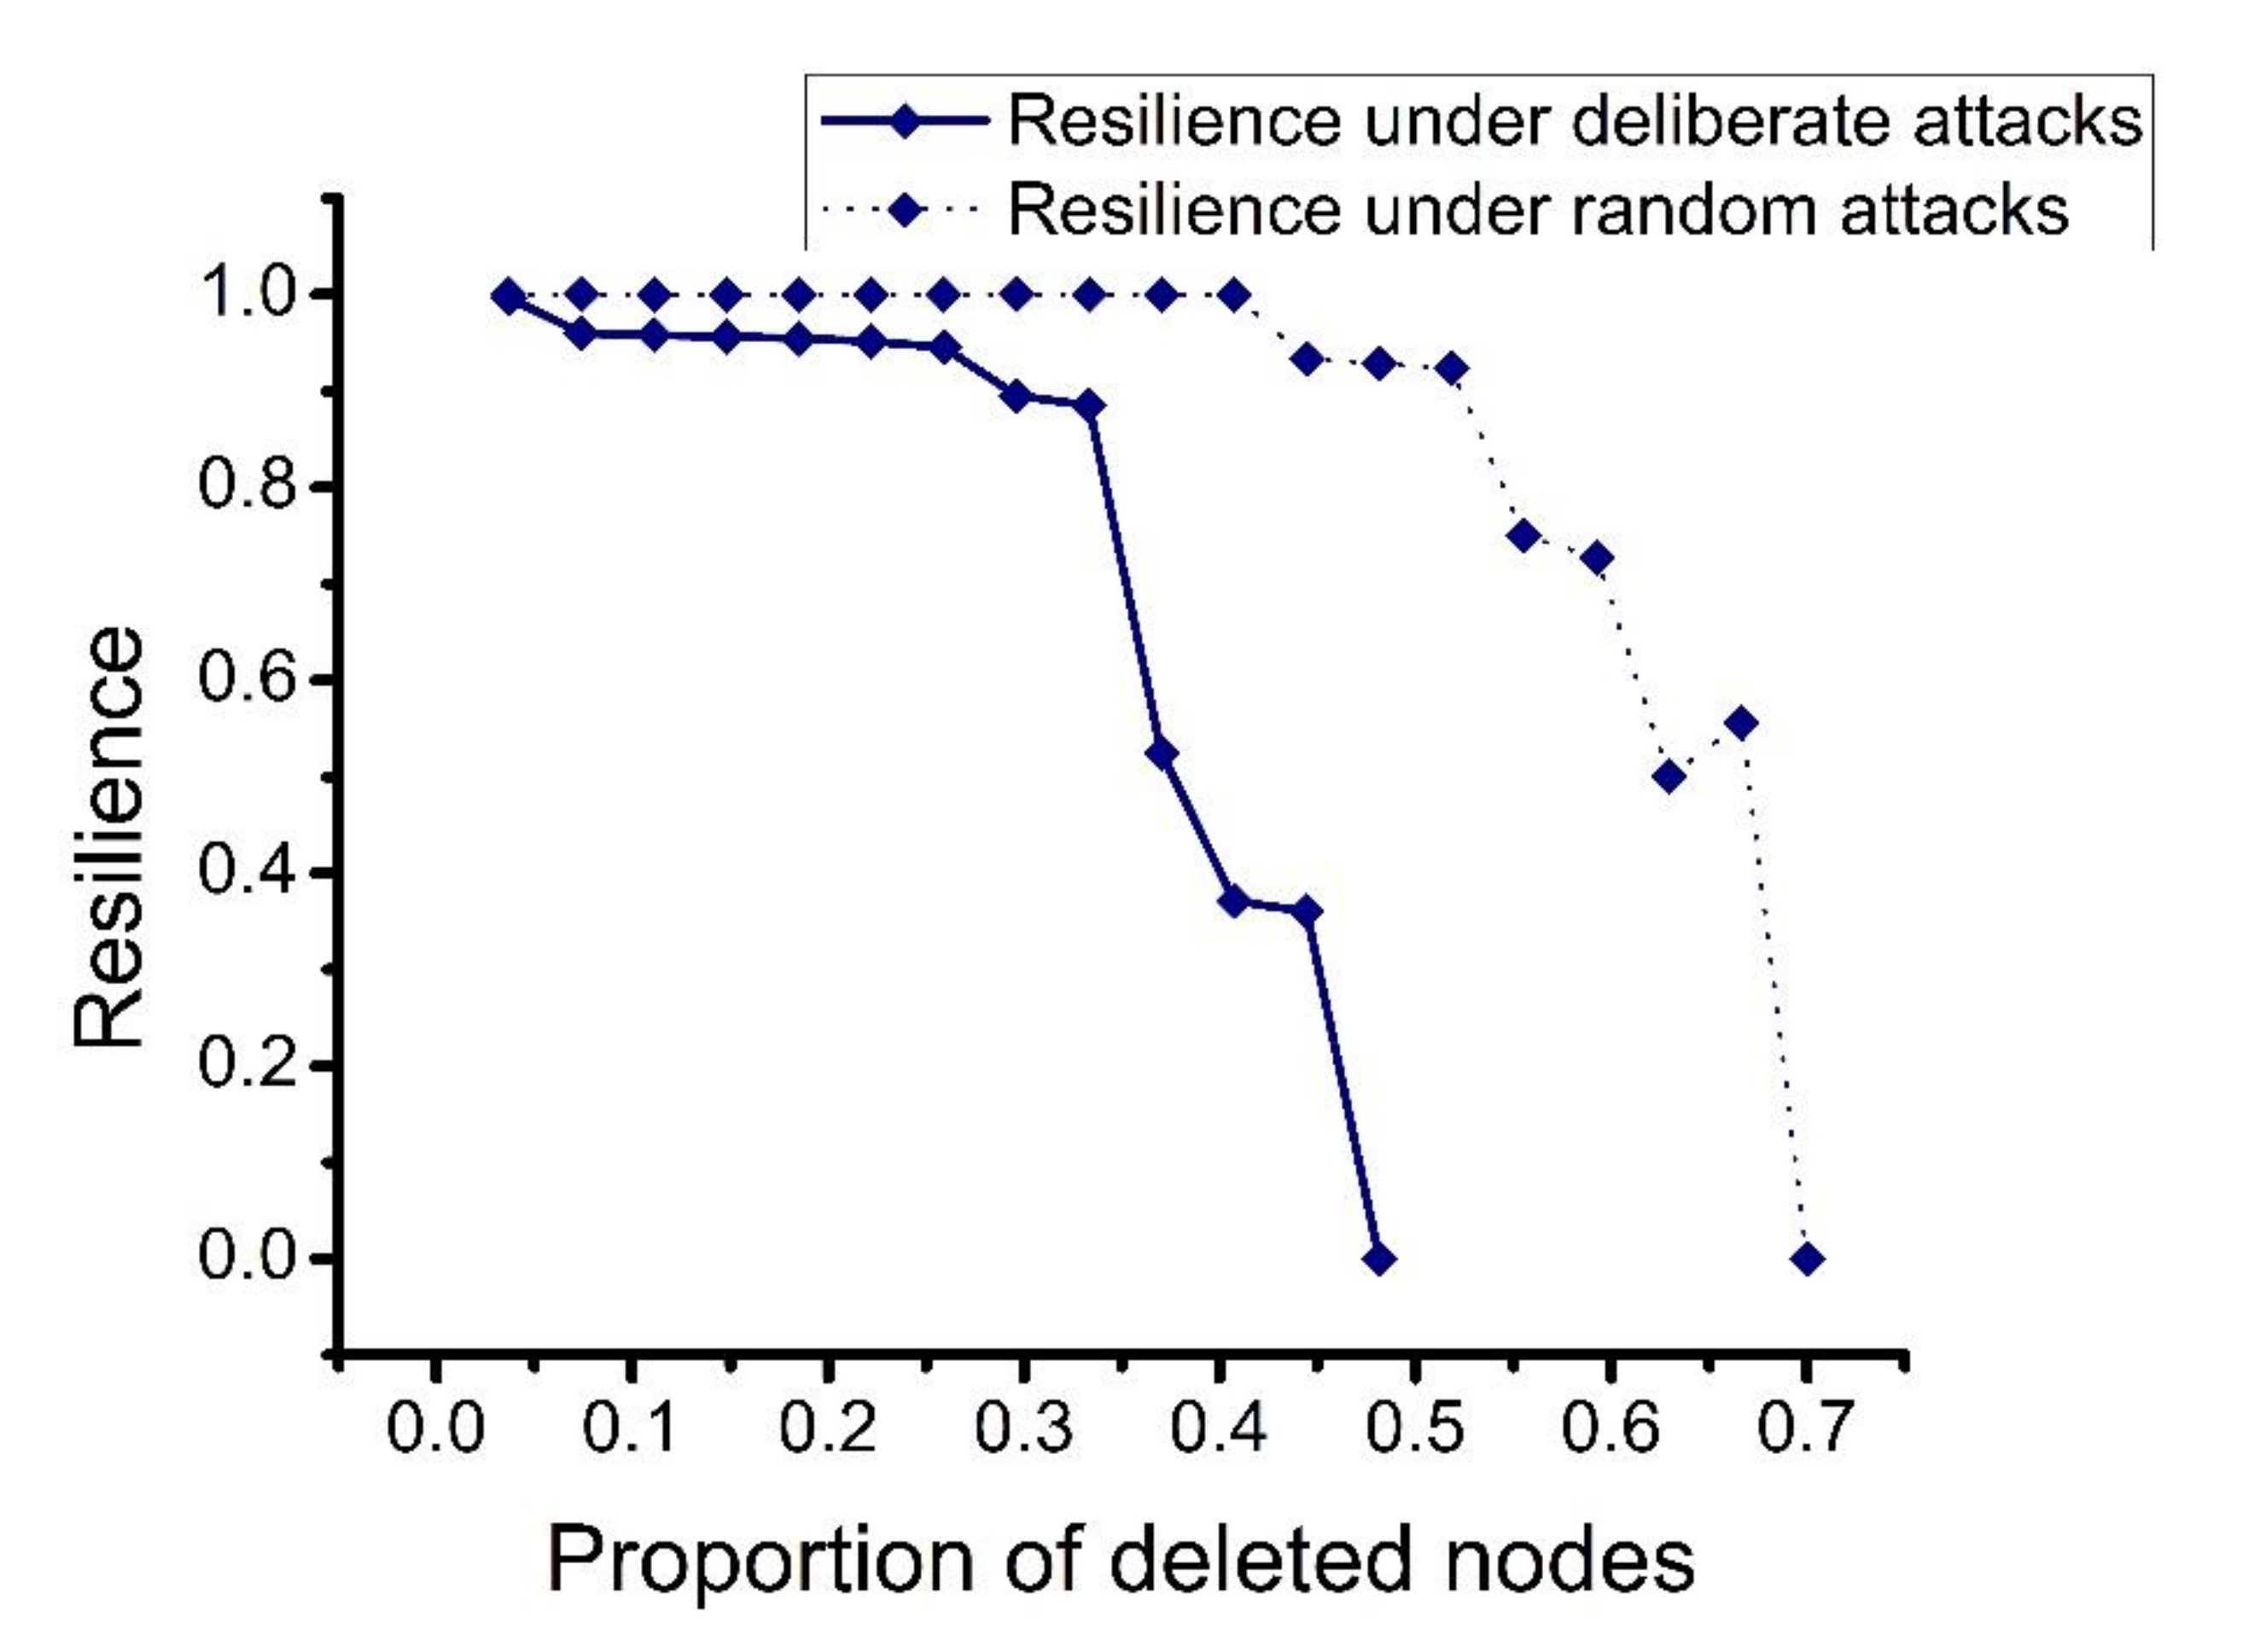
Second, we compared the data of the three networks: clustering coefficient, maximum connectivity, and network connectivity efficiency, in two attack modes. The results showed that as the proportion of node deletion increases, all three indicators fluctuate, but the magnitudes of change are different. The specific results are shown in Figure 7, Figure 8 and Figure 9. Considering the above factors, we conducted a resilience analysis of the LSSC network. The results are shown in Figure 10.

4.2. Result Analysis

4.2.1. Single Chart Analysis

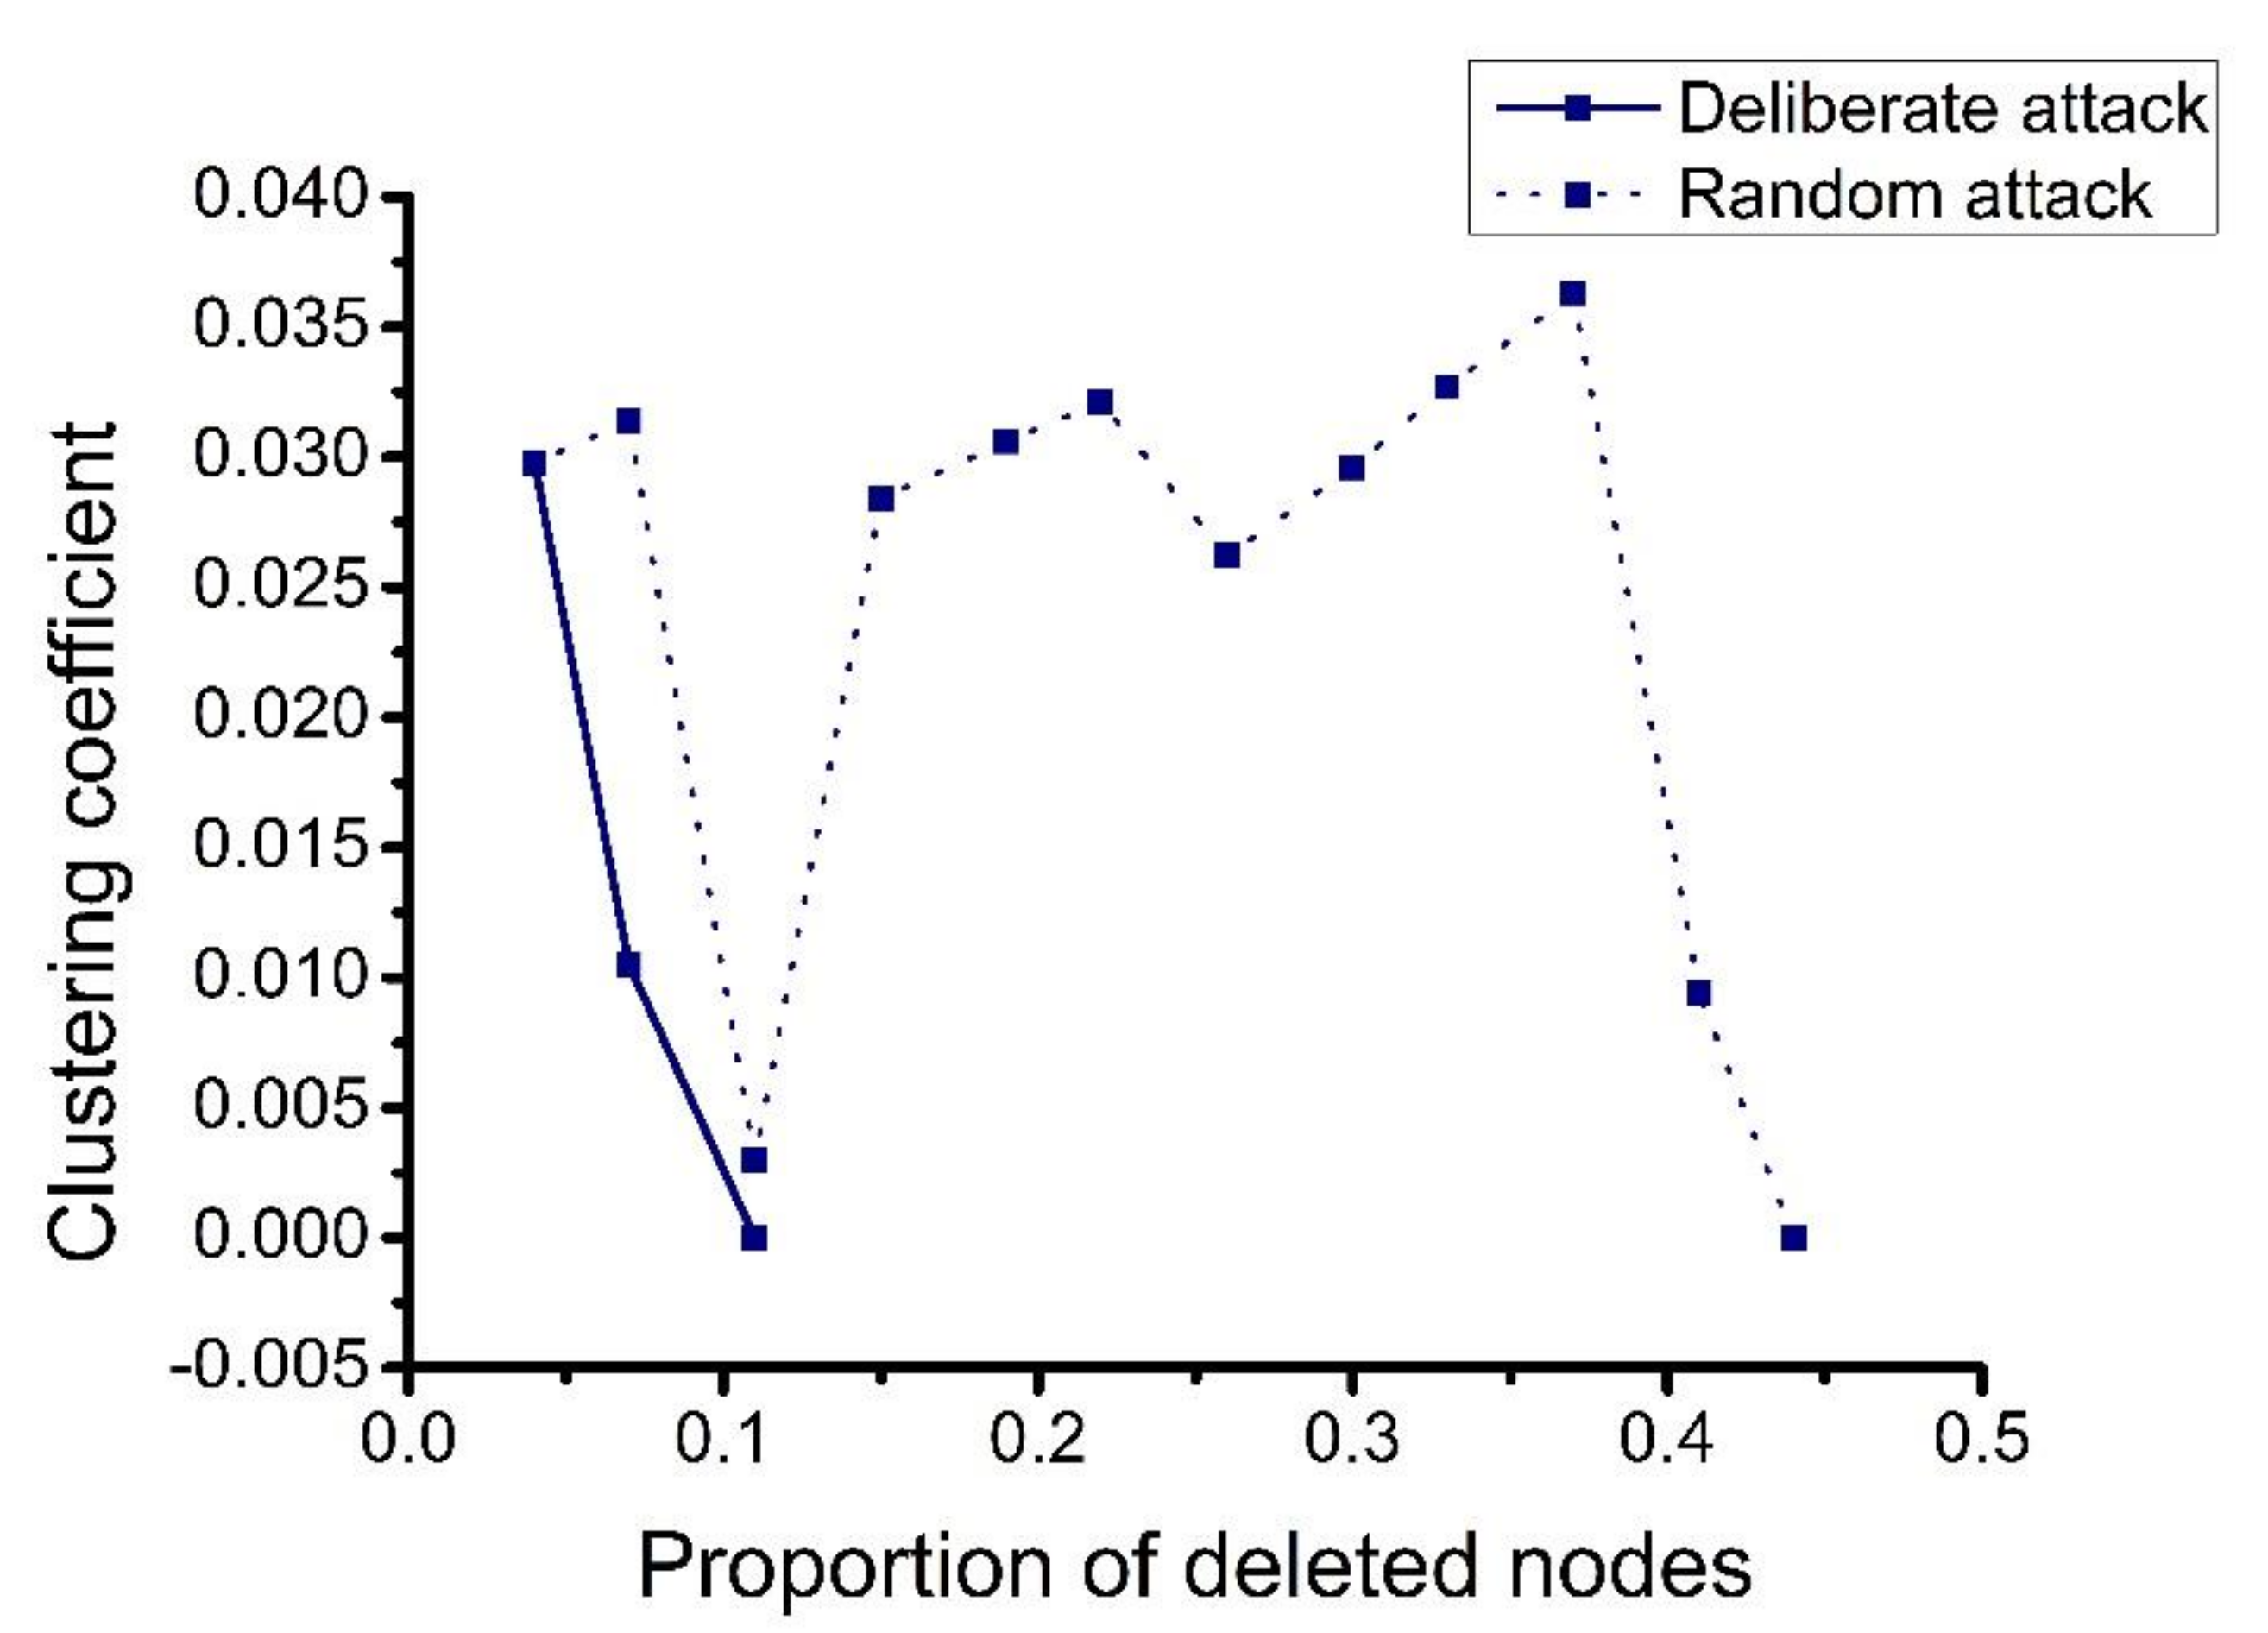
As shown in Figure 11, in the case of deliberate attacks, when the proportion of deleted nodes reaches 0.1, the value of the clustering coefficient drops to 0. In the case of random attacks, as the node deletion ratio increases, the clustering coefficient fluctuates continuously; when the node deletion rate reaches about 0.45, the clustering coefficient drops to 0. In the state of deliberate attack, when the LSSC is subjected to a small number of attacks, the clustering coefficient is 0, the tightness is greatly reduced, and the deliberate attack has a large impact on the network. Under a random attack, when the node deletion ratio is 0.1, the clustering coefficient did not decrease to 0. When the node deletion ratio reaches 0.45, the clustering coefficient of the network becomes 0. In the case of random attacks, the network can sustain more attacks, indicating that random attacks have less of an impact on the network. The clustering coefficient represents the degree of aggregation between nodes and nodes in a graph. It is expressed by the ratio of the number of connected sides existing between adjacent points to the number of connected sides in theory. In deliberate attacks, the nodes with large degrees and medians in the network are deleted preferentially; in random attacks, the selected points are not regular and the clustering coefficients change indefinitely. This shows that the important nodes that are screened out based on degrees and mediation strongly influence the network clustering coefficient. In real life applications, this standard can be used to judge the influence of nodes on network clustering coefficients.
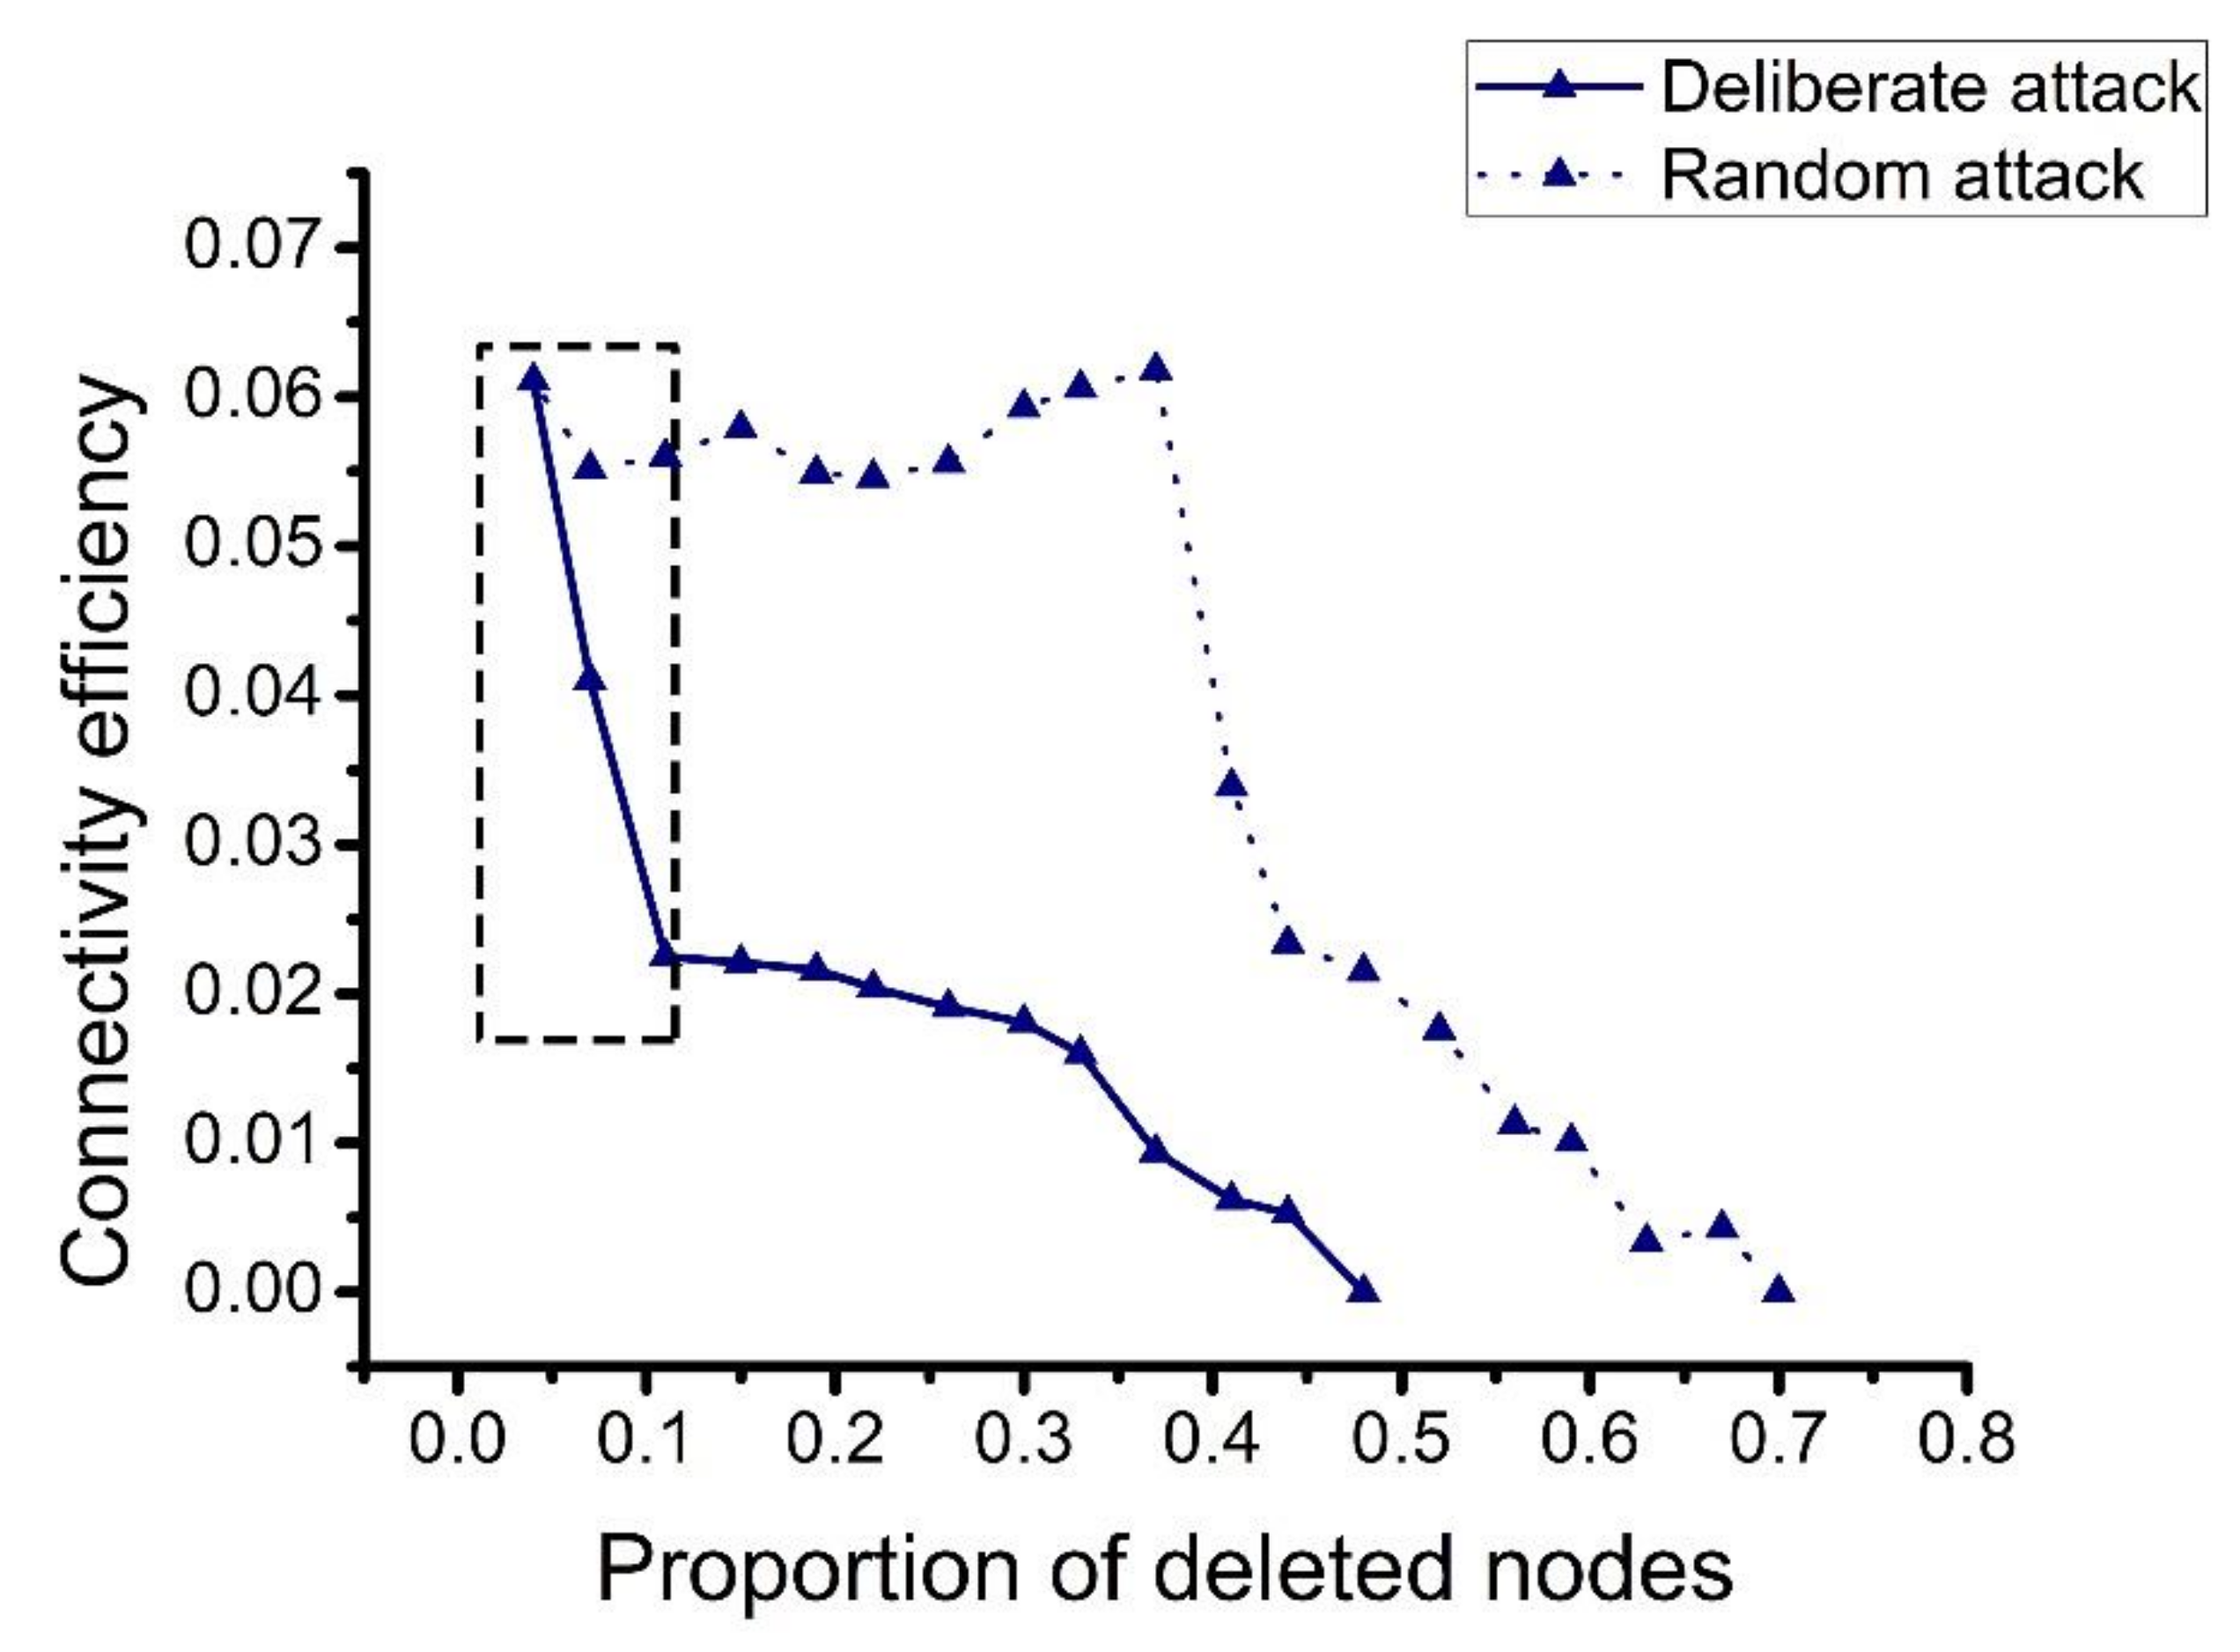
In Figure 12, as the node deletion ratio increases, the network connectivity efficiency under deliberate attacks decreases very quickly, whereas network connectivity efficiency under random attacks decreases in fluctuations. Figure 11 shows that the degree and the number of nodes have a strong influence on the index of network connectivity efficiency. In other words, after the nodes with large degrees and large numbers are deleted, the optimal path in the network becomes much longer overall. When this situation occurs in real life, the logistics costs significantly increase, the logistics efficiency decreases, and the level of logistics services lowers.
As the proportion of deleted nodes increases, the elasticity of the network decreases in fluctuations. In deliberate attack mode, when the proportion of deleted nodes reaches 0.3, the elasticity declines faster, and when the proportion of deleted nodes reaches 0.5, the network elasticity is 0. In the random attack mode, when the node deletion ratio reaches 0.5, the elasticity reduction speed greatly accelerates. When the node deletion ratio reaches 0.7, the network elasticity is 0. Deliberate attacks have more of an impact on the decline in resilience.
In summary, scientifically judging whether a node is important according to the size of nodes and degrees can be applied in real life. The degree and the betweenness of nodes have a strong influence on the clustering coefficient and network connectivity efficiency; however, the impact on the maximum connectivity of the network is relatively small. This shows that the network constructed in this study is relatively uniform. The node’s degree and betweenness mainly affect the degree of network aggregation and network efficiency, and have a little impact on the connectivity.

4.2.2. Comprehensive Analysis

In Figure 13, the damage caused by deliberate attacks is far greater than the damage caused by random attacks. In deliberate attack mode, when the proportion of the deleted node reaches 0.2, the clustering coefficient of the network becomes 0, and the network cannot function. In the case of random attacks, when the node deletion ratio reaches 0.45, the clustering coefficient becomes 0. In the case of a deliberate attack, the maximum connectivity and network connectivity efficiency decrease to 0 when the node deletion ratio reaches 0.48. In the case of random attacks, the maximum connectivity and network connectivity efficiency decrease to 0 when the node deletion ratio reaches 0.7. The impacts of the node deletion ratio on the network under different attack modes are quite different. Hence, the deliberate attack is conducted according to the importance of the node. After the important node is destroyed, the impact is large. Under random attacks, nodes are randomly selected, and the selected nodes are not necessarily important, so the damage caused is also uncertain. Therefore, the damage caused by deliberate attacks is far greater than the damage caused by random attacks.
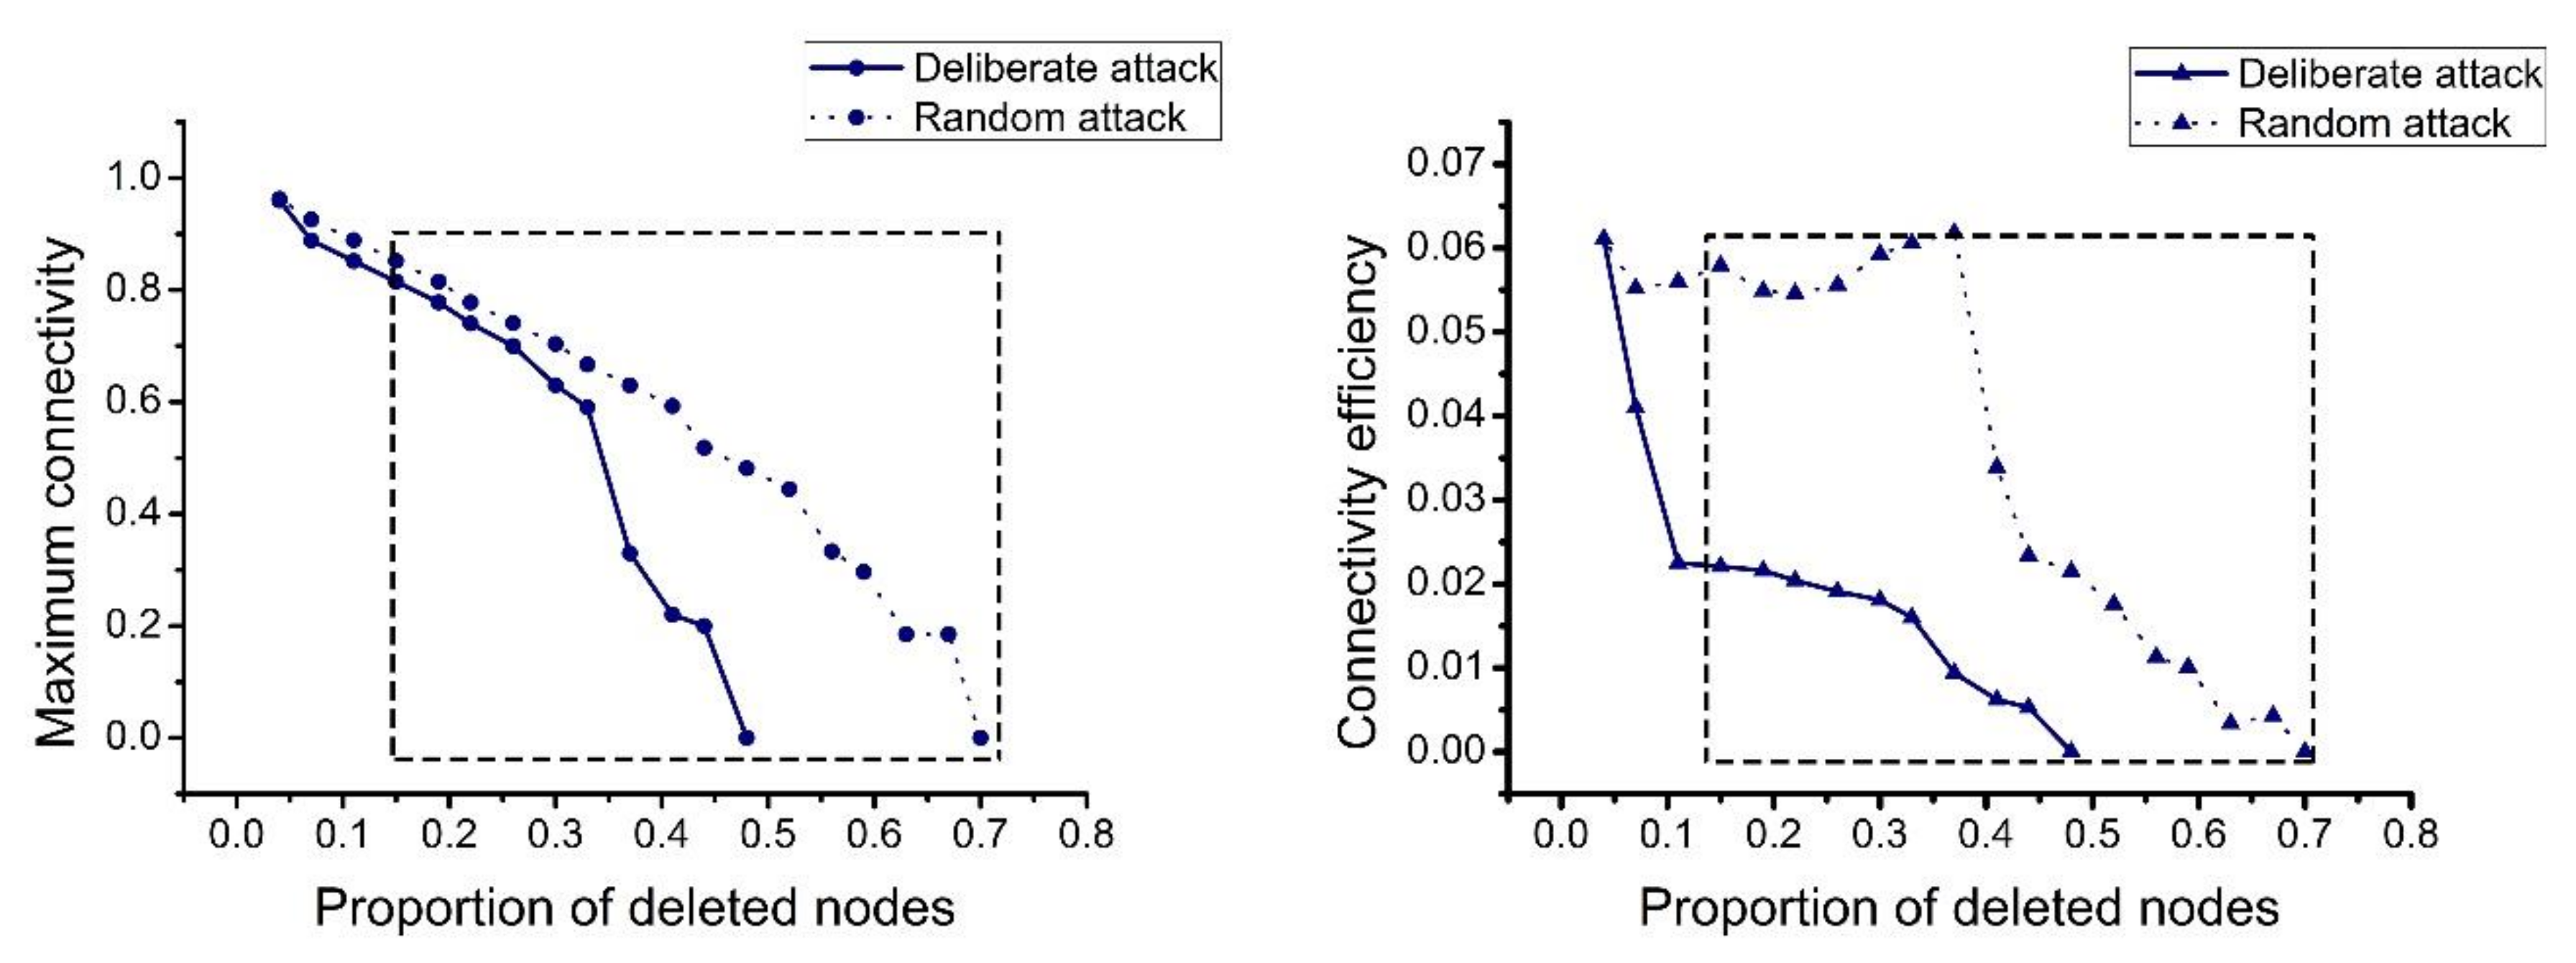
Figure 14 shows that logistics service integrators have a large impact on the decline of the network indicators. In the case of random attacks, the three indicators of the network (clustering coefficient, maximum connectivity, and connectivity efficiency) do not linearly decrease with the increase in deleted nodes; they decrease with fluctuations. The analysis of the deleted node order reveals that when the node of the logistics service integrators is deleted, several network indicators decline at a rate that is generally the largest compared with other nodes. The mediators and degree of logistics service integrators are relatively large. Therefore, they are important in the network. Some nodes have a low median and degree and are not closely related to other nodes in the network. The clustering coefficient of the network is the largest. Connectivity and connectivity efficiency have a pulling effect. After deleting these nodes, the relevant indicators of the network do not decrease.
Figure 15 shows that even after the integrators are destroyed, the network is not destroyed. Many connections remain in the network because logistics service providers still directly provide services to customers. This is similar to the logistics service supply chain network in real life. The destruction of the integrators will not cause the whole network to be paralyzed. The logistics service provider directly provides services to the customers, which also proves the rationality of the model.

5. Conclusions and Policy Recommendations

Based on previous studies, we further developed the basic LSSC structure, and combined with complex network theory, constructed an extended directed graph to represent the LSSC network structure, and proposed an example for simulation. After verification, the proposed LSSC model was found to be realistic and scientific, which provides a new research direction for LSSC research. The results showed that the damage caused by deliberate attacks is far greater than that of random attacks; the status of integrators in the network is important. Once destroyed, the vulnerability of the network increases considerably, but even if all integrators are destroyed, the network will not completely fail because there are still some weak connection nodes that maintain the operation of the network. Accordingly, the following policies and recommendations are proposed:
(1)
Protecting important nodes and preventing deliberate attacks. In our analysis, the damage caused by deliberate attacks was found to be far greater than the damage caused by random attacks. Therefore, it is necessary to focus on preventing the occurrence of deliberate attacks. When a deliberate attack occurs, minimizing the damage is then necessary. Deliberate attacks mainly focus on the important nodes in the network. Therefore, the protection of important nodes must be strengthened by establishing a joint protection network for important nodes and preventing problems before they occur.
(2)
Strengthening the protection of logistics service integrators. Logistics service integrators have a strong impact on the decline of network indicators and network vulnerability. Once the logistics integrators are destroyed, the operational efficiency of the network greatly decreases. Therefore, strengthening the protection of logistics service integrators and the robustness of the logistics service integrator nodes are essential for maintaining the normal operation of the network.
(3)
Paying attention to the role of weak connections. Many connections in the network still exist after the integrator is destroyed because the network is not destroyed; these connections maintain the basic operation of the network. They are not important when the integrator is not destroyed and are considered weak connections. When the integrators’ nodes are destroyed, they become important nodes for maintaining the network. Therefore, it is necessary to pay attention to the role of the weak connections. It is important to keep in touch with some weakly connected companies, and companies should manage them as emergency companies to help them better respond to emergencies.
(4)
Preventing deliberate attacks and enhancing the flexibility of the logistics service supply chain. When a deliberate attack occurs, the resilience of the network decreases rapidly. Enterprises can improve network flexibility by designing early warning mechanisms, optimizing original plans, and responding to emergencies afterwards.
We mainly examined the network vulnerability caused by the change in LSSC nodes. The LSSC network is composed of logistics service integrators, suppliers, and customers. This is an important practical issue for studying the stability of LSSCs. In the future, we will introduce capacity flow and load changes as important factors and further explore the vulnerability evolution law of LSSCs caused by these changes.

Author Contributions

F.M. established the research framework; F.M. and H.X. jointly established the research model; H.X., Q.S., S.Z., and Y.Z. collected the data and carried out the result calculations; K.H. provided the data acquisition channel; and K.F.Y. and H.X. analyzed the results and wrote the paper together; K.F.Y. revised the paper. All authors have read and agreed to the published version of the manuscript.

Funding

This research was funded by Ministry of Education Humanities and Social Science Fund Project [grant number 17YJCZH125], the National Social Science Fund of China [grant number 18BGL258, 17BJY139], the Fundamental Research Funds for the Central Universities, CHD”[grant number 300102238401, 300102239612, 300102238655, 300102230611].

Conflicts of Interest

The authors declare no conflicts of interest.

References

  1. Dmitry, I.; Ajay, D.; Tsan-Ming, C. New flexibility drivers for manufacturing, supply chain and service operations. Int. J. Prod. Res. 2018, 56, 4067. [Google Scholar]
  2. Nilsson, F.R. A complexity perspective on logistics management Rethinking assumptions for the sustainability era. Int. J. Logist. Manag. 2019, 30, 681–698. [Google Scholar] [CrossRef] [Green Version]
  3. Asgari, N.; Nikbakhsh, E.; Hill, A.; Farahani, R.Z. Supply chain management 1982–2015: A review. Ima J. Manag. Math. 2016, 27, 353–379. [Google Scholar] [CrossRef] [Green Version]
  4. Cai, C. Contract Design of Logistics Service Supply Chain Considering Reliability. Ph.D. Thesis, Shenyang University of Technology, Shenyang, China, 2019. [Google Scholar]
  5. Liang, K. Research on TD Company’s Transportation Supplier Management under the Model of Logistics Service Supply Chain. Master’s Thesis, Shijiazhuang Tiedao University, Shijiazhuang, China, 2018. [Google Scholar]
  6. Muller, E.J. The Top Guns of Third-party Logistics. Distribution 1993, 92, 30–38. [Google Scholar]
  7. Tian, Y. Supplier Selection in Constructing Logistics Service Supply Chain. Syst. Eng. Theory Pract. 2003, 23, 49–53. [Google Scholar]
  8. Cui, A.; Liu, W. LSSC coordination based on competence division and cooperation. J. Shanghai Marit. Univ. 2008, 2, 43–47. [Google Scholar]
  9. Liu, W.; Bai, E.; Liu, L.; Wei, W. A Framework of Sustainable Service Supply Chain Management: A Literature Review and Research Agenda. Sustainability 2017, 9, 421. [Google Scholar] [CrossRef] [Green Version]
  10. Akkermans, H.; Vos, B. Amplification in service supply chains: An exploratory case study from the telecom industry. Prod. Oper. Manag. 2003, 12, 204–223. [Google Scholar] [CrossRef] [Green Version]
  11. Gunter, S.; Wilhelm, W.E. Strategic, Tactical and Operational Decisions in Multi- national Logistics Networks: A Review and Discussion of Modeling Issues. Int. J. Prod. Res. 2000, 38, 7. [Google Scholar]
  12. Yan, X.; Sun, L.; Wang, K. Research on Performance Evaluation and Characteristics in Logistics Service Supply Chain. China Mech. Eng. 2005, 11, 969–974. [Google Scholar]
  13. Choy, K.L.; Li, C.-L.; So, S.C.K.; Lau, H.; Kwok, S.K.; Leung, D.W.K. Managing uncertainty in logistics service supply chain. Int. J. Risk Assess. Manag. 2007, 7, 61–65. [Google Scholar] [CrossRef]
  14. Gao, Z.; Zhu, W.; Chen, S. Research on the Integration of Logistics Service Supply Chain. China Bus. Mark. 2017, 31, 46–54. [Google Scholar]
  15. Zhang, G.; Liu, W. Mechanism of Network Vulnerability of Logistics Service Supply Chain Based on Complex Network Theory. J. Bus. Econ. 2016, 12, 19–27. [Google Scholar]
  16. Demirkan, H.; Cheng, H.K. The risk and information sharing of application services supply chain. Eur. J. Oper. Res. 2008, 187, 765–784. [Google Scholar] [CrossRef]
  17. Wu, Y.; Wang, J.; Li, C. Decisions of Supply Chain Considering Chain-to-Chain Competition and Service Negative Spillover Effect. Sustainability 2019, 11, 1612. [Google Scholar] [CrossRef] [Green Version]
  18. Daryanto, Y.; Wee, H.M.; Astanti, R.D. Three-echelon supply chain model considering carbon emission and item deterioration. Transp. Res. Part E Logist. Transp. Rev. 2019, 122, 368–383. [Google Scholar] [CrossRef]
  19. Novais, L.; Manuel Maqueira, J.; Ortiz-Bas, A. A systematic literature review of cloud computing use in supply chain integration. Comput. Ind. Eng. 2019, 129, 296–314. [Google Scholar] [CrossRef]
  20. Guerrero Campanur, A.; Olivares-Benitez, E.; Miranda, P.A.; Eleazar Perez-Loaiza, R.; Ablanedo-Rosas, J.H. Design of a Logistics Nonlinear System for a Complex, Multiechelon, Supply Chain Network with Uncertain Demands. Complexity 2018, 2018. [Google Scholar] [CrossRef]
  21. Zou, Y.; Donner, R.V.; Marwan, N.; Donges, J.F.; Kurths, J. Complex network approaches to nonlinear time series analysis. Phys. Rep. Rev. Sect. Phys. Lett. 2019, 787, 1–97. [Google Scholar] [CrossRef]
  22. Wang, H.; Wang, J.; Small, M.; Moore, J.M. Review mechanism promotes knowledge transmission in complex networks. Appl. Math. Comput. 2019, 340, 113–125. [Google Scholar] [CrossRef]
  23. Tsiotas, D.; Charakopoulos, A. Visibility in the topology of complex networks. Phys. A Stat. Mech. Appl. 2018, 505, 280–292. [Google Scholar] [CrossRef]
  24. Surana, A.; Kumara, S.; Greaves, M.; Raghavan, U.N. Supply-chain networks: A complex adaptive systems perspective. Int. J. Prod. Res. 2005, 43, 4235–4265. [Google Scholar] [CrossRef]
  25. ANE Logistics. Available online: http://www.ane56.com/ (accessed on 5 February 2020).
  26. Han, H. Research on ANE Logistics Service Supply Chain Risk Based on FMEA. Master’s Thesis, Ocean University of China, Qingdao, China, 2014. [Google Scholar]
  27. Kuaidi 100. Available online: https://www.kuaidi100.com/ (accessed on 5 February 2020).
  28. Qian, C.; Wang, S.; Liu, X.; Zhang, X. Low-Carbon Initiatives of Logistics Service Providers: The Perspective of Supply Chain Integration. Sustainability 2019, 11, 3233. [Google Scholar] [CrossRef] [Green Version]
  29. Zhang, G.; Liu, W. Vulnerability measurement research of complex network of logistics service supply chain. Comput. Eng. Appl. 2017, 53, 224–230. [Google Scholar]
  30. Adger, W.N. Vulnerability. Glob. Environ. Chang. 2006, 16, 268–281. [Google Scholar] [CrossRef]
  31. Chen, B.Y.; Lam, W.H.K.; Sumalee, A.; Li, Q.; Li, Z.-C. Vulnerability analysis for large-scale and congested road networks with demand uncertainty. Trans. Res. Part A Policy Pract. 2012, 46, 501–516. [Google Scholar] [CrossRef]
  32. Chen, X.; Li, J. Community detection in complex networks using edge-deleting with restrictions. Phys. A Stat. Mech. Appl. 2019, 519, 181–194. [Google Scholar] [CrossRef]
  33. Zhao, L.; W, X. Research Progress on Supply Chain Elasticity Management. J. Southeast Univ. 2019, 15, 21–27, 134. [Google Scholar]
  34. Liang, X. Research and Analysis on Simulation and Resilience of Container Logistics Center. Ph.D. Thesis, Wuhan University of Technology, Wuhan, China, 2018. [Google Scholar]
  35. Fan, P.; Xu, Y.; Cui, G. Research on Elasticity of Complex Network Model. Heilongjiang Sci. Technol. Inf. 2016, 33, 153. [Google Scholar]
  36. Ma, F.; Liu, F.; Yuen, K.F. Cascading Failures and Vulnerability Evolution in Bus-Metro Complex Bilayer Network under Rainstorm Weather Conditions. Int. J. Env. Res. Pub. He. 2019, 16, 1–30. [Google Scholar]
  37. Li, M. Invulnerability Reasearch of China High-Speed Railway Network based on Complex Network Theory. Master’s Thesis, Beijing Jiaotong University, Beijing, China, 2019. [Google Scholar]
  38. Ma, F.; Liang, Y.; Yuen, K.F.; Sun, Q.P. Assessing the vulnerability of urban rail transit network under heavy air pollution: A dynamic vehicle restriction perspective. Sustain. Cities Soc. 2020, 52, 1–13. [Google Scholar]
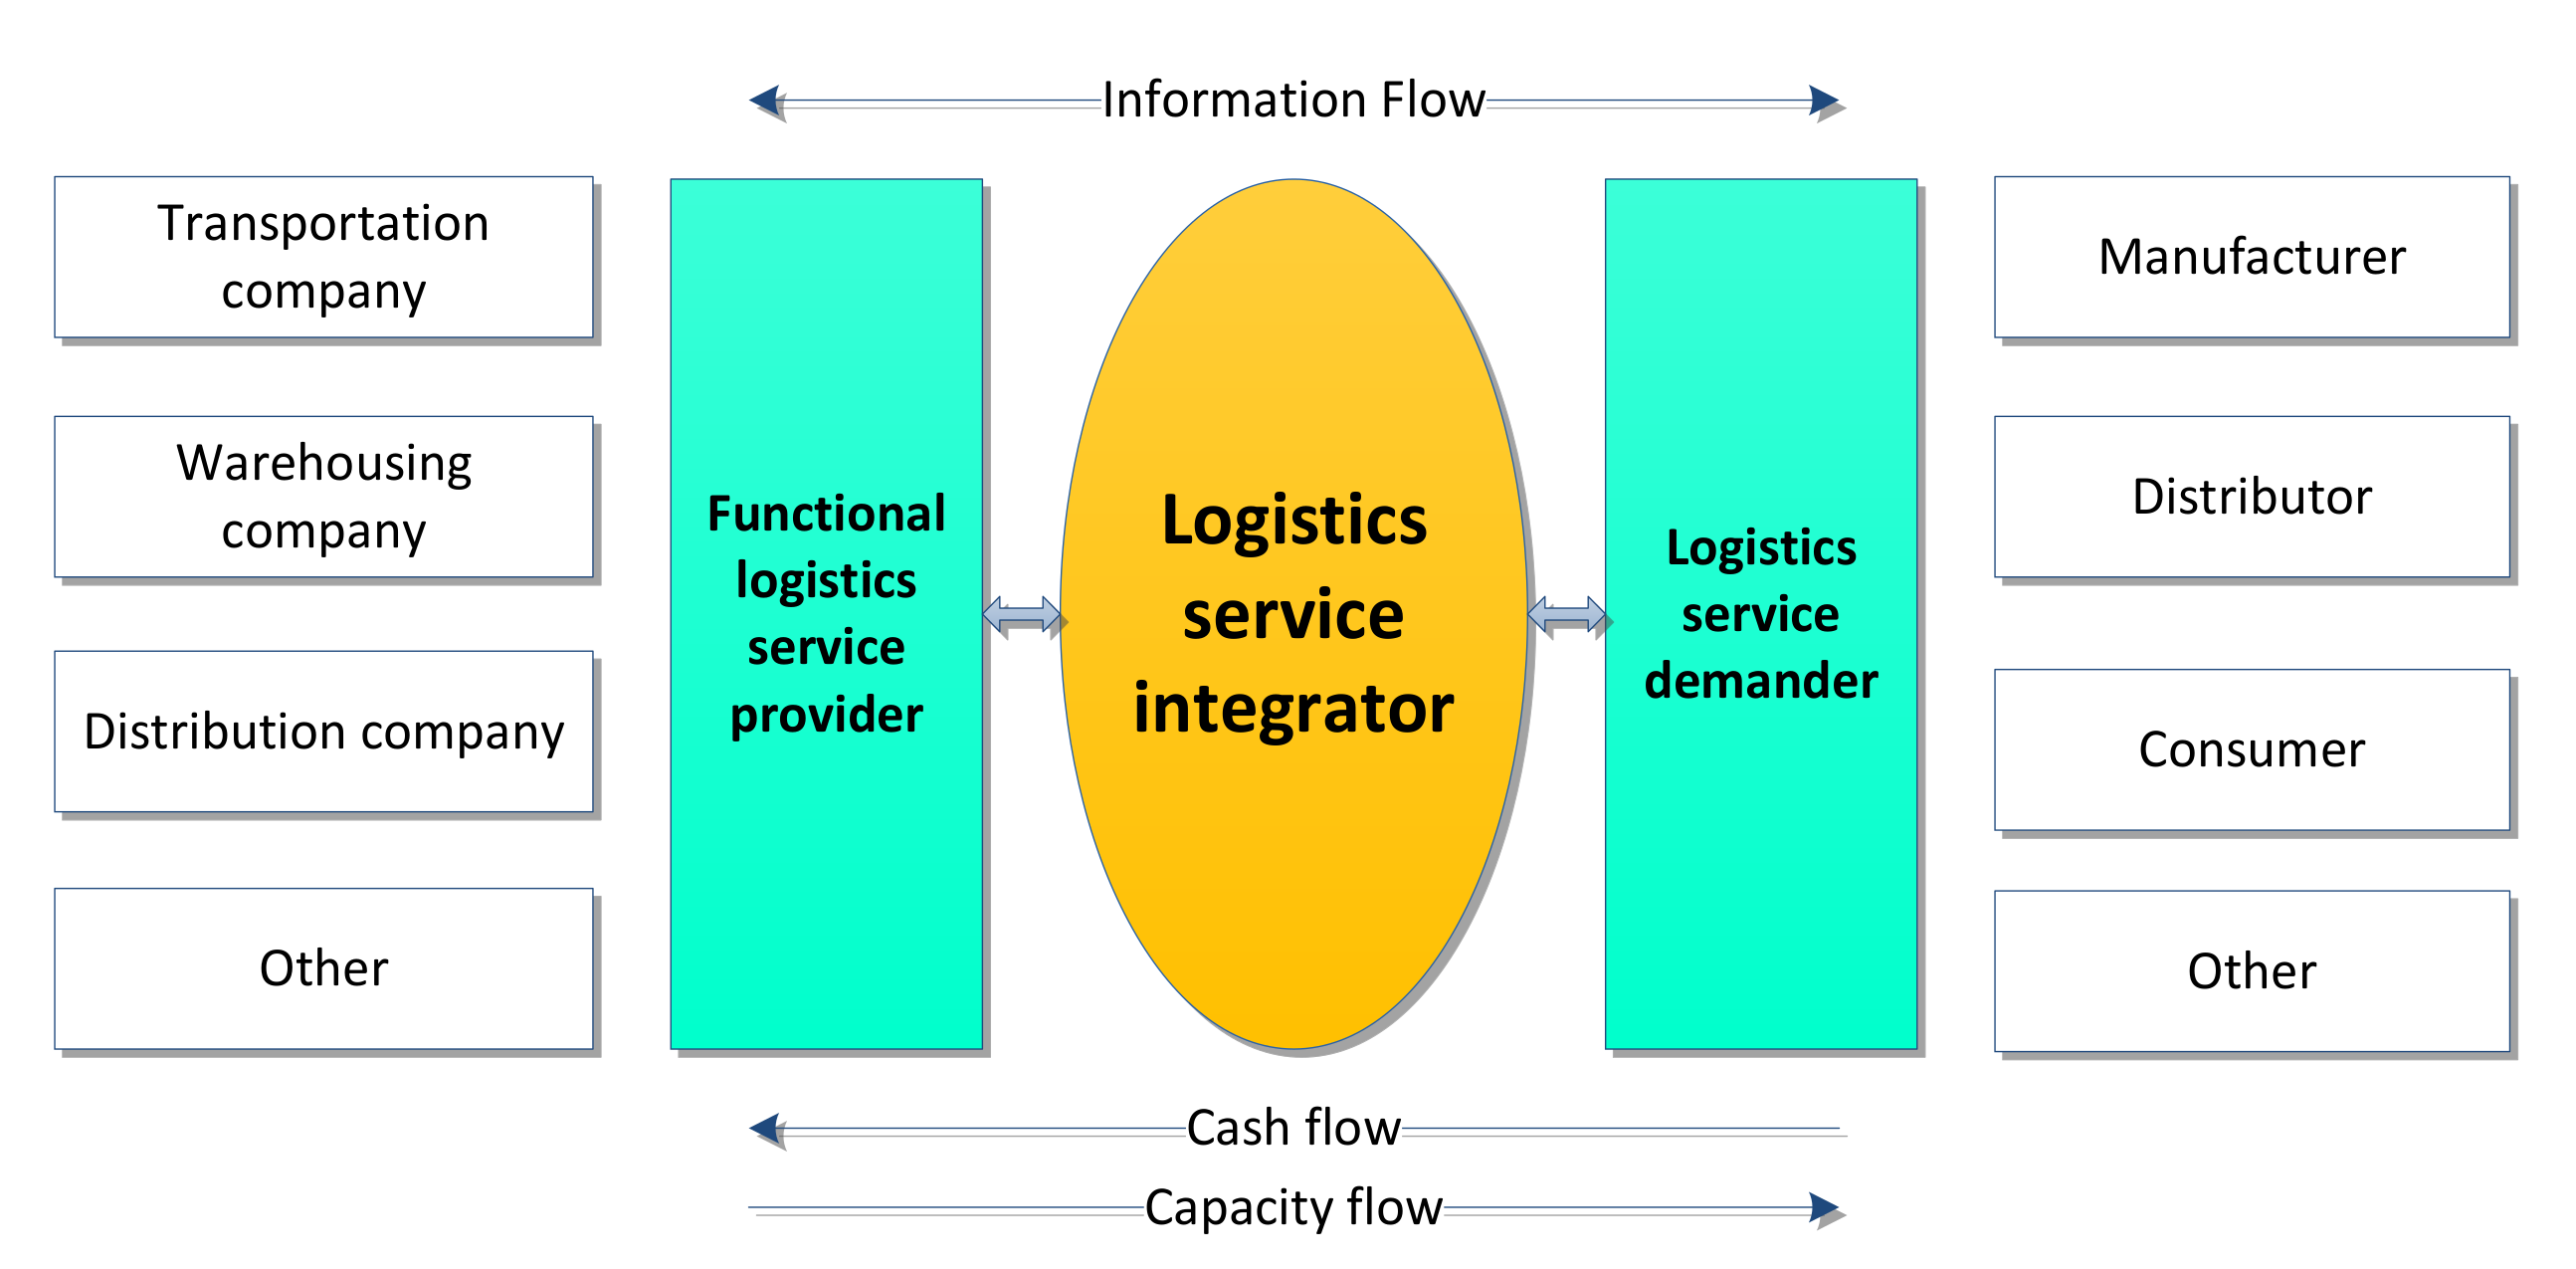
Figure 1. Structure of traditional logistics service supply chain.
Sustainability 12 01991 g001
Figure 2. The LSSC structure proposed in this study.
Sustainability 12 01991 g002
Figure 3. Relationship between the ANE, kuaidi100, JD and CREC.
Sustainability 12 01991 g003
Figure 4. Evolution process of the LSSC.
Sustainability 12 01991 g004
Figure 5. Deliberate attack.
Sustainability 12 01991 g005
Figure 6. Random attack.
Sustainability 12 01991 g006
Figure 7. Changes in clustering coefficients.
Sustainability 12 01991 g007
Figure 8. Changes in network connectivity efficiency.
Sustainability 12 01991 g008
Figure 9. Changes in maximum connectivity.
Sustainability 12 01991 g009
Figure 10. Resilience changes under different attacks mode.
Sustainability 12 01991 g010
Figure 11. Analysis of clustering coefficients.
Sustainability 12 01991 g011
Figure 12. Analysis of network connectivity efficiency.
Sustainability 12 01991 g012
Figure 13. The damage caused by deliberate attacks (left) and random attacks (right).
Sustainability 12 01991 g013
Figure 14. Impact of integrators on clustering coefficient (left), maximum connectivity (middle), and connectivity efficiency (right).
Sustainability 12 01991 g014
Figure 15. The changes in maximum connectivity (left) and connectivity efficiency (right).
Sustainability 12 01991 g015
Table 1. Network connections.
No.Out of PointEntry PointNo.Out of PointEntry PointNo.Out of PointEntry Point
1175 31204 612413
21715 322010 62246
31713 332119 632415
4176 342118 64245
5178 352110 65247
61711 362115 662518
7171 372112 672517
8172 382111 682515
91815 392113 692513
10186 402114 70255
111813 412218 712511
12186 422219 72258
13188 432212 732512
14185 44228 742617
151812 45222 752619
161810 46223 76265
17197 472210 772610
181914 482216 782612
19193 492319 79267
201916 502318 802613
21195 51234 81262
221913 522312 822719
23198 53236 832717
241911 54238 84273
252019 552313 852714
262018 56237 86274
27203 572315 87275
282015 582418 88271
29205 592419 89276
302011 602410