Influence of Weather Factors on Thermal Comfort in Subtropical Urban Environments

Abstract
1. Introduction
2. Materials and Methods
2.1. Study Area and Climate Conditions
2.2. Weather Data Collection and Calculation Formulas
2.2.1. Compilation of Weather Data
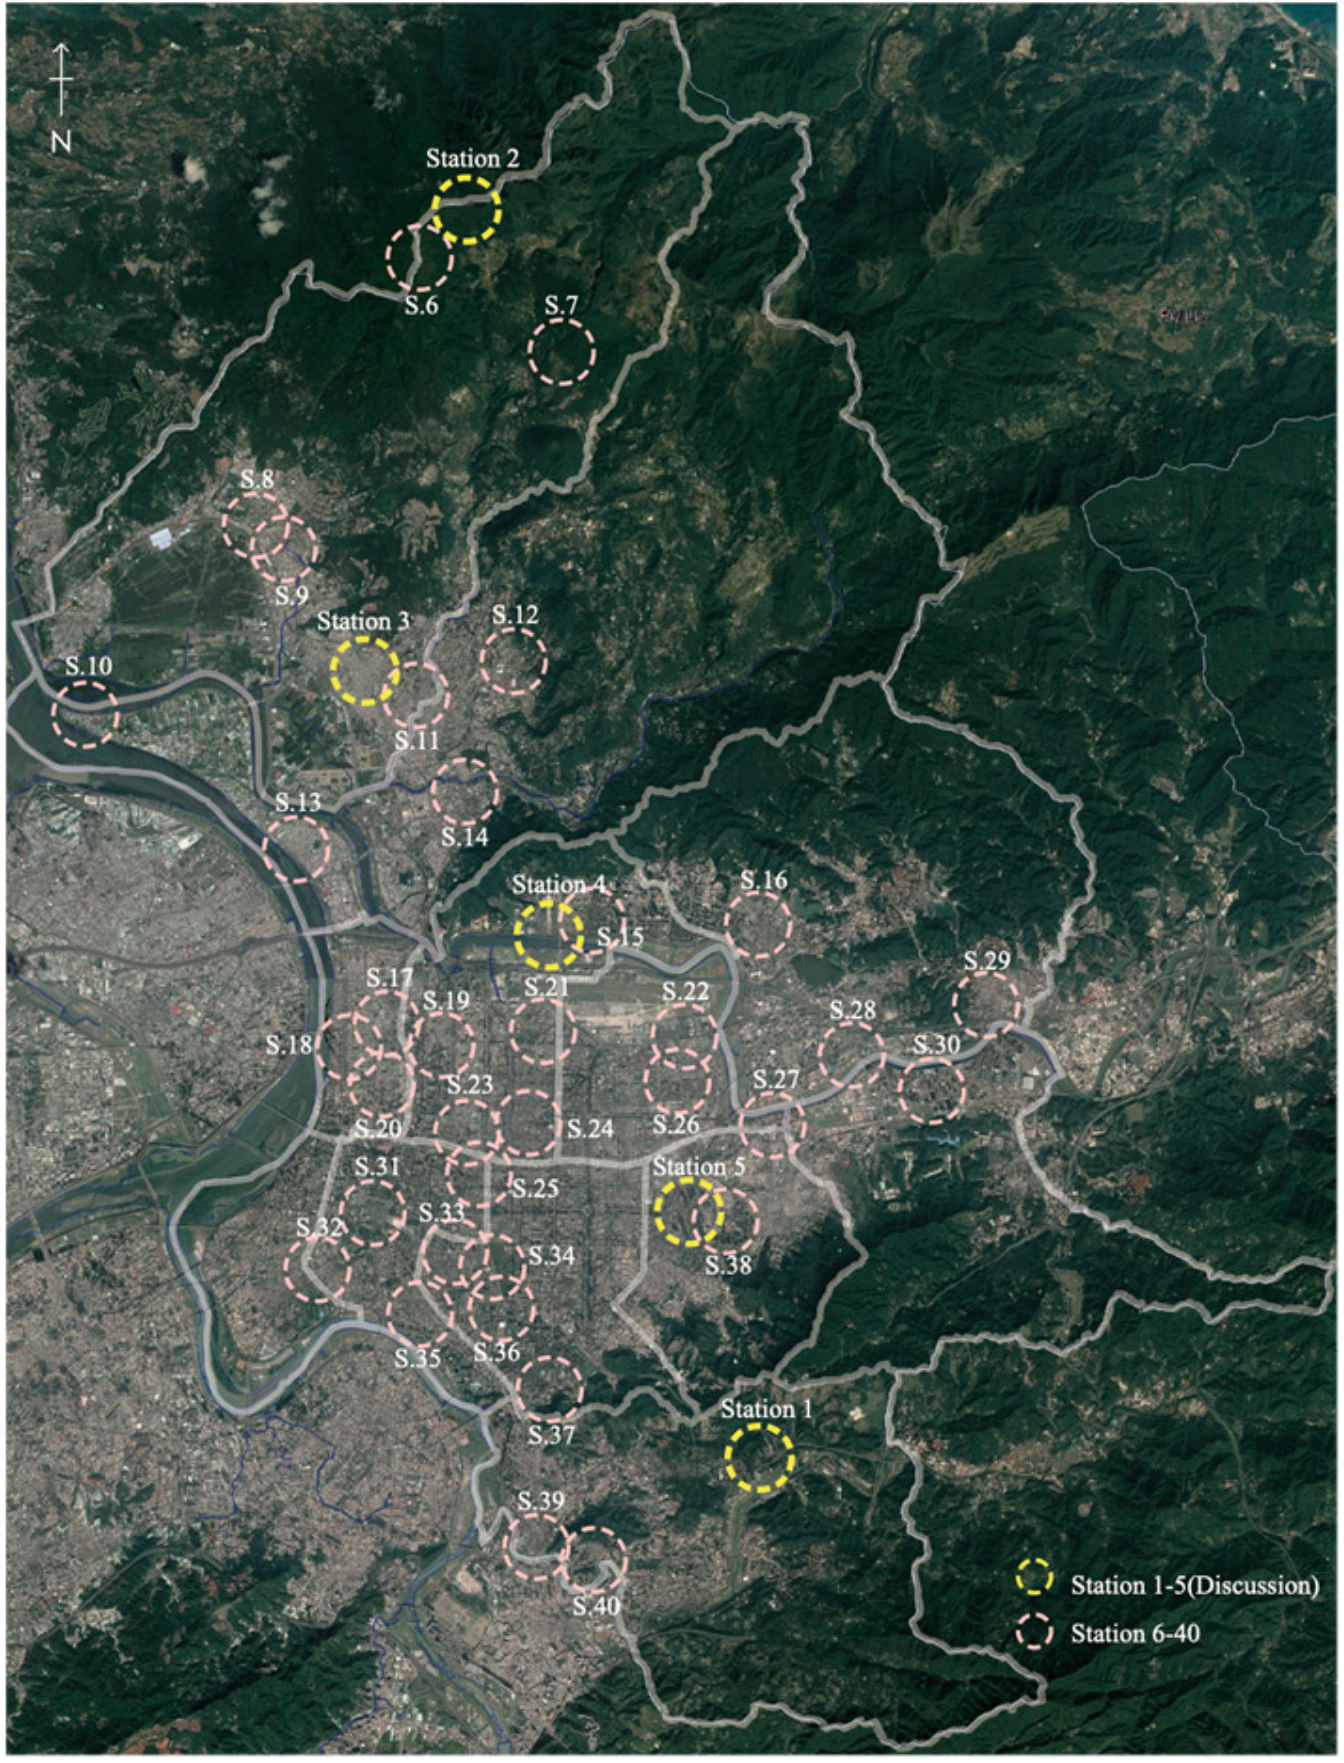
2.2.2. Selection of Weather Stations
2.2.3. Filling in the Missing Weather Data
2.2.4. Calibration of Weather Data
2.2.5. Apparent Temperature Formula and Comfort Range
2.2.6. Physiological Equivalent Temperature (PET) range for Thermal Comfort in Taiwan
2.2.7. Enthalpy Formula
2.3. Definition of Urban Forms and Visual Analysis
2.4. Application of Structural Equation Modeling to Determine Influence of Urban Forms on Thermal Comfort
2.5. Statistical Operation
2.5.1. Preliminary Analysis of Weather Factors and Climate Scenarios and Patterns
- Climate scenario categories
- Influence of weather factors and climate scenarios
- 1.
- Wind field factor analysis
- 2.
- Cloud cover factor analysis
- Influence of weather factors on thermal environments of different urban forms
- Summary
2.5.2. Structural Conversion of Research Data
- Urban forms
- Weather factors
- Thermal environment factors
3. Modeling and Discussion
3.1. Modeling
3.2. Analysis Results
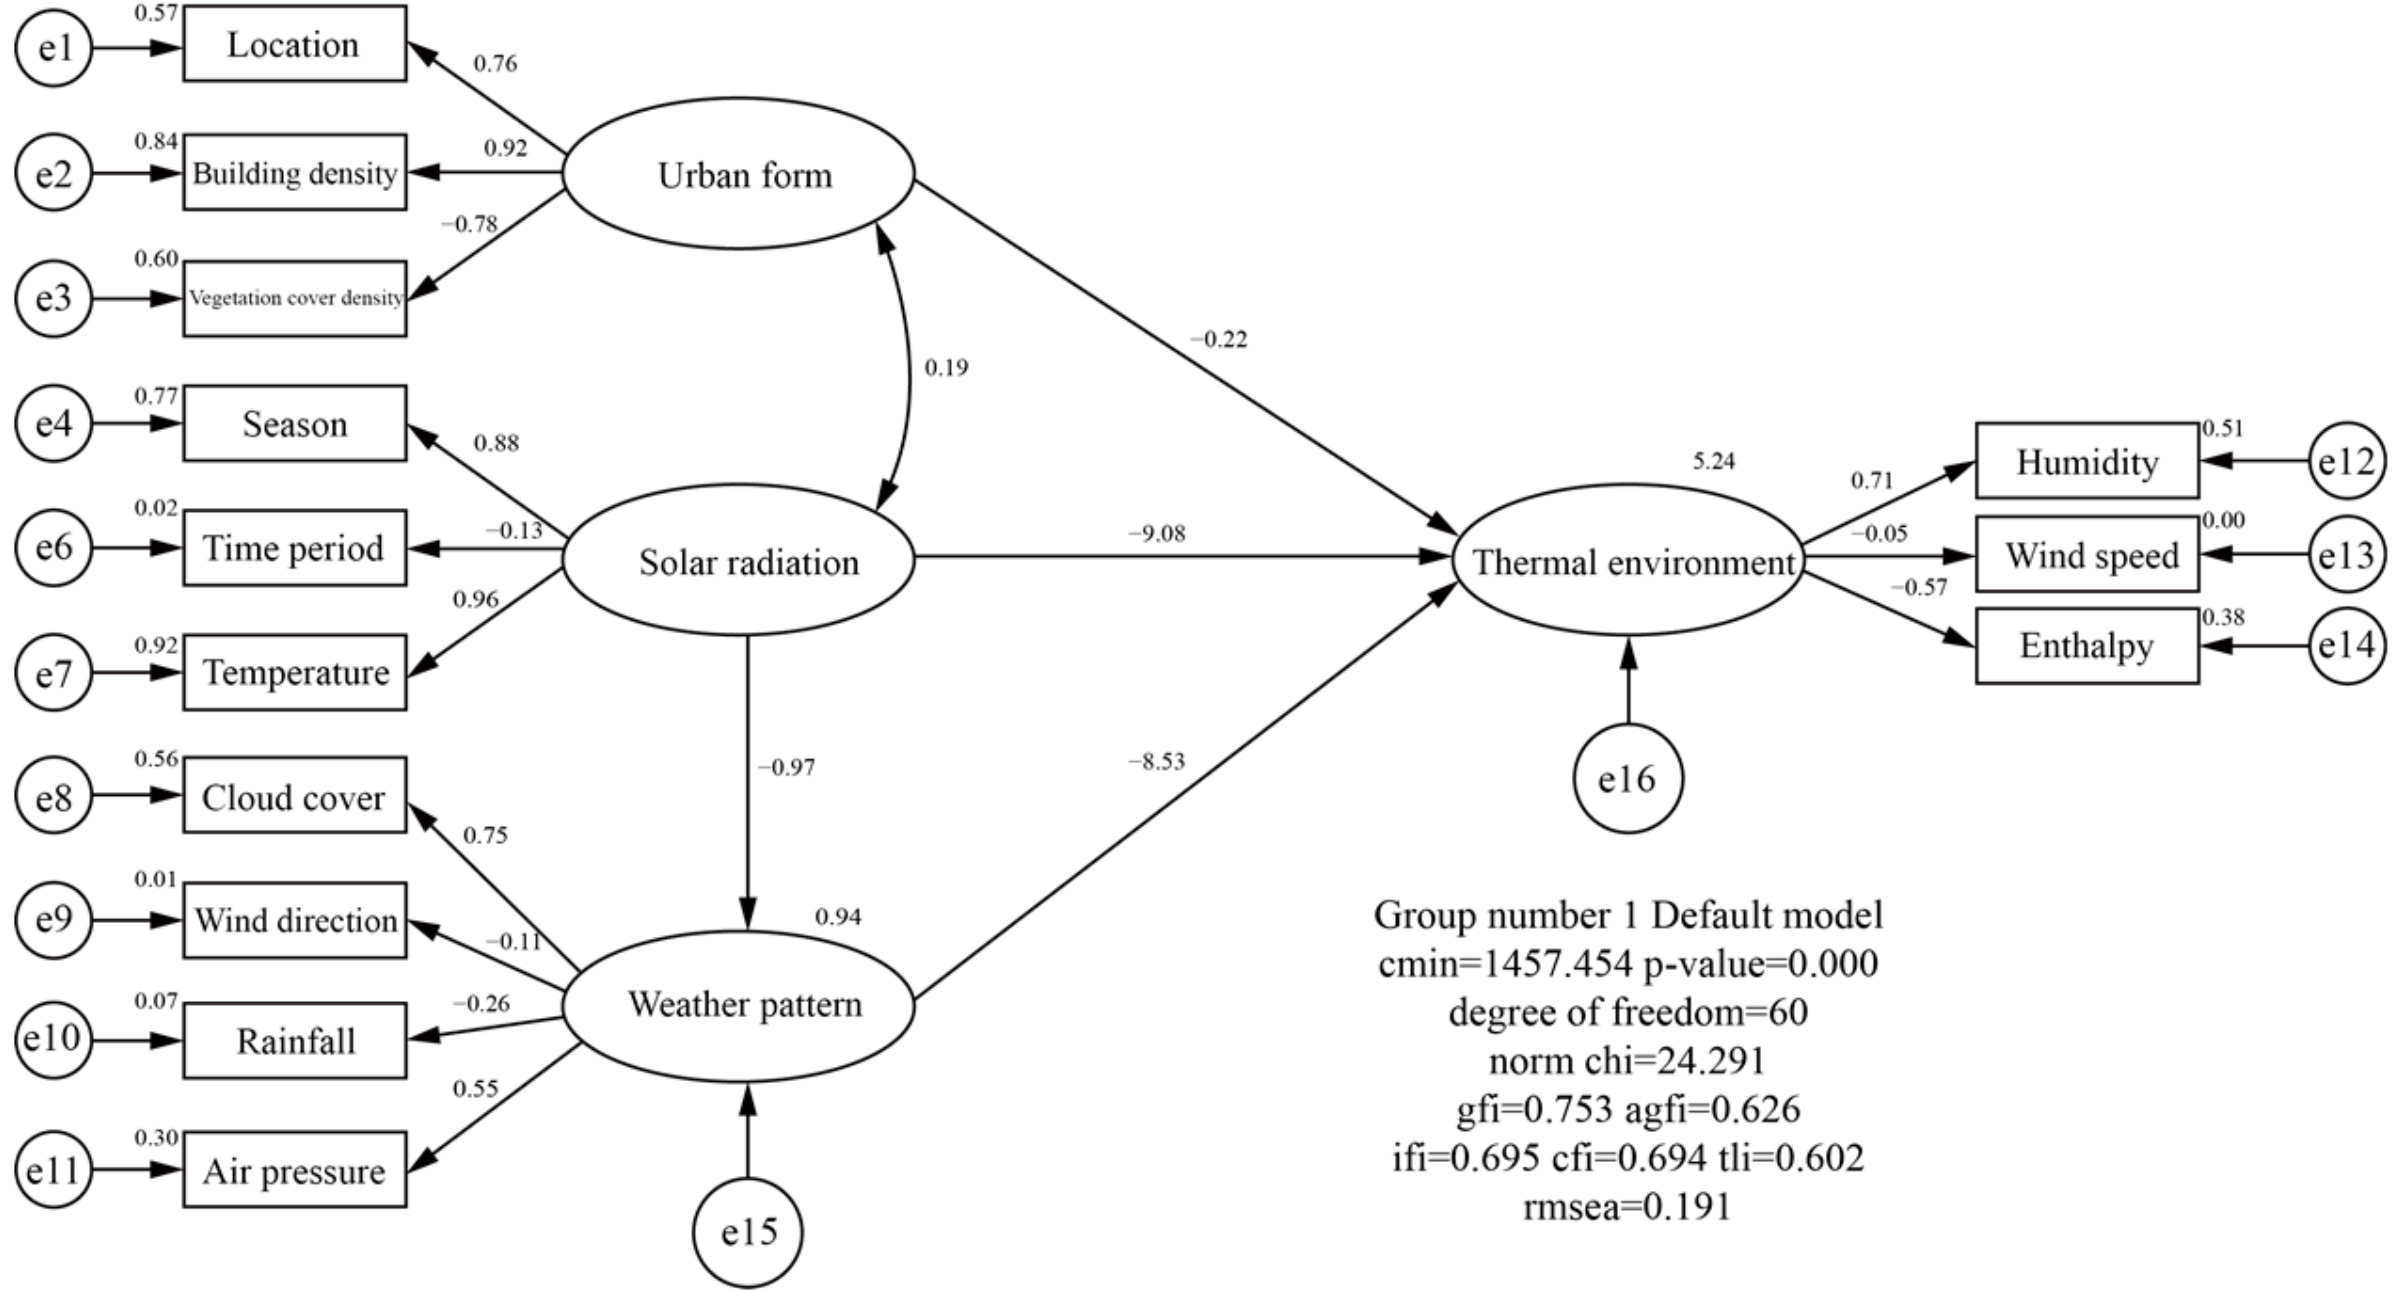
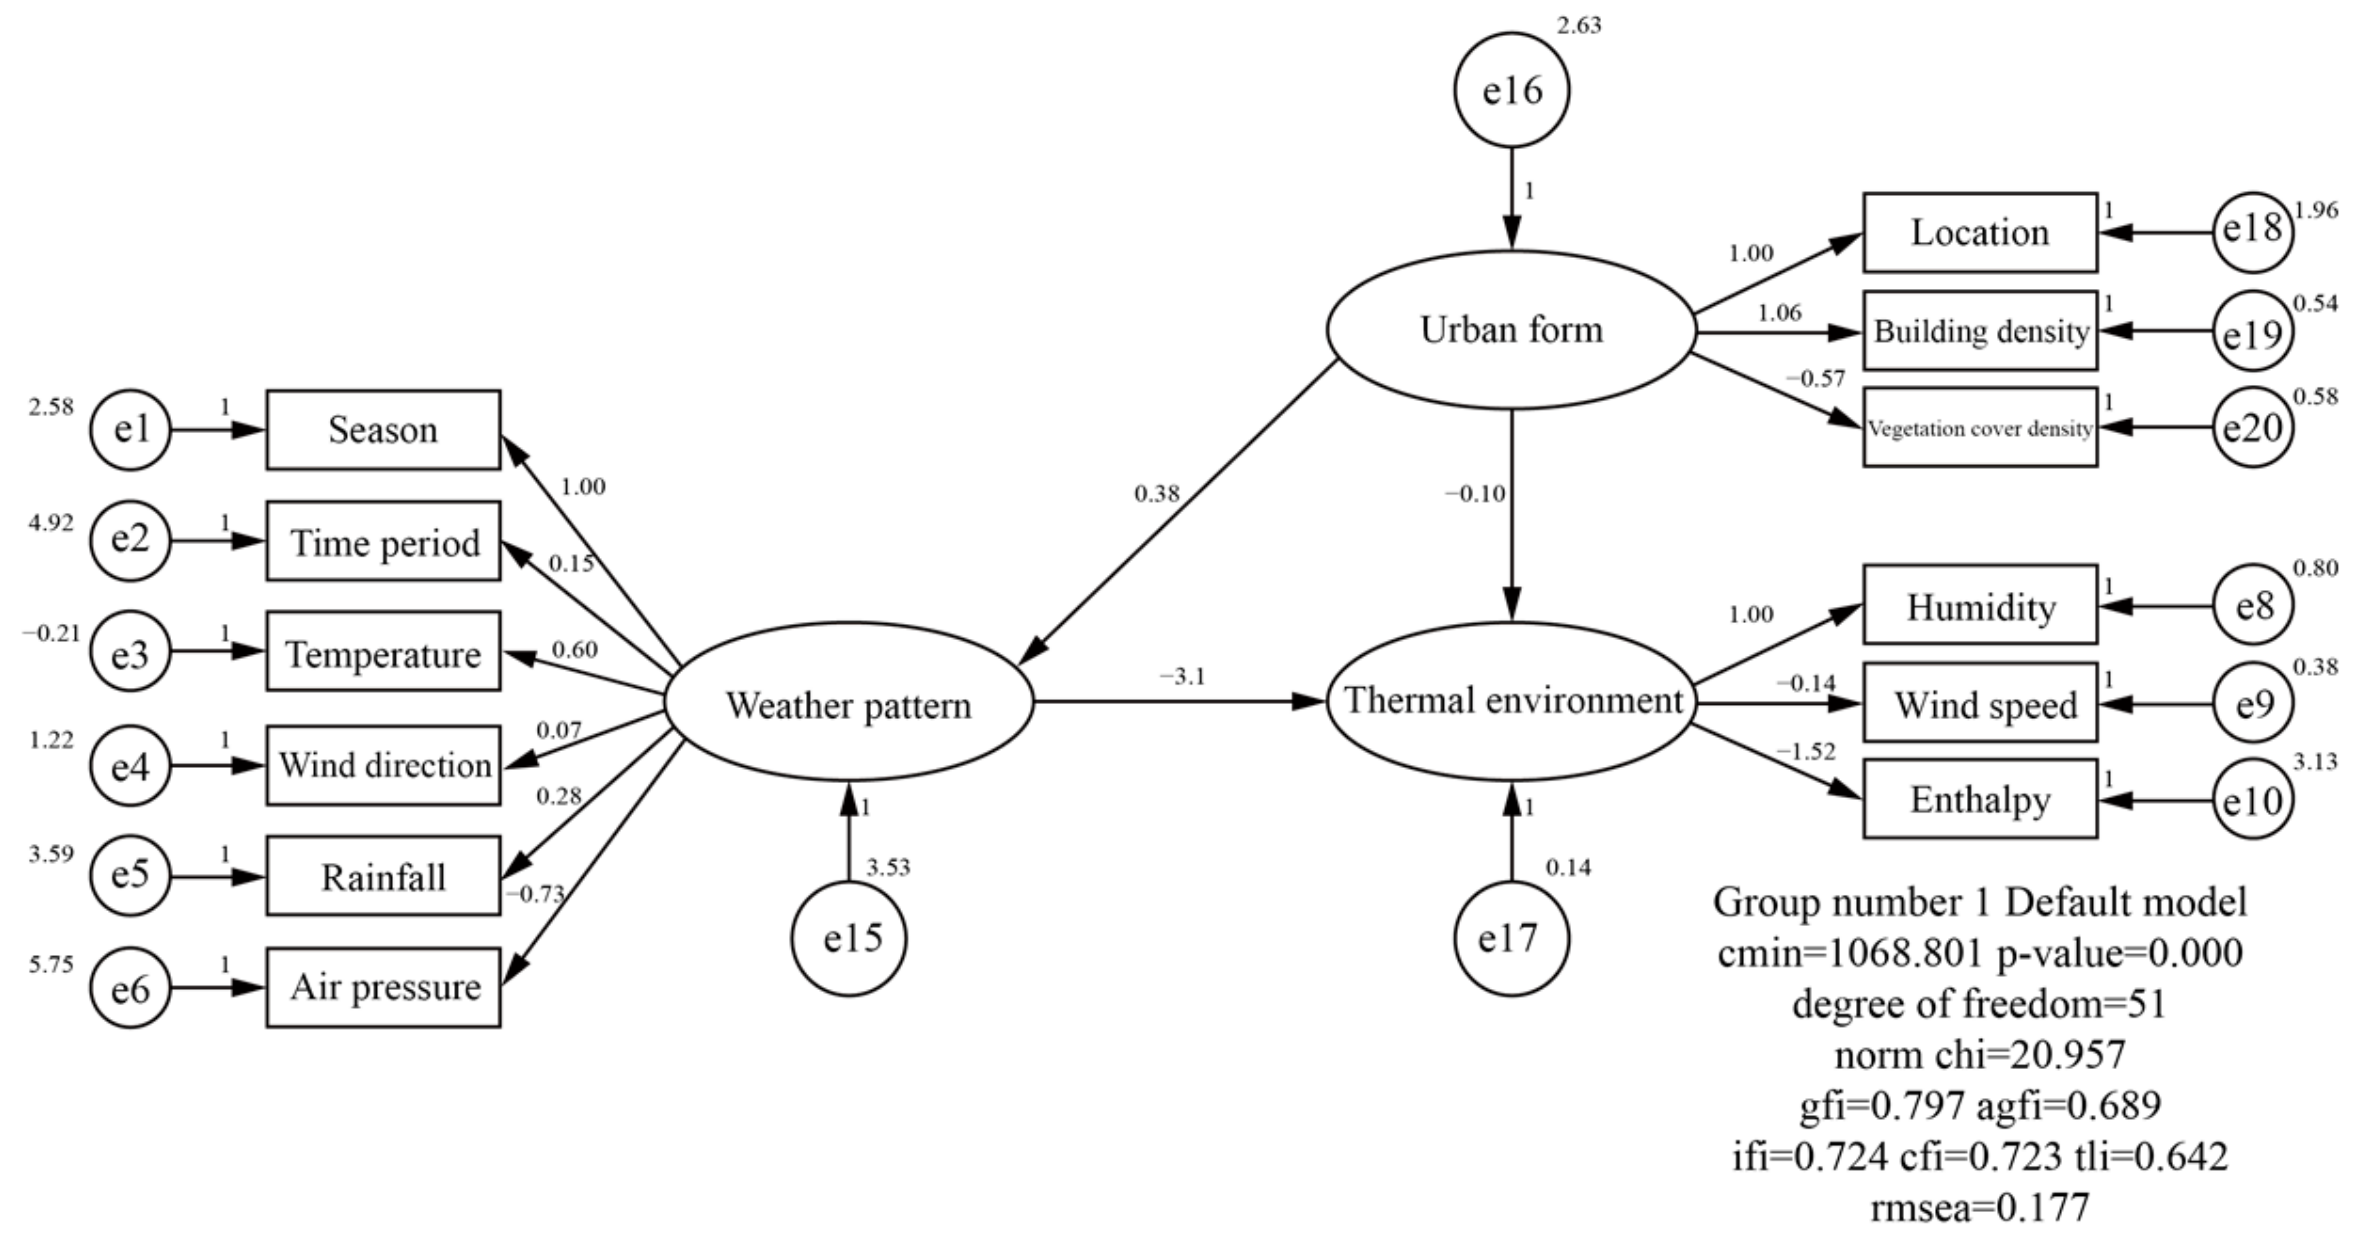
3.2.1. Interpretation of SEM
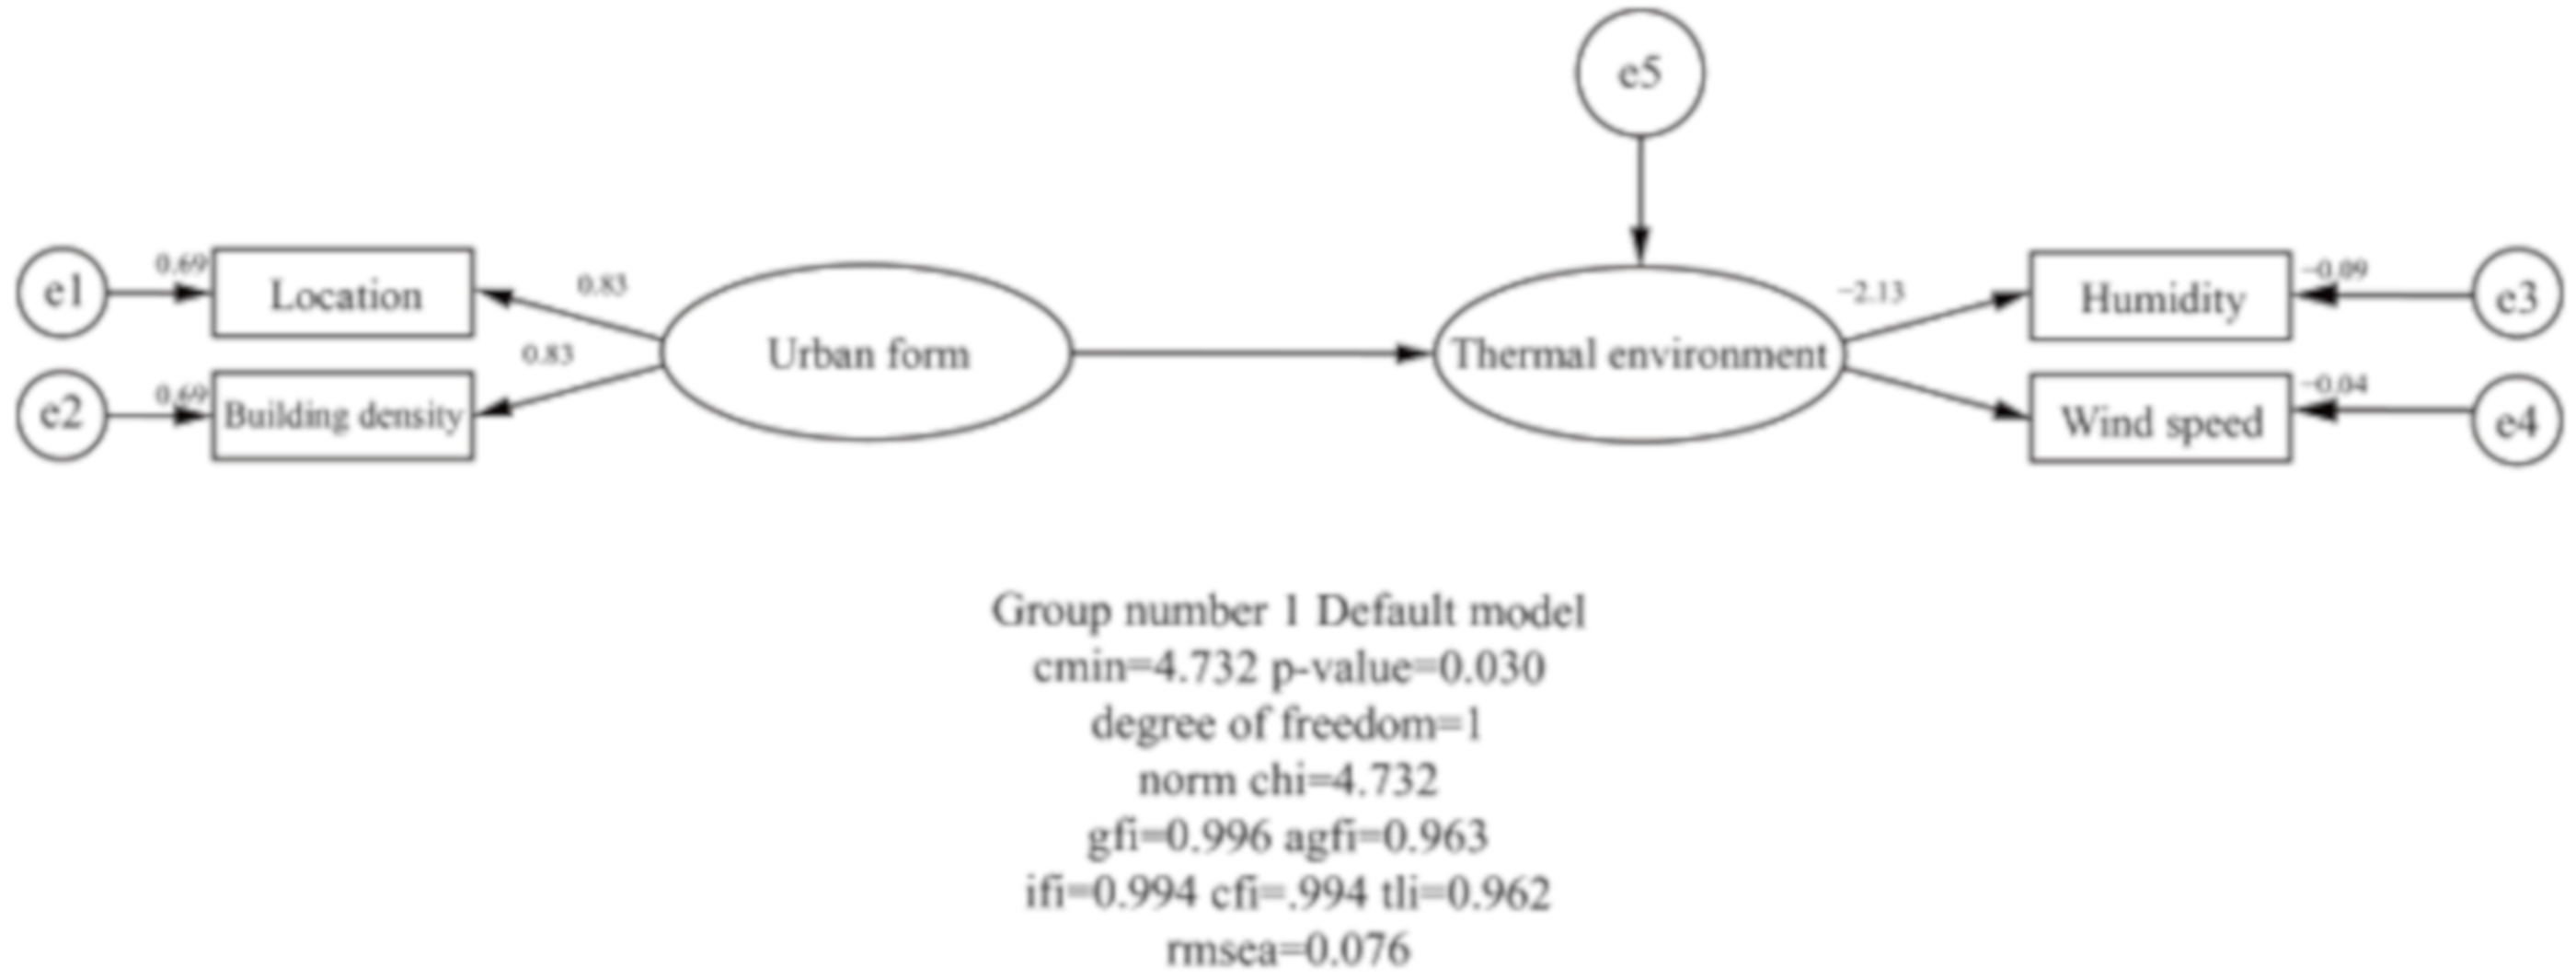
3.2.2. Analysis Results of Revised SEM
3.2.3. Model Fit Analysis
3.3. Urban Thermal Environment and Comfort Index Analysis
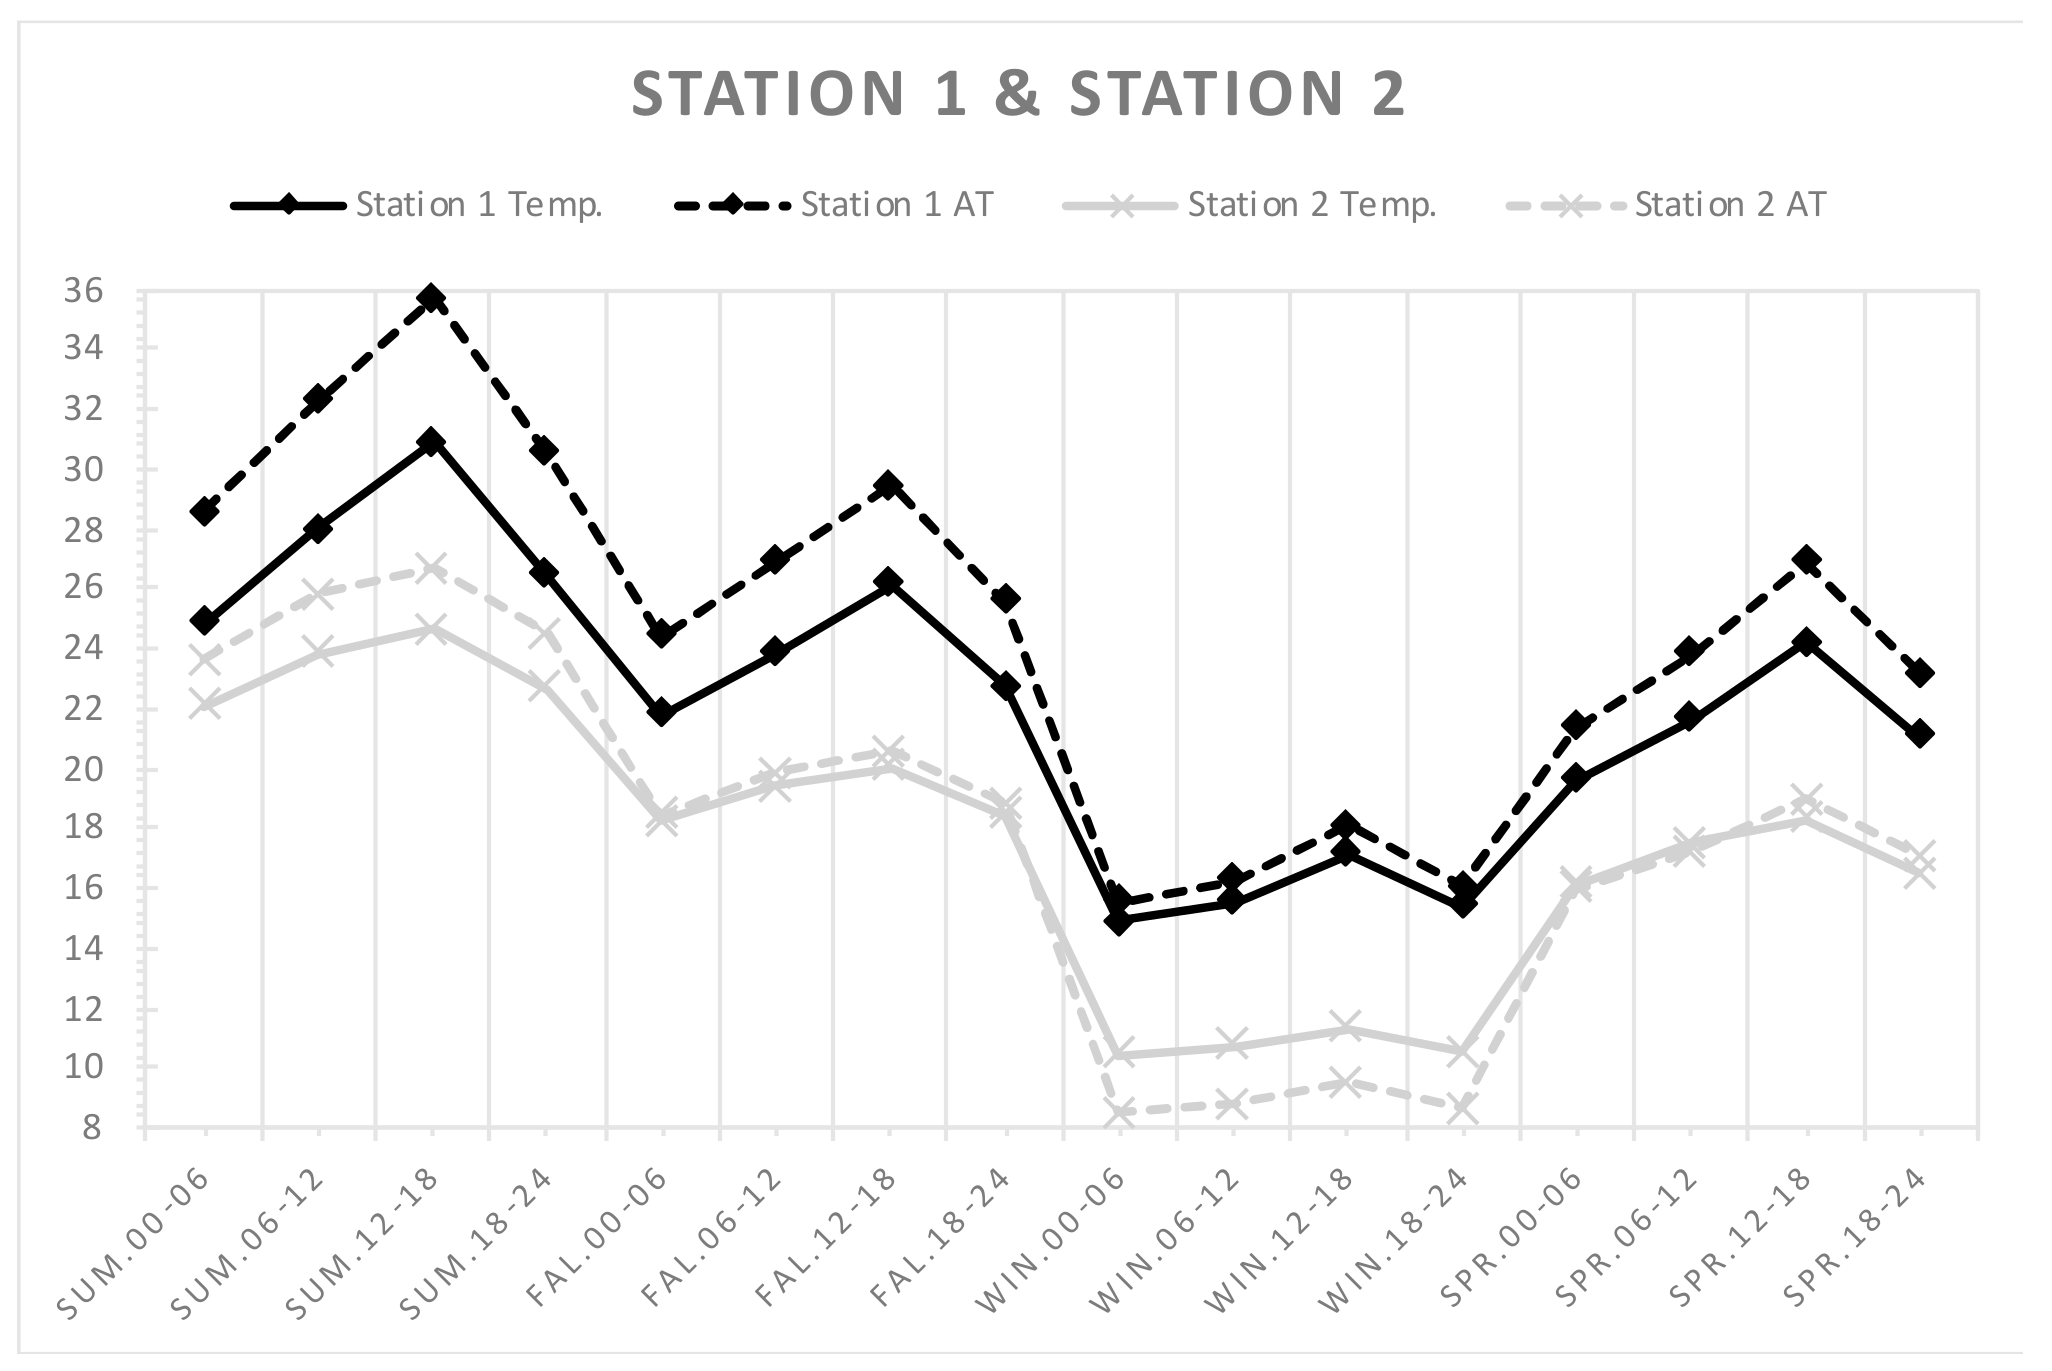
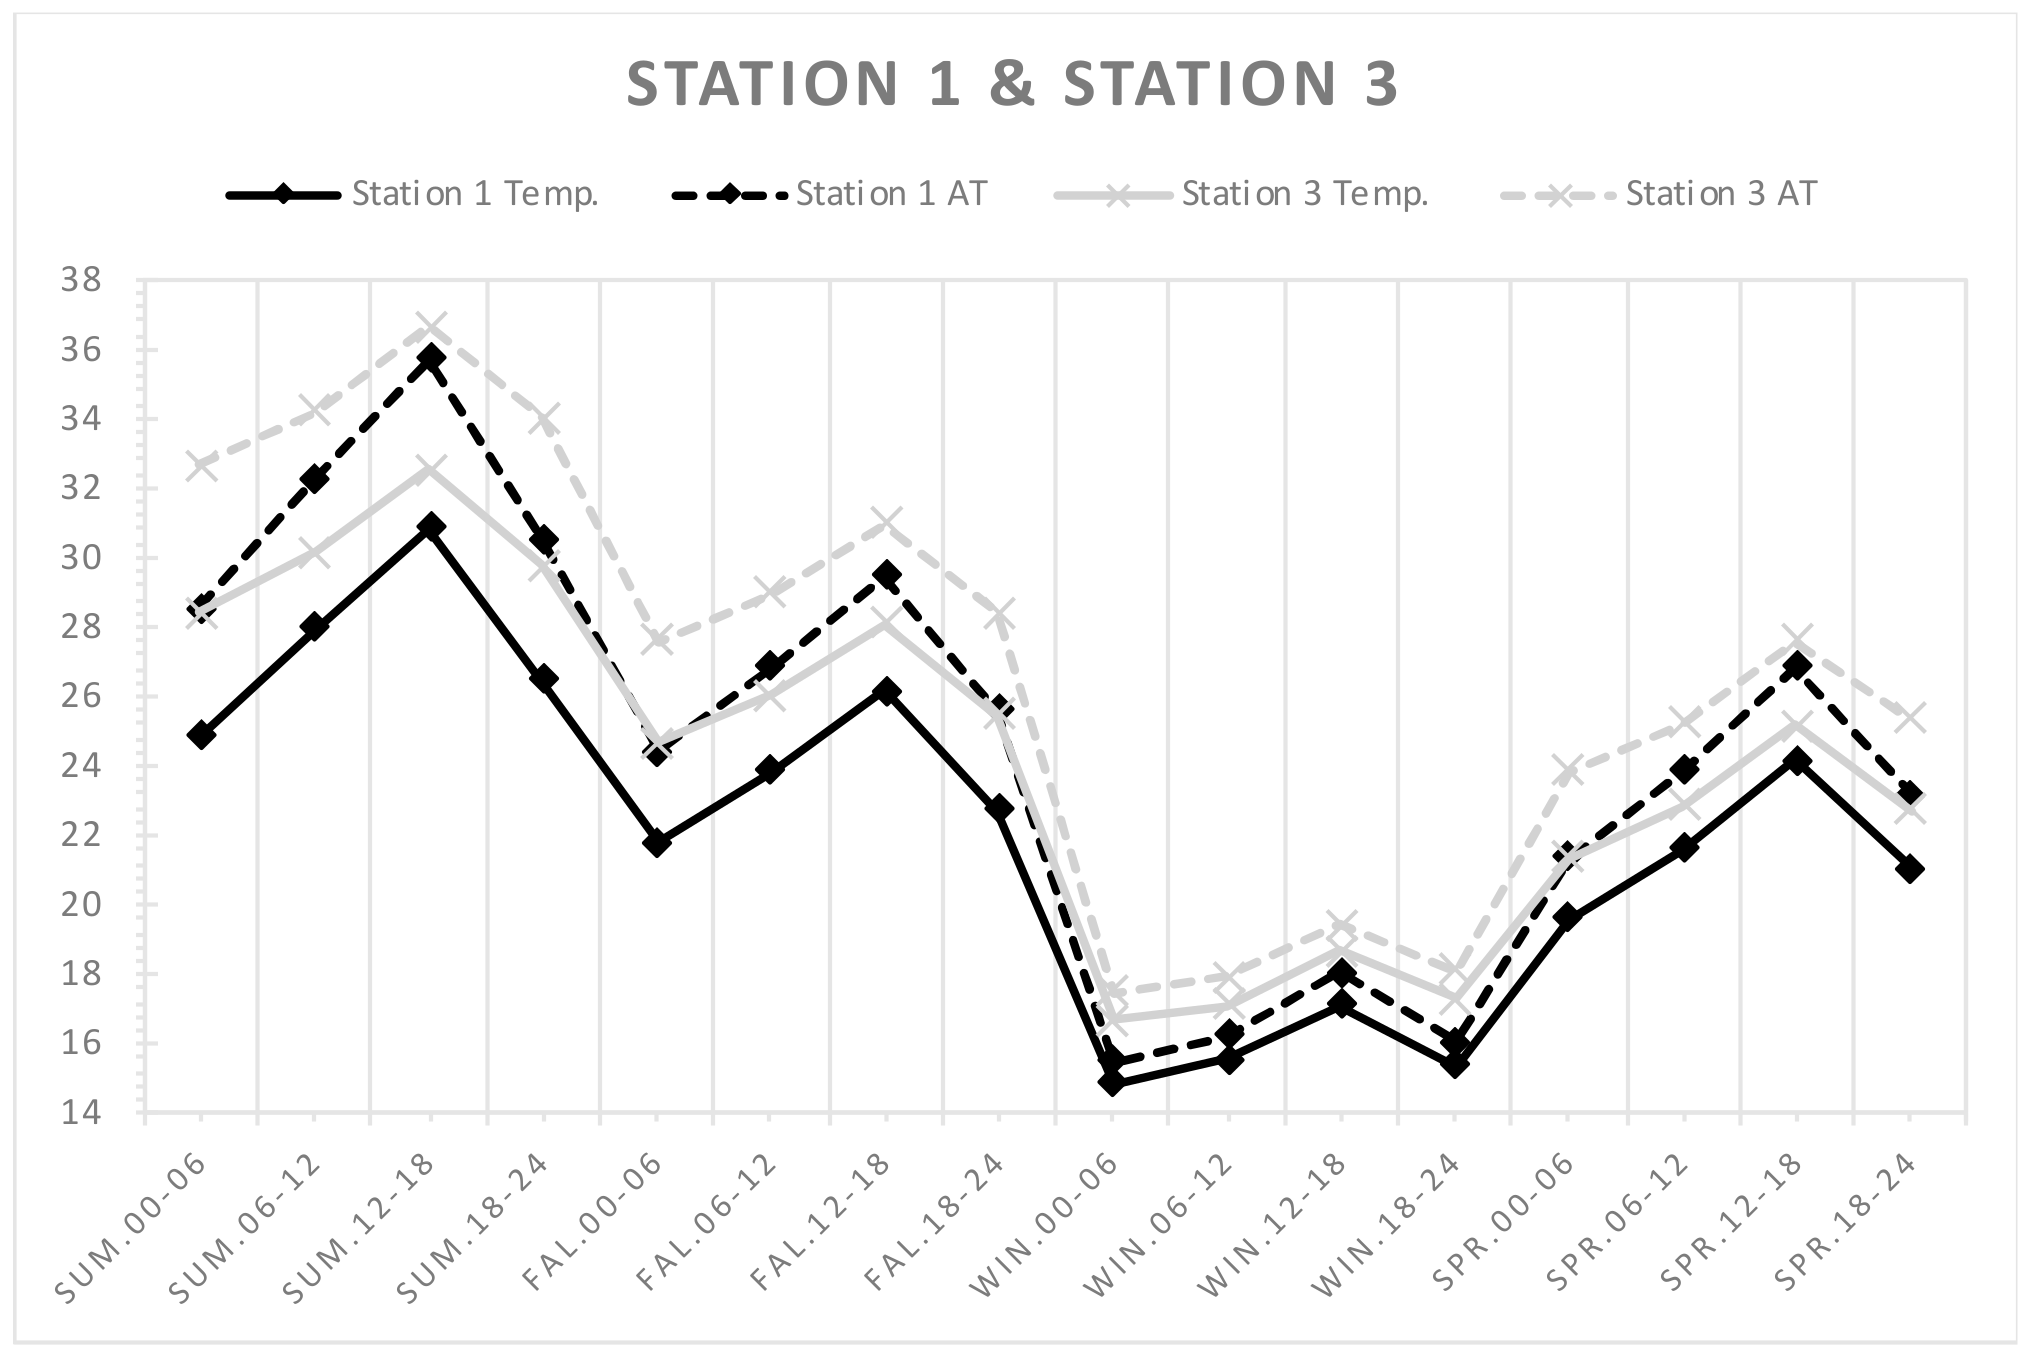
3.3.1. Comparison of Temperatures and ATs Resulting from Different Urban Forms
- Different altitude locations
- Different building densities
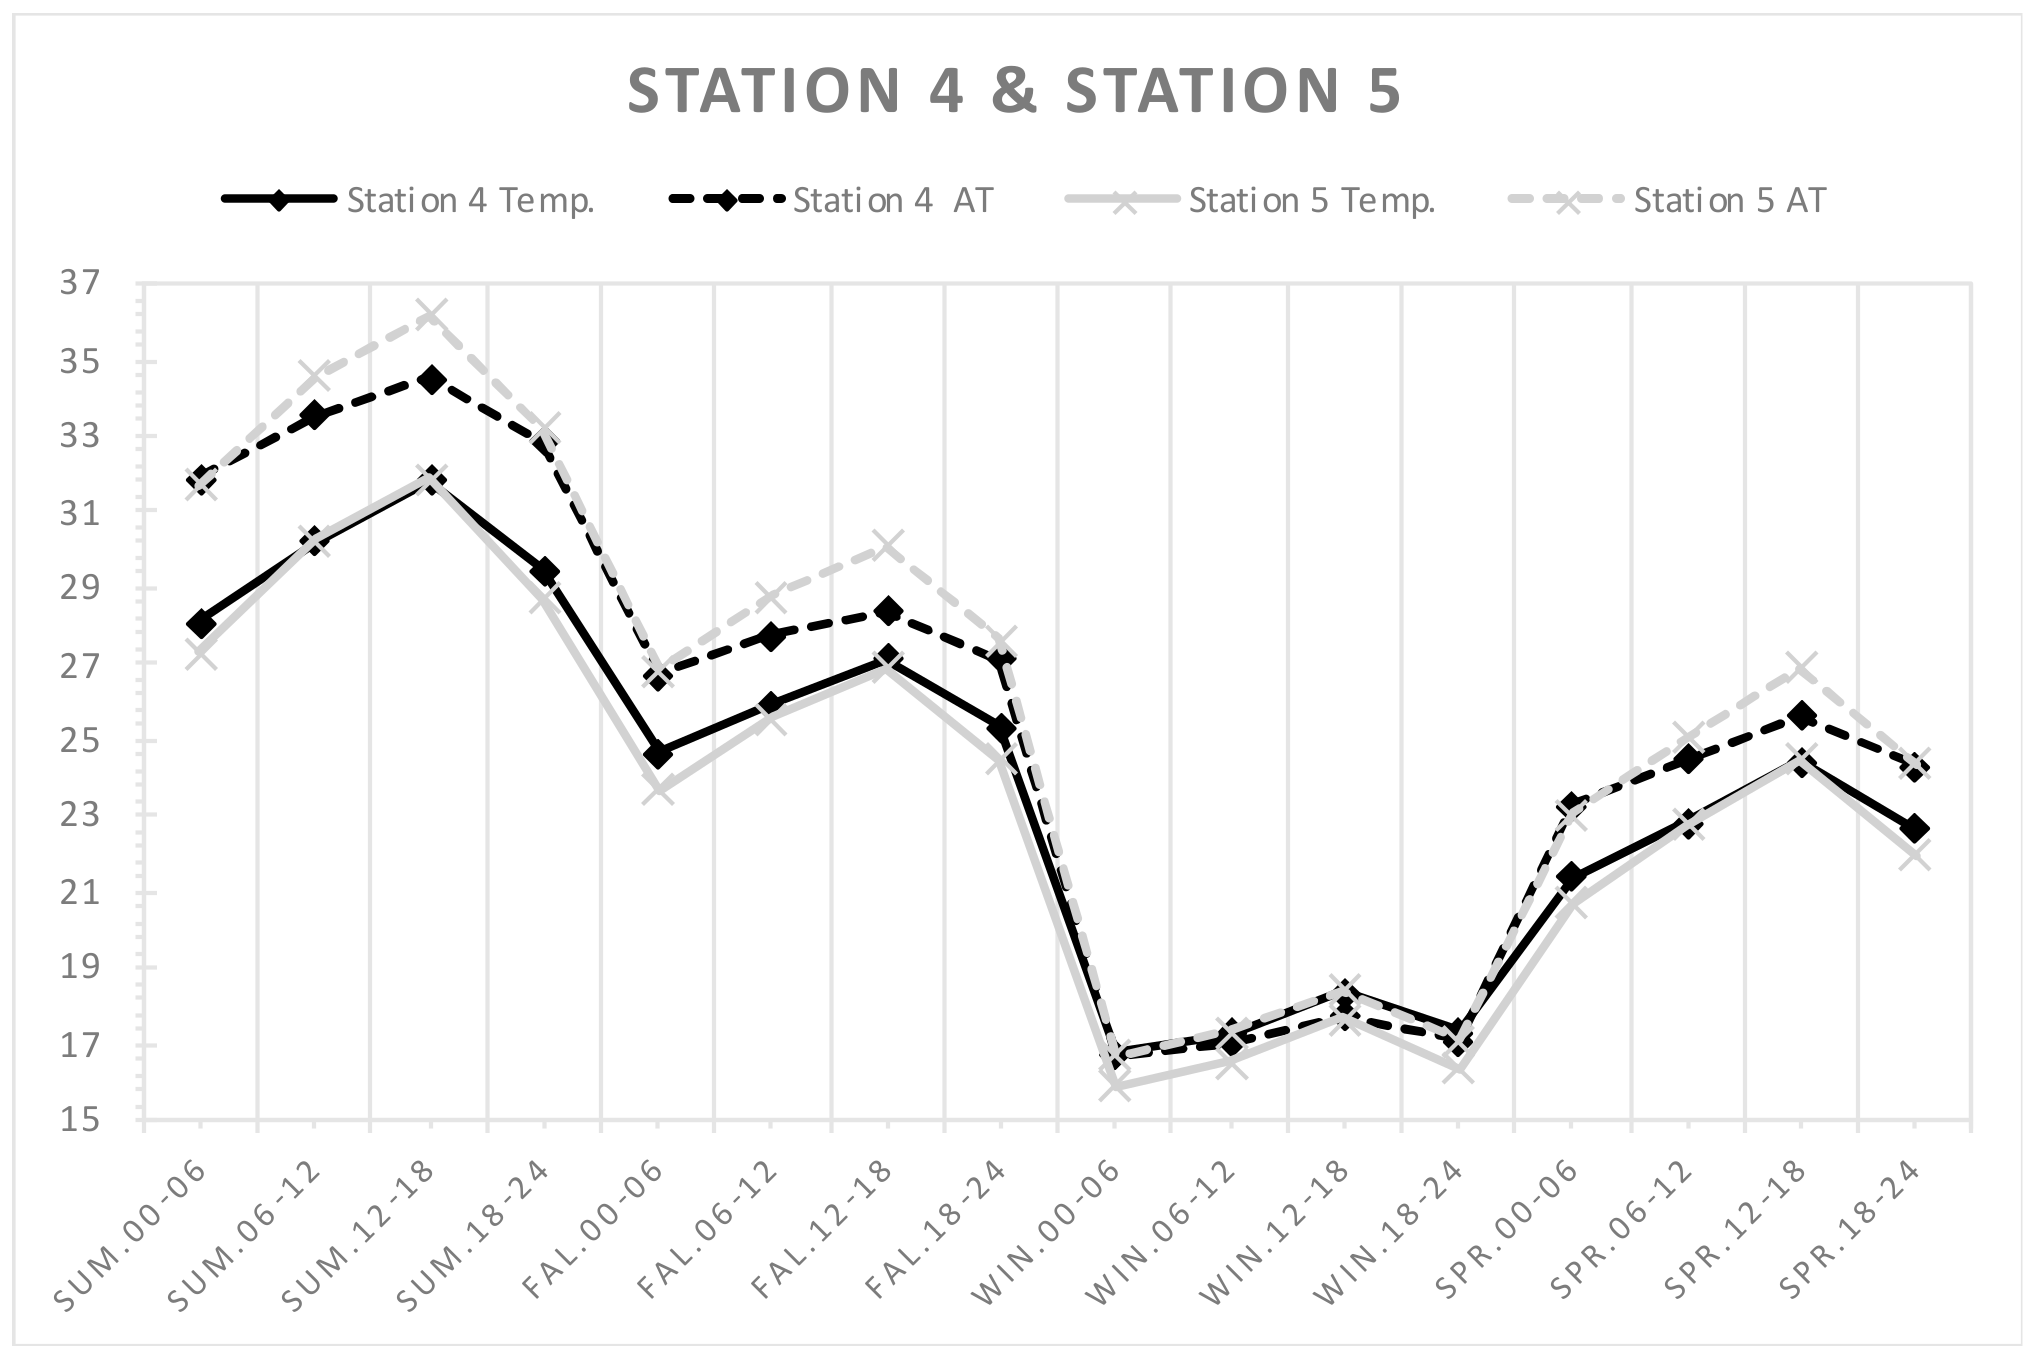
3.3.2. Comparison of Temperatures and ATs Resulting from Different Weather Factors
- Different wind speeds
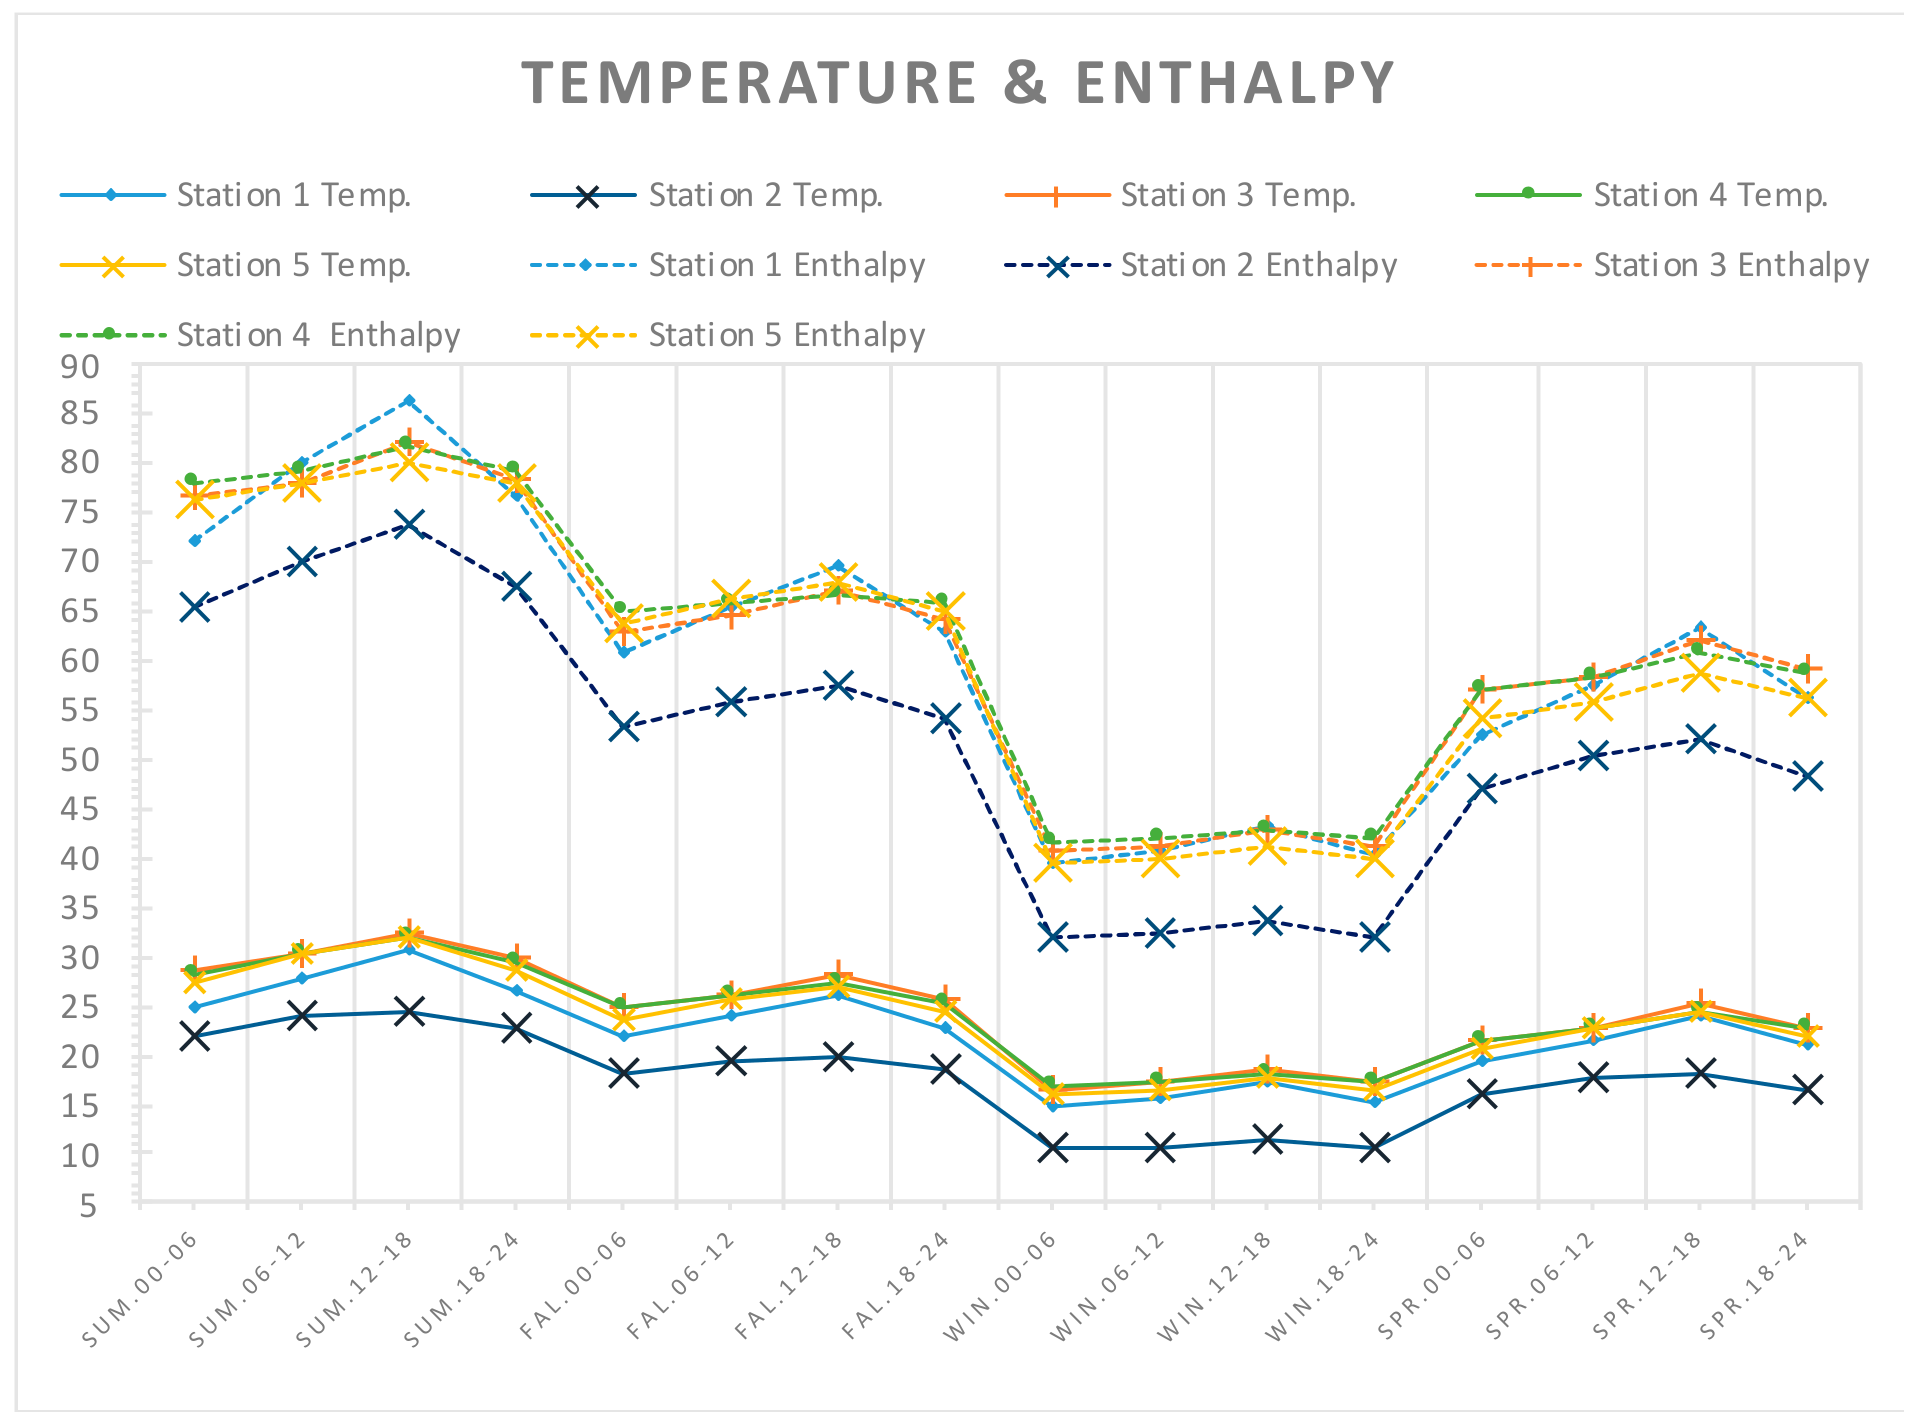
- Discussion on enthalpy
3.3.3. Analysis of AT Range for Thermal Comfort
3.3.4. Comfort Zone on Psychrometric Chart
3.4. General Discussion
4. Conclusions
Author Contributions
Funding
Acknowledgments
Conflicts of Interest
References
- Ng, E. Towards planning and practical understanding of the need for meteorological and climatic information in the design of high-density cities: A case-based study of Hong Kong. Int. J. Climatol. 2012, 32, 582–598. [Google Scholar] [CrossRef]
- Benrazavi, R.S.; Binti Dola, K.; Ujang, N.; Sadat Benrazavi, N. Effect of pavement materials on surface temperatures in tropical environment. Sustain. Cities Soc. 2016, 22 (Suppl. C), 94–103. [Google Scholar] [CrossRef]
- Olfe, D.B.; Lee, R.L. Linearized Calculations of Urban Heat Island Convection Effects. J. Atmos. Sci. 1971, 28, 1374–1388. [Google Scholar] [CrossRef]
- Hwang, R.-L.; Lin, C.-Y.; Huang, K.-T. Spatial and temporal analysis of urban heat island and global warming on residential thermal comfort and cooling energy in Taiwan. Energy Build. 2017, 152, 804–812. [Google Scholar] [CrossRef]
- Landsberg, H.E. The Urban Climate; Academic Press: Cambridge, MA, USA, 1982. [Google Scholar]
- Oke, T.R. The energetic basis of the urban heat island (Symons Memorial Lecture, 20 May 1980). Q. J. R. Meteorol. Soc. 1982, 108, 1–24. [Google Scholar]
- Oke, T.R. The Heat Island of the Urban Boundary Layer: Characteristics, Causes and Effects. In Wind Climate in Cities; Cermak, J.E., Davenport, A.G., Plate, E.J., Viegas, D.X., Eds.; Springer: Dordrecht, The Netherlands, 1995; pp. 81–107. [Google Scholar]
- Hassid, S.; Santamouris, M.; Papanikolaou, N.; Linardi, A.; Klitsikas, N.; Georgakis, C.; Assimakopoulos, D.N. The effect of the Athens heat island on air conditioning load. Energy Build. 2000, 32, 131–141. [Google Scholar] [CrossRef]
- Liang, W.; Huang, J.; Jones, P.; Wang, Q.; Hang, J. A zonal model for assessing street canyon air temperature of high-density cities. Build. Environ. 2018, 132, 160–169. [Google Scholar] [CrossRef]
- Sakka, A.; Santamouris, M.; Livada, I.; Nicol, F.; Wilson, M. On the thermal performance of low income housing during heat waves. Energy Build. 2012, 9, 69–77. [Google Scholar] [CrossRef]
- Synnefa, A.; Santamouris, M.; Apostolakis, K. On the development, optical properties and thermal performance of cool colored coatings for the urban environment. Sol. Energy 2007, 81, 488–497. [Google Scholar] [CrossRef]
- Hsu, H.H.; Chen, C.T. Observed and projected climate change in Taiwan. Meteorol. Atmos. Phys. 2002, 79, 87–104. [Google Scholar] [CrossRef]
- Bai, Y.; Juang, J.Y.; Kondoh, A. Urban warming and urban heat islands in Taipei, Taiwan. In Groundwater and Subsurface Environments: Human Impacts in Asian Coastal Cities; Springer: Kyoto, Japan, 2011; pp. 231–246. [Google Scholar]
- Wang, C.-H.; Lin, W.-Z.; Peng, T.-R.; Tsai, H.-C. Temperature and hydrological variations of the urban environment in the Taipei metropolitan area, Taiwan. Sci. Total Environ. 2008, 404, 393–400. [Google Scholar] [CrossRef] [PubMed]
- Tan, Z.; Lau, K.K.-L.; Ng, E. Planning strategies for roadside tree planting and outdoor comfort enhancement in subtropical high-density urban areas. Build. Environ. 2017, 120 (Suppl. C), 93–109. [Google Scholar] [CrossRef]
- Roth, M. Review of urban climate research in (sub)tropical regions. International. J. Climatol. 2007, 27, 1859–1873. [Google Scholar] [CrossRef]
- Sen, S.; Roesler, J.; Ruddell, B.; Middel, A. Cool pavement strategies for Urban Heat Island mitigation in Suburban Phoenix, Arizona. Sustainability 2019, 11, 4452. [Google Scholar] [CrossRef]
- Sun, C.Y.; Kato, S.; Gou, Z. Application of low-cost sensors for urban heat island assessment: A case study in Taiwan. Sustainability 2019, 11, 2759. [Google Scholar] [CrossRef]
- van Hove, L.W.A.; Jacobs, C.M.J.; Heusinkveld, B.G.; Elbers, J.A.; van Driel, B.L.; Holtslag, A.A.M. Temporal and spatial variability of urban heat island and thermal comfort within the Rotterdam agglomeration. Build. Environ. 2015, 83 (Suppl. C), 91–103. [Google Scholar] [CrossRef]
- Yang, A.-S.; Juan, Y.-H.; Wen, C.-Y.; Chang, C.-J. Numerical simulation of cooling effect of vegetation enhancement in a subtropical urban park. Appl. Energy 2017, 192, 178–200. [Google Scholar] [CrossRef]
- Cheng, V.; Ng, E. Thermal Comfort in Urban Open Spaces for Hong Kong. Archit. Sci. Rev. 2006, 49, 236–242. [Google Scholar] [CrossRef]
- Johansson, E.; Thorsson, S.; Emmanuel, R.; Krüger, E. Instruments and methods in outdoor thermal comfort studies – The need for standardization. Urban Clim. 2014, 10, 346–366. [Google Scholar] [CrossRef]
- Qaid, A.; Bin Lamit, H.; Ossen, D.R.; Raja Shahminan, R.N. Urban heat island and thermal comfort conditions at micro-climate scale in a tropical planned city. Energy Build. 2016, 133, 577–595. [Google Scholar] [CrossRef]
- Höppe, P. The physiological equivalent temperature—A universal index for the biometeorological assessment of the thermal environment. Int. J. Biometeorol. 1999, 43, 71–75. [Google Scholar] [CrossRef] [PubMed]
- Lin, T.-P.; Matzarakis, A.; Hwang, R.-L. Shading effect on long-term outdoor thermal comfort. Build. Environ. 2010, 45, 213–221. [Google Scholar] [CrossRef]
- Taleghani, M.; Tenpierik, M.; Kurvers, S.; van den Dobbelsteen, A. A review into thermal comfort in buildings. Renew. Sustain. Energy Rev. 2013, 26, 201–215. [Google Scholar] [CrossRef]
- Fanger, P.O. Calculation of Thermal Comfort: Introduction of a Basic Comfort Equation. Ashrae Trans. 1967, 73, III4.1–III4.20. [Google Scholar]
- Ali-Toudert, F.; Mayer, H. Numerical study on the effects of aspect ratio and orientation of an urban street canyon on outdoor thermal comfort in hot and dry climate. Build. Environ. 2006, 41, 94–108. [Google Scholar] [CrossRef]
- Chih-hong, H.; Hsin-Hua, T. The Enthalpy Distribution in Subtropical Urban Heat Island. In Proceedings of the 3rd Annual International Conference on Urban Planning and Property Development (UPPD 2017), Singapore, 9 October 2017. [Google Scholar]
- Ketterer, C.; Matzarakis, A. Human-biometeorological assessment of the urban heat island in a city with complex topography—The case of Stuttgart, Germany. Urban Clim. 2014, 10, 573–584. [Google Scholar] [CrossRef]
- Li, K.; Zhang, Y.; Zhao, L. Outdoor thermal comfort and activities in the urban residential community in a humid subtropical area of China. Energy Build. 2016, 133, 498–511. [Google Scholar] [CrossRef]
- Spagnolo, J.; de Dear, R. A field study of thermal comfort in outdoor and semi-outdoor environments in subtropical Sydney Australia. Build.Environ. 2003, 38, 721–738. [Google Scholar] [CrossRef]
- Steadman, R.G. The assessment of sultriness. Part I. A temperature-humidity index based on human physiology and clothing science. J. Appl. Meteorol. 1979, 18, 861–873. [Google Scholar] [CrossRef]
- Steadman, R.G. A Universal Scale of Apparent Temperature. J. Clim. Appl. Meteorol. 1984, 23, 1674–1687. [Google Scholar] [CrossRef]
- Lin, T.-P.; de Dear, R.; Hwang, R.-L. Effect of thermal adaptation on seasonal outdoor thermal comfort. Int. J. Climatol. 2011, 31, 302–312. [Google Scholar] [CrossRef]
- Matzarakis, A.; Mayer, H.; Iziomon, M.G. Applications of a universal thermal index: Physiological equivalent temperature. Int. J. Biometeorol. 1999, 43, 76–84. [Google Scholar] [CrossRef] [PubMed]
- Siu, L.W.; Hart, M.A. Quantifying urban heat island intensity in Hong Kong SAR, China. Environ. Monit. Assess. 2013, 185, 4383–4398. [Google Scholar] [CrossRef] [PubMed]
- Chen, Y.-C.; Yao, C.-K.; Honjo, T.; Lin, T.-P. The application of a high-density street-level air temperature observation network (HiSAN): Dynamic variation characteristics of urban heat island in Tainan, Taiwan. Sci. Total Environ. 2018, 626, 555–566. [Google Scholar] [CrossRef] [PubMed]
- Kotharkar, R.; Surawar, M. Land use, land cover, and population density impact on the formation of canopy urban heat islands through traverse survey in the Nagpur urban area, India. J. Urban Plan. Dev. 2016, 142, 04015003. [Google Scholar] [CrossRef]
- Lin, Y.H.; Tsai, K.T. Screening of tree species for improving outdoor human thermal comfort in a Taiwanese City. Sustainability 2017, 9, 340. [Google Scholar] [CrossRef]
- Data Bank for Atmospheric & Hydrologic Research. Available online: https://dbar.pccu.edu.tw/ (accessed on 27 February 2020).
- Taipei Weather Inquiry-Based Learning Network. Available online: http://weather.tp.edu.tw/en/index.html (accessed on 27 February 2020).
- Bayen, A.M.; Siauw, T. Chapter 14-Interpolation. In An Introduction to MATLAB® Programming and Numerical Methods for Engineers; Bayen, A.M., Siauw, T., Eds.; Academic Press: Boston, MA, USA, 2015; pp. 211–223. [Google Scholar]
- Lin, T.-P.; Matzarakis, A. Tourism climate and thermal comfort in Sun Moon Lake, Taiwan. Int. J. Biometeorol. 2008, 52, 281–290. [Google Scholar] [CrossRef]
- Matzarakis, A.; Rutz, F.; Mayer, H. Modelling radiation fluxes in simple and complex environments—Application of the RayMan model. Int. J. Biometeorol. 2007, 51, 323–334. [Google Scholar] [CrossRef]
- Konarska, J.; Holmer, B.; Lindberg, F.; Thorsson, S. Influence of vegetation and building geometry on the spatial variations of air temperature and cooling rates in a high-latitude city. Int. J. Climatol. 2016, 36, 2379–2395. [Google Scholar] [CrossRef]
- Johansson, T. Testing for control system interdependence with structural equation modeling: Conceptual developments and evidence on the levers of control framework. J. Account. Lit. 2018, 41, 47–62. [Google Scholar] [CrossRef]
- Zellner, A. An Efficient Method of Estimating Seemingly Unrelated Regressions and Tests for Aggregation Bias. J. Am. Stat. Assoc. 1962, 57, 348–368. [Google Scholar] [CrossRef]
- Xing, H.; Meng, Y. Revealing deep semantic commercial patterns: Insights from urban landscape depiction. Computers. Environ. Urban Syst. 2020, 79, 101404. [Google Scholar] [CrossRef]
- Bollen, K.A. Structural Equations with Latent Variables; John Wiley & Sons: Oxford, UK, 1989. [Google Scholar]
- Yang, L.; Li, Y. City ventilation of Hong Kong at no-wind conditions. Atmos. Environ. 2009, 43, 3111–3121. [Google Scholar] [CrossRef]
- Morakinyo, T.E.; Balogun, A.A.; Adegun, O.B. Comparing the effect of trees on thermal conditions of two typical urban buildings. Urban Clim. 2013, 3, 76–93. [Google Scholar] [CrossRef]
- Emmanuel, R. An Urban Approach to Climate Sensitive Design: Strategies for the Tropics; Taylor & Francis: London, UK, 2005. [Google Scholar]
- Hsieh, C.-M.; Chen, H.; Ooka, R.; Yoon, J.; Kato, S.; Miisho, K. Simulation analysis of site design and layout planning to mitigate thermal environment of riverside residential development. Build. Simul. 2010, 3, 51–61. [Google Scholar] [CrossRef]
- Lai, D.; Chen, C.; Liu, W.; Shi, Y.; Chen, C. An ordered probability model for predicting outdoor thermal comfort. Energy Build. 2018, 168, 261–271. [Google Scholar] [CrossRef]
- Krüger, E.L.; Minella, F.O.; Rasia, F. Impact of urban geometry on outdoor thermal comfort and air quality from field measurements in Curitiba, Brazil. Build. Environ. 2011, 46, 621–634. [Google Scholar] [CrossRef]
- Nikolopoulou, M.; Steemers, K. Thermal comfort and psychological adaptation as a guide for designing urban spaces. Energy Build. 2003, 35, 95–101. [Google Scholar] [CrossRef]
- Hsieh, C.-M.; Huang, H.-C. Mitigating urban heat islands: A method to identify potential wind corridor for cooling and ventilation. Computers Environ. Urban Syst. 2016, 57, 130–143. [Google Scholar] [CrossRef]
- Peng, C.; Ming, T.; Cheng, J.; Wu, Y.; Peng, Z.R. Modeling thermal comfort and optimizing local renewal strategies-a case study of Dazhimen neighborhood in Wuhan city. Sustainability 2015, 7, 3109–3128. [Google Scholar] [CrossRef]
- Doan, Q.-V.; Kusaka, H.; Ho, Q.-B. Impact of future urbanization on temperature and thermal comfort index in a developing tropical city: Ho Chi Minh City. Urban Clim. 2016, 17, 20–31. [Google Scholar] [CrossRef]
- Taleghani, M.; Kleerekoper, L.; Tenpierik, M.; van den Dobbelsteen, A. Outdoor thermal comfort within five different urban forms in the Netherlands. Build. Environ. 2015, 83, 65–78. [Google Scholar] [CrossRef]
- Kakon, A.N.; Nobuo, M.; Kojima, S.; Yoko, T. Assessment of thermal comfort in respect to building height in a high-density city in the tropics. J Eng. Appl. Sci. 2010, 3, 545–551. [Google Scholar] [CrossRef]
- Chen, Y.-C.; Liao, Y.-J.; Yao, C.-K.; Honjo, T.; Wang, C.-K.; Lin, T.-P. The application of a high-density street-level air temperature observation network (HiSAN): The relationship between air temperature, urban development, and geographic features. Sci. Total Environ. 2019, 685, 710–722. [Google Scholar] [CrossRef] [PubMed]
- Givoni, B. Climate Considerations in Building and Urban Design: Van Nostrand Reinhold; John Wiley: New York, NY, USA, 1998. [Google Scholar]
- Oke, T.R. The urban energy balance. Progress Phys. Geogr. Earth Environ 1988, 12, 471–508. [Google Scholar] [CrossRef]


| Thermal Sensation | AT Range for Taiwan (°C AT) |
|---|---|
| Very cold | < 7 |
| Cold | 8–13 |
| Cool | 14–20 |
| Comfortable | 21–32 |
| Hot | 33–40 |
| Susceptibility to heat stroke | < 40 |
| Thermal Sensation | PET Range for Taiwan(°C PET) |
|---|---|
| Very cold | < 14 |
| Cold | 14–18 |
| Cool | 18–22 |
| Slightly cool | 22–26 |
| Neutral | 26–30 |
| Slightly warm | 30–34 |
| Warm | 34–38 |
| Hot | 38–42 |
| Very hot | < 42 |
| Enthalpy | Levene’s Test or Equality of Variances | t-test for Equality of Means | |||||||
|---|---|---|---|---|---|---|---|---|---|
| F | Sig. | t | Df | Sig. (two-tailed) | Mean difference | Std. error difference | 95% confidence interval of difference | ||
| Lower | Upper | ||||||||
| Equal variances assumed | 2.013 | 0.156 | 8.794 | 2206 | 0.000 | 2.20866 | 0.25115 | 1.71614 | 2.70118 |
| Equal variances not assumed | 8.767 | 2125.616 | 0.000 | 2.20866 | 0.25193 | 1.71460 | 2.70272 | ||
| Group | Level of Cloud Cover | Total Items of Hourly Data | Outliers | Items of Hourly Data after Elimination |
|---|---|---|---|---|
| 1 | Levels 0–3 | 230 | 0 | 230 |
| 2 | Levels 4–6 | 377 | 4 | 373 |
| 3 | Levels 7–10 | 582 | 1 | 581 |
| Total | - | 1189 | 5 | 1184 |
| (I) Cloud Cover Group | (J) Group | Mean Difference(I-J) | Std. error | Sig. | 95% Confidence Interval | |
|---|---|---|---|---|---|---|
| Lower | Upper | |||||
| Group 1 (Cloud cover levels 0–3) | Group 2 | −2.41831984 * | 0.47456259 | 0.000 | −3.5814038 | −1.2552359 |
| Group 3 | −1.30046709 * | 0.44097262 | 0.013 | −2.3812269 | −0.2197073 | |
| Group 2 (Cloud cover levels 4–6) | Group 1 | 2.41831984 * | 0.47456259 | 0.000 | 1.2552359 | 3.5814038 |
| Group 3 | 1.11785275 * | 0.37556480 | 0.012 | 0.1973980 | 2.0383075 | |
| Group 3 (Cloud cover levels 7–10) | Group 1 | 1.30046709 * | 0.44097262 | 0.013 | 0.2197073 | 2.3812269 |
| Group 2 | −1.11785275 * | 0.37556480 | 0.12 | −2.0383075 | −0.1973980 | |
| Enthalpy | Levene’s Test for Equality of Variances | t-test for Equality of Means | |||||||
|---|---|---|---|---|---|---|---|---|---|
| F | Sig. | t | df | Sig. (two-tailed) | Mean difference | Std. error difference | 95% confidence interval of difference | ||
| Lower | Upper | ||||||||
| Equal variances assumed | 0.022 | 0.881 | −2.851 | 809 | 0.004 | −1.30047 | 0.456074 | −2.1958 | −0.40524 |
| Equal variances not assumed | −2.852 | 420.40 | 0.005 | −1.30047 | 0.455968 | −2.1967 | −0.40421 | ||
| Enthalpy | Levene’s Test for Equality of Variances | t-test for Equality of Means | |||||||
|---|---|---|---|---|---|---|---|---|---|
| F | Sig. | t | df | Sig. (two-tailed) | Mean difference | Std. error difference | 95% confidence interval of difference | ||
| Lower | Upper | ||||||||
| Equal variances assumed | 135.636 | 0.000 | −1.270 | 502 | 0.205 | −0.72871 | 0.57394 | −1.85633 | 0.39890 |
| Equal variances not assumed | −0.682 | 74.102 | 0.497 | −0.72871 | 1.06786 | −2.85642 | 1.39899 | ||
| Building Density | Grade | Weather Station Location | Grade |
|---|---|---|---|
| 0% | 1 | 0–25 m | 7 |
| 1−10% | 2 | 25–100 m | 6 |
| 10−30% | 3 | 100–200 m | 4 |
| 30−40% | 4 | 200–500 m | 3 |
| 40−50% | 5 | 500–1000 m | 2 |
| 50−60% | 6 | Over 1000 m | 1 |
| Over 60% | 7 | - | - |
| Months and Corresponding Season | Grade | Time Interval | Grade | |
|---|---|---|---|---|
| December–February | Winter | 1 | 00–05 | 1 |
| March–May | Spring | 2 | 06–11 | 5 |
| June–August | Summer | 7 | 12–17 | 7 |
| September–November | Autumn | 6 | 18–23 | 3 |
| Apparent Temperature | Grade | Relative Humidity | Grade | Wind Speed (m/s) | Grade |
|---|---|---|---|---|---|
| Under 0 °C | 1 | 60 ≥ 70% | 2 | 0.0 ≤ 0.1 | 7 |
| 1–7 °C | 2 | 70 ≥ 80% | 3 | 0.1 ≤ 1.5 | 6 |
| 8–13 °C | 3 | 80 ≥ 90% | 5 | 1.5 ≤ 3.3 | 5 |
| 14–20 °C | 4 | 90 ≥ 100% | 6 | 3.3 ≤ 5.5 | 4 |
| 21–32 °C | 5 | 100% | 7 | 5.5 ≤ 10.7 | 3 |
| 33–40 °C | 6 | - | - | Over 10.7 | 1 |
| Over 40 °C | 7 | - | - | - | - |
| Average Accumulated RainFall | Grade | Air Pressure | Grade | Cloud Cover | Grade | |
|---|---|---|---|---|---|---|
| No rain | 0 mm | 1 | Under 1013 hPa | 1 | 5 | 3 |
| Light rain | 0 < 80 mm | 2 | Over 1013 hPa | 7 | 6 | 4 |
| Heavy rain | 80 ≤ 200 mm | 3 | - | - | 7–8 | 6 |
| Extremely heavy rain | 200 ≤ 350 mm | 5 | - | - | 9 | 7 |
| Torrential rain | 350 ≤ 500 mm | 6 | - | - | - | - |
| Extremely torrential rain | Over 500 mm | 7 | - | - | - | - |
| Enthalpy Range for Thermal Comfort | Grade |
|---|---|
| Under 79 kJ/kg | 1 |
| Over 79 kJ/kg | 7 |
| Estimate | S.E. | C.R. | P | Label | |||
|---|---|---|---|---|---|---|---|
| Weather pattern | <--- | Solar radiation | −0.454 | 0.020 | −22.710 | *** | |
| Thermal environment | <--- | Urban form | −0.116 | 0.018 | −6.520 | *** | |
| Thermal environment | <--- | Weather pattern | −6.888 | 5.615 | −1.227 | 0.220 | |
| Thermal environment | <--- | Solar radiation | −3.436 | 2.565 | −1.340 | 0.180 | |
| Location | <--- | Urban form | 1.000 | ||||
| Air pressure | <--- | Weather pattern | 1.462 | 0.096 | 15.187 | *** | |
| Building density | <--- | Urban form | 1.059 | 0.051 | 20.734 | *** | |
| Cloud cover | <--- | Weather pattern | 1.000 | ||||
| Time period | <--- | Solar radiation | 0.135 | 0.040 | 3.353 | *** | |
| Season | <--- | Solar radiation | 1.000 | ||||
| Vegetation cover density | <--- | Urban form | −0.576 | 0.029 | −19.566 | *** | |
| Wind direction | <--- | Weather pattern | −0.116 | 0.039 | −2.995 | 0.003 | |
| Rainfall | <--- | Weather pattern | −0.484 | 0.069 | −7.034 | *** | |
| Humidity | <--- | Thermal environment | 1.000 | ||||
| Wind speed | <--- | Thermal environment | −0.033 | 0.028 | −1.186 | 0.236 | |
| Enthalpy | <--- | Thermal environment | −1.444 | 0.096 | −15.102 | *** | |
| Temperature | <--- | Solar radiation | 0.468 | 0.012 | 38.447 | *** |
| Estimate | |||
|---|---|---|---|
| Weather pattern | <--- | Solar radiation | −1.019 |
| Location | <--- | Urban form | 0.749 |
| Air pressure | <--- | Weather pattern | 0.586 |
| Building density | <--- | Urban form | 0.923 |
| Cloud cover | <--- | Weather pattern | 0.728 |
| Season | <--- | Solar radiation | 0.938 |
| Vegetation cover density | <--- | Urban form | −0.776 |
| Rainfall | <--- | Weather pattern | −0.236 |
| Temperature | <--- | Solar radiation | 0.899 |
| Absolute Fit Index | Estimate | Relative Fit Index | Estimate | Parsimony Fit Index | Estimate |
|---|---|---|---|---|---|
| χ(1) | 4.732 | NNFI | 0.813 | PNFI | 0.165 |
| GFI | 0.996 | NFI | 0.992 | PGFI | 0.100 |
| AGFI | 0.963 | CFI | 0.994 | χ2/df | 4.732 |
| RMR | 0.018 | IFI | 0.994 | ||
| RMSEA | 0.076 | RFI | 0.953 | ||
| ECVI | 0.036 |
| Comparison | Weather Station | Building Density (%) | Altitude (m) | Average Wind Speed (m/s) |
|---|---|---|---|---|
| Location | Station 1 | 3.1% | 72.57 | 0.26 |
| Station 2 | 0.4% | 825.8 | 2.67 | |
| Density | Station 1 | 3.1% | 72.57 | 0.26 |
| Station 3 | 76.2% | 49 | 0.35 | |
| Wind speed | Station 4 | 56.6% | 7 | 2.19 |
| Station 5 | 53.2% | 71 | 0.35 |
© 2020 by the authors. Licensee MDPI, Basel, Switzerland. This article is an open access article distributed under the terms and conditions of the Creative Commons Attribution (CC BY) license (http://creativecommons.org/licenses/by/4.0/).
Share and Cite
Huang, C.-H.; Tsai, H.-H.; Chen, H.-c. Influence of Weather Factors on Thermal Comfort in Subtropical Urban Environments. Sustainability 2020, 12, 2001. https://doi.org/10.3390/su12052001
Huang C-H, Tsai H-H, Chen H-c. Influence of Weather Factors on Thermal Comfort in Subtropical Urban Environments. Sustainability. 2020; 12(5):2001. https://doi.org/10.3390/su12052001
Chicago/Turabian StyleHuang, Chih-Hong, Hsin-Hua Tsai, and Hung-chen Chen. 2020. "Influence of Weather Factors on Thermal Comfort in Subtropical Urban Environments" Sustainability 12, no. 5: 2001. https://doi.org/10.3390/su12052001
APA StyleHuang, C.-H., Tsai, H.-H., & Chen, H.-c. (2020). Influence of Weather Factors on Thermal Comfort in Subtropical Urban Environments. Sustainability, 12(5), 2001. https://doi.org/10.3390/su12052001