1. Introduction
In 2050, it is estimated that two-thirds of the world’s population will live in cities and by 2030, this will already be around 60% [
1]. This will represent challenges not only to the city, but also to transportation planners, especially in terms of reducing and mitigating potential problems and impacts related with this growth, such as accessibility/mobility, the use of public space, pollution, and many other issues.
Regarding urbanization and migration [
2] as important city megatrends, it is relevant to point out that cities are rapidly growing in space and time, pressuring the urban transportation sector (mainly with environmental, social, and economic issues), as it was responsible for about 20% of all greenhouse gas emissions in the world and 27.55% in Europe alone in 2014 [
3]. In addition, it is the main contributor to a decrease in safety in urban areas and inherent costs for societies. For example, road accidents in Portugal represent a cost of 2 billion euros yearly [
4].
The current model of many European cities where the car remains the center of city planning and urbanism will not be feasible in the near future [
5]. We need to have “true” smart cities and thus, we need smart mobility to achieve a sustainable city. The urban transportation system should be sustainable and efficient. To enhance that, it should not be necessary to own or use a car within a city and especially for commuting purposes. Travel within cities will have to be done on foot and by bicycle or in conjunction with public transportation [
6], using the most sustainable means of transport. Here, the bicycle plays an important role because in urban travels up to a maximum of 5–8 km, the bicycle is the fastest means of transport [
7], does not pollute, improves the user’s health [
8], and occupies very little public space for circulation and parking. For the city, this represents a benefit of 0.18€ per km cycled (and if the person had traded their car for a bicycle, the benefit would be even higher because each kilometer driven by car incurs an external cost of 0.11€) in comparison to the usage of cars [
9] and it can also increase by 10 times the range of a bus stop [
10]. Thus, bicycles will be necessary to ensure that populations move in a sustainable, smart, efficient, and effective way within city areas.
“Smart velomobilities”, policies, and potential innovation (to define cycling as an active, sustainable, inclusive, and networking mode of transport) are important to promote smart cities in the context of being an asset using the Internet of Things [
11], mainly regarding mobility issues.
There are several ways to promote the use of a bicycle in a city. Several authors have concluded that good infrastructural conditions enhance the use of the bicycle as a regular mode of transport [
12,
13,
14,
15], showing that cycling infrastructure is an imperative condition to promote it. However, it is not always sufficient and there are other integrative measures to promote cycling that have to be adopted, are influential, and can speed up the process of adopting bicycles as a regular means of transport [
16,
17].
In some areas of knowledge, there is an expectation that people will start using bicycles to commute with little or even no infrastructure and few facilities. However, it is known that in the US, only 4% of people are considered “strong and fearless” for cycling, i.e., they will use the bicycle without any infrastructure. In the EU, the “strong and fearless” represent only 1%. The reasons for someone to use a bicycle can be different, since bicycle users may be categorized in different ways, e.g., as pioneers or followers [
18,
19,
20]. On the other hand, the risk and its perception are directly related to the use of bicycles as a regular means of transport [
21]. Implementing aspects that might influence people to use a bicycle more often as a regular means of transport takes time and needs political measures that support it.
Different cities present different levels of use, infrastructures, and political and cultural support for the use of bicycles as a regular means of transport. Therefore, they must be studied, analyzed, and planned to promote cycling in a customized way, i.e., more locally-oriented towards the respective specificities of a territory and its people.
Thus, cities with low cycling development or maturity are considered “starter cycling cities” [
22]. These are cities with low cycling modal share (less than 10%) and that lack cycling infrastructures and/or support facilities. In these cases, the aim should be to implement a basic cycling network before any other measures that could stimulate cycling. In this regard, the city needs to communicate all the benefits of cycling and the advantages of implementing a cycling network.
However, there is insufficient data available on cycling in most cities to correctly assess how many people are using their bicycle as a regular means of transport, how many kilometers are cycled by each user, the profile of the cyclist, etc. Thus, in this context, research is even more necessary to collect the necessary and relevant information that will allow one to diagnose issues and define other solutions besides adequate infrastructure to promote cycling [
23]. Transportation and urban planners usually have to use studies from other contexts, i.e., other cities that are in different stages of cycling evolution with more usage and infrastructures, to better target and develop the promotion materials to encourage new users for cycling, to determine new locations of bike-sharing stations, to help bike-sharing operators improve their systems [
24], and even to help determine infrastructural problems and ascertain potential location risks [
25]. In other words, the data gathered were mainly used to acknowledge where people are cycling so that the planners could prioritize interventions on those streets, making cycling easier, safer, and more comfortable [
26,
27]. As such, it is necessary to define a more suitable strategy and methodology to better promote cycling and, therefore, achieve a more sustainable mobility in starter cycling cities.
The strategy adopted to promote cycling [
28] must be based on three fundamental guidelines: adequate infrastructure, complementarity with other public means of transport, and the support of digital tools.
The research of this study focused on the development of a digital tool that would support and increase the use of cycling in a starter cycling city since, according to the literature, the other two fields (infrastructure and multimodality) have been further studied and discussed already. In addition, digital technology is still growing strong and rapidly and could be a very important asset to promote cycling as a solution to establish mobility as a service (MaaS) in the future.
With this in mind, we conducted research on the Portuguese city of Braga since the local government assumed the need to improve both cycling and walking infrastructures in order to achieve sustainable mobility. For this purpose, 22 km of cycling routes were created and complemented with parking facilities in the city to promote multimodality. However, the local government has not yet shown interest nor concern on the development of digital platforms that promote sustainable mobility solutions, namely regarding cycling.
It was then possible to arrive at the conclusion that neither the city of Braga nor other medium-sized Portuguese cities have any type of digital support to promote cycling, which is a gap that this work intends to address by developing a methodology that can be replicated in any other of the 332 Portuguese municipalities with small and medium-sized cities or in other parts of the world.
Betting on the development of digital solutions to promote cycling is even more relevant in the Portuguese context since the current Portuguese Government adopted a National Strategy for Active Mobility—Cycling at the end of 2019, which defined the strategy to increase cycling in cities and to make starter cycling cities increase their bicycle modal share to 10%. The goal for the country is to achieve a 7.5% bicycle modal share, supported by a cycling network of 10,000 km until 2030 and other support measures [
29].
Thus, this work aims to create proper digital cycling platforms and mobile applications that can influence non-regular cyclists to adopt bicycles as their daily main means of transport, especially for mid-sized starter cycling cities. We hope that this can be an example to replicate all around the world.
The study will focus on the city’s existing cycling infrastructures, both digital and physical, and on an evaluation of the potential influence that the information of a mobile app for cycling can achieve based on a survey of the city’s current cyclists.
It is important to restate that the survey was distributed to cyclists from the city of Braga in order to assess the local characteristics, as well as the relevance of using a mobile application to improve and boost cycling. The survey focused on cyclists who are familiar with the process of cycling in a context of low modal representation, especially with motorized traffic. This work did not include non-cyclists since they would not have the same perception about the reality of cycling in a starter cycling city, even if they could make relevant contributions to understand what the main issues are and obstacles for them to not use a bicycle. Beyond that, it is very unlikely that a non-cyclist will know the existing cycling apps and platforms and will be able to evaluate their suitability regarding that activity.
As such, the logic behind the choice of the survey’s sample was to encourage occasional cyclists (the ones that cycle for sport or leisure) to use bicycles regularly, i.e., for commuting purposes, instead of focusing on non-cyclists.
The occasional cyclist group can represent up to almost 50% of the cyclists in starter cycling cities and them starting to use the bicycle regularly can also have a strong influence on others, especially the non-cyclist, therefore leading by example.
The results of this study will allow and guide mid-sized starter cycling cities to integrate and develop digital web/mobile platforms in the future, especially for promoting smart and sustainable mobility. The more people use bicycles on their daily trips, the more cities become sustainable. So, we will use the best features of every application and platform and conjugate them in one platform/app with wider capabilities that are not only focused on the cyclist, but also on the city user.
The remainder of this article is as follows:
Section 2 is state of the art, concerning cycling apps and platforms;
Section 3 describes the methodology that was used in this research;
Section 4 is a results analysis, which is discussed in
Section 4; finally, in
Section 5, the main conclusions of the investigation are presented.
3. Materials and Methods
3.1. Case study of Braga, PT. Characterization of Physical and Digital Cycling Infrastructures of the City
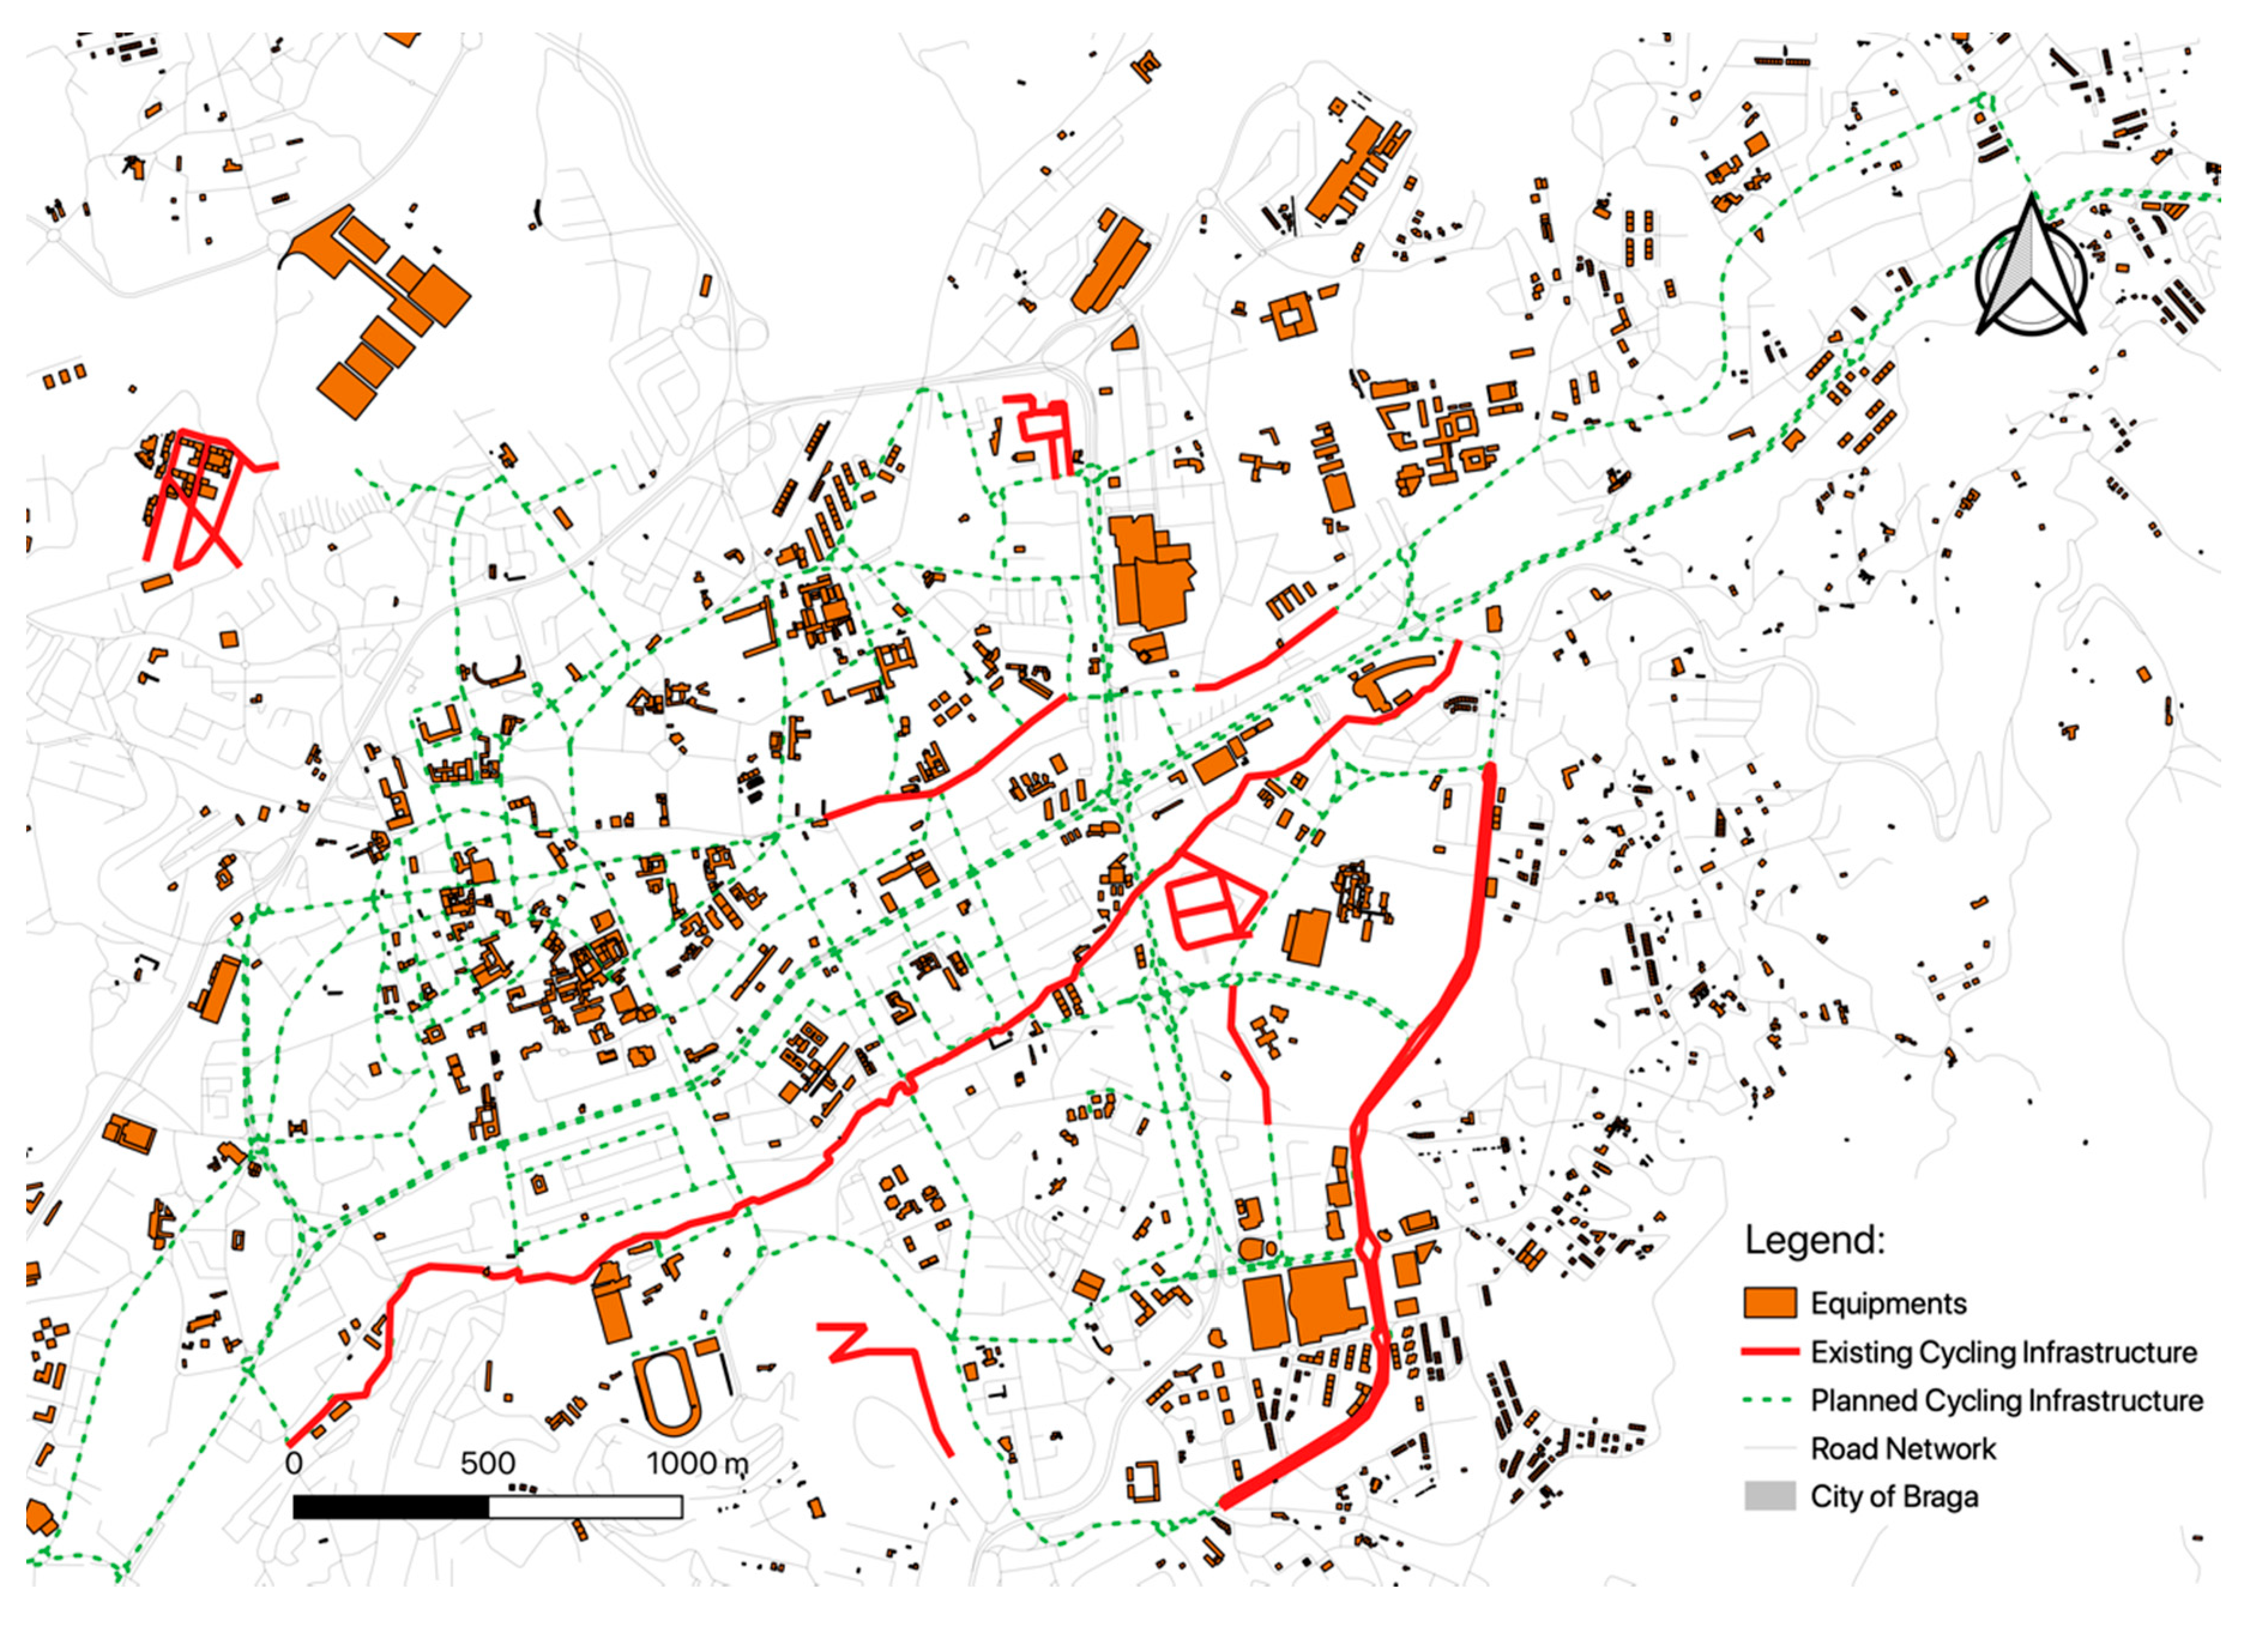
Braga is located in the North of Portugal and it is the country’s oldest city. In the past 50 years, it has rapidly grown and sprawled to the surrounding areas on car-oriented urban planning. Nowadays, only the historical city center can be considered a pedestrian and cycling-friendly area. With 181,484 residents, Braga is the 7th biggest city of the country population-wise and in a broader context, e.g. European cities, it can be considered a medium-sized city [
95]. It is located in a valley and 55% of its population live in a relatively flat area.
Concerning weather, Braga is a South European city with a moderate average temperature (annual maximum average is 17 °C and the annual minimum average is 10 °C) and during the year, it rains about 45% of the time (average per year is 1822 mm), so it is rain-free about 195 days a year [
16].
In the 2011 censuses, Braga presented a very low cycling mode share of 0.1%. In 2013, a mobility study showed that the use of a bicycle in Braga increased to 0.4%. After that, there was no further survey of the modal split in this territory and there is currently no reliable information about the real number of people who use bikes on a regular basis. According to these values of cycling mode share, Braga can be classified as a medium-sized starter cycling city.
According to the goals of the Portuguese National Strategy for Active Cycling Mobility, cities like Braga have to reach 10% in bicycle mode share by 2030 [
29]. In this context, Braga mobility goals are aligned with the National Cycling Strategy since the city wants to have 10% of the population riding a bicycle by 2025 [
96]. Furthermore, the municipality of Braga has the intention to build a 76 km cycling network during the next few years, starting with a 22 km network that includes the city of Braga [
96], as can be seen in
Figure 1.
In general, the streets of Braga are car-oriented and not cycling-friendly. In fact, they are deterrents for cycling and other active means of transportation, especially the primary and secondary distributors. Braga has a large road network, with more than 1000 km of roadways. However, there are only 7.5 km of bicycle lanes (3800 m segregated, 700 m BUS + Bicycle, and 3030 m in coexistence with pedestrians) [
96], which do not form a complete cycling network. When observing the map of
Figure 1, one may see that there are several cycling infrastructures that are not interconnected and continuous and also do not cover the center of the city, nor the majority of the most important facilities and equipment of Braga. These factors represent the main barrier to what is intended, which is using bicycles as a regular means of transport. Besides that, the city lacks bicycle support facilities like parking places and maintenance spots.
In terms of digital cycling infrastructures, it is possible to verify that Braga does not present digital solutions to support cycling mobility. In fact, not even Google Maps allows obtaining itineraries for bicycle trips, demonstrating that there is a gap in this matter and that there is room for improvement, both in quantity and in quality. However, it is important to highlight the role of associations that promote the use of bicycles, like the Cycling Braga Association (
Braga Ciclável), which developed and made available on its website a map that shows the available bicycle lanes, as well as the desired routes and parking spots for the city’s bicycle users [
97].
3.2. Model to Promote Cycling Mobility in Mid-Sized Starter Cycling Cities
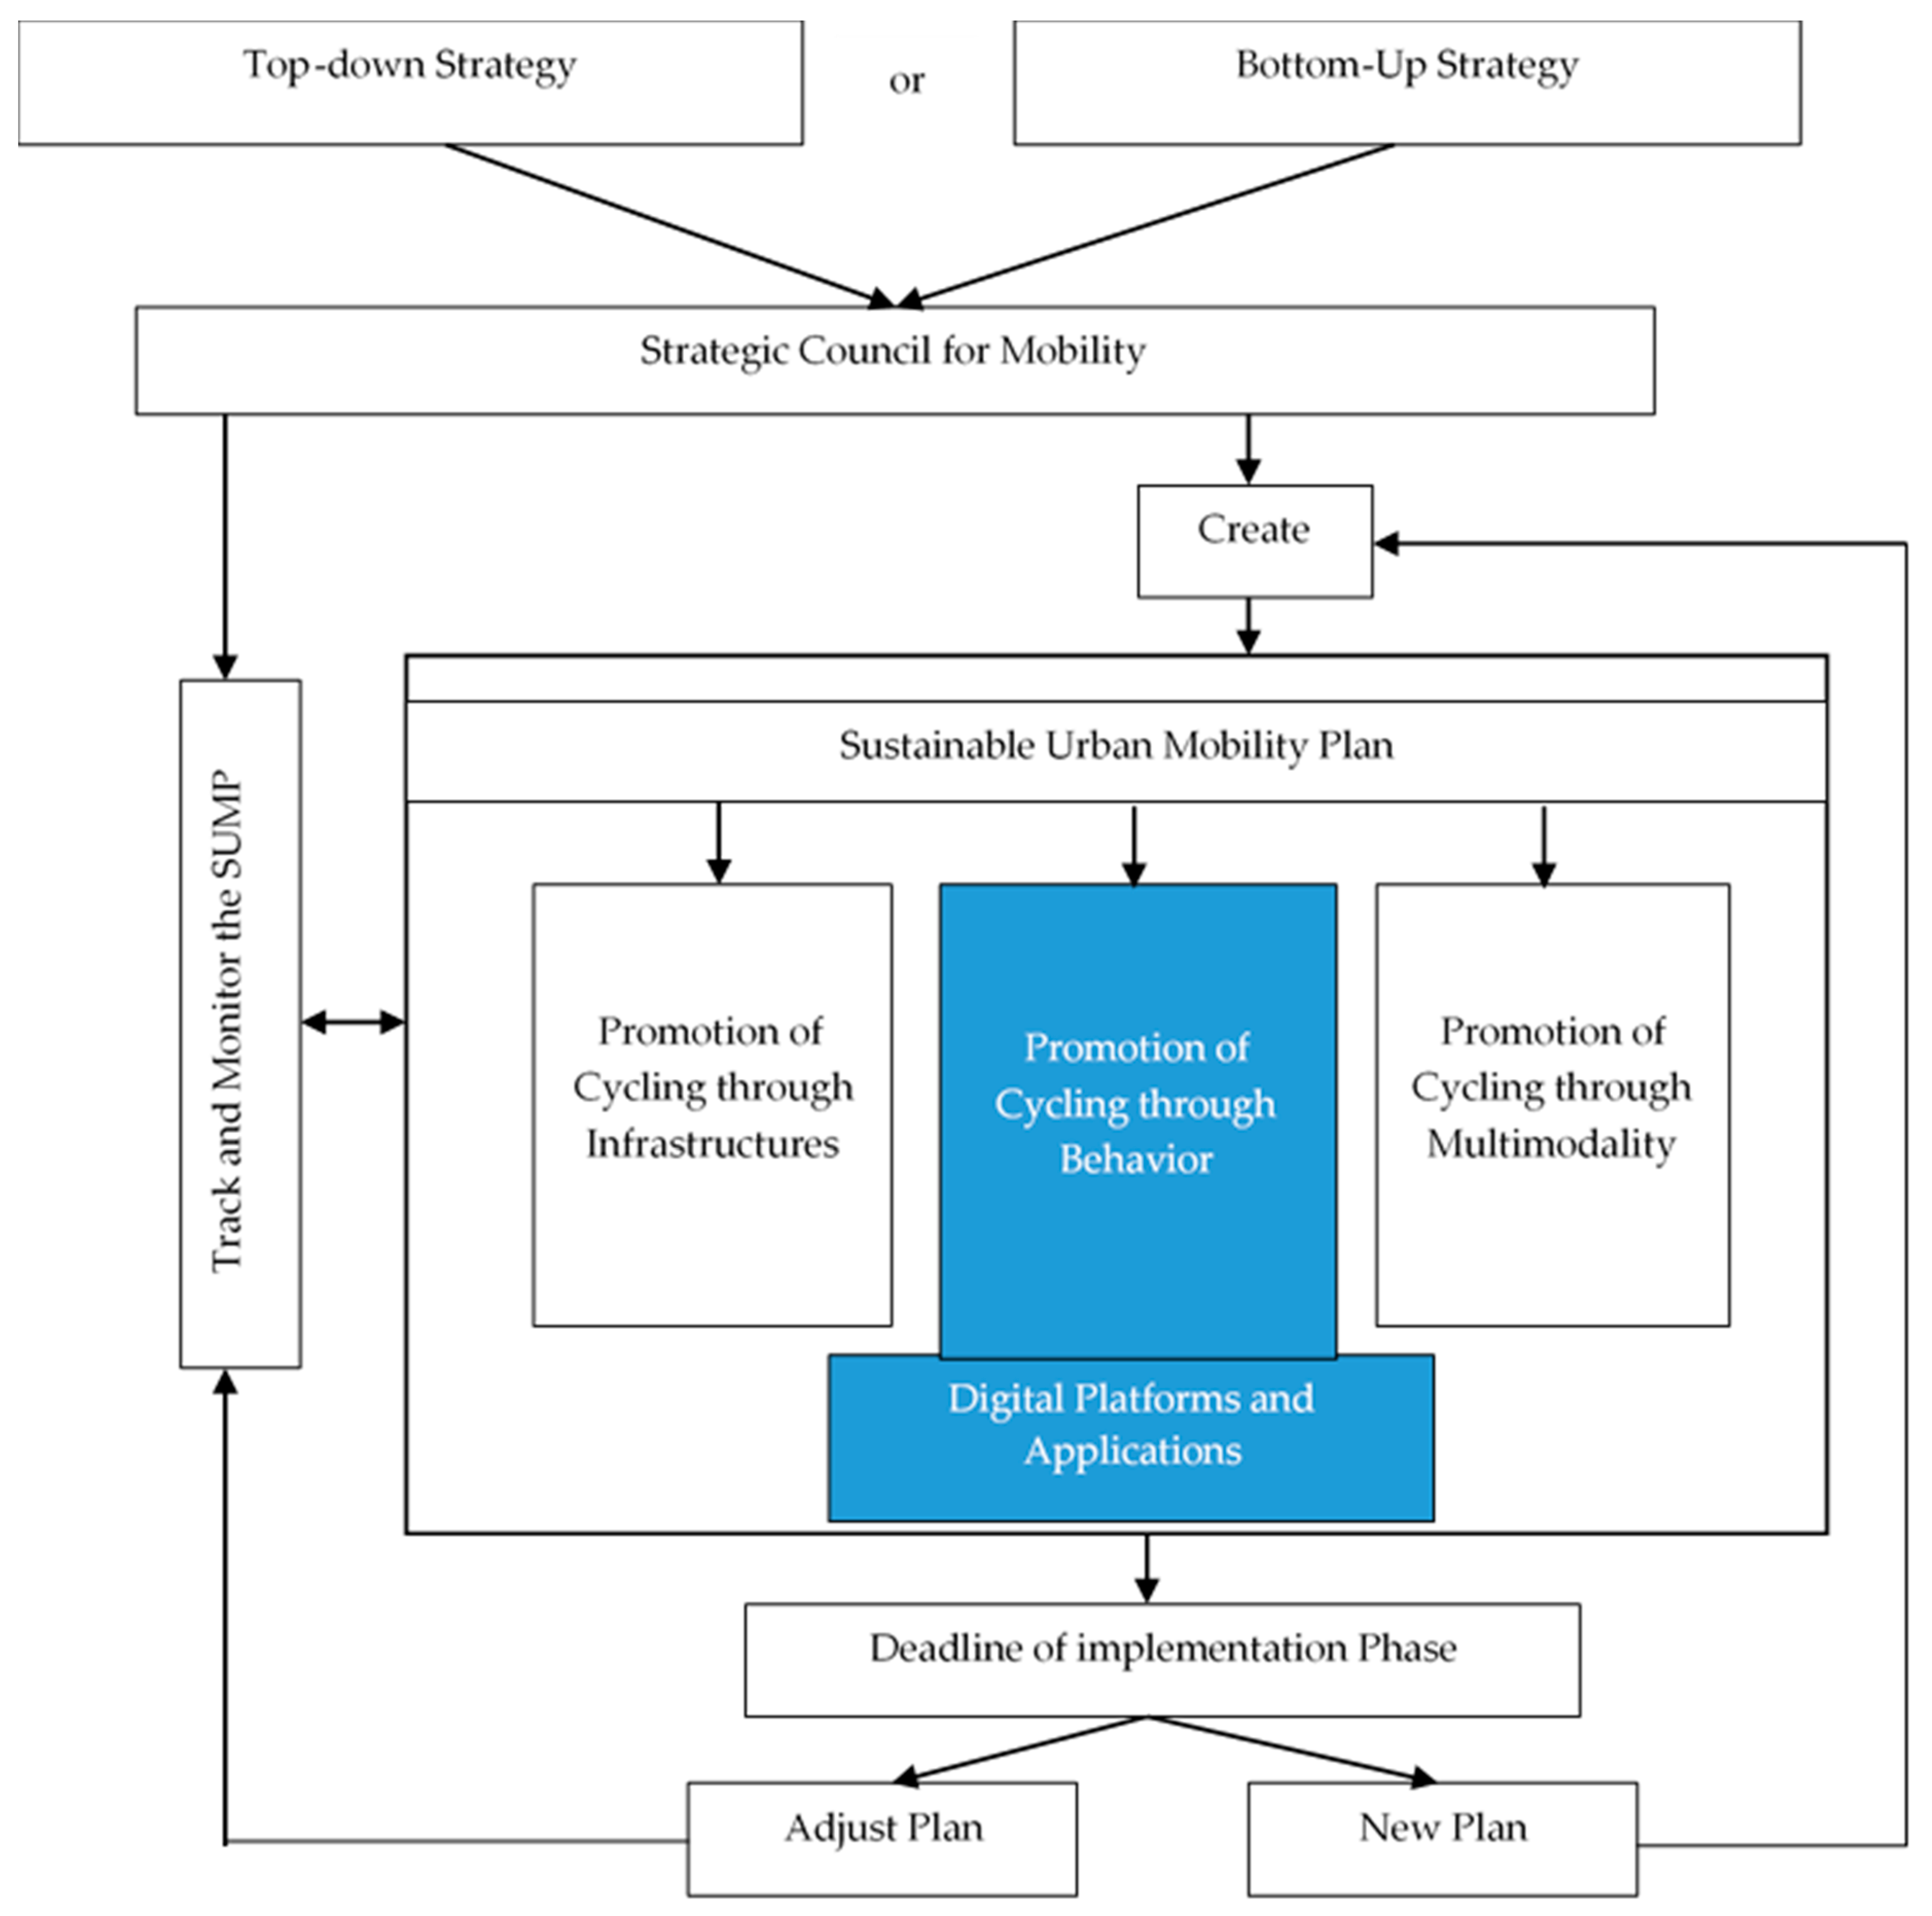
As the diagram in
Figure 2 shows, we have two ways to start promoting cycling mobility in cities. A Bottom-Up Strategy can be forced by society, making politicians and leaders adjust their politics to match people’s interests. Conversely, a Top-Down Strategy can be imposed or started by leaders and politics by their own initiative. Both ways should lead politics and leaders to create a Strategic Council for Mobility, with territorial authorities, operating capacity, and a dedicated budget. After that, there is a need to create a Sustainable Urban Mobility Plan with the necessary policies and measures to ensure cycling in the city. These would be based on three main areas: (i) infrastructure, (ii) multimodality, and (iii) behavior, including the development of digital support solutions.
When the implementation phase of the plan reaches a deadline, the Strategic Council for Mobility can adjust the plan by tracking and monitoring it or, if it reached the last deadline, they should create a new plan and implement it. This strategy then continues with the logic of PDCA (Plan, Do, Check, Act).
As stated in the introduction, the objective of this work focuses on triggering a change of behavior, which can be achieved through education, marketing, and also through the usage of digital platforms and applications, among others.
It is known that digital platforms can help people to adopt the bicycle as a main means of transport in their multiple daily trips and could also increase its sporadic use, especially in cities where the level of usage and dedicated infrastructures are low, as it happens in starter cycling cities. Digital solutions can prepare the city’s population to better know the specificities of cycling and give them the support needed so that the expected growth of the city’s cycling network is achieved. Such is the case of Braga where over the next 5 to 10 years, 22 km of cycling lanes will be built.
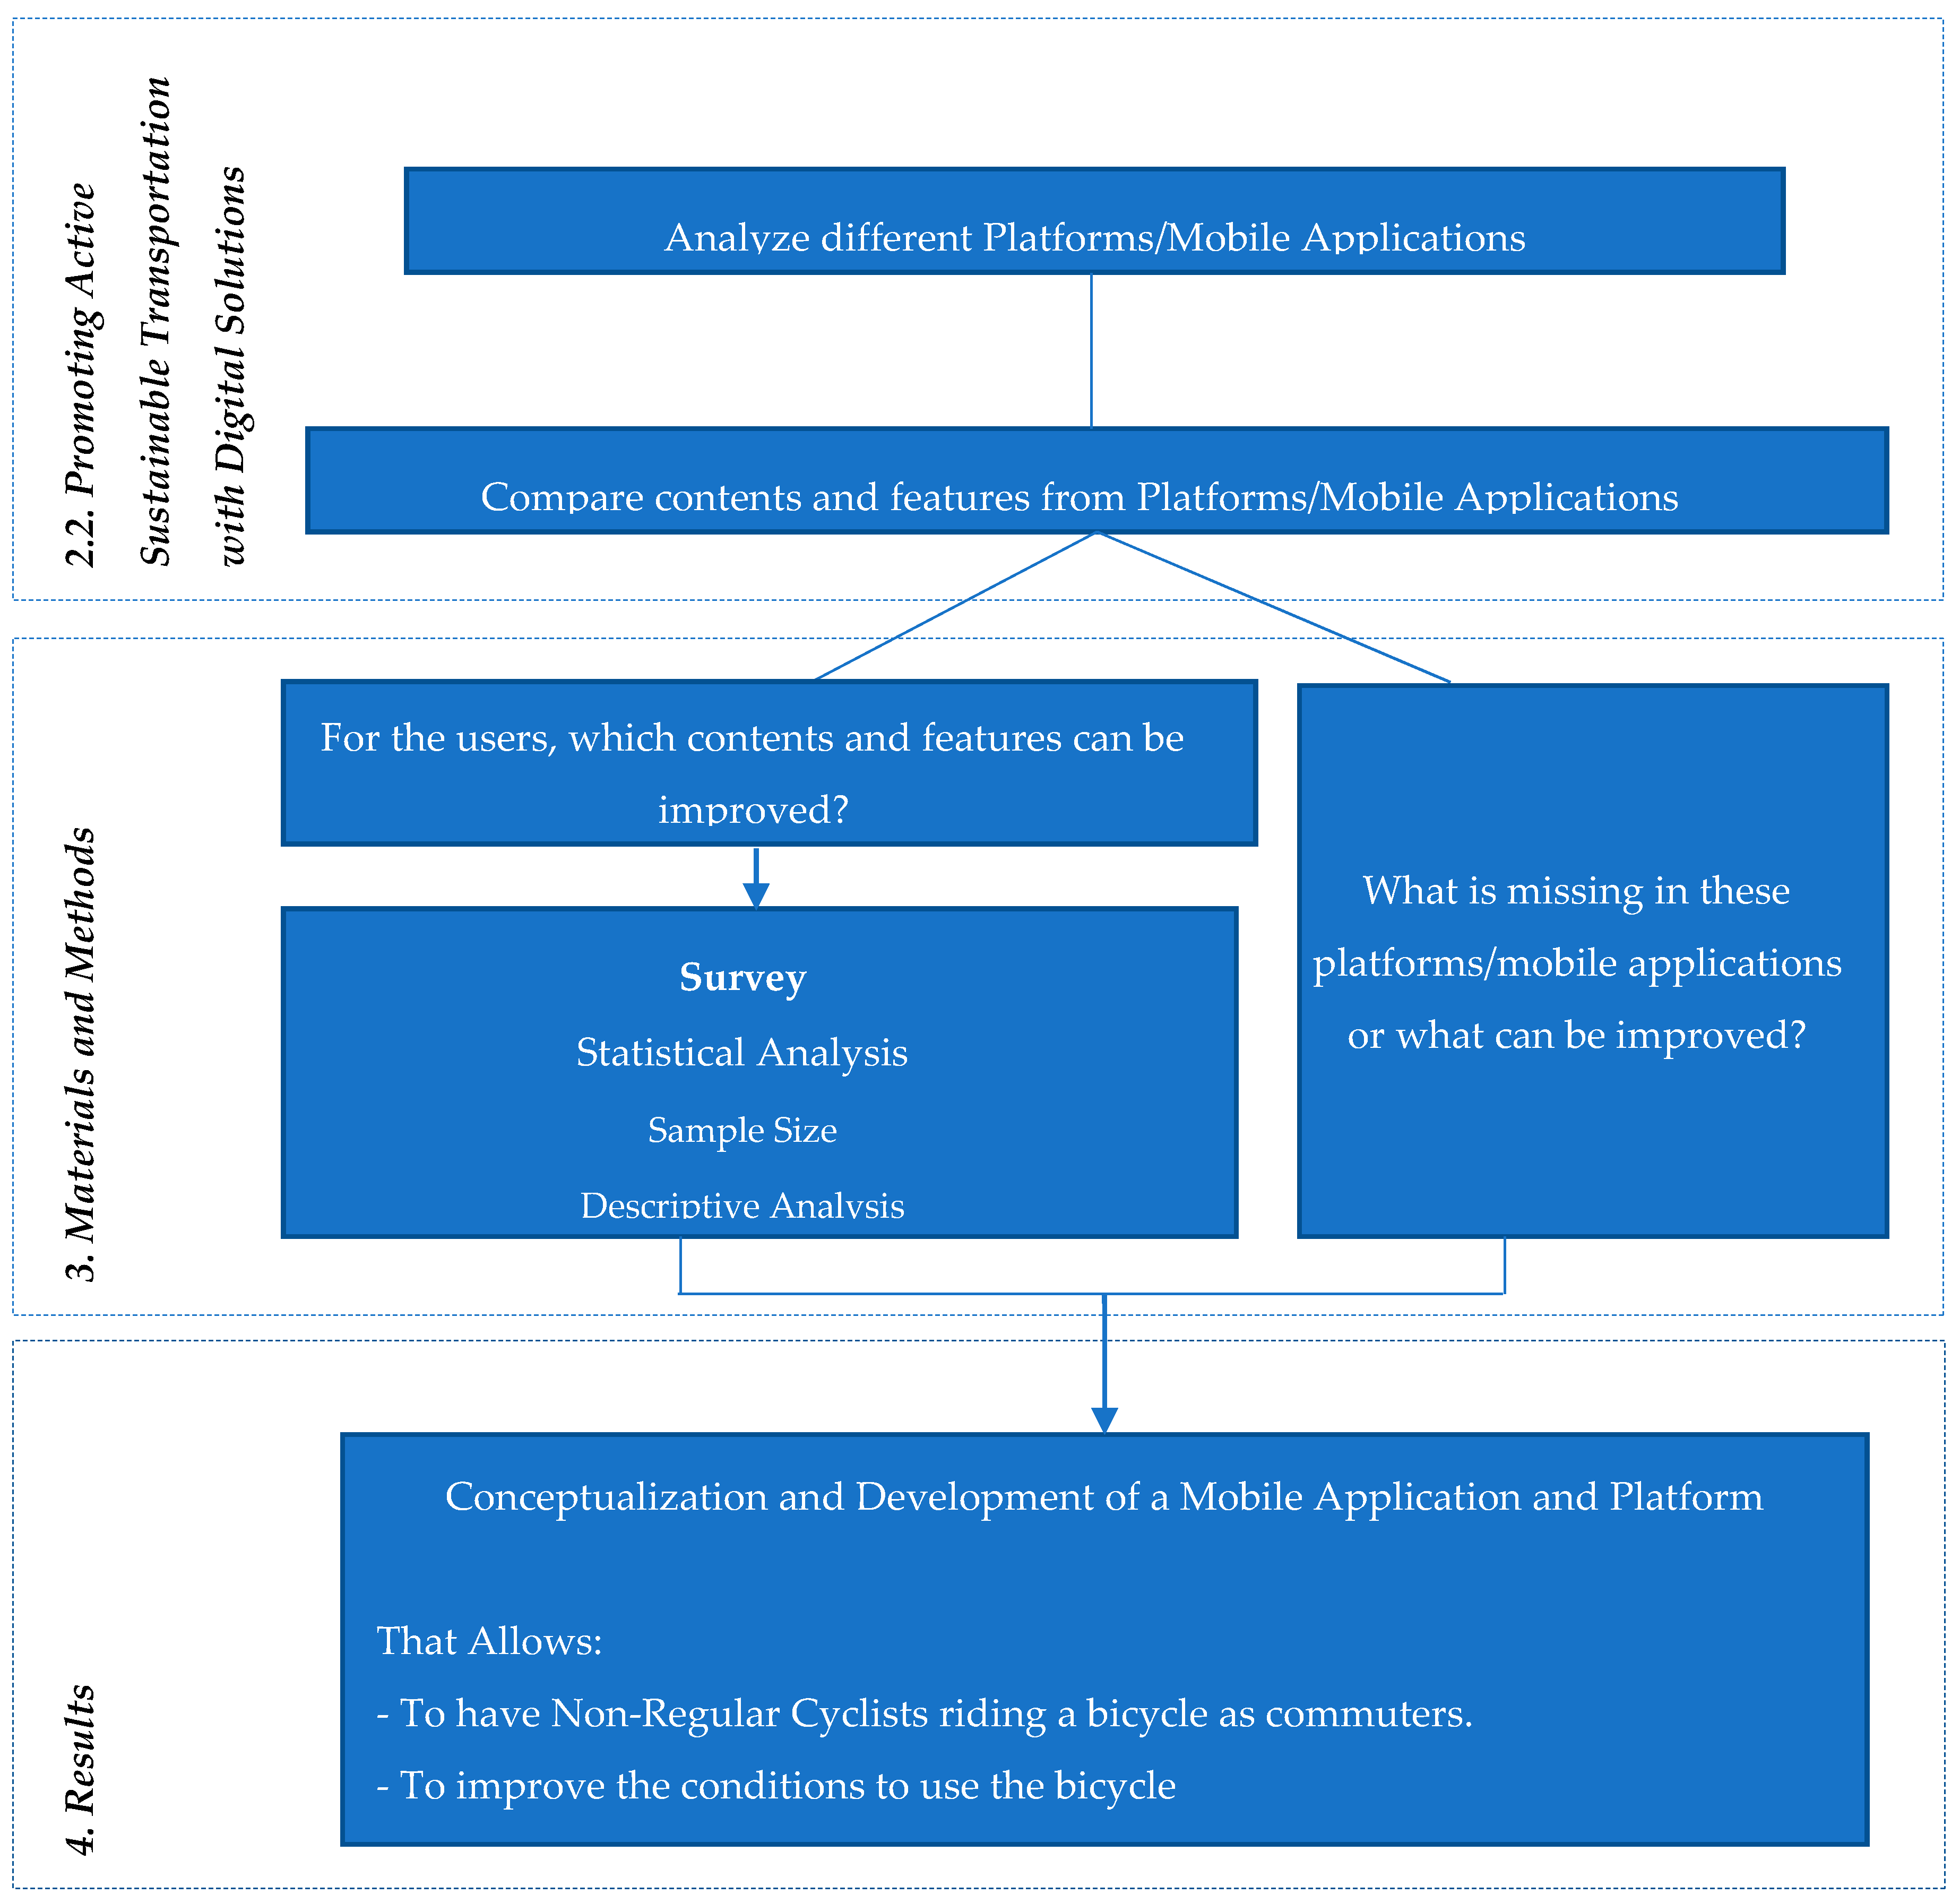
3.2.1. Methodology for the Development of a Digital Solution (App) for a Starter Cycling City
To inspire non-regular cyclists to ride a bicycle as commuters or to improve the conditions for all bicycle using citizens, it is useful to have a platform/mobile application that will help them by providing relevant information about cycling and app features that this type of user really needs and wants. Thus,
Figure 3 presents a diagram of a methodology to develop a mobile app based on two information sources: (1) existing apps and digital platforms, and (2) a survey on existing users of a starter cycling city.
In fact, the survey could also consider non-cyclists. However, in a city where the bicycle does not have much use, the rationale was that the existing apps and digital solutions are being developed for other types of users and thus, do not meet the real needs of cyclists from a starter cycling city.
For a starter cycling city, we argue that the first level of intervention (policy goal) should be focused on non-regular cyclists, i.e., those who do not use bicycles daily or frequently, inspiring them to become regular users—cycling commuters—since this group is already aware of the majority of pros and cons of cycling in this type of city. A comparison between the two groups of cyclists will allow one to identify if there is a barrier and if so, whether it can be minimized through a digital solution.
In the future, non-cyclists will also be studied to try to come up with a solution that encourages them to join the cycling community or to revise and improve the ones we arrived at during this stage of the project.
3.2.2. Survey Framework
As such, we applied a survey to bicycle users of a starter cycling city in order to help us understand their real needs and either realize the type of information they lack or improve the existing one, so later we could develop an appropriate mobile application, considering the already existing digital solutions and the characteristics of this type of city. With this in mind, we concluded that the survey had to be based on a questionnaire with four different parts:
Profile of the cyclist (regular or non-regular users);
Characterization of cycling in Braga;
Evaluation of the main features we should use in promoting cycling, based on the three domains presented in the model: (i) infrastructure, (ii) multimodality, (iii) behavior.
Cycling digital platforms and applications (understanding the contents, features, and information existing in apps that are available on the market).
The questionnaire was designed to learn and raise the profile of people who are using the bicycle in Braga to understand to what ends these people use bicycles, if they are commuting by bike in an intermodal way, to know the time and distance of their journeys, how they are experiencing the infrastructure (or the lack of it), how they see and classify the factors that can influence them to use bicycles, some open questions regarding said usage, and what they think about the weight that a digital platform can have in influencing more people to cycle.
In this work, we focused on part iv) of the questionnaire, starting by analyzing and comparing the existing cycling digital platforms and mobile applications in order to understand what features each one of them offers and which ones are missing. Thus, at the same time of the survey, we also acknowledged the features that are missing from the existing software that could be added to a new platform designed to improve cycling in a mid-sized starter cycling city.
Applying this methodology to the case study of Braga will provide relevant information to guide other mid-sized starter cycling cities to develop web platforms and apps in the future, especially to make them realize that cycling is a way to achieve smart and sustainable levels of urban mobility.
3.3. Sample
While there is a lot of data and research about the use of the bicycle as a means of transport in some European countries like the Netherlands [
98], Germany [
99], Denmark [
100], France [
101], or Great Britain [
102], this is not the case in Portugal, and especially in the city of Braga. Knowing the approximate number of people using bicycles in Braga i.e., to define the population of this case study analysis, was hard and required a lot of effort.
It would be easier if the analysis focused only on non-cyclists since we could consider them to be almost the entire population of the city of Braga, considering that the mode share for cycling is around 0.4%. Beyond that, to get 400 or 1000 non-cyclists to answer the questionnaire would be much easier since the number of cyclists is very small, with Braga being a starter cycling city.
Furthermore, the major barriers and other information identified in the other studies mentioned in the theoretical framework [
20,
21,
44,
46] regarding non-cyclists would probably be similar to the non-cyclists of Braga. After analyzing the literature, we were able to conclude that building a safe and well-designed infrastructure is the main way to get more people cycling, ideally also converting non-cyclists into cyclists. However, in the case of cyclists, we have different types of users and reasons for cycling, or not, on a regular basis. Thus, knowing the profile, needs, and expectations of the different types of cyclists in Braga will allow one to develop a digital solution that can be designed to increase cycling frequency and somehow influence people in becoming commuters.
Additionally, developing a digital solution based only on non-cyclists’ contributions would probably lead to a digital solution that is already present in the market since this group would be much more focused on infrastructure, safety, and multimodality issues that would not be directly solved with an app. Beyond that, the probable unfamiliarity with this type of cycling app would not allow them to draw reliable conclusions in accordance to the specific needs of cyclists, even in the case of a starter cycling city.
In this context, the target audience for this questionnaire was the bicycle users, i.e., cyclists who travel by bicycle in Braga, for different purposes like sport, leisure, and commuting, among others. To define the current number of cyclists in Braga, we analyzed several sources of information and data.
Thus, in 2011, the Portuguese Census indicated that in Braga, 196 people used bicycles as their main means of transport (the preferred) for commuting [
103]. However, this question could limit the accounting of people who cycle in the city since an affirmative answer from those who use bicycles as a means of transport but not as their preferred mode were automatically excluded. More recently, a mobility study for the Region of Braga named “Quadrilateral Integrated Mobility Study (
Estudo de mobilidade integrada do Quadrilátero)” indicated that 725 people used bicycles (0.4% of the population), regardless of whether they used it for commuting (as a main means of transport), exercising, or leisure purposes [
104]. This originated a discrepancy in the numbers because censuses counting was limited to cyclists that travel by bicycle as their main means of transport for daily commuting.
As such, with the collective effort of Cycling Braga Association (Braga Ciclável), Minho Bicycle Tourism Association (Associação de Cicloturismo do Minho), and Cycling Club of Braga (Clube de Ciclismo de Braga), it was also possible to identify 722 people who used bicycles in 2019, regardless of the purpose. That number was then accepted as valid and was presented in the “integrated mobility study for four main municipalities of Minho Region” and was considered the population for statistical analyses.
Once the statistical population was set on 725 cyclists, the questionnaire was applied to a random sample for significant convenience for a confidence interval of 95% and an error margin of 5%, resulting in a sample size of at least 252 respondents.
Since the structure or the stratification of data was not available for the cycling population, the statistical analysis had to be based on nonparametric assumptions and tests.
For this article, we analyzed the different questionnaire parts concerning the characterization of cycling and also the platforms and mobile applications for cyclists.
3.4. Survey
According to the proposed methodology, we prepared a questionnaire with 30 questions using the online platform SurveyMonkey. This was available on the platform from 19 December 2018 to 29 March 2019 in order to reach more bicycle users and also to allow people to manage the time they had available to answer.
The questionnaire was firstly applied, in a pre-test, to 30 cyclists through an online survey and was later disseminated by web and e-mail and also near bicycles parked through the city. We collected 338 responses, but only 275 were considered complete and valid answers.
The pre-test allowed us to adjust some issues related to the features and user interaction with the questionnaire, which required answering follow-up questions that should only present themselves if there was a previous specific answer, e.g., “Did the respondent use the bike in a complementary way to another means of transport?” and then another question would arise, prompting them to indicate which complementary means of transport, even if the answer was “No”.
Once the questionnaire was adjusted, it was then disseminated on social networks, either through personal messaging or by sharing in groups related to bicycle mobility in the city of Braga. It was also sent via email to members of local cycling associations, such as Braga Cyclable Association (Braga Ciclável), Minho Bicycle Tourism Association (Associação de Cicloturismo do Minho), Braga Cycling Club (Clube de Ciclismo de Braga), all the students from the University of Minho, Braga’s school groups, and to Go By Bike and Bike Zone’s customers. At the same time, small flyers were distributed with a small text and a QRcode, making the questionnaire accessible to more bicycle users from Braga. These pamphlets were left on the handlebars of the bicycles found in the city.
3.5. Statistical Data Analysis
To properly analyze the data collected, we used SPS—Statistical Package for the Social Science, executing a descriptive analysis of the results and using the Mann-Whitney U test in order to compare the results about the main cycling issues for regular and non-regular cyclists in Braga.
In short, the Mann-Whitney test (Non-parametric test) compares the outputs between two independent groups (Cyclists—Regular and Non-Regular). The null hypothesis for the nonparametric test is H0: The two populations are equal. An underlying assumption for appropriate use of the U test was that the continuous outcome was approximately normally distributed or that the samples were sufficiently large to justify their use, based on the Central Limit Theorem (with more than 50 elements), which was verified.
The test statistic for the Mann Whitney U Test is U, and which is the smaller of U1 and U2 is defined by the following equations:
The U test is a nonparametric test of the null hypothesis, which is designed to test differences between groups using ordinal data. A hypothesis is rejected when the p-value (significance) is lower than 0.05, indicating that there was a significant difference in the evaluation made (Soria-Lara et al., 2017). Thus, the U test can be used for rejecting or not rejecting options according to the statistical significance of the answers obtained.
4. Results
4.1. Main Results about Cycling in the City of Braga
The implementation of the questionnaire resulted in 275 responses, which was sufficient to yield results with statistical significance considering the population of 725 cyclists, with a confidence interval of 95% and an error margin of 5%.
These survey results allowed us to build the main profile of the people who use bicycles in Braga. Of all the respondents, 73.1% were men and 26.9% were women. More than half (52%) were married or in a civil union, 39.6% were single, and 8.4% divorced.
In terms of literacy, 0.7% were illiterate, 6.2% had a basic education, 21.5% had secondary education, and 70.8% had a superior degree (30.5% had graduated, 35.6% had a masters degree, and 4.7% had a PhD).
Regarding their professional activity, 68.7% were employed, 13.8% were self-employed, 8.4% were students, 6.2% were unemployed, and 2.9% were retired.
In Braga, about half of the cyclists use bicycles on a regular basis, i.e., for commuting purposes, and the other half use them more sporadically (non-regular), i.e., for leisure and sport purposes (
Table 2).
Most of the people who answered use a bicycle combined with another means of transport, i.e., in a multimodal way, and it was said that the car (diesel) was the other vehicle. Furthermore, only 29.8% of the cyclists combined the bicycle with public transportation (mainly the bus and the train).
Table 3 shows the relevance that the two groups of cyclists (regular and non-regular) give to the main cycling issues in the city of Braga, concerning network criteria, physical characteristics (infrastructures), support facilities, safety measures, and environmental and health features.
Regarding network criteria, it was possible to conclude that attractiveness, comfort, and directness of cycling infrastructure are the three most important factors for both groups of cyclists. This means that these are, from the respondents’ point of view, the three most important functional requirements that must be ensured in cycling network planning.
At the same time, cyclists said that the existence of segregated cycling infrastructures, the existence of safe cycling parking places, and smooth pavements not made of cobblestone and without damage are the three most important aspects concerning the physical characteristics of cycling infrastructures.
Other important features for both groups relate to safety aspects, such as forcing cars to circulate at lower speeds on city streets and transforming pedestrian zones into coexistence zones that include cycling.
Health benefits and the reduction of pollution are the two most relevant reasons that regular and non-regular cyclists use bicycles. On the other hand, weather aspects, such as rain or heat, do not represent significant barriers to the use of bicycles.
The Mann-Whitney test was used to check if both regular and non-regular cyclists from Braga give the same importance to the issues identified.
The null hypothesis tested was “Are the main cycling issues for cyclists in Braga equally important for regular and non-regular cyclists?” We may see the results below in
Table 4.
As we can see, there is one statistically significant difference (p = 0.05) between the two types of cyclists about the Existence of bicycle Parking (p = 0.051), with Regular Cyclists being more relevant (mean 4.27 versus 4.01 when comparing to Non-Regular Cyclists).
The main issues with statistical differences were the existence of a segregated cycling network, the existence of a path not made of cobblestone or damaged, and transforming pedestrian zones in coexistence zones. As shown in
Table 4, we can see that all of these main issues were rated higher by regular cyclists than by non-cyclists.
4.2. Evaluation of the Potential Influence and Information of a Mobile App for Cycling
When analyzing the answers given to the question “Evaluate on a scale of 1 to 5 (where 1 means low importance and 5 very important) the relevance you give to a mobile app for cyclists”, we can see that from all the reasons given (transport, exercise, leisure [
39]), cycling users consider the existence of a mobile app to be important (
Table 5) and both groups (regular and non-regular cyclists) consider it very important when using the bicycle as a means of transport, with a median value of 4.0.
As
Table 6 indicates, non-regular cyclists consider an application as more important to further influence using bicycles as a main means of transport than regular cyclists, reinforcing the logic that was behind the selection of the sample.
In general, cyclists consider that the most important feature in a mobile app is the distance travelled, followed by travel time, the existence of a map, and the CO
2 saved when comparing to a car. However, when we separately analyze the answers given by the type of cyclists, we can see that for regular cyclists, the map is the second most important feature and for non-regulars, it is the travelled time (see
Table 7).
The most used app by the respondents (
Table 8) is Google Maps, followed by Strava and then, much less used, Garmin Connect, Endomondo, and Relieve. However, 63 people indicated that they do not use any of the mentioned apps.
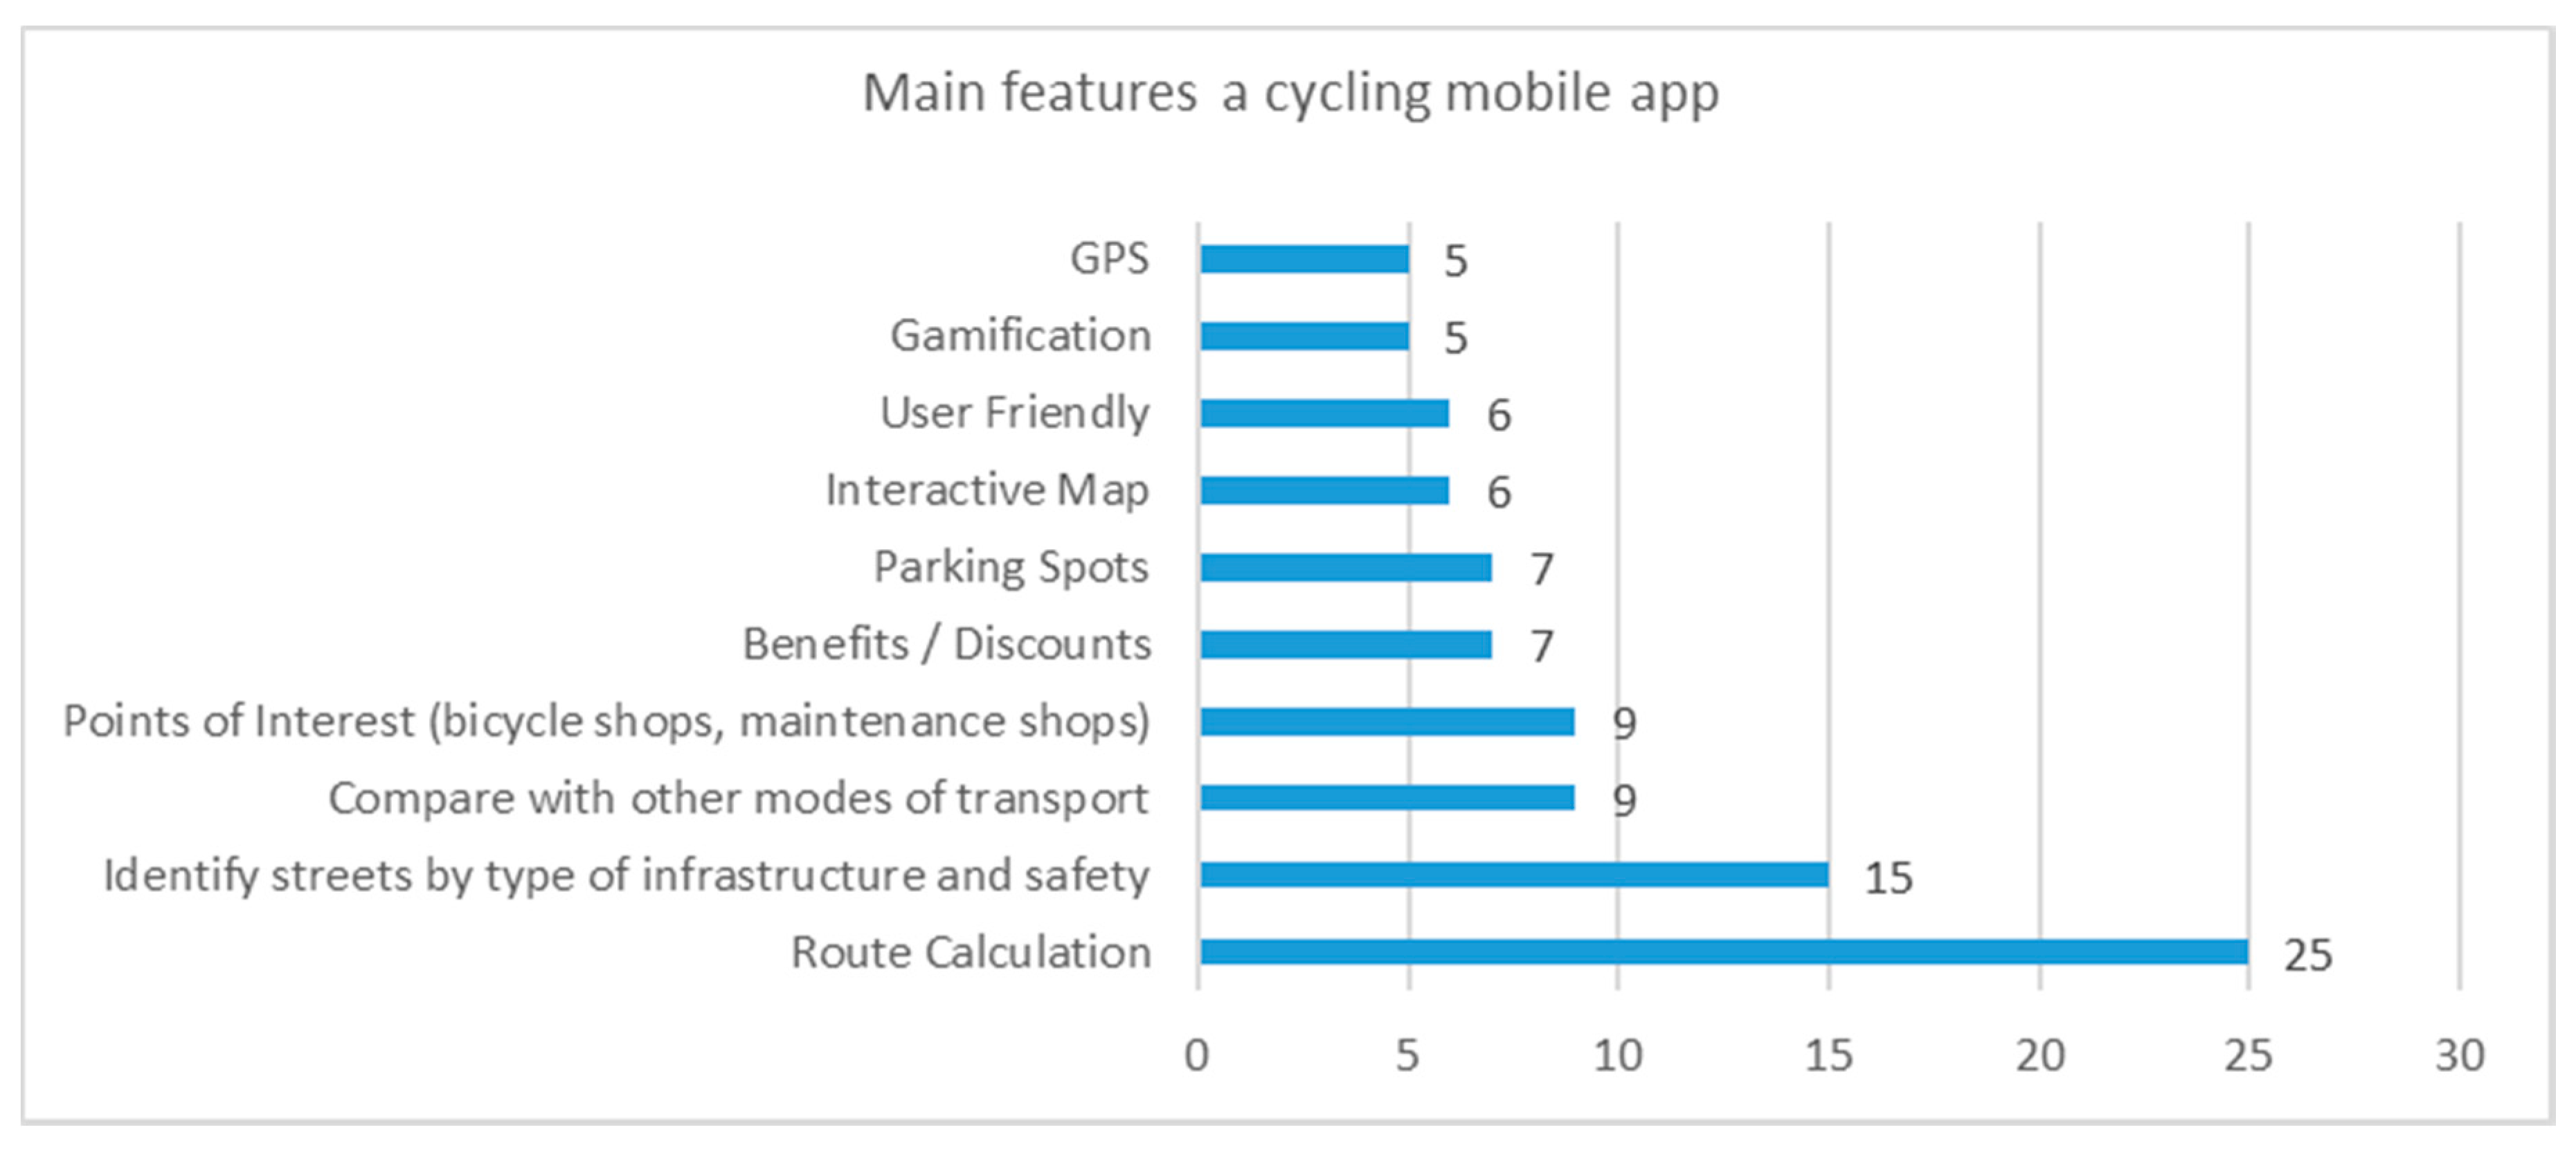
As for missing features (
Figure 4), respondents indicated as being the most important or necessary in an app when using a bike the following: route calculation, street sorting by type of bicycle infrastructure, points of interest (workshops, support, maintenance), a comparison with other means of transport, benefits, and discount offers and parking spots.
4.3. Conceptualization and Development of the Mobile Application and Platform
According to the proposed methodology,
Table 9 shows the main features that a cycling app should have, based on the relevance that both groups of cyclists have regarding the main features provided by the existing apps analyzed in this work. Cyclists consider that the three most important features, which are covered by the existing apps, are the travelled distance, a map, and the time of activity. As we can see in the same
Table 8, the map is present in all of the mentioned applications, but the travel distance and the time of activity were present only in 87.75% of them.
Thus, by matching the existing features in cycling apps and the opinion of the inquired cyclists from Braga, we are now able to identify the basic level of information/features that a cycling mobile app should have. Furthermore, this information could be relevant and used by other similar cities.
According to the cyclists’ answers that were previously analyzed on topic 4.2 and the information provided in
Table 9, we can say that a mobile application must, at least, have the following features:
Travelled distance;
Map;
Time of activity;
Login using social networks;
Average Speed;
Calories Burned;
Route Calculation;
Streets identification by type of infrastructure and safety;
Comparison with other means of transport;
Points of Interest;
Benefits/Discounts;
Parking Spots.
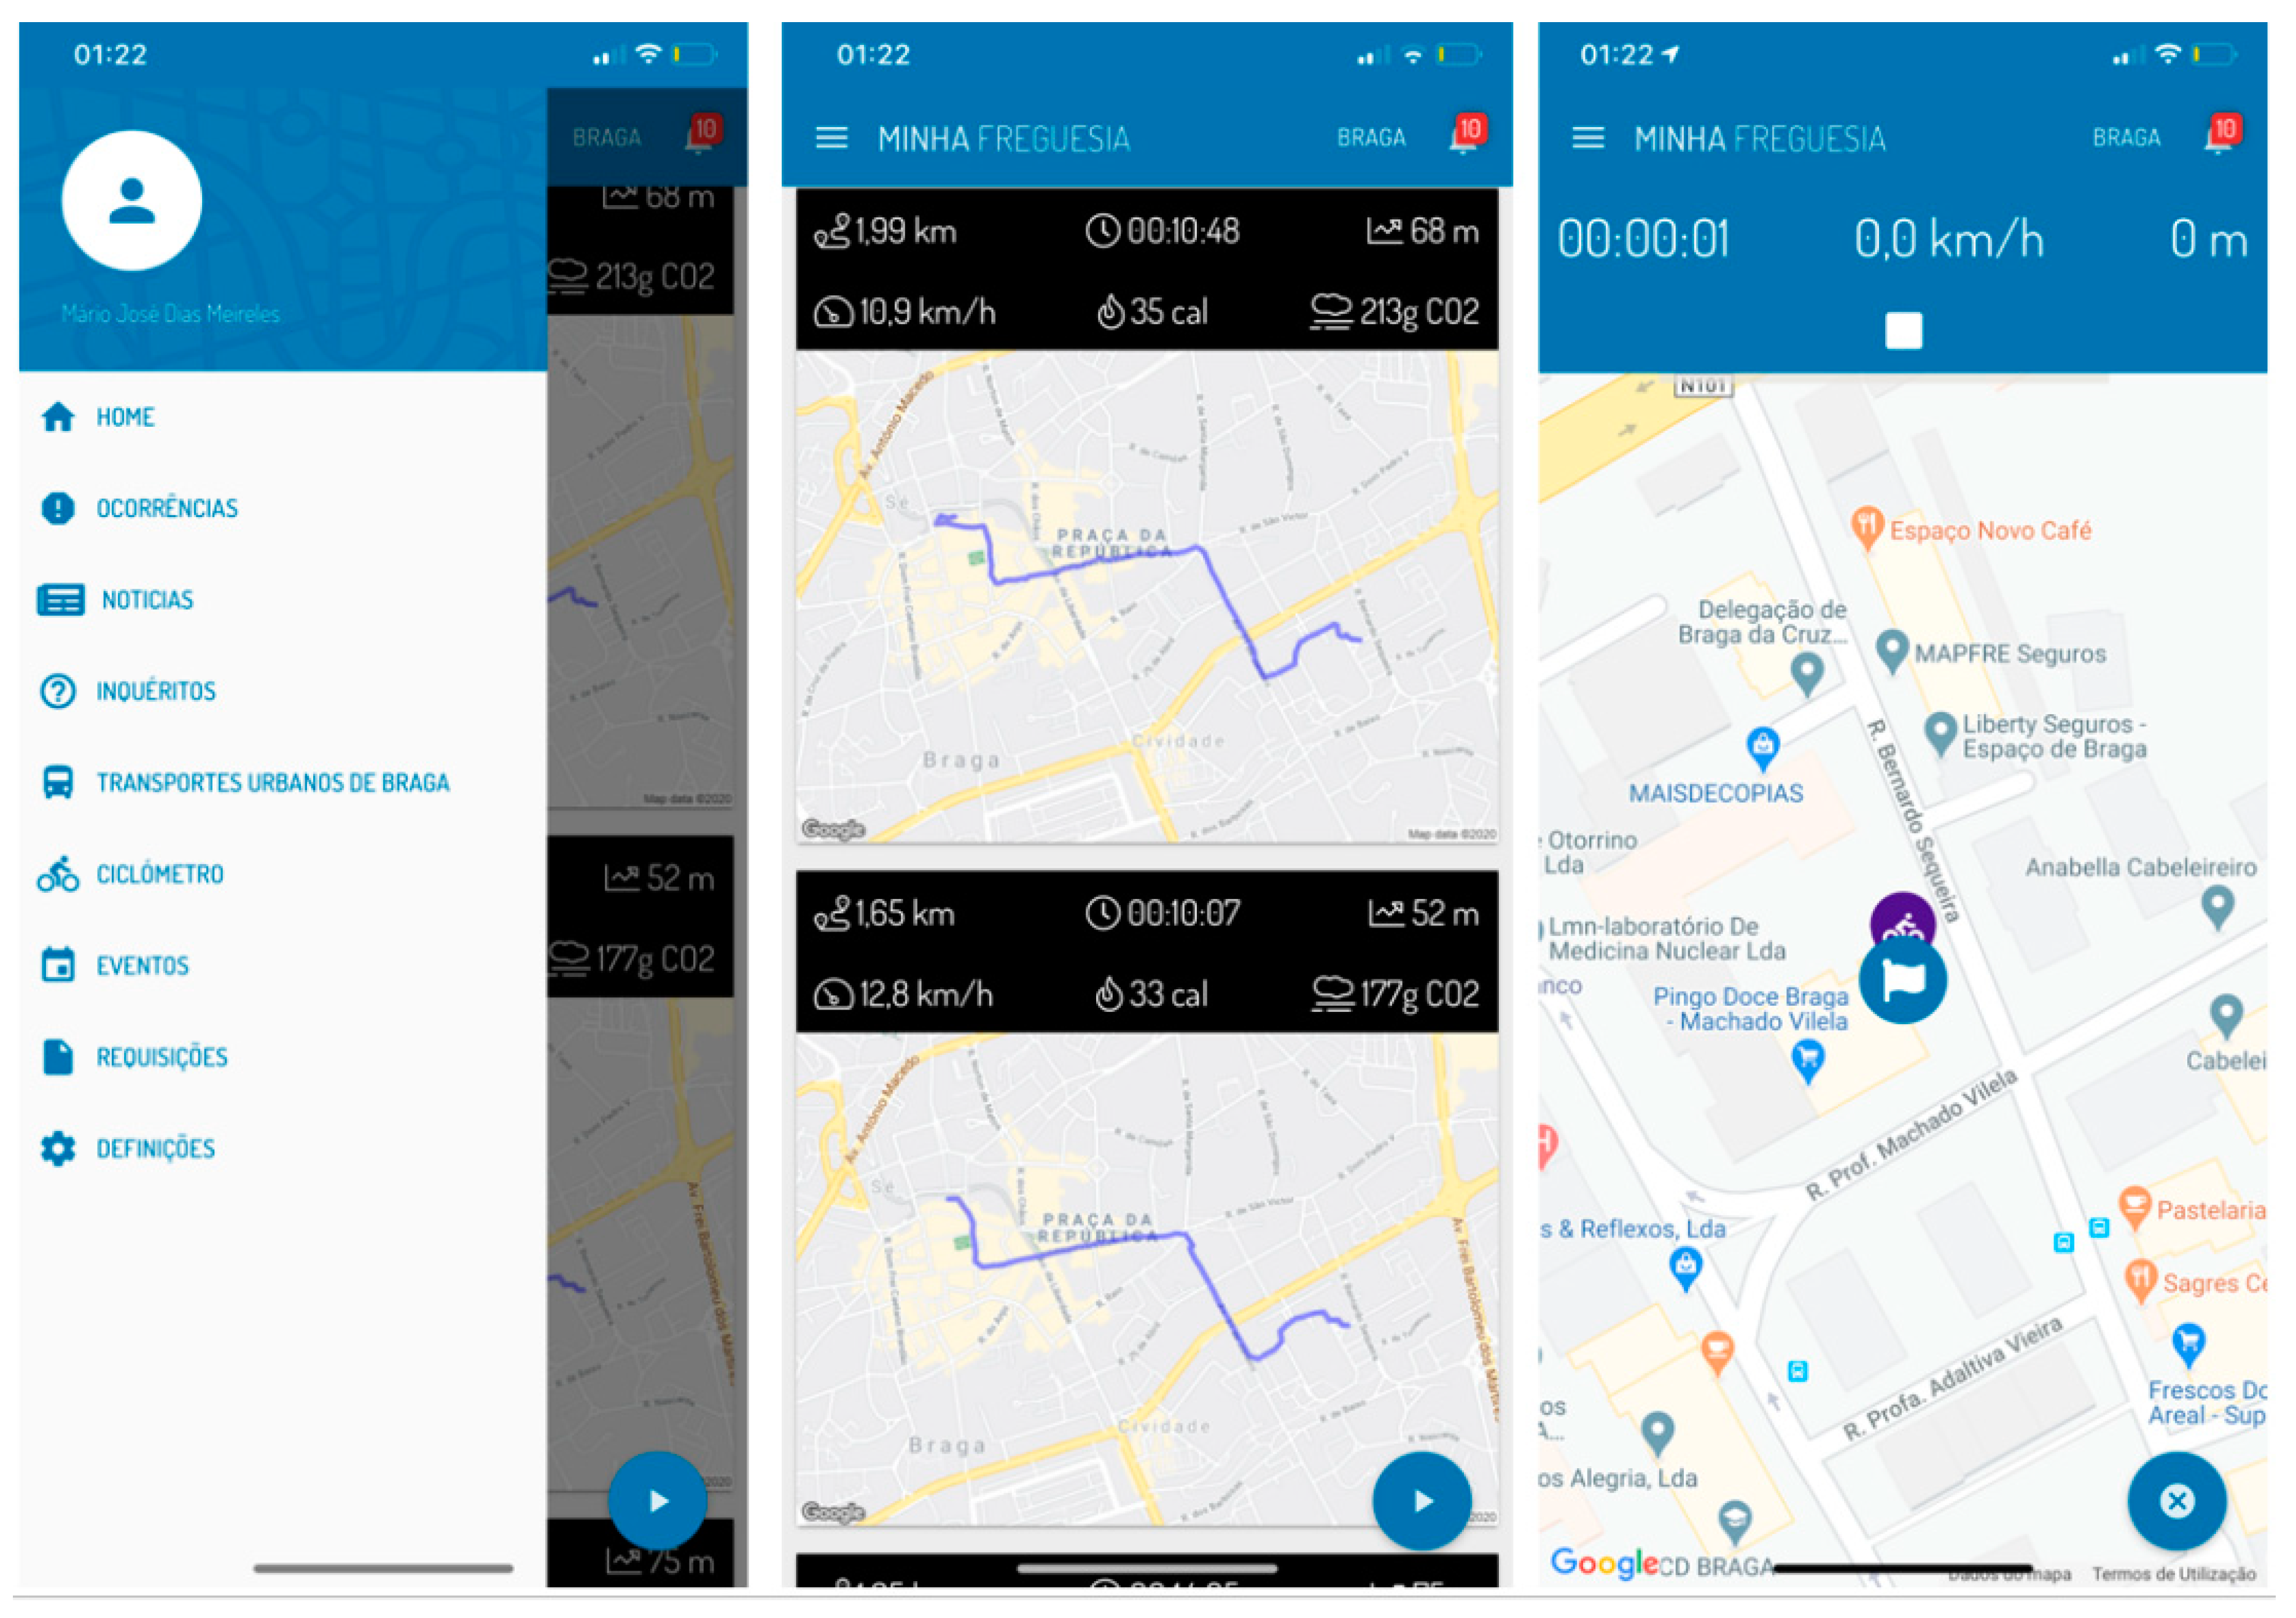
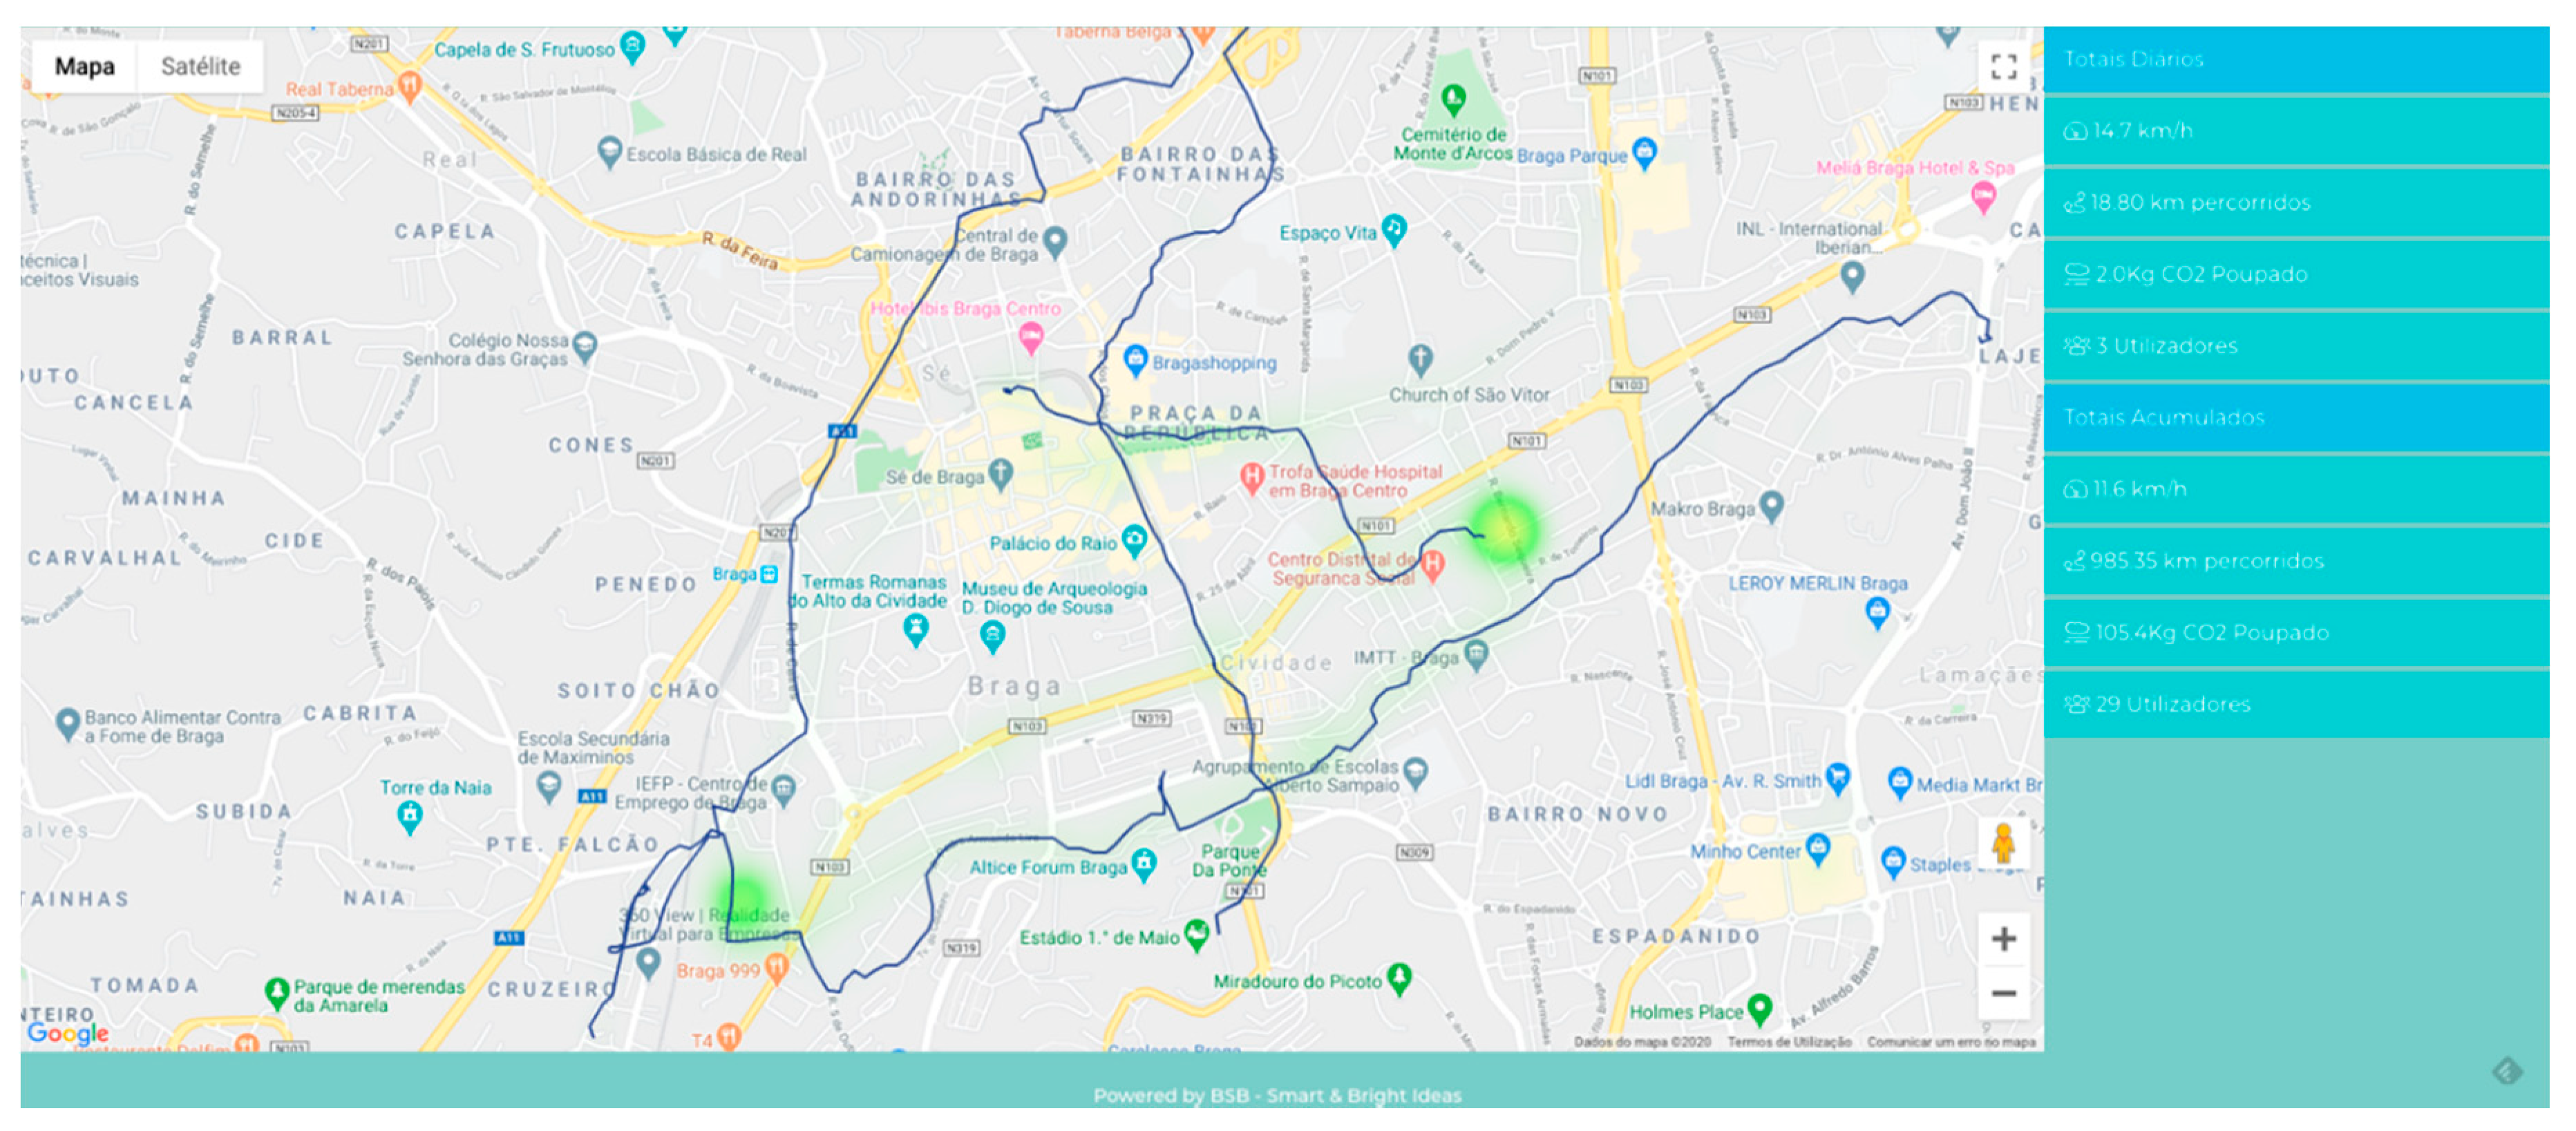
Based on these results and on behalf of this research project, we developed a prototype of a cycling application and a digital platform. Its layout is shown
Figure 5 and
Figure 6. This digital solution mobile application is now in a pre-test phase, i.e., in the experimentation phase, and it has been used by 29 people in order to solve some problems that could be detected when using the app.
The application will be tested during the next year to gather robust (quantity and quality) results that should allow us to confirm whether a digital solution based on a cycling mobile platform and app can or cannot influence a non-regular cyclist to become a regular cyclist and a non-cyclist to become a non-regular or even a regular cyclist since he or she could be more easily accustomed to cycling in the starter cycling city of Braga.
The Digital Platform (layout presented in
Figure 6) is one of the ways to see the routes that cyclists using the application are effectively taking, and this will be useful for the local transport and planning authorities to analyze cyclists’ behaviors, needs, and expectations to better adequate their policies and strategies to promote cycling in Braga.
5. Conclusions
This research focused on the development of a digital tool to support and increase cycling in a starter cycling city. According to the literature, cycling can be mostly promoted through adequate infrastructures, by connecting them with other means of transport in a multimodality approach, and through changes in cycling behavior, namely by using digital solutions that can be integrated into future mobility as a service (MaaS) solutions for cities.
With this in mind, we developed a case study on the Portuguese city of Braga, since the local government had assumed the need to improve cycling for the promotion of more sustainable mobility, by creating, in a first phase, 22 km of cycling paths in the city (76 km are planned). However, they have not yet made any effort to develop digital solutions to increase cycling, despite having already demonstrated, as a local transport authority, that this will be their next step.
In this context, it was concluded that neither the city of Braga nor any other medium-sized Portuguese city have any type of digital solution to promote cycling. This is a gap that this work addressed by developing a methodology that can be replicated in any other mid-sized starter cycling city in Portugal and around the world.
It is also important to highlight that Portugal has recently adopted an active position in promoting cycling all over the country, but especially in cities, by creating a National Strategy to Active Mobility—Cycling, which sets the goal of increasing bicycle mode share to 10% in Portuguese cities [
29]. In this particular context, this work presented a methodology to create a digital cycling platform and mobile application that would lead non-regular cyclists to adopt the bicycle as the main means of transport on a daily basis, especially in mid-sized starter cycling cities.
The case study was the starter cycling city of Braga, consisting of a characterization of the city’s cycling system in terms of the existing physical and digital infrastructures and on the evaluation of the potential influence that a proper mobile app for cycling could have, based on a survey of the city’s cyclists. Therefore, it is important to emphasize that it is not easy to work in a territory where the data related to mobility is outdated. Everything becomes even more complicated when the numbers from the existing studies do not match because the survey questions were different. Without mobility and mode share numbers, it is necessary to put a lot of effort into knowing the case study’s “population”, i.e., the number of cyclists in Braga.
Thus, one of the weaknesses that can be pointed out in this work is the need to compare cyclists and non-cyclists. However, there are a lot of studies about non-cyclists and even in Portugal, a recent study from the city of Lisbon made this comparison between cyclists and non-cyclists to increase cycling in the city [
20]. According to this study, the barriers identified by non-cyclists to engage in the activity are related to the idea that riding a bicycle with traffic is not safe, the distances they have to travel require too much effort, the city being too hilly, and the lack of a safe, secure and suitable bicycle network. These barriers could also be perceived as default by non-cyclists from all the Portuguese cities.
Therefore, this work did not include non-cyclists since even if they could make relevant contributions to understand the main issues and obstacles for them not using a bicycle, they would not have the same perception about the reality of cycling in a starter cycling city. Besides, there is a high probability that a non-cyclist will not know what the existing cycling applications and platforms are and will evaluate their suitability to the type of cycling they practice.
Thus, the aim of the methodology was to develop a digital solution that could lead to an increase in cycling in the starter cycling city of Braga. Also, this was based on the survey applied to people that already use bicycles in the city of Braga in order to assess the local characteristics of cyclists and cycling, as well as the relevance of using a mobile application in the promotion and increase of bicycle usage in urban travels. The survey focused on cyclists who are more familiar with cycling in the context of low modal representation, especially in relation to motorized traffic. Beyond that, the reasoning behind the choice of the survey’s sample was to encourage non-regular cyclists, namely the ones that cycle for sport or leisure purposes, to use the bicycle more regularly. The group of cyclists represent around 50% of all types of cyclists in the starter cycling city of Braga, and their shift to a more regular use can also have a strong influence on others, especially non-cyclists, to use bicycles, therefore leading by example.
In this sense, this work will contribute to the literature in terms of characterizing the Portuguese reality of mid-sized city cyclists, as an example of cyclists from a South European city, and also to define what an application designed to boost the regular bicycle usage should have, since Braga is a medium-sized starter cycling city that could be seen as a model to many other cities in Portugal.
In terms of the digital cycling infrastructures of Braga, the survey respondents gave more relevance to an app when they were using the bicycle as a way of exercise (3.69 points in 5) and gave the same score when they were using the bicycle as a means of transport or for leisure (3.47 points in 5).
The existence of a map, the travelled distance, the time travelled, the reduction in CO2 emissions compared to that of an automobile, the average speed, the comparison between means of transport, and the calories burned are the most important characteristics for the respondents, in this order. Most respondents use Strava (38.55%) to track their daily bicycle trips. Google Maps was used by 50.55% of the respondents, but this app does not offer a tracking feature. Only 22.91% did not use any application.
As mentioned in this state of the art research, we find that Strava is, in fact, the most widely used mobile app, but we also have Bike Citizens as a wider platform, which allows not only users to track their activities, but also allows planners to use real information to make more informed decisions. Interestingly, no respondents mentioned things like improved application battery performance as a need to take into account when developing new applications.
Although respondents felt that a digital platform was useful for all trips, respondents were divided when they answered whether a platform could lead to more people using bicycles as their main means of transport. In other research, we have seen authors who indicate this possibility. We know that the existing infrastructure in cities is a decisive factor in attracting and increasing bicycle users. In the case of Braga, the lack of adequate bicycle infrastructure and being a car-centric city makes the population afraid of walking and cycling in the city. This may be one of the factors for the difference in answers: a digital platform may not be enough in Braga. However, we know that more than half of the cyclists (55.64%) said that a cycling application could be a way to influence the adoption of the bicycle as a means of transport. But when we break down the answers by the type of cyclists, 60.6% of the non-regular cyclists from Braga considered that an application could lead to more people using bicycles as a means of transport.
If 60.6% of the non-regular cyclists start using a smartphone application that “converts” them into regular-cyclists, the number of people using bicycles regularly will increase. Thus, the applications is not enough to influence a relevant number of people to use the bicycle just by itself, but it can increase the regular use of bicycles among cyclists. Moreover, in cities with very low levels of bicycle use as a regular means of transport, apps can have a big impact and create new dynamics in the city’s mobility, creating a more eco-friendly social environment, boosting the local economy, and forcing political decisions that favor the use of bicycles.
In terms of existing and new features that an application should have, the non-cyclists will never give the same contribution that the cyclists gave for this work because the cyclists are familiarized with some applications and with the problems and opportunities that they might face on the city’s streets. Besides that, the barriers that non-cyclists have to pass until they use a bicycle regularly are bigger than the barriers that a non-regular cyclist has to pass to use a bicycle to commute regularly in the city.
Regarding what can be added to a cycling application or platform, the answer turned out to be a compilation of the work already produced, and their integration into a single platform. The platform/tool “Bike Citizens” does not allow people to report problems, and this was something that was noticed as an issue. It seems that BSB’s “Minha Freguesia” platform could be a good alternative engine that suppresses this flaw, encourages cycling, and integrates various aspects of the city, with mobility being one of them. That way, we received contributions to develop the platform and application “Minha Freguesia” so that it can contribute to the population adopting the bicycle as a means of transport. This mobile (smartphone) application is already integrated with other mobility services, so we defend that cycling can also be integrated in order to make the application even more efficient. It is not yet a MaaS—Mobility as a Service because the systems are not yet integrated, but the path that the city is currently taking is towards the integration of mobility systems.
Among cyclists, there are more who think that a smartphone application can encourage the use of bicycle among those who use it for sport or leisure (60.6%) than among those who are using it to commute (51%). It is probable that a smartphone application can lead to having more people riding a bicycle frequently. This can be true not only for Braga, but for all the places where people are using the bicycle only for sport/leisure.
If cyclists seem to think that an application can result in more people riding bicycles on a daily basis, and here we can assume that more cyclists turn into commuters, then it is also important to know if non-cyclists in Braga think that an app can change their behavior and make them use bicycles on a daily basis. This is work that could and should be done in the future.
Here resides the originality of this work because from the theoretical framework, we know that in the studies that approach cyclists and non-cyclists’ barriers, the relevance given to smartphone applications is either null or irrelevant, even in Lisbon, which is also a Starter Cycling City. However, in our survey, conducted in another Portuguese Starter Cycling City, Braga, we can see that the application has relevance for cyclists in terms of enlarging the regular use of bicycles.
These results are only part of a larger discussion because in Portugal, the increment of bicycle usage is considered a national purpose. The National Strategy to Active Mobility—Cycling has the goal to increment bicycle use to the European average numbers: 7.5%. To achieve that, there are plans to finance infrastructure, but also plans to finance other programs that can expand the use of bicycles. Thus, cycling can be scaled on a national level and, regarding these results, a smartphone application can play an important role in achieving these goals.
For now, it is necessary to continue improving and testing the platform to see whether or not it raises awareness in cyclists to use bicyles as a means of transport. Considering the critical period of climate changes that we are experiencing, we need to take a step back and observe the way that we move within cities. It is not surprising that there are some concerns from the local and national governments towards promoting the use of bicycle in cities. Thus, new policies need to be implemented in order to increase the number of cyclists. A city mobility application that considers cycling can help revise some policies, not only with the implementation of the app, but in its complementarity with other measures.


