Recognition of Landscape Key Areas in a Coal Mine Area of a Semi-Arid Steppe in China: A Case Study of Yimin Open-Pit Coal Mine


Abstract
:1. Introduction
2. Material and Methods
2.1. Study Area
2.2. Data Collection
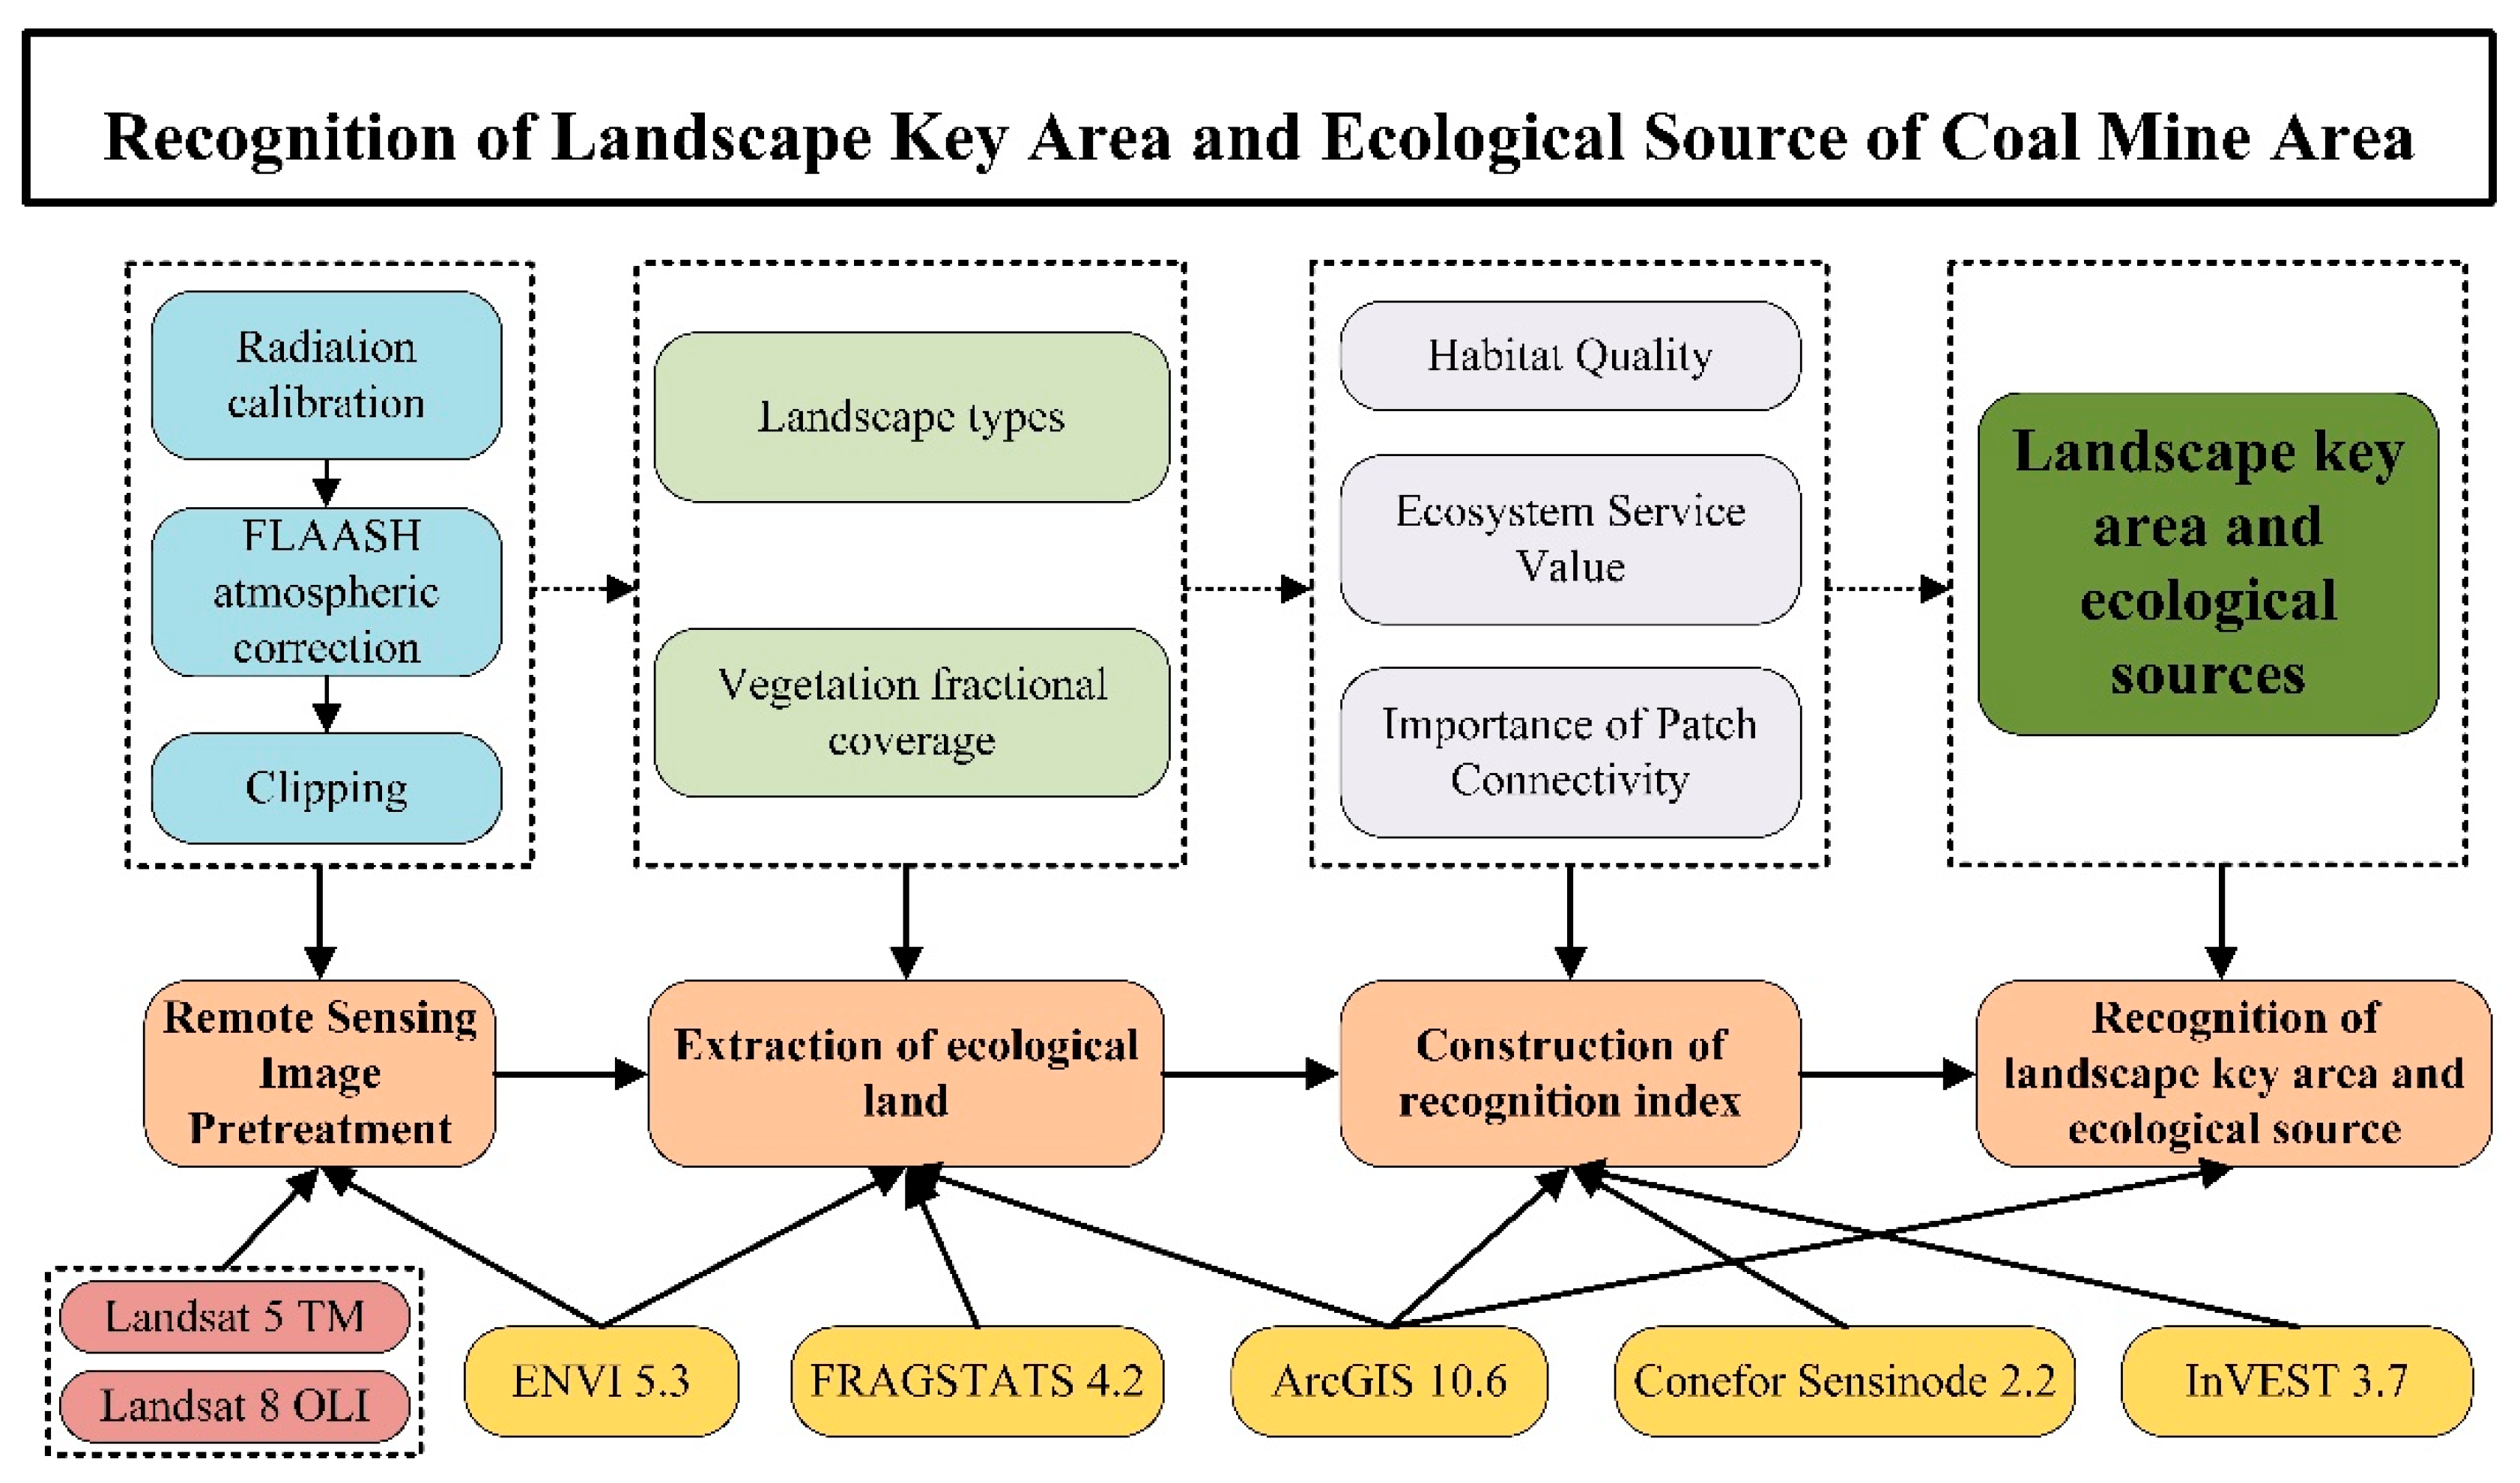
2.3. Data Processing
2.4. Data Analysis
2.4.1. Recognition and Extraction of Ecological Land
(1) Recognition of Landscape Types
(2) Calculation of Vegetation Fractional Coverage
(3) Extraction of Ecological Land
2.4.2. Construction of Ecological Landscape Key Area Recognition Index Model
(1) Assessment of Habitat Quality (HQ)
(2) Assessment of Ecosystem Service Value (ESV)
(3) Assessment of Importance of Patch Connectivity (IPC)
(4) Recognition Landscape Key Area and Ecological Source
3. Results
3.1. Ecological Land
(1) Landscape Classification
(2) Vegetation Fractional Coverage
(3) Ecological Land
3.2. Construction of Ecological Landscape Key Area Recognition Index Model
3.2.1. Habitat Quality
3.2.2. Ecosystem Service Value
3.2.3. Importance of Patch Connectivity
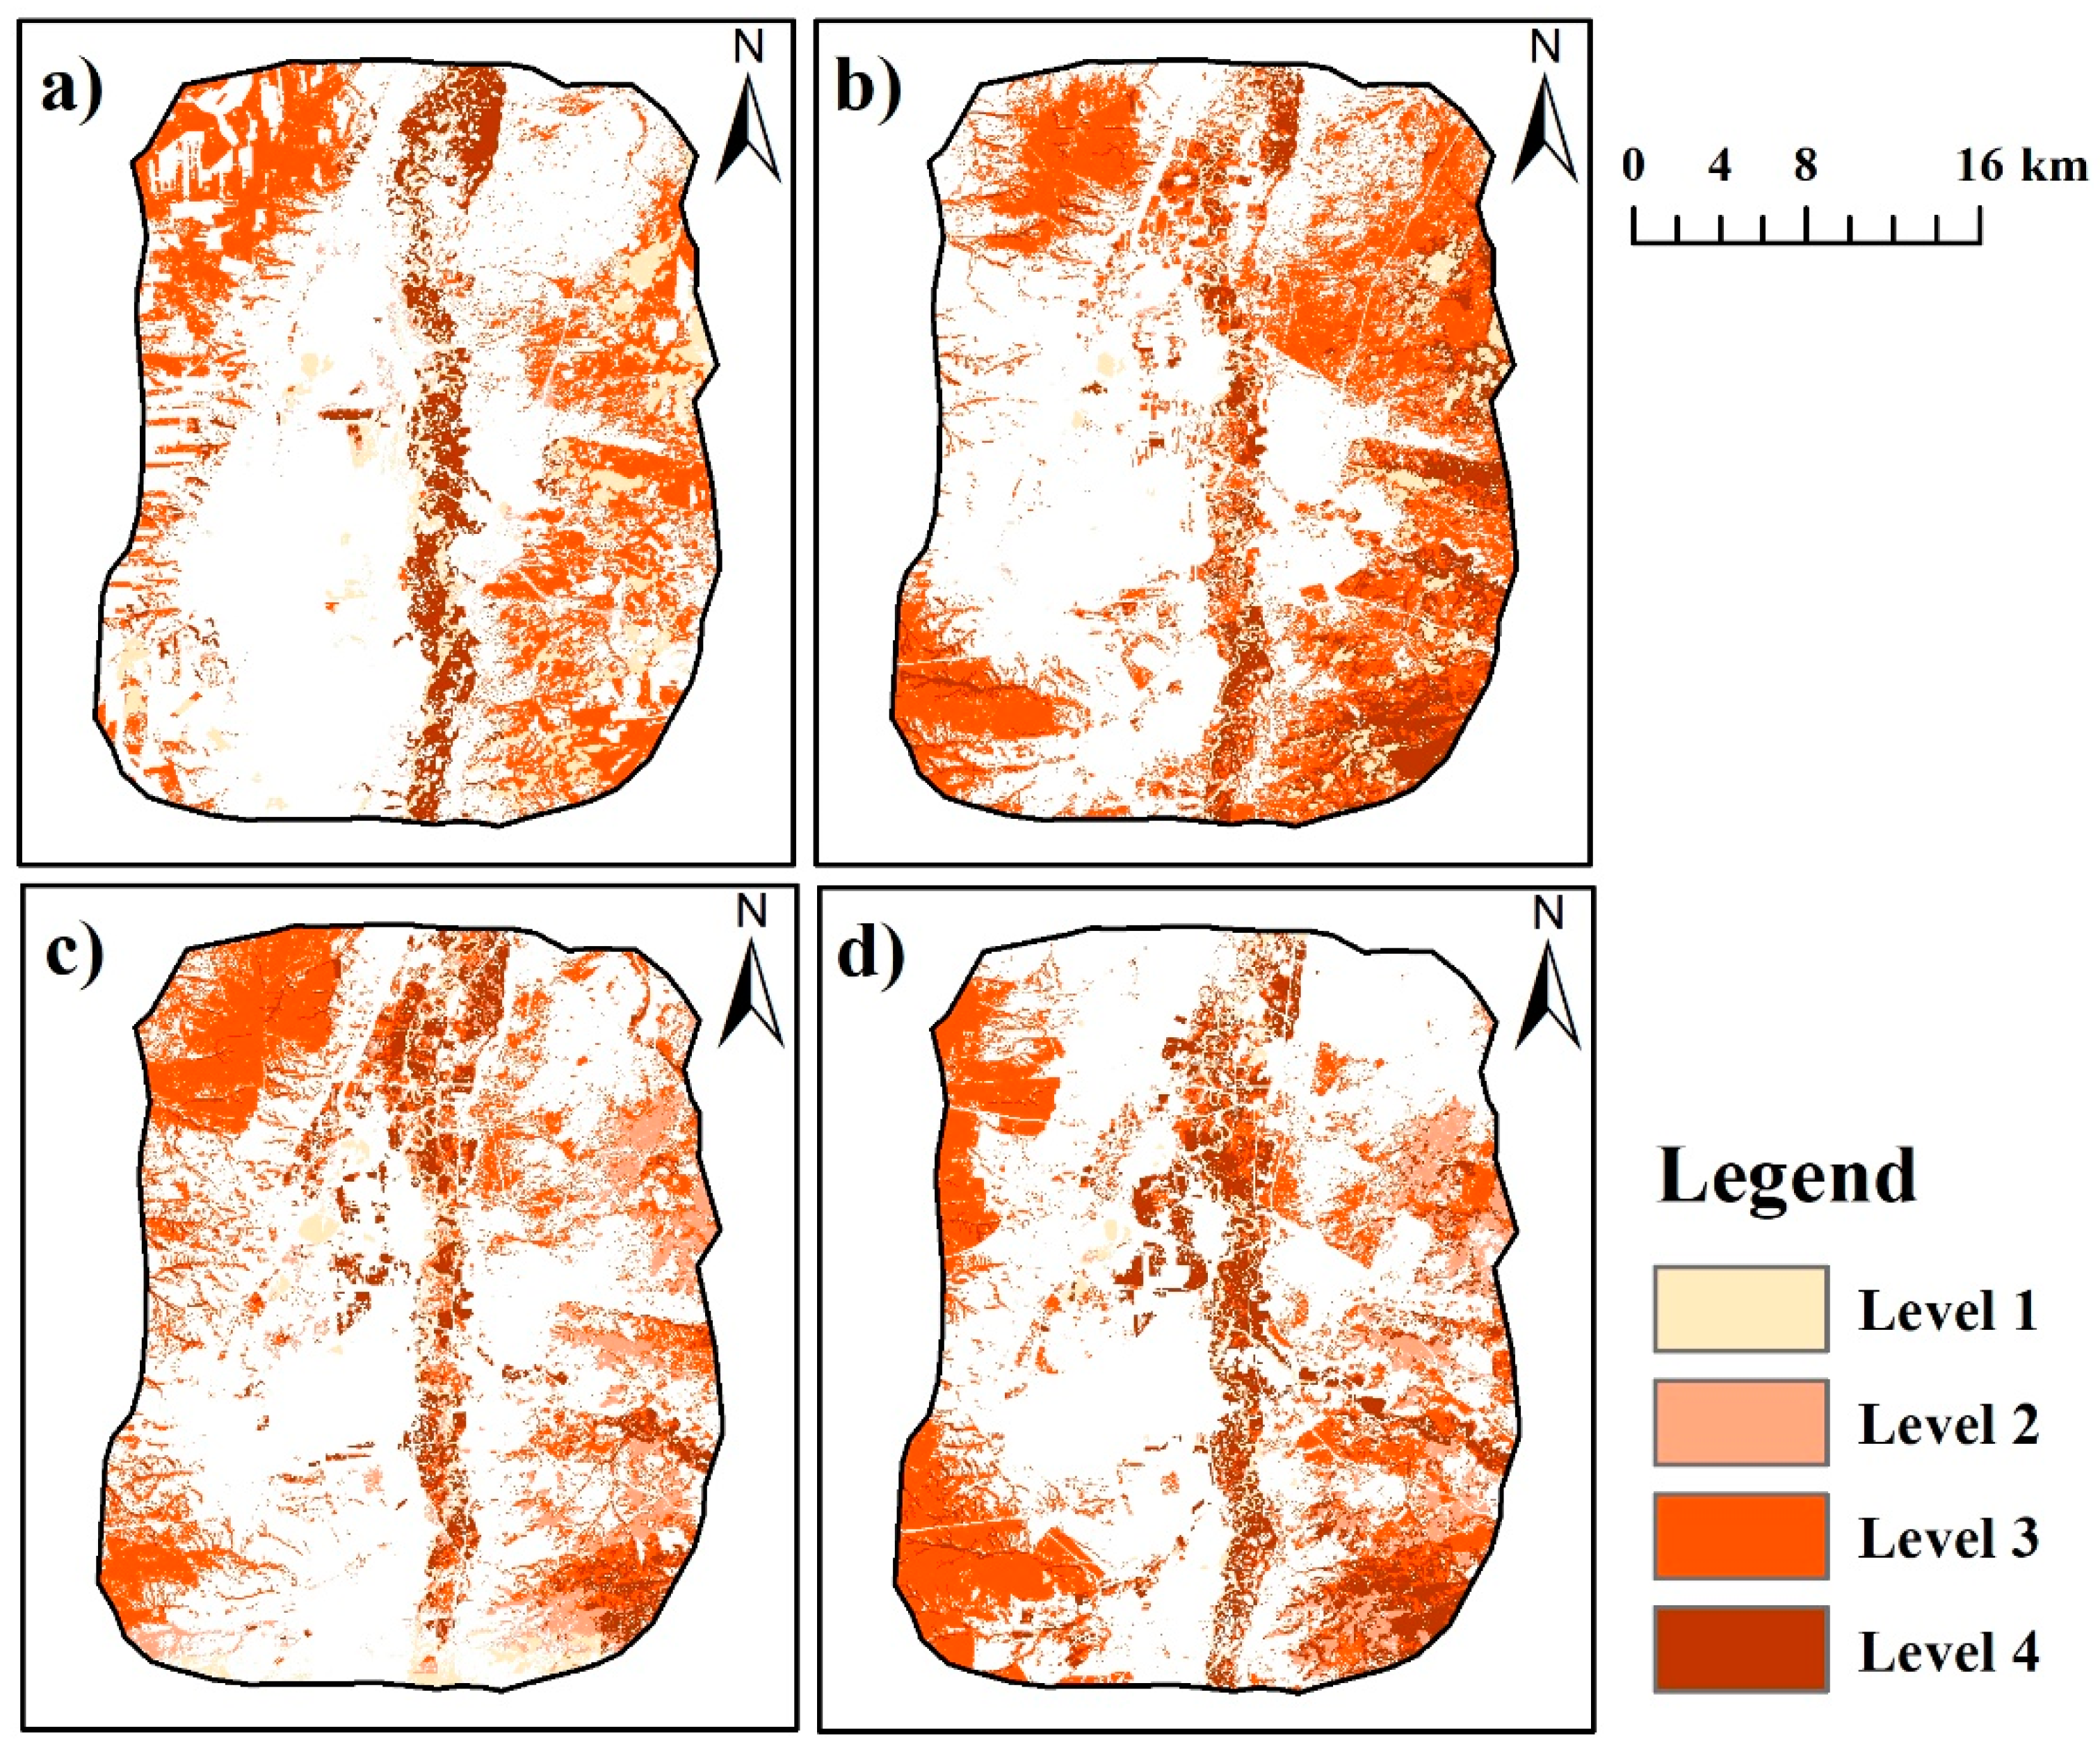
3.3. Recognition of Landscape Key Areas
4. Discussion
4.1. Analyzation of Results for Recognition of Ecological Landscape Key Area
4.2. Advantages of the Ecological Landscape Key Area Recognition Index Model
4.3. Suggestions and Research Prospects of Recognition for Ecological Landscape Key Area
5. Conclusions
Author Contributions
Funding
Acknowledgments
Conflicts of Interest
References
- Wang, W.; Hao, W.; Bian, Z.; Lei, S.; Wang, X.; Sang, S.; Xu, S. Effect of coal mining activities on the environment of Tetraena mongolica in Wuhai, Inner Mongolia, China—A geochemical perspective. Int. J. Coal Geol. 2014, 132, 94–102. [Google Scholar] [CrossRef]
- Miao, Z.; Marrs, R. Ecological restoration and land reclamation in open-cast mines in Shanxi Province, China. J. Environ. Manag. 2000, 59, 205–215. [Google Scholar] [CrossRef]
- Demirel, N.; Emil, M.K.; Duzgun, H.S. Surface coal mine area monitoring using multi-temporal high-resolution satellite imagery. Int. J. Coal Geol. 2011, 86, 3–11. [Google Scholar] [CrossRef]
- Erener, A. Remote sensing of vegetation health for reclaimed areas of Seyitömer open cast coal mine. Int. J. Coal Geol. 2011, 86, 20–26. [Google Scholar] [CrossRef]
- Bian, Z.; Lei, S.; Inyang, H.I.; Chang, L.; Zhang, R.; Zhou, C.; He, X. Integrated method of RS and GPR for monitoring the changes in the soil moisture and groundwater environment due to underground coal mining. Environ. Geol. 2009, 57, 131–142. [Google Scholar] [CrossRef]
- Lei, S.; Ren, L.; Bian, Z. Time-space characterization of vegetation in a semiarid mining area using empirical orthogonal function decomposition of MODIS NDVI time series. Environ. Earth Sci. 2016, 75, 516. [Google Scholar] [CrossRef]
- Bohrer, S.L.; Limb, R.F.; Daigh, A.L.; Volk, J.M.; Wick, A.F. Fine and Coarse-Scale Patterns of Vegetation Diversity on Reclaimed Surface Mine-land Over a 40-Year Chronosequence. Environ. Manag. 2017, 59, 431–439. [Google Scholar] [CrossRef]
- Józefowska, A.; Pietrzykowski, M.; Woś, B.; Cajthaml, T.; Frouz, J. The effects of tree species and substrate on carbon sequestration and chemical and biological properties in reforested post-mining soils. Geoderma 2017, 292, 9–16. [Google Scholar] [CrossRef]
- Ahirwal, J.; Maiti, S.K. Development of Technosol properties and recovery of carbon stock after 16 years of revegetation on coal mine degraded lands, India. Catena 2018, 166, 114–123. [Google Scholar] [CrossRef]
- Larondelle, N.; Haase, D. Valuing post-mining landscapes using an ecosystem services approach—An example from Germany. Ecol. Indic. 2012, 18, 567–574. [Google Scholar] [CrossRef]
- Bian, Z.; Lu, Q. Ecological effects analysis of land use change in coal mining area based on ecosystem service valuing: A case study in Jiawang. Environ. Earth Sci. 2013, 68, 1619–1630. [Google Scholar] [CrossRef]
- Kobayashi, H.; Watando, H.; Kakimoto, M. A global extent site-level analysis of land cover and protected area overlap with mining activities as an indicator of biodiversity pressure. J. Clean. Prod. 2014, 84, 459–468. [Google Scholar] [CrossRef] [Green Version]
- Cao, Y.; Zhou, W.; Wang, J.; Yuan, C. Spatial-temporal Pattern and Differences of Land Use Changes in the Three Gorges Reservoir Area of China during 1975–2005. J. Mt. Sci. 2011, 8, 551–563. [Google Scholar] [CrossRef]
- Qian, D.; Yan, C.; Xing, Z. Monitoring coal mine changes and their impact on landscape patterns in an alpine region: A case study of the Muli coal mine in the Qinghai-Tibet Plateau. Environ. Monit. Assess. 2017, 11, 559. [Google Scholar] [CrossRef] [PubMed]
- Yu, L.; García, A.; Chivas, A.R.; Tibby, J.; Kobayashi, T.; Haynes, D. Ecological change in fragile floodplain wetland ecosystems, natural vs human influence: The Macquarie Marshes of eastern Australia. Aquat. Bot. 2015, 120, 39–50. [Google Scholar] [CrossRef]
- Cao, Y.; Bai, Z.; Zhou, W.; Zhang, X. Characteristic analysis and pattern evolution on landscape types in typical compound area of mine agriculture urban in Shanxi Province, China. Environ. Earth Sci. 2016, 75, 1–15. [Google Scholar] [CrossRef]
- Zhao, B.; Guo, D.; Shao, H.; Bai, Z. Investigating the population structure and spatial pattern of restored forests in an opencast coal mine, China. Environ. Earth Sci. 2017, 20, 679. [Google Scholar] [CrossRef]
- Doley, D.; Audet, P.; Mulligan, D.R. Examining the Australian context for post-mined land rehabilitation: Reconciling a paradigm for the development of natural and novel ecosystems among post-disturbance landscapes. Agric. Ecosyst. Environ. 2012, 163, 85–93. [Google Scholar] [CrossRef]
- Mwitwa, J.; German, L.; Muimba-Kankolongo, A.; Puntodewo, A. Governance and sustainability challenges in landscapes shaped by mining: Mining-forestry linkages and impacts in the Copper Belt of Zambia and the DR Congo. For. Policy Econ. 2012, 25, 19–30. [Google Scholar] [CrossRef]
- Wu, Q.; Pang, J.; Qi, S.; Li, Y.; Han, C.; Liu, T.; Huang, L. Impacts of coal mining subsidence on the surface landscape in Longkou city, Shandong Province of China. Environ. Earth Sci. 2009, 59, 783–791. [Google Scholar]
- Hüttl, R.F.; Gerwin, W. Landscape and ecosystem development after disturbance by mining. Ecol. Eng. 2005, 24, 1–3. [Google Scholar] [CrossRef]
- Biemelt, D.; Schapp, A.; Grünewald, U. Hydrological observation and modelling relationship for the determination of water budget in Lusatian post-mining landscape. Phys. Chem. Earth Parts A/B/C 2011, 36, 3–18. [Google Scholar] [CrossRef]
- Skaloš, J.; Kašparová, I. Landscape memory and landscape change in relation to mining. Ecol. Eng. 2012, 43, 60–69. [Google Scholar] [CrossRef]
- Misthos, L.; Messaris, G.; Damigos, D.; Menegaki, M. Exploring the perceived intrusion of mining into the landscape using the fuzzy cognitive mapping approach. Ecol. Eng. 2017, 101, 60–74. [Google Scholar] [CrossRef]
- Du, S.; Xiong, Z.; Wang, Y.; Guo, L. Quantifying the multilevel effects of landscape composition and configuration on land surface temperature. Remote Sens. Environ. 2016, 178, 84–92. [Google Scholar] [CrossRef]
- Yang, Y.; Erskine, P.D.; Lechner, A.M.; Mulligan, D.; Zhang, S.; Wang, Z. Detecting the dynamics of vegetation disturbance and recovery in surface mining area via Landsat imagery and LandTrendr algorithm. J. Clean. Prod. 2018, 178, 353–362. [Google Scholar] [CrossRef]
- Estoque, R.C.; Murayama, Y.; Myint, S.W. Effects of landscape composition and pattern on land surface temperature: An urban heat island study in the megacities of Southeast Asia. Sci. Total Environ. 2017, 577, 349–359. [Google Scholar] [CrossRef]
- Dulias, R. Landscape planning in areas of sand extraction in the Silesian Upland, Poland. Landsc. Urban Plan. 2010, 95, 91–104. [Google Scholar] [CrossRef]
- Adriaensen, F.; Chardon, J.P.; De Blust, G.; Swinnen, E.; Villalba, S.; Gulinck, H.; Matthysen, E. The application of ’least-cost’ modelling as a functional landscape model. Landsc. Urban Plan. 2003, 64, 233–247. [Google Scholar] [CrossRef]
- Gangloff, M.M.; Perkins, M.; Blum, P.W.; Walker, C. Effects of Coal Mining, Forestry, and Road Construction on Southern Appalachian Stream Invertebrates and Habitats. Environ. Manag. 2015, 55, 702–714. [Google Scholar] [CrossRef]
- Bayliss, J.L.; Simonite, V.; Thompson, S. The use of probabilistic habitat suitability models for biodiversity action planning. Agric. Ecosyst. Environ. 2005, 108, 228–250. [Google Scholar] [CrossRef]
- Costanza, R.; D’Arge, R.; Groot, R.; Farber, S.; Grasso, M.; Hannon, B.; Limburg, K.; Naeem, S.; O’Neill, R.V.; Paruelo, J.; et al. The value of the world’s ecosystem services and natural capital. Ecol. Econ. 1997, 25, 3–15. [Google Scholar] [CrossRef]
- Xiang, Y.; Meng, J.; You, N.; Chen, P.; Yang, H. Spatio-temporal Analysis of Anthropogenic Disturbances on Landscape Pattern of Tourist Destinations: A case study in the Li River Basin, China. Sci. Rep. 2019, 9, 19285. [Google Scholar] [CrossRef]
- Daniela, R.; Marco, V. Land use and landscape pattern changes driven by land reclamation in a coastal area: The case of Volturno delta plain, Campania Region, southern Italy. Environ. Earth Sci. 2017, 76, 694. [Google Scholar] [CrossRef]
- Mi, J.; Yang, Y.; Zhang, S.; An, S.; Hou, H.; Hua, Y.; Chen, F. Tracking the Land Use/Land Cover Change in an Area with Underground Mining and Reforestation via Continuous Landsat Classification. Remote Sens. 2019, 11, 1719. [Google Scholar] [CrossRef] [Green Version]
- Duan, C.; Wu, L.; He, L.; Wang, S. Spatio-temporal distribution pattern of vegetation coverage in Junggar Basin, Xinjiang. Acta Ecol. Sin. 2016, 36, 72–76. [Google Scholar] [CrossRef]
- Lakes, T.; Müller, D.; Krüger, C. Cropland change in southern Romania: A comparison of logistic regressions and artificial neural networks. Landsc. Ecol. 2009, 9, 1195–1206. [Google Scholar] [CrossRef]
- Baeza, A.; Bouma, M.J.; Dobson, A.P.; Dhiman, R.; Srivastava, H.C.; Pascual, M. Climate forcing and desert malaria: The effect of irrigation. Malar. J. 2011, 10, 190. [Google Scholar] [CrossRef] [Green Version]
- Yan, H.; Zhan, J.; Liu, B.; Yuan, Y. Model Estimation of Water Use Efficiency for Soil Conservation in the Lower Heihe River Basin, Northwest China during 2000–2008. Sustainability 2014, 6, 6250–6266. [Google Scholar] [CrossRef] [Green Version]
- Peng, J.; Zhao, M.; Guo, X.; Pan, Y.; Liu, Y. Spatial-temporal dynamics and associated driving forces of urban ecological land: A case study in Shenzhen City, China. Habitat Int. 2017, 60, 81–90. [Google Scholar] [CrossRef]
- Wu, Z.; Lei, S.; He, B.; Bian, Z.; Wang, Y.; Lu, Q.; Peng, S.; Duo, L. Assessment of Landscape Ecological Health: A CaseStudy of a Mining City in a Semi-Arid Steppe. Int. J. Environ. Res. Public Health 2019, 16, 752. [Google Scholar] [CrossRef] [PubMed] [Green Version]
- Wang, Z.; Deng, X.; Song, W.; Li, Z.; Chen, J. What is the main cause of grassland degradation? A case study of grassland ecosystem service in the middle-south Inner Mongolia. Catena 2017, 150, 100–107. [Google Scholar] [CrossRef]
- Li, X.; Lu, L.; Cheng, G.; Xiao, H. Quantifying landscape structure of the Heihe River Basin, north-west China using FRAGSTATS. J. Arid Environ. 2001, 48, 521–535. [Google Scholar] [CrossRef]
- McGarigal, K.; Marks, B. FRAGSTATS: Spatial Pattern Analysis Program for Quantifying Landscape Structure Reference Manual; Forest Science Department Oregon State University: Corvallis, OR, USA, 1994; p. 62. [Google Scholar]
- Chu, L.; Sun, T.; Wang, T.; Li, Z.; Cai, C. Evolution and Prediction of Landscape Pattern and Habitat Quality Based on CA-Markov and InVEST Model in Hubei Section of Three Gorges Reservoir Area (TGRA). Sustainability 2018, 10, 3854. [Google Scholar] [CrossRef] [Green Version]
- Terrado, M.; Sabater, S.; Chaplin-Kramer, B.; Mandle, L.; Ziv, G.; Acuña, V. Model development for the assessment of terrestrial and aquatic habitat quality in conservation planning. Sci. Total Environ. 2016, 540, 63–70. [Google Scholar] [CrossRef] [PubMed] [Green Version]
- Seabrook, L.; McAlpine, C.; Rhodes, J.; Baxter, G.; Bradley, A.; Lunney, D. Determining range edges: Habitat quality, climate or climate extremes? Divers. Distrib. 2014, 20, 95–106. [Google Scholar] [CrossRef]
- Yang, Y.; Wang, K.; Liu, D.; Zhao, X.; Fan, J.; Li, J.; Zhai, X.; Zhang, C.; Zhan, R. Spatiotemporal Variation Characteristics of Ecosystem Service Losses in the Agro-Pastoral Ecotone of Northern China. Environ. Res. Public Health 2019, 16, 1199. [Google Scholar] [CrossRef] [PubMed] [Green Version]
- Xie, G.; Zhang, C.; Zhang, C.; Xiao, Y.; Lu, C. The value of ecosystem services in China. Resour. Sci. 2015, 37, 1740–1746. [Google Scholar]
- Zhang, M.; Zhou, Y.; Liu, X.; Lu, Z. Ecological landscape regulation approaches in Xilingol, Inner Mongolia: An urban ecosystem services perspective. Int. J. Sustain. Dev. World Ecol. 2017, 24, 401–407. [Google Scholar] [CrossRef]
- Qi, K.; Fan, Z.; Ng, N.C.; Wang, X.; Xie, Y. Functional analysis of landscape connectivity at the landscape, component, and patch levels: A case study of Minqing County, Fuzhou City, China. Appl. Geogr. 2017, 80, 64–77. [Google Scholar] [CrossRef]
- Blazquez-Cabrera, S.; Bodin, Ö.; Saura, S. Indicators of the impacts of habitat loss on connectivity and related conservation priorities: Do they change when habitat patches are defined at different scales? Ecol. Indic. 2014, 45, 704–716. [Google Scholar] [CrossRef]
- Saura, S.; Rubio, L. A common currency for the different ways in which patches and links can contribute to habitat availability and connectivity in the landscape. Ecography 2010, 33, 523–537. [Google Scholar] [CrossRef]
- Saura, S.; Torné, J. Conefor Sensinode 2.2: A software package for quantifying the importance of habitat patches for landscape connectivity. Environ. Model. Softw. 2009, 24, 135–139. [Google Scholar] [CrossRef]
- Yu, Q.; Yu, Y.; Yue, D.; Wang, J.; Zhang, Q.; Li, N.; Li, Y.; Chen, J. The optimization of urban ecological infrastructure network based on the changes of county landscape patterns: A typical case study of ecological fragile zone located at Deng Kou (Inner Mongolia). J. Clean. Prod. 2017, 163, S54–S67. [Google Scholar] [CrossRef]
- Novianti, V.; Marrs, R.H.; Choesin, D.N.; Iskandar, D.T.; Suprayogo, D. Natural regeneration on land degraded by coal mining in a tropical climate: Lessons for ecological restoration from Indonesia. Land Degrad. Dev. 2018, 29, 4050–4060. [Google Scholar] [CrossRef]
- Liu, M.; Dries, L.; Heijman, W.; Huang, J.; Zhu, X.; Hu, Y.; Chen, H. The Impact of Ecological Construction Programs on Grassland Conservation in Inner Mongolia, China. Land Degrad. Dev. 2018, 29, 326–336. [Google Scholar] [CrossRef] [Green Version]
- Chen, J.; John, R.; Zhang, Y.; Shao, C.; Brown, D.G.; Batkhishig, O.; Amarjargal, A.; Ouyang, Z.; Dong, G.; Wang, D.; et al. Divergences of Two Coupled Human and Natural Systems on the Mongolian Plateau. Bioscience 2015, 65, 559–570. [Google Scholar] [CrossRef] [Green Version]
- Lei, K.; Pan, H.; Lin, C. A landscape approach towards ecological restoration and sustainable development of mining areas. Ecol. Eng. 2016, 90, 320–325. [Google Scholar] [CrossRef]


| No | Data Source | Resolution | Date | Type |
|---|---|---|---|---|
| 1 | LT051230261999081001T1 | 30 m | 1999.08.10 | Landsat 5 TM |
| 2 | LT51230262006193BJC00 | 30 m | 2006.07.12 | Landsat 5 TM |
| 3 | LT051230262011081101T1 | 30 m | 2011.08.11 | Landsat 5 TM |
| 4 | LC081230262017081101T1 | 30 m | 2017.08.11 | Landsat 8 OLI |
| Threat | Maximum Effective Distance (km) | Weight | DECAY |
|---|---|---|---|
| Road | 1.0 | 0.5 | Linear |
| Built-up land | 2.0 | 0.7 | Exponential |
| Mining land | 3.0 | 1.0 | Exponential |
| Bare land | 1.0 | 0.8 | Linear |
| Landscape Type | Habitat | Bare Land | Construction Land | Mining Land | Road |
|---|---|---|---|---|---|
| Grassland | 0.8 | 0.5 | 0.7 | 0.6 | 0.4 |
| Shrub Land | 0.7 | 0.2 | 0.4 | 0.5 | 0.3 |
| Wetland | 0.9 | 0.4 | 0.5 | 0.6 | 0.4 |
| Water | 0.6 | 0.5 | 0.9 | 1.0 | 0.8 |
| Bare Land | 0.0 | 0.0 | 0.0 | 0.0 | 0.0 |
| 1999 | 2006 | 2011 | 2017 | |||||
|---|---|---|---|---|---|---|---|---|
| Area | Percentage | Area | Percentage | Area | Percentage | Area | Percentage | |
| Grassland | 627.25 | 70.78% | 641.57 | 72.39% | 692.07 | 78.09% | 531.10 | 59.93% |
| Shrubland | 43.53 | 4.91% | 27.73 | 3.13% | 59.19 | 6.68% | 36.13 | 4.08% |
| Wetland | 60.44 | 6.82% | 100.52 | 11.34% | 86.76 | 9.79% | 96.34 | 10.87% |
| Water | 8.98 | 1.01% | 6.83 | 0.77% | 13.76 | 1.55% | 13.13 | 1.48% |
| Mining land | 6.18 | 0.70% | 8.48 | 0.96% | 22.75 | 2.57% | 30.91 | 3.49% |
| Built-up land | 11.17 | 1.26% | 19.93 | 2.25% | 24.39 | 2.75% | 29.94 | 3.38% |
| Road | 7.13 | 0.80% | 9.81 | 1.11% | 21.07 | 2.38% | 23.78 | 2.68% |
| Bare land | 121.56 | 13.72% | 71.37 | 8.05% | 192.11 | 21.68% | 124.92 | 14.10% |
| 1999 | 2006 | 2011 | 2017 | |||||
|---|---|---|---|---|---|---|---|---|
| Area | Percentage | Area | Percentage | Area | Percentage | Area | Percentage | |
| 0–20% | 109.07 | 12.31% | 76.11 | 8.59% | 109.21 | 12.32% | 179.67 | 20.27% |
| 20–40% | 215.89 | 24.36% | 124.36 | 14.03% | 248.68 | 28.06% | 145.42 | 16.41% |
| 40–60% | 241.43 | 27.24% | 289.09 | 32.62% | 133.09 | 15.02% | 204.94 | 23.12% |
| 60–80% | 143.10 | 16.15% | 223.27 | 25.19% | 176.61 | 19.93% | 169.92 | 19.17% |
| 80–100% | 176.74 | 19.94% | 173.41 | 19.57% | 218.65 | 24.67% | 186.29 | 21.02% |
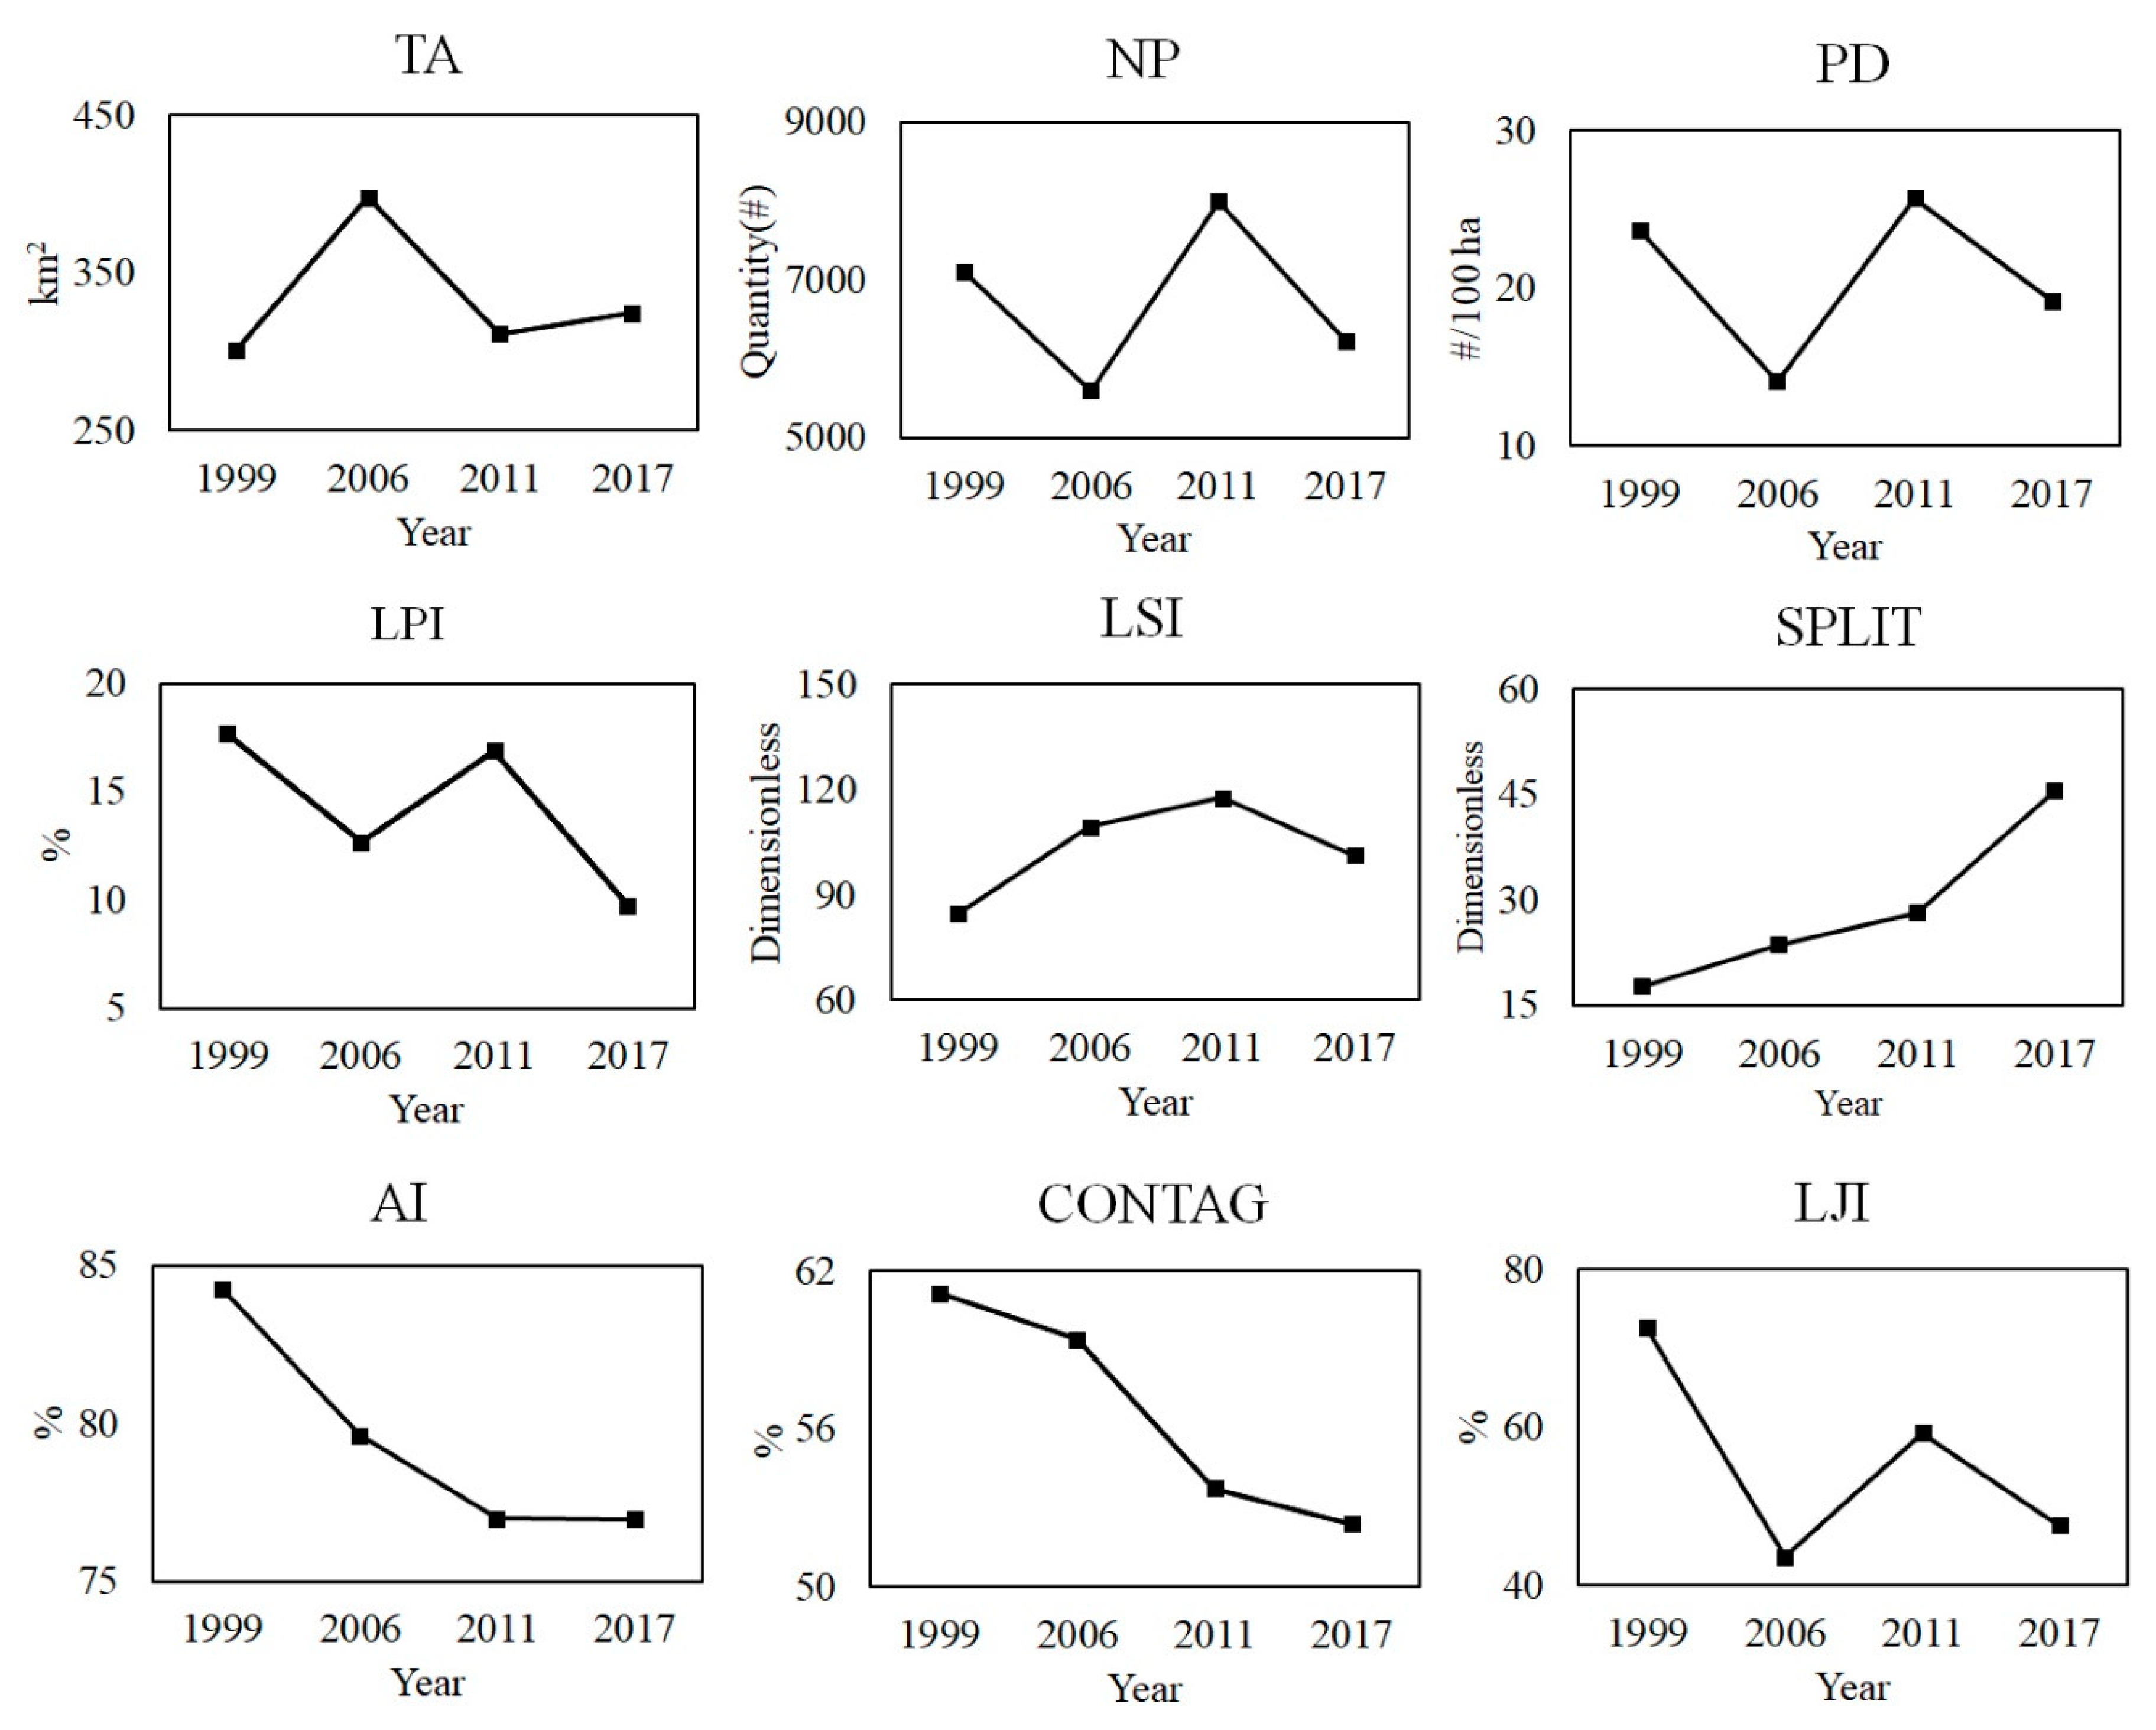
| Year | 1999 | 2006 | 2011 | 2017 |
|---|---|---|---|---|
| TA (km2) | 300.93 | 397.85 | 311.50 | 324.65 |
| NP (#) | 7110 | 5595 | 8001 | 6229 |
| PD (#/100 ha) | 23.63 | 14.06 | 25.69 | 19.19 |
| LPI (%) | 17.66 | 12.68 | 16.89 | 9.75 |
| LSI | 84.63 | 109.42 | 117.86 | 101.42 |
| SPLIT | 17.72 | 23.67 | 28.29 | 45.52 |
| AI (%) | 84.26 | 79.62 | 76.99 | 76.98 |
| CONTAG (%) | 61.17 | 59.40 | 53.75 | 52.41 |
| LJI (%) | 72.66 | 43.65 | 59.35 | 47.67 |
| 1999 | 2006 | 2011 | 2017 | |||||
|---|---|---|---|---|---|---|---|---|
| Area | Percentage | Area | Percentage | Area | Percentage | Area | Percentage | |
| Level 1 | 12.36 | 4.11% | 16.02 | 4.03% | 16.85 | 5.41% | 17.71 | 5.46% |
| Level 2 | 50.11 | 16.65% | 60.07 | 15.10% | 59.15 | 18.99% | 61.69 | 19.00% |
| Level 3 | 162.20 | 53.90% | 230.51 | 57.94% | 154.79 | 49.69% | 174.09 | 53.62% |
| Level 4 | 76.26 | 25.34% | 91.24 | 22.93% | 80.71 | 25.91% | 71.16 | 21.92% |
| Service Type | Indicators | Grassland | Wetland | Shrub-Land | Water | Built-Up Land | Mining Land | Bare Land |
|---|---|---|---|---|---|---|---|---|
| Supply | food supply | 400.16 | 71.14 | 65.21 | 10.60 | 0 | 0 | 1.05 |
| raw supply | 50.64 | 47.42 | 588.86 | 1.05 | 0 | 0 | 0 | |
| Regulation | atmospheric regulation | 93.33 | 476.23 | 853.65 | 0 | 0 | 0 | 0 |
| climate regulation | 95.38 | 2677.54 | 804.25 | 48.74 | 0 | 0 | 0 | |
| hydrological regulation | 1848.30 | 2655.80 | 808.20 | 2159.72 | −383.00 | −383.00 | 3.17 | |
| waste disposal | 2370.46 | 2845.50 | 339.88 | 1926.59 | 0 | −260.38 | 1.05 | |
| soil conservation | 123.83 | 393.23 | 794.37 | 1.05 | 0 | 0 | 2.12 | |
| Support | biodiversity | 120.78 | 729.16 | 891.19 | 263.88 | 0 | 0 | 36.03 |
| Cultural | landscape aesthetics | 284.87 | 926.76 | 411.02 | 459.92 | 0 | 0 | 1.05 |
| Sum | 5387.75 | 10822.77 | 5556.62 | 4871.55 | −383 | −643.38 | 44.47 | |
| 1999 | 2006 | 2011 | 2017 | |||||
|---|---|---|---|---|---|---|---|---|
| Area | Percentage | Area | Percentage | Area | Percentage | Area | Percentage | |
| Level 1 | 8.98 | 2.98% | 6.83 | 1.72% | 13.76 | 4.42% | 16.13 | 4.97% |
| Level 2 | 187.98 | 62.47% | 262.76 | 66.05% | 151.78 | 48.73% | 165.63 | 51.02% |
| Level 3 | 43.53 | 14.47% | 27.73 | 6.97% | 59.19 | 19.00% | 36.13 | 11.13% |
| Level 4 | 60.44 | 20.08% | 100.52 | 25.27% | 86.76 | 27.85% | 106.76 | 32.88% |
| 1999 | 2006 | 2011 | 2017 | |||||
|---|---|---|---|---|---|---|---|---|
| Area | Percentage | Area | Percentage | Area | Percentage | Area | Percentage | |
| Level 1 | 78.79 | 26.18% | 79.20 | 19.91% | 72.43 | 23.25% | 103.07 | 31.75% |
| Level 2 | 105.82 | 35.16% | 19.20 | 4.83% | 20.59 | 6.61% | 28.37 | 8.74% |
| Level 3 | 22.02 | 7.32% | 17.06 | 4.29% | 16.13 | 5.18% | 29.90 | 9.21% |
| Level 4 | 94.30 | 31.34% | 282.39 | 70.98% | 202.35 | 64.96% | 163.32 | 50.31% |
| 1999 | 2006 | 2011 | 2017 | |||||
|---|---|---|---|---|---|---|---|---|
| Area | Percentage | Area | Percentage | Area | Percentage | Area | Percentage | |
| Level 1 | 73.81 | 24.53% | 38.93 | 9.79% | 45.48 | 14.60% | 50.71 | 15.62% |
| Level 2 | 83.38 | 27.71% | 14.75 | 3.71% | 35.30 | 11.33% | 44.99 | 13.86% |
| Level 3 | 109.86 | 36.51% | 295.17 | 74.19% | 205.04 | 65.82% | 174.25 | 53.67% |
| Level 4 | 33.88 | 11.26% | 49.00 | 12.32% | 25.67 | 8.24% | 54.70 | 16.85% |
| Wetland | Shrub | Grassland | Water | |
|---|---|---|---|---|
| Area (km2) | 71.41 | 19.82 | 84.01 | 2.11 |
| Percentage of the Ecological Source | 40.27% | 11.18% | 47.37 | 1.19 |
| Percentage of the total area for Landscape Type | 74.12% | 54.86% | 15.82% | 16.07 |
© 2020 by the authors. Licensee MDPI, Basel, Switzerland. This article is an open access article distributed under the terms and conditions of the Creative Commons Attribution (CC BY) license (http://creativecommons.org/licenses/by/4.0/).
Share and Cite
Wang, S.; Huang, J.; Yu, H.; Ji, C. Recognition of Landscape Key Areas in a Coal Mine Area of a Semi-Arid Steppe in China: A Case Study of Yimin Open-Pit Coal Mine. Sustainability 2020, 12, 2239. https://doi.org/10.3390/su12062239
Wang S, Huang J, Yu H, Ji C. Recognition of Landscape Key Areas in a Coal Mine Area of a Semi-Arid Steppe in China: A Case Study of Yimin Open-Pit Coal Mine. Sustainability. 2020; 12(6):2239. https://doi.org/10.3390/su12062239
Chicago/Turabian StyleWang, Shougang, Jiu Huang, Haochen Yu, and Chuning Ji. 2020. "Recognition of Landscape Key Areas in a Coal Mine Area of a Semi-Arid Steppe in China: A Case Study of Yimin Open-Pit Coal Mine" Sustainability 12, no. 6: 2239. https://doi.org/10.3390/su12062239