1. Introduction
Agriculture is at the center of the debate on sustainability with agricultural systems requiring large areas of land and inputs such as fertilizer [
1]. Fertilizer use affects the environment considerably in multiple ways [
2,
3,
4]. Additionally, most agricultural products enter the food value chain, which is vital for human society and has a crucial impact on social structures. These two elements are closely related to economic factors and influence each other mutually. Therefore, finding the balance between economic growth and environmental as well as social sustainability has become a challenge [
1]. In practice, trade-offs of environmental and social impacts are being accepted in order to favor economic benefits. This is considered “weak sustainability” because the emphasis lies on the allocation of resources. “Strong sustainability”, however, does not accept trade-offs between economic gain and environmental sustainability [
1]. The definition and assessment of environmental and social sustainability have not been unanimously determined, which makes the evaluation of sustainable impact complicated [
1]. However, the conceptualization of sustainable development in agriculture has evolved more recently from vague and qualitative indicators to more precise indicators measured quantitatively in order to analyze impacts and progression [
5]. The United Nations’ definition of sustainability and its subsequent elements of sustainable development described in the Agenda 21 have been chosen as a conceptual framework to investigate the effects of fertilizer reduction on sustainability [
1,
5]. In this definition, sustainable development consists of social, economic, and environmental aspects as well as related institutional aspects in order to reach the Agenda 21 sustainability targets [
1,
6,
7,
8].
1.1. Fertilizer Use and the “Three Controls” Technology
The steady increase of fertilizer input in global agriculture over the past century has significantly contributed to the development of modern farming. It has improved overall global agricultural productivity, crop yields, and soil fertility [
9,
10]. The use of inorganic fertilizer has become an indispensable component of agriculture in Asia since its introduction during the Green Revolution in the 1960s [
10,
11,
12]. However, crop yields and agricultural productivity have been slowly increasing or stagnating over the past decades, despite the rapid increase and consequent excessive fertilizer use, especially of nitrogen fertilizers [
2,
3]. Environmental degradation due to imbalanced fertilizer application and its overuse on a global level have been associated with low nutrient use efficiencies and leakages to the environment, causing multiple ecological problems and posing threats to human health [
3,
4]. Issues such as soil degradation, air pollution and water contamination, greenhouse gas emissions, declining productivity and quality as well as biodiversity and ecosystem services losses have become major concerns in recent times [
2,
3]. Excessive nitrogen fertilization is of particular concern given that nitrogen pollution is seen to be a significant factor for climate change due to the manifold ways reactive nitrogen affects biological and chemical processes on Earth, for example, as greenhouse gases [
13].
In 2014, 26.7% of global fertilizers were used in China, resulting in China being the largest fertilizer consumer [
14]. China is also the largest global rice producer and has increased its nitrogen–phosphorus–potassium (NPK) fertilizer application more than tenfold from 38 kg/ha in 1970 to 400 kg/ha in 2009 [
12,
15]. By 2013, Chinese farmers reached an exceedingly high average application rate of 559.8 kg/ha NPK fertilizer for rice production [
16,
17]. In particular, the nitrogen fertilizer input for rice production often exceeds 180 kg/ha, which is approximately 75% higher than the global average [
12]. The highest quantities of nitrogen fertilizer are applied in southern China and can reach up to 250 kg/ha [
9,
12]. However, uptake of the added nitrogen fertilizer by the rice plants is only about 20–30%, reflecting a significantly low nitrogen use efficiency [
12,
18,
19]. Hence, the majority of nitrogen is lost to the environment, particularly to soil, water, and air, leading to non-point source pollution [
2,
20]. Furthermore, the overconsumption of nitrogen fertilizer can decrease rice yields since plants are more susceptible to lodging as well as to infestation by pests and diseases [
9,
12,
18,
21].
A survey conducted in 2005 in ten counties of Guangdong Province with 500 participants revealed four main problems in rice farming [
21]. First, the farmers’ nitrogen input is too high in both rice growing seasons, reaching about 200 kg/ha of nitrogen fertilizer, resulting in low nitrogen use efficiency. Second, high amounts of nitrogen fertilizer are especially used at the early growth stage in a short period of time. During the first 15 days, farmers often apply nitrogen fertilizer two to three times, which accounts for more than 80% of their total application quantities in one season. Third, this results in large numbers of unproductive tillers. These unproductive tillers often constitute to more than 50% of the canopy, of which many die during the panicle initiation stage. This in turn, makes productive tillers more susceptible to lodging, causing difficulties during harvest. Fourth, farmers apply too many fungicides and other pesticides because the development of diseases and occurrences of pest insects is stimulated due to the dense canopy caused by the high number of unproductive tillers. Under these conditions of low light intensity and high humidity, a perfect breeding ground for multiple pests and diseases is being created [
21,
22].
In order to limit the aforementioned negative consequences of excessive nitrogen input, the “Three Controls” Technology (3CT) was developed and released in Guangdong Province in 2007 [
21,
22]. This technology focuses on improving sustainable farming and reducing negative environmental effects while increasing grain yields and reducing the risk of yield variability. 3CT is a site-specific nutrient management technology and was developed by the Rice Research Institute of the Guangdong Academy of Agricultural Sciences (GDRRI) and the International Rice Research Institute (IRRI) [
21,
22]. “Three Controls” refers to the three components of the technology: (i) control of nitrogen fertilizer application rate and timing, (ii) control of unproductive tillers, and (iii) control of fungicide and pesticide application through better crop management [
21]. Farmers are incentivized to apply 40%, 20%, 30%, and 10% of the nitrogen fertilizer at basal, mid-tillering, panicle initiation, and heading stages, respectively. The timing of nitrogen fertilizer application is crucial for improving nitrogen use efficiency and reducing environmental pollution [
21,
22]. By controlling unproductive tillers, the health of the entire canopy can be improved, which reduces the risk of lodging as well as diseases and pest insects [
21]. Field trials have shown that farmers can achieve a 20% decrease in their nitrogen fertilizer input, save one to two sprays of pesticides each season, and increase their yields by 5–10% if they adopt 3CT fully. Furthermore, the technology has been shown to improve farmers’ income by approximately 220 USD/ha [
21]. The implementation of 3CT in Guangdong Province was part of a project loan by the World Bank for the “Guangdong Agricultural Non-point Source Pollution Control Project” [
20].
1.2. Adoption of Agricultural Best Management Practices
Several external and internal factors have been shown to influence farmers’ adoption of new farming practices. Internal factors include, amongst others, household income from farming and non-farming activities, quantity of labor from farm household members, agricultural input use and effectiveness, farmers’ risk aversion, age, and number of years of education [
23]. External factors are, for example, size of agricultural production area, soil type and quality of cultivated land, type of water source, and degree of water scarcity as well as the level of government support [
23]. Adoption of a new agricultural practice depends on how applicable the practice is to fulfill farmers’ needs and demonstrate its profitability since farmers’ risk aversion is considered the most crucial factor for non-adoption [
24,
25,
26]. In particular, economic risks play an important role in farmers’ decision-making and adoption process. This is particularly true for smallholder farmers with low incomes who have been shown to be rather unwilling to take economic risks if the new technology could result in yield losses and consequently result in profit reduction [
25,
26]. Farmers often aim for maximum economic returns. However, the economic optimum, which aims for profit maximization, is often not concurrent with the fertilizer rate for reaching an agronomic optimum and environmental sustainability [
26,
27].
In the case of China, the high application rate of fertilizer demonstrates a mechanism for farmers to reduce their economic risk and potential yield losses, which has been ongoing for several decades [
24,
25,
26]. Therefore, other risks such as environmental risks have been perceived less seriously by farmers [
25,
26]. Another reason for high fertilizer and pesticide use in China is the low quality of extension advisory services and hence the lack of knowledge about sustainable farming practices [
28,
29,
30]. Farmers rather prefer to apply more than the recommended amounts and tend to overestimate the impact of additional nitrogen on their yields, which was shown in studies where farmers systematically set aside agronomists’ recommendations [
26,
31].
1.3. Rationale of the Study
Chinese farmers often rely on the information given to them during the period of the Green Revolution, which recommended the high use of agrochemicals in order to attain high crop yields [
30,
32]. The overuse of fertilizer has been found to be influenced by farmers’ risk perception [
25,
26], level of education, and environmental knowledge [
26,
33]. Consequently, the key factors influencing the high fertilizer application rates in China are the farmers’ perceptions and knowledge of fertilizer use as well as profitability expectations [
26]. With regard to 3CT, the positive effects of the technology are well-documented for monitored field trials [
21,
34,
35]. These field studies have shown an increase in rice yields while demonstrating a considerable reduction of nitrogen fertilizer and pesticide application. However, these studies have been executed under experimental conditions [
22]. Few studies have focused on the degree to which farmers have adopted the technology. Furthermore, there is limited evidence on the effects of 3CT adoption on the farmers’ social development and environmental impacts, which have not yet been evaluated. A study by Wang et al. [
22] assessed the adoption of 3CT by farmers through survey interviews in 2012. Results of that study showed that not all farmers followed the exact 3CT guidelines and, therefore, the degree of 3CT adoption varied. Farmers applied fertilizer at different times and in varying amounts. Hence, these variations affected the reliability of the evidence of the effective impact of 3CT [
22]. Similar results have also been found in studies about site-specific nutrient management adoption where farmers would modify the site-specific nutrient management technology to fit their personal needs, rather than applying the exact recommendations, thus compromising the sustainability of such practices [
32,
36,
37,
38].
Therefore, the present study conducted an in-depth evaluation of farmers’ perceptions of the “Three Controls” Technology in Guangdong Province, China. Perceived effects of the technology on farming practices, financial gains, and environmental changes as well as social and personal well-being were investigated. The present study aimed to address the gap between 3CT studies under controlled experimental conditions and the application under real farmer conditions by investigating the farmers’ perspective, adoption, and the technology’s compatibility with traditional farming practices. Furthermore, farmers’ perceived changes of their economic, environmental and social situation due to the adoption of 3CT were evaluated. Indicators for economic, social, and environmental impact were chosen with regard to the elements and objectives of 3CT in order to examine its potential for sustainable agricultural development.
2. Materials and Methods
2.1. Questionnaire
A survey questionnaire was implemented to investigate the farmers’ adoption and perceptions of 3CT as well as the changes they experienced since the introduction of the technology. The questionnaire consisted of single-choice and multiple-choice questions, Likert-type scale questions in a matrix format including pictures, and open-ended questions. The questionnaire was divided into five thematic categories and was approved by the IRRI Research Ethics Committee (2019-003-A-2016-61). The questionnaire started with consent information, farmers were informed that their participation was voluntary, and that participants were able to terminate the questionnaire at any time without penalty. Furthermore, participants were informed that all data collected were anonymous and analyzed as group data with no possibility of identifying single farmers. Farmers were asked to sign the consent form before proceeding to the next part. The farmers’ signature was not saved, so total confidentiality was assured.
The second section of the questionnaire concerned the farmers’ adoption of 3CT and their current cropping schedule for both early and late rice seasons. Information about the time of the introduction of 3CT, start of use, and number of seasons in which 3CT was used were collected. Farmers were also asked to provide an explanation of why they were still using 3CT or why they had stopped using 3CT. Depending on the farmers’ answers, they were automatically redirected to a set of 16 statements that farmers had to evaluate on a 6-point Likert-type scale (1 = not applicable at all, 6 = very applicable) on either the benefits or shortcomings of 3CT, respectively.
The third part included questions on the farm details and assessed the farmers’ economic situation for the two most recent rice-cropping seasons (early rice season 2018: March to July, late rice season 2018: July to November). Farm details such as the cultivated area in mu (Chinese area unit: 1 mu = 0.067 ha), total rice paddy production in kilogram, cropping pattern, and land tenure status with associated costs in Chinese Yuan (1 USD = 6.329 Yuan) [
39] were asked. Furthermore, data on input costs such as pesticides and fertilizer, irrigation, machine rental, and labor were collected. Furthermore, farmers were asked about their revenues for the sold production quantities including their selling price.
In the fourth section, farmers were asked about their subjective knowledge, satisfaction, and expectations with regard to 3CT. Subjective knowledge was evaluated using an adapted version of the Flynn and Goldsmith [
40] subjective knowledge scale containing five items. Satisfaction and expectations were adapted from Meakin and Weinman [
41] and adjusted to account for the agricultural and Chinese context. Seven 6-point Likert-type scale statements (1 = completely disagree, 6 = fully agree) were used to measure the farmers’ satisfaction and four to examine their expectations.
Furthermore, seven dimensions of change were selected to examine the different aspects of the farmers’ perceived economic, social, and environmental changes. The dimensions were: agricultural production (eight items), physical capital (five items), social capital (three items), human capital (four items), health (three items), poverty (five items), and natural capital (11 items) [
42,
43,
44]. All dimensions were evaluated on a 6-point Likert-type scale (1 = completely disagree, 6 = fully agree). Natural capital items were selected based on the information gathered in the “Illustrated Guide to Integrated Pest Management in Rice in Tropical Asia” by Reissig et al. (1986) [
45] including beneficial indicator species and plants found in rice ecosystems in southern China and South-East Asia. The advice of entomologists specialized in rice ecosystems was further included to select the relevant species in that geographical region. Considering that farmers may not be familiar with the names of the species, pictures of the selected indicator species were shown to the farmers during the survey interviews.
The last part of the questionnaire included questions about the farmers’ non-rice income. They were asked if they earned income from non-farming activities. The questionnaire ended with the farmers’ demographic information including age, gender, marital status, and household composition.
The questionnaire was created in English and translated into Chinese. In order to ensure content validity, the Chinese questionnaire was independently back-translated into English and reviewed for possible imparities. Data were collected by means of face-to-face interviews using the mobile data collection application CommCare (version 2.44.3, Dimagi, Cambridge, MA, USA ), a computer-assisted personal interviewing (CAPI) tool. The questionnaire was built online on the CommCare dashboard and consisted of both languages. The CommCare application was installed on Samsung Galaxy Tablets A 7.0 (2016) LTE SM-T285 (Samsung, Seoul, Korea) and deployed offline in the villages.
2.2. Sampling and Implementation
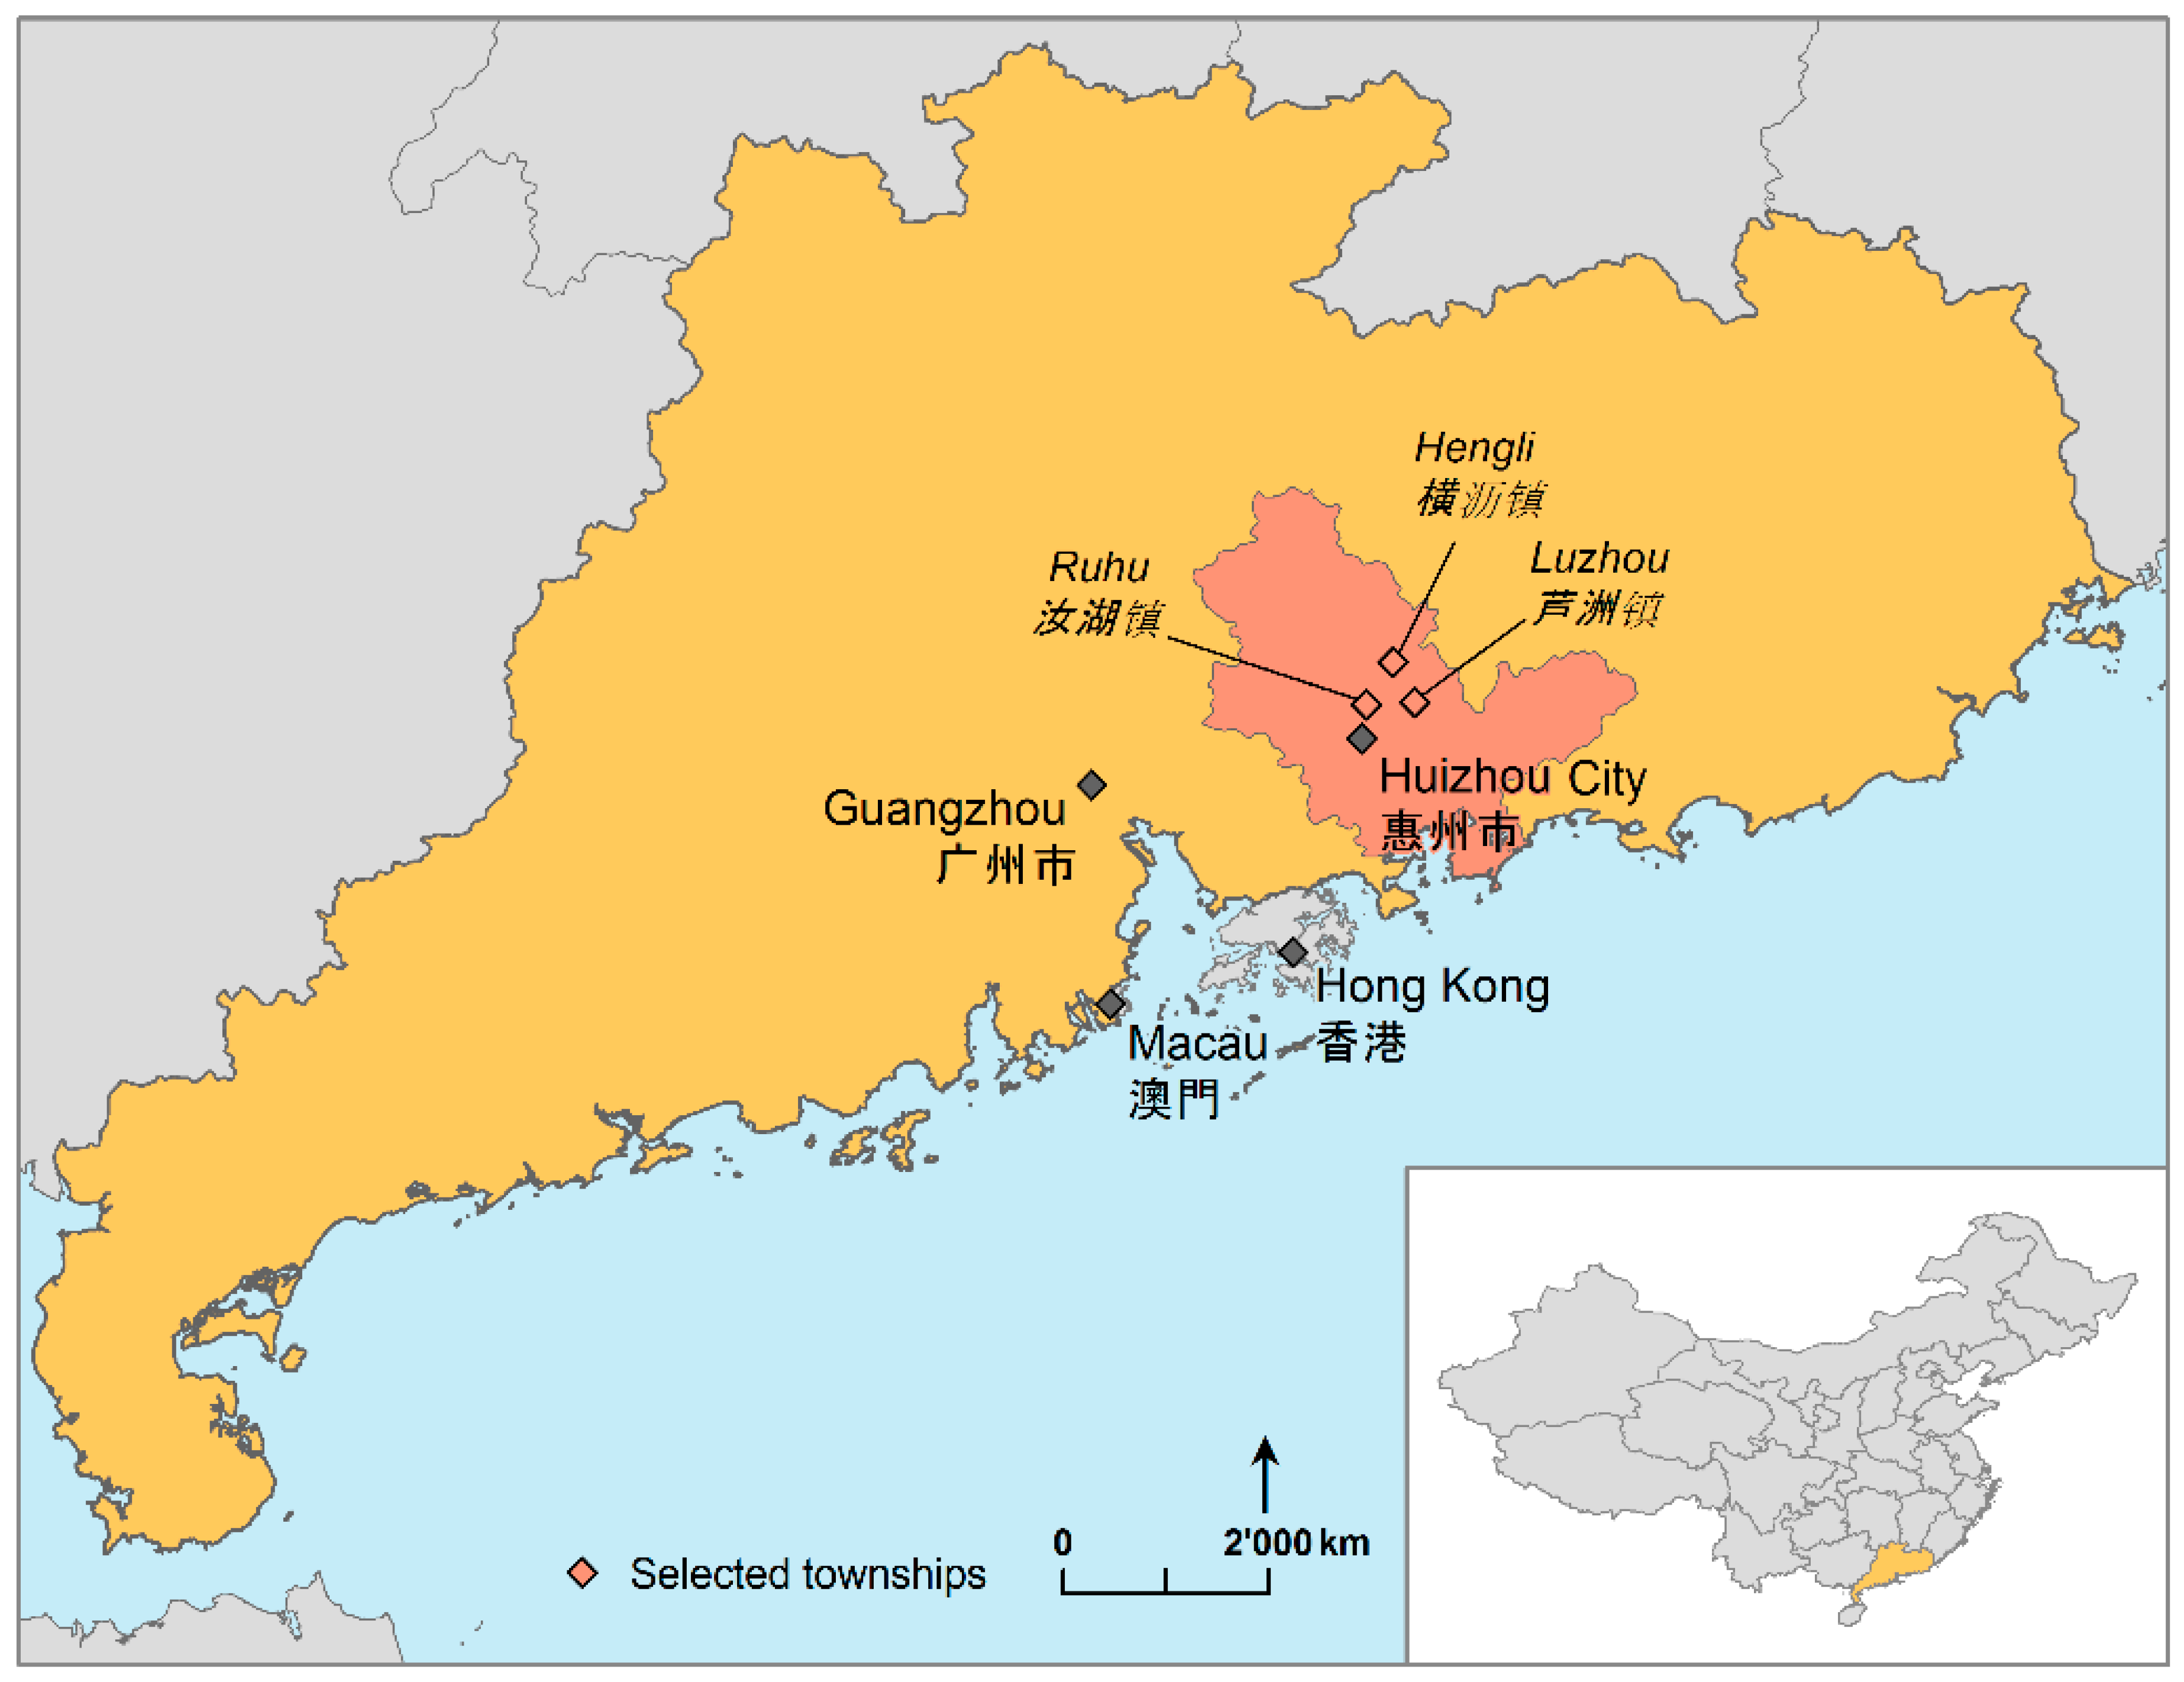
Purposive sampling was chosen in terms of geographic location. The district of Huicheng in the prefecture of Huizhou City in Guangdong Province was selected as the study area due to its importance as an agriculture production zone of the province (
Figure 1) and as Huizhou Prefecture was participating in the World Bank’s “Guangdong Agricultural Non-point Source Pollution Control Project” [
20]. For the project, rice, corn, vegetable, and fruit trees were selected as priority crops for reducing agricultural non-point source pollution. The farmers in Huizhou Prefecture received promotion and demonstration of 3CT starting in 2014 [
20].
The survey was conducted in three townships in Huicheng district: Hengli, Luzhou, and Ruhu. In each township, two villages were visited for the farmer interviews. Farmers were selected by local staff from the commune office. They were contacted by the village heads and asked for their participation in the survey. Farmers who agreed to participate in the survey were invited to come to the village center on the day of the survey to conduct the interviews. Each farmer received compensation for their travel costs. Data were collected by six local enumerators, who received special interviewing training before the data collection took place. All interviews were conducted in a central village location. The questionnaire was generally completed in approximately 35 to 45 minutes. Depending on the farmers’ literacy levels and their eyesight, enumerators would read the questions to the farmers or farmers would read the questions themselves but enumerators would insert the answers into the questionnaire application. Data collection took place over three days in April 2019 (17–19 April, 2019).
2.3. Data Analysis
Raw data were exported from the CommCare dashboard and imported into Excel (version 2001, Microsoft, Redmond, WA, USA). The raw data exports in Microsoft Excel were merged by farmer ID and imported to the statistical package SPSS (version 26, IBM, Armonk, NY, USA) for data analysis. Regional units such as the Chinese surface unit “mu” and Chinese currency “Yuan” were converted to hectare (1 mu = 0.067 ha) and USD (1 USD = 6.329 Yuan) [
39], respectively. Descriptive statistics were conducted to provide sample descriptions of the demographic, socioeconomic, and financial as well as agricultural data of the entire sample. Furthermore, the farmers’ agricultural performance was analyzed by computing the total production quantities (t), yield (t/ha), and inputs (USD/ha) in order to calculate the estimated average gross and net income (USD/ha). Partial budget analysis was performed to examine the farmers’ perceived change in profitability. Pearson correlations, t-test for two independent samples, and analysis of variance (ANOVA) were performed.
Exploratory and confirmatory factor analyses were chosen to analyze the farmers’ perceived benefits of 3CT and the dimensions of change to identify the underlying relationships between items. The chosen extraction method was principal component based on eigenvalues >1. Varimax rotation was the selected rotation method. This method was chosen because the perceived changes can be multifactorial, and it can be assumed that the items are not fully independent of each other. To assess the reliability of the Likert-type scale measures, Cronbach’s alpha (α) was computed to analyze the internal consistency of items forming a scale. Statistical significance was set to p = <0.05.
Structural equation modeling procedures (SEM) were performed to test the relationship between the economic, social, and environmental impact and the effects of each parameter. SEM was performed using the statistical software package IBM SPSS AMOS (version 26, Amos Development Corporation, Wexford, PA, USA). The maximum likelihood method of estimation was applied to calculate the SEM coefficients [
47]. The model fit was assessed using the comparative fit index (CFI) and the root mean square error of approximation (RSMEA). CFI with values higher than 0.90 represent an acceptable fit, values above 0.95 represent a good fit. RSMEA values lower than 0.08 represent an acceptable fit, values below 0.05 a good fit [
47,
48]. The significance level was set to p = <0.05. The analyses were conducted in three steps. First, exploratory and confirmatory factor analyses were performed. Second, the data were fitted to the structural model. Third, modification indices were used to identify parameter additions to reach a model with a better fit. To test the model, all participants were included (n = 142).
3. Results
3.1. Sample Description
Out of the 142 farmers who participated in the study, 79.6% (n = 113) were male and 20.4% (n = 29) were female. The participants’ age ranged from 32 to 86 years, with a mean age of 58.8 years (Standard deviation (SD) = 9.3). Participants had been farming for an average of 35.0 years (SD = 12.8) with a minimum of four and a maximum of 62 years of farming. All participants were married. The average number of household members was seven (SD = 3.3) of which three (SD = 1.6) were children of 15 years and younger. Over two thirds (66.2%, n = 94) of the farmers indicated having at least one non-farming income source. On average, the non-farming income of the farmers constituted 72.0% (SD = 25.4) of their total revenue.
3.2. Adoption of 3CT
3CT was introduced to the farmers from 2007 onward in Guangdong Province, but most farmers in this study reported that they were introduced to 3CT between 2014 and 2017 (83.2%, n = 118). More than half of the farmers (56.3%, n = 80) adopted 3CT in 2014. Adoption differed between townships. Farmers in Hengli township showed the highest adoption rate in 2014 (86.7%, n = 39), followed by the farmers in Luzhou township who mainly adopted 3CT in 2014 (56.0%, n = 28) and 2016 (34.0%, n = 17). In Ruhu township, most farmers adopted the technology in 2017 (53.2%, n = 25), with some farmers already adopting 3CT in 2014 (27.7%, n = 13). All 142 farmers reported to continue 3CT in the upcoming seasons and all farmers who had been introduced to the technology also adopted it.
3.3. Benefits of 3CT
Since all farmers responded yes to continuing the use of 3CT, they were asked to rate the benefits of the technology on a 6-point Likert-type scale. In general, farmers perceived many benefits (m = 5.30, SD = 0.40). The five most highly rated benefits of 3CT were “Easy to apply” (m = 5.71, SD = 0.55), “Satisfies my preferences” (m = 5.64, SD = 0.51), “Fits my cropping pattern” (m = 5.58, SD = 0.55), “Less lodging” (m = 5.58, SD = 0.65), and “High yield” (m = 5.57, SD = 0.74) (
Figure 2).
A confirmatory factor analysis over two factors was conducted with the 16 benefit items. The two factors explained 41.2% of the variance (
Table 1). The factors concerned the two main benefits of adopting 3CT. Factor 1 (m = 5.58, SD = 0.44, n = 8) described the positive application experiences with 3CT and the technology’s compatibility with the farmers’ usual farming practices. Hence, this factor described the compatibility (factor 1) of 3CT. Reliability analysis of 3CT compatibility resulted in a Cronbach’s alpha of 0.837 (n = 8).
Factor 2 (n = 8) described the positive reductions and farming practice changes that the farmers experienced since adopting the technology, in particular, with regard to labor. Therefore, this factor can be regarded as the facility (factor 2) of using 3CT. Reliability analysis of the items comprising the facility resulted in a Cronbach’s alpha of 0.529. However, excluding the item “Labor shortage” increased the Cronbach’s alpha to 0.651 (m = 5.21, SD = 0.54, n = 7). This item showed a small (< 0.300) positive and negative factor loading on both factors, which further indicated that this item did not fit in either factor category. Therefore, this item was not included for further analysis.
Overall, the farmers perceived the positive aspects of the technology well. No significant differences between the three townships in the rating of the two benefit factors were detected by means of analysis of variance (ANOVA) (compatibility: F(2,139) = 3.019, p = 0.052), facility: F(2,139) = 2.072, p = 0.130). Significant differences between male and female farmers were present for compatibility (t(140) = 3.263, p < 0.001). Male farmers (m = 5.64, SD = 0.35, n = 113) generally rated the benefits higher than the female farmers (m = 5.35, SD = 0.64, n = 29). Facility did not show significant differences between gender (t(140) = 1.461, p = 0.146).
3.4. Agricultural Performance
Most farmers’ (99.3%, n = 141) cropping pattern was rice–rice–fallow. More than half of the farmers used inbred and hybrid rice varieties (56.3%, n = 80) while 30.3% (n = 43) used only inbred varieties and 13.4% (n = 19) had only planted hybrid varieties. Some farmers (35.9%, n = 51) indicated that they also cultivated vegetables, maize, peanuts, watermelon, sweet potato, guava, soybean, or a combination of these crops next to rice during the non-rice season 2018/2019. Farmers had small rice fields with an average of 0.35 ha (SD = 0.28). The majority of the farmers cultivated on their own land (83.1%, n = 118) and 16.9% (n = 24) indicated that they also cultivated on rented land. The mean area of the additionally rented land was 0.27 ha (SD = 0.24).
In 2018, the farmers spent an average of USD 612.3 (SD = 390.9) for their rice production with production costs higher in the early rice season (
Table 2). Overall, this resulted in input costs per hectare of USD 1047.2 (SD = 288.8). In total, participants produced a mean paddy rice quantity of 3.8 t (SD = 2.1) and reached an average yield of 6.5 t/ha (SD = 0.6). The surveyed farmers sold on average 44.0% (SD = 21.7) of their total production in dried paddy form for a mean selling price of USD 0.5 (SD = 0.1) per kilogram. Many farmers kept some or all of their rice production for home consumption or as seed stock. In total, farmers generated an average gross income of USD 1079.8 (SD = 1001.8) from selling their paddy rice yield in the early and late rice season 2018. The farmers’ net income from rice reached USD 546.0 (SD = 847.9) after subtracting the input costs. Partial budget analysis resulted in farmers being able to generate an average added income from increased yields of 915.5 USD/ha (SD =1010.6) since the adoption of 3CT. Furthermore, the farmers’ avoided cost by saving inputs amounted to an average of 718.4 USD/ha (SD = 694.0).
Significant differences between the townships were found for total rice production quantities (F(2,139) = 4.226, p = 0.017), yield (F(2,139) = 10.025, p < 0.001), inputs (F(2,129) = 14.275, p < 0.001) and net income (F(2,83) = 3.692, p = 0.029). Post-hoc analyses showed that the farmers in Hengli township had significantly higher yields (t(91) = 4.613, p < 0.001) and net income from rice (t(57) = 2.004, p = 0.050) than the farmers in Luzhou township. Additionally, compared to the farmers in Ruhu township, the farmers in Hengli had significantly higher production quantities (t(89) = 3.145, p = 0.002), higher yields (t(89) = 2.248, p = 0.027), and a higher net income from selling rice (t(50) = 2.621, p = 0.012). Furthermore, there were significant differences in yield (t(94) = –2.185, p = 0.031) and input costs (t(91) = 2.283, p = 0.25) between the farmers in Luzhou and Ruhu township.
Farmers reported that they were able to save about 57.5% (SD = 19.2) of input costs since they adopted 3CT. In particular, the farmers in Hengli township mentioned significantly higher savings of 64.7% (n = 43) on average when compared to the farmers in Luzhou (51.8%, n = 48) and Ruhu township (56.6%, n = 17) (F(2,139) = 5.576, p = 0.005). In total, the farmers perceived that they were able to save on average 389.4 USD/ha (SD = 344.6) in 2018 on inputs such as fertilizers and pesticides. Furthermore, the majority of the farmers (97.9%, n = 139) perceived a positive change in their rice income since adopting 3CT. The farmers also experienced an increase in yields of 1.1 t (SD = 0.9) on average since they started using 3CT on their rice fields.
3.5. Farmers’ Satisfaction with, Subjective Knowledge about, and Expectations of 3CT
Seven statements were used to investigate the farmers’ level of satisfaction with 3CT (
Table 3). The farmers indicated a very high satisfaction (m = 5.40, SD = 0.55). Reliability analysis resulted in a Cronbach’s alpha of 0.678 (n = 7) and suggested the removal of the item “I am not sure the technology was worth the trouble it took to implement it” to increase the Cronbach’s alpha to 0.824 (m = 5.41, SD = 0.58, n = 6). No significant differences between male (m = 5.43, SD = 0.50, n = 113) and female (m = 5.31, SD = 0.82, n = 29) farmers were detected (t(140) = 0.962, p = 0.338). There were also no significant differences between the three townships (F(2,139) = 2.943, p = 0.056). However, a high correlation between satisfaction and subjective knowledge was found (r = 0.769, p < 0.001).
Farmers rated five statements to assess their subjective 3CT knowledge. Farmers rated themselves to be highly knowledgeable about 3CT (m = 5.25, SD = 0.82). Cronbach’s alpha for subjective knowledge was 0.889 (n = 5). There were no significant differences between male (m = 5.27, SD = 0.74, n = 113) and female (m = 5.17, SD = 1.09, n = 29) farmers (t(140) = 0.546, p = 0.586). However, significant differences between townships (F(2,139) = 3.294, p = 0.040) were found. Post-hoc analysis revealed that farmers in Hengli township (m = 5.48, SD = 0.57, n = 45) perceived significantly higher levels of subjective knowledge than the farmers in Ruhu township (m = 5.05, SD = 0.84, n = 47) (t(90) = 2.842, p = 0.006).
The farmers were asked to rate four statements to evaluate their expectations of 3CT. Reliability analysis resulted in a Cronbach’s alpha = 0.725 (n = 4). The mean score for expectations was 5.25 (SD = 0.81). There were no significant differences between male (m = 5.20, SD = 0.72, n = 113) and female (m = 5.26, SD = 0.79, n = 29) farmers (t(140) = -0.375, p = 0.708). Furthermore, no significant differences between the three townships (F(2, 139) = 0.746, p = 0.476) were detected. However, a strong positive correlation between the 3CT expectations and satisfaction was found (r = 0.700, p < 0.001) as well as between satisfaction and subjective knowledge (r = 0.768, p < 0.001).
3.6. Dimensions of Change
To investigate the variety of changes that may have occurred since using 3CT, the farmers were asked to rate statements of seven dimensions of change. These statements aimed to examine the farmers’ perceived changes in different aspects of their livelihood since adopting the technology.
3.6.1. Agricultural Production
Changes in agricultural production were evaluated using eight items (
Table S1). Farmers indicated many changes concerning their rice production. The mean score for agricultural production was 5.35 (SD = 0.49, n = 7) and demonstrated a strong level of change in the farmers’ agricultural practices due to the adoption of 3CT. Farmers strongly agreed to having had increased yields (m = 5.46, SD = 0.79) and decreased fertilizer use (m = 5.45, SD = 0.74). Farmers also reported having spent less on inputs and other production costs (m = 1.25, SD = 0.62).
An exploratory factor analysis revealed three factors explaining 66.8% of the variance (
Table 4). Factor 1 described the positive changes in agricultural production that the farmers perceived and demonstrated 3CT’s key benefits. Thus, this factor can be regarded as production outcome (factor 1). Cronbach’s alpha was 0.766, however, the reliability analysis suggested removing the item “I now apply more fertilizer at a later growth stage” to increase the Cronbach’s alpha to 0.827. The context of the item was rather specific when compared to the rest of the scale, but lacked an exact description of time when the fertilizer should be applied. Thus, this item was excluded for further analysis. Farmers perceived a strong change in their overall production outcome (m = 5.40, SD = 0.66, n = 3). There were no significant differences between male (m = 5.41, SD = 0.59, n = 113) and female (m = 5.36, SD = 0.88, n = 29) farmers (t(140) = 0.392, p = 0.696). However, significant differences between the three townships (F(2,139) = 8.365, p < 0.001) were detected. Post-hoc analyses showed differences between farmers in Hengli township (m = 5.71, SD = 0.39, n = 45) and farmers in Luzhou township (m = 5.29, SD = 0.79, n = 50) (t(93) = 3.264, p = 0.002) and also between Hengli and Ruhu (m = 5.22, SD = 0.61, n = 47) townships (t(90) = 4.585, p < 0.001). The farmers in Hengli township rated the items in production outcome significantly higher than the farmers in the two other townships.
Factors 2 and 3 were not further analyzed since they both comprised of only two items, which does not allow for a conclusive interpretation. Hence, they were not further discussed.
3.6.2. Physical Capital
Reliability analysis resulted in a Cronbach’s alpha of 0.625 (n = 5) (
Table S2). The farmers perceived little changes in physical capital (m = 2.69, SD = 1.05). There were no significant differences between male (m = 2.69, SD = 1.08, n = 113) and female (m = 2.67, SD = 0.97, n = 29) farmers (t(140) = 0.097, p = 0.923). Nonetheless, significant differences between the three townships (F(2,139) = 22.004, p < 0.001) were found. Post-hoc analyses showed that farmers from Hengli township (m = 3.43, SD = 0.88, n = 45) perceived the most changes in their physical capital and consistently rated the statements higher than the farmers in Luzhou (m = 2.44, SD = 0.91, n = 50) (t(93) = 5.347, p < 0.001) and Ruhu (m = 2.23, SD = 0.98, n = 47) (t(90) = 6.178, p < 0.001) townships.
3.6.3. Social Capital
Results showed that farmers perceived positive changes in social capital (m = 4.98, SD = 0.91). Reliability analysis resulted in a Cronbach’s alpha of 0.840 (n = 3) (
Table S3). There were no significant differences between male (m = 5.01, SD = 0.82, n = 113) and female (m = 4.85, SD = 1.20, n = 29) farmers in their perception of social capital change (t(140) = 0.855, p = 0.388). Significant differences were found between the townships (F(2,139) = 3.130, p = 0.047). Post-hoc analyses revealed that farmers in Hengli township (m = 5.24, SD = 0.73, n = 45) perceived significantly higher social capital changes compared to the farmers in Ruhu township (m = 4.79, SD = 0.82, n = 47) (t(90) = 2.825, p = 0.006).
3.6.4. Human Capital
Reliability analysis demonstrated a Cronbach’s alpha of 0.625 (n = 4). However, the results of the reliability analysis suggested excluding the item “I am now able to express concerns about my farming practices”. This item concerned the critical evaluation of the farmers’ own knowledge, which is culturally not commonly practiced. Cronbach’s alpha increased to 0.760 (n = 3) (
Table S4). Farmers perceived many changes in human capital (m = 5.07, SD = 0.79). There were no significant differences in the farmers’ perceptions of human capital between male (m = 5.08, SD = 0.74, n = 113) and female (m = 5.07, SD = 0.97, n = 29) farmers (t(140) = 0.065, p = 0.948). There were also no significant differences between the three townships (F(2,139) = 2.89, p = 0.059).
3.6.5. Health
On average, the farmers perceived having improved their health status (m = 5.30, SD = 0.71). Reliability analysis demonstrated a Cronbach’s alpha of 0.775 (n = 3) (
Table S5). There were no significant gender differences (t(140) = 0.856, p = 0.393, m(male) = 5.32, SD = 0.69, n = 113; m(female) = 5.20, SD = 0.77, n = 29) as well as between the three townships (F(2,139) = 1.91, p = 0.151).
3.6.6. Poverty
Reliability analysis showed a Cronbach’s alpha of 0.571 (n = 5). However, the analysis suggested removing the item “I have lost a lot of money” to increase the Cronbach’s alpha to 0.604 (n = 4) (
Table S6). Farmers perceived changes in poverty reduction (m = 4.49, SD = 0.80). There were no significant differences between male (m = 4.50, SD = 0.78, n = 113) and female (m = 4.44, SD = 0.88, n = 29) farmers (t(140) = 0.374, p = 0.709). However, significant differences between the three townships were found (F(2, 139) = 5.45, p = 0.005). Post-hoc analyses showed that farmers in Hengli township (m = 4.81, SD = 0.62, n = 45) perceived significant higher changes in poverty reduction compared to the farmers in Luzhou (m = 4.35, SD = 0.95, n = 50) (t(93) = 2.768, p = 0.007) and Ruhu townships (m = 4.34, SD = 0.71, n = 47) (t(90) = 3.344, p = 0.001).
3.6.7. Natural Capital
The farmers were asked about the presence of different insects and vertebrate animals in their rice fields. They were shown pictures of beneficial indicator species in rice fields to have a clearer picture of biodiversity changes since their adoption of 3CT. Furthermore, two items asking about plant biodiversity were also included (
Table S7). The farmers indicated that they had not seen many impactful changes in the presence of beneficial rice field specific species. Reliability analysis of the beneficial species items revealed a Cronbach’s alpha of 0.501 (n = 11). The analysis suggested excluding the item “I have seen less frogs” to increase the Cronbach’s alpha to 0.588 (n = 10, m = 3.27, SD = 0.67). Since frogs and toads can be both beneficial and pest species, farmers may not have been able to distinguish or recognize the species shown on the picture and therefore, were not sure about which types of frogs they had seen in their fields. This item was excluded from further analyses.
There were significant differences between male (m = 3.33, SD = 0.65, n = 113) and female (m = 3.02, SD = 0.70, n = 29) farmers (t(140) = 2.241, p = 0.027). Male farmers rated the perceived changes higher than the female farmers. There were also significant differences between the three townships (F(2,139) = 17.193, p < 0.001). The farmers in Hengli township (m = 3.66, SD = 0.65, n = 45) rated the items significantly higher than the farmers in Luzhou (m = 2.93, SD = 0.71, n = 50) (t(93) = 5.146, p < 0.001) and Ruhu (m = 3.25, SD = 0.38, n = 47) (t(90) = 3.716, p < 0.001) townships. A significant difference was also found between the farmers in Luzhou and Ruhu townships (t(95) = -2.663, p = 0.009).
For further analysis, this dimension was separated into beneficial vertebrates (n = 4) and beneficial invertebrates (n = 4) because humans tend to perceive these differently [
49,
50]. Additionally, two elements for beneficial plant management were included, namely the items “there are more trees and shrubs on my farm” (m = 2.59, SD = 1.24) and “there are more wildflowers around my fields” (m = 2.80, SD = 1.31).
3.7. SEM Conceptual Model
For testing the relationship between three latent variables (economic, social, and environmental impact) based on the concept of sustainable development, a model was created using the dimensions of change presented and analyzed in this study. The economic impact was examined using production outcome, physical capital, and poverty. Social impact was analyzed using seven dimensions: social capital, human capital, health, compatibility, facility, satisfaction, and expectations. The environmental impact was evaluated using four factors, namely beneficial vertebrates, beneficial invertebrates, more trees and shrubs, and more wildflowers along the farmers’ rice fields (
Figure 3).
The initial model resulted in a suboptimal fit with a CFI = 0.856 and RMSEA = 0.113. With the modification indices applied, the fit was improved by allowing additional correlations between the error terms of the observed variables “physical capital” and “poverty”, “social capital” and “satisfaction” as well as between “compatibility” and “satisfaction”. The first additional correlation indicates that financial assets for the farming business and personal expenses are related. If farmers earn more, they will be likely to invest into both factors for their economic development. The two following correlations highlighted the link between satisfaction with 3CT and the effects it has had on the farmers’ social capital and farming practice compatibility. The more farmers were able to share with their fellow farmers, the more satisfied they were with 3CT. Hence, the correlation between social capital and satisfaction concerned the beneficial social element of the technology. The correlation between satisfaction and compatibility highlighted how well 3CT has adapted to the farmers’ needs. Hence, this correlation demonstrated the link between ease of use and a positive adoption experience. The revised model showed an improved overall fit with a CFI = 0.914 and RMSEA = 0.089.
The standardized coefficients are represented along each path. The structural model explained 28% of the variance of 3CT’s economic impact. Furthermore, 40% of the variance could be explained as the social impact of the technology and 10% of the variance of the environmental impact was explained in the model.
4. Discussion
The present study examined the farmers’ perception of changes related to the three pillars of sustainability including economic, environmental, and social impacts in a non-experimental setting of 3CT. For each impact, different dimensions of change were selected. The structural model showed good model fit indices after reducing the structural constraints and allowing covariance relationships between error terms. The model and the structural path analysis will be discussed in detail using the framework of the Agenda 21 sustainability targets [
1,
6,
7,
8].
Farmers perceived many changes with regard to the economic impact of 3CT. The three dimensions for evaluating the economic impact of 3CT—production outcome, physical capital, and poverty—showed high to medium high regression weights with the latent construct economic impact and good reliabilities of the scales (α > 0.600). The production outcome scale had the highest regression weight (r = 0.81) with economic impact indicated to be a strong explanatory variable for economic impact. Farmers perceived positive changes in their production outcome, which could be due to the positive impact of 3CT on the farmers’ yields and financial situation. Our results also showed that since the adoption of 3CT, farmers have been attaining mean yields of above 6 t/ha (min. = 5.1 t/ha, max. = 7.8 t/ha), approaching the national average of 7.0 t/ha [
51], whereas before adopting 3CT, the farmers reached average yields of 5.6 t/ha (SD = 1.0). This is in line with experimental studies that also showed a significant yield increase of 1–1.5 t/ha when using the 3CT [
21,
22]. Furthermore, these results also indicate that 3CT increases nutrient use efficiency under non-experimental conditions [
22]. All participants responded that they had fully adopted 3CT and had not changed the timings of fertilizer application, which is crucial for improving nitrogen use efficiency and reducing environmental pollution [
21,
22]. Overall, farmers in the present study perceived a positive influence on the reduction of fertilizer and pesticide use as well as reduced labor hours and input costs. In 2018, farmers perceived savings of input costs of on average 389.4 USD/ha (SD = 344.6), which includes both fertilizer and pesticide costs, which is in line with the results shown in experimental field trial studies [
21].
Results showed that farmers on average had an added revenue from an increase in yield of on average 915.5 USD/ha (SD =1010.6). However, it needs to be noted that there is high variability in these data. A possible explanation could be the different times of introduction and adoption. Hengli township was the first of the three townships to introduce 3CT, therefore, farmers adopted the technology two to three years earlier than farmers in Ruhu and Luzhou townships. This means that these farmers have had time to become used to the new technology, master its application, and perceive more positive effects over a longer period of time. In fact, the results showed that farmers from Hengli township had attained higher yields and higher total gross income from rice than farmers from Ruhu and Luzhou townships. Studies investigating the adoption of farming technologies and practices have shown that the duration of adoption plays a crucial role in perceiving positive effects [
52,
53]. Taking all production outcome results of the present study into account, it can be interpreted that the participants’ farming business had improved profitability due to increases in production quantities and decreased input costs. These results are consistent with the elements needed for successful and long-term adoption of agricultural practices [
54,
55].
Participants also perceived changes in poverty reduction, which can be further translated into positive financial development. Results of the SEM showed that poverty had a medium high regression weight (r = 0.52) and can, therefore, be seen as a good predictor for economic impact. Farmers from Hengli township, who have adopted 3CT for the longest and reached the highest average yields, indicated a significantly higher reduction of poverty levels compared to the farmers in other townships. Poverty reduction could be attributed to the adoption of 3CT, but could also be a more general development since China has raised its efforts to reduce poverty nationwide [
56]. Most Chinese farmers are not living in conditions of extreme poverty anymore and have been benefiting from significant improvements in infrastructure, public services, and living conditions [
56]. The results of the present study showed that farmers do not invest much in physical capital (m = 2.69, SD = 1.05) for their agricultural production. This could be due to the fact that the farmers in Guangdong Province are rather wealthy, compared to other regions in China and have already been able to establish their farm business including the necessary physical capital [
51]. Consequently, the influence of physical capital on the economic impact of 3CT seems to be rather limited in the Chinese context, which was also shown in the lower regression weight (r = 0.38). Furthermore, results also indicated an association between the variables’ poverty and physical capital, which was shown by the modification indices, allowing a covariance between the error terms. This means that both variables share some parts of the variance; in other words, they are related or are not distinct concepts. Increasing the farmers’ physical capital could have a direct effect on their perception of poverty reduction since poverty is defined as a lack of assets [
57]. In total, all three variables explained 28% of the variance of economic impact. It needs to be noted that the present study did not include aspects related to regional and national economic policy developments, non-farming income, or other financial elements that may also have explanatory value.
The second pillar, social impact was evaluated using seven different variables encompassing internal as well as external social factors. All scales used as variables showed good reliabilities (α > 0.600) and had high regression weights (r > 0.500), indicating their great importance for explaining the latent construct of social impact. In fact, all seven variables together explained 40% of the variance of social impact. Results showed that farmers, in general, perceived high benefits from 3CT. These benefits included saving labor hours and having more free time since adopting the technology, which are included in the variable facility. Furthermore, participating farmers also considered 3CT easy to apply and to fit to their cropping pattern, which is incorporated in the variable compatibility. The variables’ satisfaction and expectations were also included in the model. Results showed that farmers had high expectations but also indicated that they were highly satisfied with the 3CT. Both variables had high regression weights (r > 0.780) and can be interpreted as important predictors for social capital. Therefore, 3CT not only accounts for compatibility and facility, but makes farmers feel satisfied when adopting the technology. These are important components for 3CT adoption in the long term. It has been shown that successful adoption of a new technology or practice has to be compatible with the farmers’ local circumstances and environment [
25,
26,
58]. Based on the literature [
42,
43,
44], subjective knowledge as well as social and human capital were also included in the model as predictors for social impact. Participants perceived themselves to have a great amount of knowledge about 3CT. They also evaluated their perceived social capital to be high. Both variables concerned knowledge and knowledge dissemination and were highly correlated (r = 0.683). This means that participants who perceive that they are highly knowledgeable about 3CT are also able to pass this knowledge on to other farmers. Thus, if a knowledgeable, trustworthy farmer in the community speaks highly of a new technology or practice, other farmers are more likely to follow [
52]. Hence, the diffusion of the new technology or practice through the community will be accelerated [
52,
55]. Studies have suggested that education and social capital are important elements for the successful adoption of sustainable agricultural practices [
52,
55]. Networking with peers, businesses, and agencies as well as interpersonal contact have also been shown to be important factors influencing the adoption of sustainable agricultural practices. In particular, farmer-to-farmer communication has been described to be a significant predictor of best management practice adoption [
52,
55,
59]. The variable human capital focused on the farmers’ personal knowledge acquisition and the use of this additional knowledge. Farmers generally evaluated their gain in human capital highly. Human capital also had a very high regression weight (r = 0.85) and is, therefore, an important factor for social impact. Other studies have also shown that the adoption of best management practices can have a positive effect on acquiring human capital [
43,
44]. Another aspect of social impact is the change in the farmers’ health. Participants of the present study perceived positive changes in their health status. Reductions in fertilizer and especially pesticides have been shown to have a positive effect on the health of farmers [
60]. It can be concluded that the adoption of 3CT has had a positive social impact and has considerably improved the farmers’ livelihoods.
The third pillar of sustainability concerns the environment. The present study focused on biodiversity to explain this latent construct of environmental impact. Faunal variables (beneficial vertebrates and invertebrates) had lower regression weights than the floral variables (wildflowers, trees, and shrubs). Nonetheless, since both types of biodiversity are important for ecosystem services, we would argue to include them in impact assessment, but possibly refining them further. Farmers perceived more beneficial vertebrates and invertebrates since adopting 3CT. However, farmers in Hengli township, who used 3CT the longest, perceived more beneficial vertebrates and invertebrates. This result suggests that the longer farmers practiced 3CT, the more beneficial the biodiversity changes they perceive. This finding further suggests that more time is needed to evaluate the technology’s full effect on biodiversity changes and that species need time to re-enter ecosystems that are less polluted. Farmers of the present study generally did not perceive many changes in floral biodiversity; however, it needs to be noted that farmers were provided with pictures for faunal biodiversity but not for floral biodiversity. Therefore, it is not clear if they were not sure about what was meant by wildflowers, trees, and shrubs, and hence, were not able to evaluate them correctly. Another aspect that was not accounted for in this study was herbicide use. If farmers used herbicides, this could have had a negative effect on the floral biodiversity [
61,
62,
63].
The four variables for environmental impact explained 10% of its variance. It could be argued that this is rather low. However, the selected environmental factors used in the present study focused solely on biodiversity changes and thus excluded other environmental changes related to water, soil, and the atmosphere. These environmental aspects should not be neglected in a rigorous impact assessment, but would have been out of the scope of the present study since perceptions of these elements are difficult to assess. Therefore, these findings only indicate a partial view to the environmental impact of 3CT. Nevertheless, it is important to point out that biodiversity is vital to deliver ecosystem services to humanity. It makes agricultural production and farmer livelihoods more resilient to shocks and stresses, particularly to the effects of climate change. Therefore, the main effort to protect biodiversity is the reduction of environmentally harmful external inputs such as chemical fertilizers and pesticides [
61,
64]. Recently, efforts to conserve biodiversity in China have started because the majority of Chinese ecosystems are estimated to be of low habitat quality [
61]. In this context, biodiversity levels need to be further monitored in order to create evidence on the effects of 3CT and the recovery process of rice field biodiversity levels.
The present study outlined and tested a conceptual model to investigate the three aspects of sustainable development described in the Agenda 21 sustainability targets [
1,
6,
7,
8]. It became clear that economic and social impact are closely related, which was shown by the very strong correlation between the two latent constructs of economic and social impact (r = 0.960). However, we argue that it is important to analyze these two impact areas separately to also focus on aspects that are not solely related to economic matters in order to have a more holistic view of the different aspects of sustainable development. Most impact studies focus on economic impact, which is important to assess the economic value of new technologies and practices, but neglect other parts of sustainable development such as social and environmental aspects [
52,
54,
65]. Nonetheless, sustainable development is a holistic concept integrating economic, social, and environmental aspects as well as institutional elements [
1,
6,
7,
8]. Accordingly, social factors such as health, human, and social capital, and environmental factors such as biodiversity, soil health, water and atmospheric conditions, which are not necessarily driven by attaining an economic goal, need to be assessed to ensure sustainable development [
54]. Social factors are particularly important for the adoption of conservation technologies. Social processes take place in order for farmers to decide on the adoption of a new technology or practice. Hence, the adoption of agricultural practices is strongly driven by feedback from the family, the community, and personal perceptions on the environment [
52,
54,
66].
Some limitations need to be noted. The present study was conducted in a small part of China, in the district of Huicheng, Guangdong Province. Therefore, the results obtained in the present study represent the cases of farmers benefitting from the World Bank’s non-point source pollution project. The sample size of the present study was limited and sampling was not conducted randomly. Furthermore, the average age of farmers was high; farmers generally had high incomes and diversified income sources. Therefore, the results may not represent the entire Chinese rice farming population. It also needs to be noted that all data rely on recall and self-reported measures and are therefore susceptible to biases such as recall bias and social desirability bias.


