1. Introduction
The Intergovernmental Panel on Climate Change (IPCC) report “Global Warming of 1.5 °C” issued a dire warning that unless CO
2 emissions are halved by 2030, devastating changes will occur on land and in ocean irreversibly and sooner than expected. The buildings and construction sector should be a primary target for Green House Gas (GHG) emissions mitigation efforts; total buildings-related CO
2 emissions amounted to more than 11Gt CO
2 in 2018 or 39% of the global energy-related emissions, when energy-related emissions from buildings construction (i.e., manufacturing of building materials) are included. In the case of low-energy buildings and net-zero energy buildings embodied energy had high contributions, the former up to 46% [
1].
The current building energy efficiency standards aim to reduce energy consumption during building operations. With the promotion of low-energy and near-zero-energy buildings, the environmental impacts of upstream and downstream during use have been widely concerned [
2,
3,
4]. Scholars have studied the building environmental impact from three levels: building materials, building components and entire buildings. A large amount of literature has studied the impact of building materials and the entire building on the environment without paying enough attention to building components. In the early days, the impact of general building materials (such as concrete, hollow blocks, and common insulation materials) from the cradle to the gate was mainly studied on the environment [
5,
6,
7]. At present, the research on building materials has two directions. The first is to study the environmental impact of the production process of new building materials [
8,
9]. Casas-Ledón Y. et al. [
10] studies on environmental issues related to the manufacture of new insulation materials (panels) made from eucalyptus bark fibers showed their lower embodied energy and carbon emissions than traditional insulation materials. Nguyen H. et al. [
11] investigated the greenhouse gas emissions and embodied energy of fiber-reinforced alkali-activated asbestos composites, and suggested that the production process at 120 °C for 2 hours is the best way attaining balance among energy spent, mechanical properties, and CO
2 footprint. The second is to study the environmental performance of building materials at other stages of the life cycle based on the entire building [
12,
13,
14,
15]. Taking the reconstruction of a Portuguese school building as an example, Brás et al. [
16] evaluated and compared the energy consumption and CO
2 emissions of three thermally enhanced mortar buildings during the manufacturing and use phases. Sözer H, et al. [
17] Proposed a structured approach to address the environmental impact of waste recycling and studied three types of thermal insulation materials recovery schemes in the waste phase of residential buildings in Switzerland.
The focus of the research has evolved from building materials to the entire building, mainly including evaluating the environmental impact of a building over its entire life cycle, comparing the environmental performance of building solutions and optimizing the building design from an environmental perspective. Jieqing S. et al. [
18] studied the CO
2 emissions of an office located in a subtropical region within the 50-years of service time and provides energy consumption data in order to show the total carbon emissions during the entire lifetime of the building. Pomponi et al. [
19] assessed the energy consumption and CO
2 of a building using 128 double skin façade configurations during lifetime and tested the hypothesis that double-skin facades can be applied for the office refurbishment due to their great life-cycle environmental performance under certain conditions and for an optimal solution. Further in, Kiss B. et al. [
20] developed a modular parametric optimization framework combining advanced building modeling, Life Cycle Assessment (LCA), energy calculation and single- and multi-objective environmental optimization and applied it to a multi-apartment house in Hungary with four variables of design parameter.
It is not difficult to see that the literature lacks research on the environmental impact of building components. Only a few scholars, such as Ben-Alon L. [
21] and Shadram F. [
22], have studied the environmental impact of wall components. Building products are a general term for different products in different stages of the building’s life cycle, including building materials, building components, and buildings. Building components have relatively independent functions and are located between the building materials and the building.
From the perspective of energy conservation, many researches on the environmental impact of building components were attached to a building. Azari R. et al. [
23] explored optimum building envelope design with respect to energy use and life cycle environmental impacts from insulation material, window type, window frame material, wall thermal resistance, and window-to-wall ratios in a low-rise office building. Ylmén, P. et al. [
24] conducted a parameter study of the building envelope insulation thickness regarding global warming potential and life cycle costs on the typical building case in Sweden. Volf M. et al. [
25] developed an environmentally friendly alternative to aluminum curtain wall systems by altering materials on one refurbishment building. These researches were still the study about environmental impact and envelope design on a whole building. A study on building envelopes as independent environmental impact objects throughout the life cycle is lacking.
The design factors of the envelope structure included the physical parameters such as building material types [
25,
26], thermal insulation layer thickness [
24], wall thermal resistance, and window wall area ratio [
23], and rarely involved the extended parameters such as transportation distance, climatic conditions, and construction energy consumption. In actual engineering, there are many different construction schemes for the same heat transfer coefficient. Different construction choices can lead to differences in material selection, transportation, maintenance and renewal, and waste disposal and ultimately cause different environmental impacts throughout the life cycle. Of course, in determining the heat transfer coefficient, the environmental impact of the entire life cycle of the envelope structure should also be considered.
First, based on the technical framework provided by ISO14040 [
27], a pre-assessment model is proposed for the environmental impact of the entire life cycle of building envelopes, which takes the envelope per unit area as the research object and is related to the physical parameters and the extended parameters. Through the sensitivity analysis of this model, the significance and importance of the parameters are determined. Then, in the case study of thermal insulation walls and windows in heating areas, the relationships between environmental assessment results and location climate, heat transfer coefficient, material type, transportation distance, and life cycle stage were analyzed in turn. Finally, the paper discusses the evaluation results and draws conclusions.
2. Calculation Model
2.1. Overview
The calculation model was developed according to the life cycle assessment method in ISO14040. It can be used to assess the environmental impact of building envelope functional units. A functional unit is defined as a building envelope of m2 with a given heat transfer coefficient within its 50-year service life. The life cycle of a building envelope includes five stages, namely, the production and transportation of building materials and the construction, use, and disposal of building components.
The production stage (m) of building materials includes the extraction of raw materials and the production process of building materials. The transportation stage of building materials(t) includes the transportation process of building materials from factory to construction site. The construction phase (c) mainly includes the use of on-site construction machinery. The use phase (u) includes two parts, one is the loss of cooling and heating through the envelope during use, and the other is caused by the replacement of building components during use and is calculated by the replacement coefficients [
28]. In the disposal phase (w), only the landfill of construction waste is considered, because the recyclable building materials are reused or recycled.
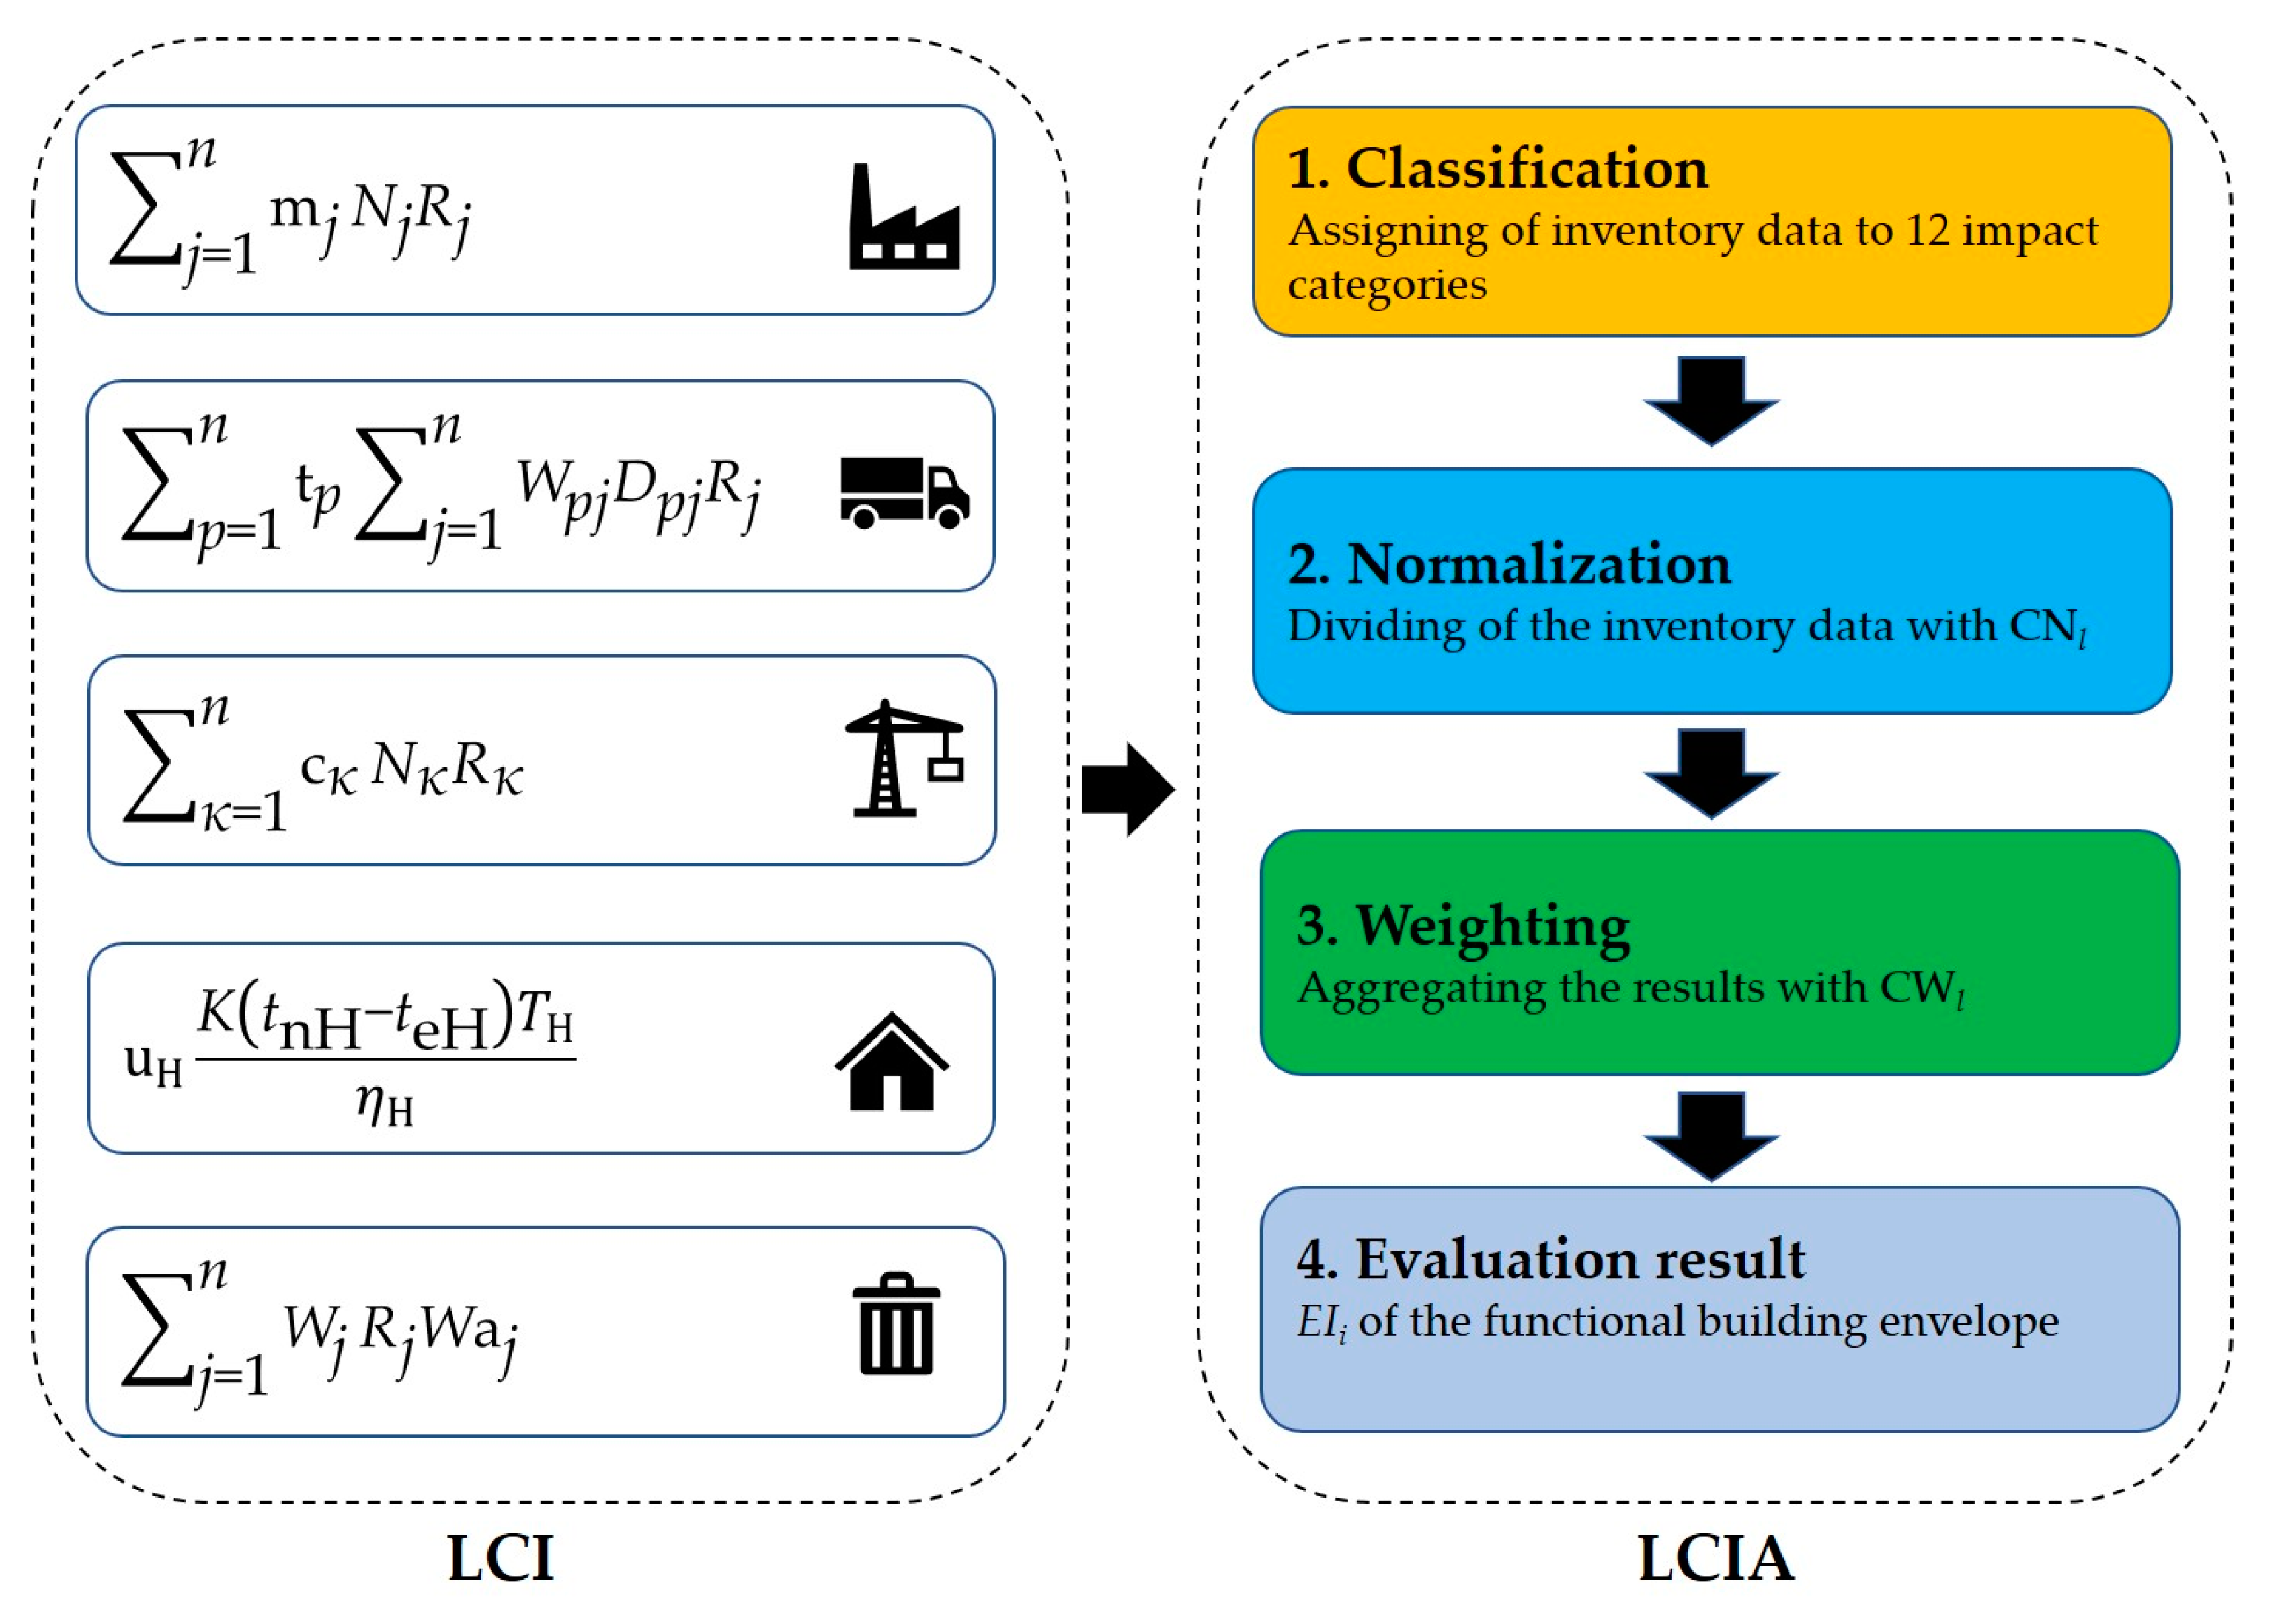
The calculation model consists of two components: Life Cycle Inventory (LCI) and Life Cycle Impact Assessment (LCIA). The workflow of evaluation for substance
i is in the
Figure 1. Counting the amount of consumption or emissions of substance
i of a functional unit at five stages in LCI. Processing the total amount of substance
i to enable the result to visualize the environmental impact level in LCIA. The
EIi of the whole input and output substances are accumulated, and the environmental indicator (
EI) of one functional unit is obtained.
2.2. Inventory Model
Inventory model is used to statistically calculate the quantities of resources, energy, and emissions of a functional unit at the five stages. The model can be expressed by the following set of equations:
where
QE is the inventory of Life Cycle Environmental Impact (LCEI) of a functional unit,
are the inventories of LCEI at the five stages of life cycle, respectively.
Thus, the inventory of LCEI of the substance
i can be written as,
where
i is the substance affecting the environment during the life cycle of a functional unit, which includes resources, energy, and emission.
is the quantity of
i generated during the lifetime of building envelope.
are the quantities of
i generated during the five stages of life cycle, respectively.
2.2.1. Production of Building Materials
The quantity of the substance
i generated during the production process of a functional unit can be estimated by,
where
j is a building material used in a functional unit; m
j is the quantity of
i generated in order to produce unit amount of building material
j;
Nj is the amount of building material
j of a functional unit, and
Rj is the replacement coefficient of building material
j.
Building envelopes include transparent part, such as doors, windows, and curtain wall and non-transparent part including external wall, roof, and ground. The transparent building envelopes can be decomposed into frame materials, glass, and other auxiliary materials according to the design drawings, and their corresponding quantities are calculated. The opaque envelope is mainly composed of a structural layer, an insulating layer, and a surface layer. Non-transparent building envelope can be split according to “envelope–layer–material”. The process from material to layer requires workers to use construction machinery according to drawings.
“Uniform Basic Norms for National Construction Projects” [
29] (UNBNCP, version 1) was issued in 1995 by Ministry of Housing and Urban-Rural Development (MHURD) and was continuously updated. In order to regulate the preparation of the budget, it is a standard for the calculation of construction volume and specifies the required amount of labor, building materials, and construction machinery for completing a unit construction volume. LCA is a pre-assessment at the design stage. It is feasible to decompose the envelope into building material
j and corresponding quantity
Nj, construction machinery
k and corresponding quantity
according to the general data of UNBNCP. Studies have shown that the environmental impacts of building materials can be neglected, in case their weight is less than 2% than the weight of a functional unit [
30]. Materials such as glass fiber fabric, rubber powder, expanding agent, etc., are not included in this study.
Some layers of the building envelope, such as surface layer, insulating layer, waterproof layer, doors and windows, need maintenance and replacement during their 50-years of service life, which leads to a fold increase in the number of building materials, construction machinery, transport, and disposal. Thus, this increased environmental loading can be fully considered in the model by introducing replacement coefficients
for building materials and
for construction machinery. The replacement coefficients are calculated by,
are the integer. If the number of decimal places is greater than 0, 1 is added to the integer part, because the last replacement may waste the lifetime of building components. Taking a lifetime of 15 years as an example, the replacement coefficient should be 4.
2.2.2. Transport of Building Materials
The quantity of the substance
i generated during the transport of building materials can be calculated by,
where
is the quantities of the substance
i generated by transporting per unit cargo turnover through gasoline truck (GT), diesel truck (DT), diesel locomotive (DL), electric locomotive (EL), small ship (SS), and large ship (LS), respectively.
Wpj is the weights of building material
j by the cargo way
p;
Dpj is the distance of building material
j by the cargo way
p. Railway and water transportation are mainly used for the long-distance transportation of bulk cargoes from the station to the station. The distribution of trains and ships is uniform, and no empty cars will return. Road transportation is used to resolve the transportation of goods from the transportation station to the designated location (manufacturer factory, construction site). Because of the customized route, there is the possibility of returning by empty car [
31]. Therefore, 1.67 is the environmental load factor of an empty returned vehicle for road transport (it is generally 0.67 times the fully loaded vehicle [
30]).
2.2.3. Construction of Building Envelopes
The construction process of the envelope structure counts the pollutant emissions generated by the construction machinery’s consumption of fuel and electricity on site. It should be noted that the on-site construction of door and window projects only includes the installation of door and window frames and glass, and does not include the manufacture. The freshwater resources consumed during the construction of walls, roofs, and floors are counted as a building material in “production of building materials” above. The quantity of the substance
i generated during the construction of envelopes can be calculated by,
where
k is the machines for building construction; c
k is the amount of
i generated per machinery one-shift (one machine works 8 hours is machinery one-shift);
Nk is the number of the machine
k; and
Rk is the replacement coefficient of the machine
k.
k and
Nk are determined as per the UNBNCP.
2.2.4. Use of Building Envelopes
The building envelope is considered as a medium for indoor and outdoor heat exchange; its energy consumption is related to climatic conditions, insulation performance, and the efficiency of the equipment. Therefore, one-dimensional steady-state heat transfer is used to calculate the heat and cooling loss of the envelopes. Although the calculation accuracy of the steady-state heat transfer method is not as good as that of dynamic energy calculation, it has been widely used in Chinese engineering practice and energy-saving design codes due to its simplicity [
32,
33]. The simplified algorithms are sufficient for research purposes in this paper.
The amount of substance
i produced at the envelope use stage when building heating conditions can be calculated by,
where
is the quantity of
i produced for using 1 kg standard coal;
is the heat loss through one m
2 envelope during its 50-years of service life;
K is the heat transfer coefficient of the envelope and has been given in functional unit definition;
is the indoor temperature in winter and usually assumed as 18 °C;
is the mean outdoor temperature during the heating period;
is the hours of heating period; and
is coefficient of performance of heating system.
When building cooling conditions:
where
is the quantity of
i produced for using 1KWH electricity;
is the cold loss through one m
2 envelope during its 50-years of service life;
is the indoor temperature in summer and usually assumed as 26 °C;
is the mean outdoor temperature during the cooling period;
is the hours of cooling period; and
is coefficient of Performance of cooling system.
are given in national or local energy-saving design codes that must be adhered to in every building design. are usually the average efficiencies of similar systems in a certain area.
2.2.5. Disposal of Building Envelopes
At the demolition stage, only quality of construction waste is calculated as follows:
where,
Waj is the waste generation rate of building material
j and found be 0 for recyclable building materials, such as steel, glass, wood, etc. and 1 for non-recyclable building materials, such as concrete, building block, mortar etc.
2.2.6. Environmental Impact List
In the design phase of insulation building envelopes, the required environmental impact list is not a certain one but a certain type of building product, which matches the degree of certainty of the conceptual design scheme.
are the quantities of the substance
i generated by one unit in different stages. In the absence of environmental statistics published by national authorities, this paper obtains these data from relevant papers, journal articles, publications, and statistical yearbooks. The data are shown in
Appendix A (
Table A1) and
Appendix B (
Table A2).
2.3. Evaluation Model
The building envelope consumes a lot of mineral resources and energy during the production of building materials; consumes fresh water during the construction process; and also includes wood in doors, windows, and exterior walls. Therefore, by comparing the Environmental Protection Agency (EPA) and Society of Environmental Toxicology and Chemistry (SETAC) schemes and taking into account the above characteristics, 11 categories of environmental impacts were identified throughout the life cycle of the building envelope. The evaluation model for building envelopes attempts to classify the inventory data obtained into eleven different environmental impact categories. In each category, the substances are transformed and aggregated into different types of characteristic substances. Afterwards, by taking Chinese energy and resource consumption per capita and pollutant discharge per capita in 1990 as baseline values, the values of the characteristic substances of eleven categories are normalized to dimensionless quantities to which different weighting factors are assigned according to their importance, so that the single comparable environmental indicator (EI) can be obtained.
The
EI of building envelopes can be determined by the formulas as follows:
where
EI is the indicator of the LCEI of building envelope;
represent the different stages of building cycle, i.e., production and transport of building materials, construction, use, and disposal of building components, respectively;
is the environmental indicators for environmental impact category
l;
l is the environmental impact categories wherein eleven categories, such as global warming, ozone depletion, etc., are selected according to the feature of the building envelopes (
Table 1);
is the characterization coefficient of substance
i;
is the baseline value of per capita equivalent of category
l; and
is the weighting factor of category
l.
This paper chooses internationally recognized equivalent substances and characterization coefficients in the process of characterization to analyze the potential impact of different loads or emissions on various environmental problems. Taking the impact of global warming as an example, the greenhouse effect caused by CO
2 accumulation in 100 years is selected as the benchmark, and the equivalent factor model developed by the World Climate Control Commission is used to calculate the characteristic coefficients of other substances compared with CO
2.
divides the total impact potential of an environmental impact type in the 1990 reference area by the total population of the reference area and obtains the per capita impact load representing an environmental impact type, i.e., the per capita equivalent reference value.
is the weight of each environmental impact type calculated by Analytic Hierarchy Process. By investigating the relative importance of environmental and construction professionals to these 11 types, a judgment matrix for pairwise comparisons was constructed, and the weight of each type of environmental impact was calculated. The values of
are given in
Table 1.
2.4. Model Verification
In the model, there are 12 independent variables (j, k, p, N, K, D, W, R, te, η, T, and Wa) and 3 dependent variables (E, Q, and EI). A total of 52 cases were calculated by this model from 5 cities in sub-climate zones of heating area (Qingdao, Weifang, Harbin, Shenyang, and Heihe), 2 insulation materials (EPS and Rockwool), 2 block wall materials (sand-lime brick and aerated concrete block), 18 values of K, 6 kinds of freight p, 3 values of R, 11 values of D, and 1 value of Wa (Wa = 1). Through the analysis of data by Statistical Product and Service Solutions (SPSS), the following conclusions are obtained: (1) The location, K, block wall materials, and the distance of transport and insulation materials have significant effects on the dependent variable EI (sig. < 0.05), and their regression coefficients are 0.723, 0.674, 0.412, 0.158, and 0.114 respectively. (2) The freight ways and the service life of the components have insignificant effects on EI. Therefore, the model can be used for the design of the envelope structure for the purpose of the life cycle environment. The insulation performance of the envelope structure, the choice of building materials, and the distance of transportation could be optimized in the design process.
3. Case Study
In China’s heating districts, the heat loss of the wall accounts for 60% to 70% of the heat loss of the envelope structure, and the heat loss of the windows accounts for 20% to 30% [
37]. Taking insulation walls and windows as examples in the energy-saving design of the envelopes, the impact of the following three conditions on the entire life cycle environment needs to be evaluated.
(1) Building envelopes with same heat transfer coefficient.
The building energy-saving design code specifies the limits for the heat transfer coefficient of building envelopes in different areas. When choosing the solutions that meet the requirements of the limit, the architect tries to choose the solution that has a smaller life cycle environmental impact.
(2) Building envelopes with different heat transfer coefficients.
In order to design more energy-efficient buildings, the thermal performance of the building envelope should be improved. This will increase the number of construction materials and construction machinery before revolutionary new materials. The architect should choose the appropriate heat transfer coefficient of the envelope based on the environmental impact of the entire life cycle.
(3) Composited building envelopes with same average heat transfer coefficient.
The window-to-wall ratio of a wall is an important part of architectural design, and is usually designed based on energy saving, lighting, and sight. The calculation model in this article provides a way to optimize design from environmental impact. A functional unit is defined as a 1-square-meter façade that has a given average heat transfer coefficient (Ka) over its 50-year service life and consists of windows and walls. Generally, the environmental impact of 100 functional units is calculated, when it is difficult to define the facade of 1 functional unit structurally.
3.1. Building Envelopes Located in Different Climate Zones
There are two climate zones and five sub-climate zones in the heating area of China. Climate is one of the most significant factors for
EI. Taking the typical construction design of thermal insulation exterior wall as an example, the influence of climate on
EI is studied.
Table 2 shows the typical cities in five sub-climate zones, and the data of
K value, the structure design of aerated concrete block Rockwool wall (ACBRW) and transport.
Figure 2 shows the
EI of ACBRW of
K = 0.45 (W/m
2·K) in 5 typical cities of sub-climate zones. The
EI results indicate that the environmental impact caused by the energy consumption during the use in the heating area is the largest, and its proportion increases from 92.0% to 98.0% as the climate becomes colder
3.2. Walls with Different Heat Transfer Coefficient
Aerated concrete block wall 200 mm thick with EPS insulation board is widely used in China. The thickness of the insulating layer increases as
K decreases. In the construction practices of this typical insulation wall (ACBEW), the environmental performances of envelopes with different
K values from 2.0 (W/m
2·K) to 0.04 (W/m
2·K) are researched in Weifang. The assumptions of the method and distance in the transport phase are 200 km by the gasoline truck.
Figure 3 shows the
EI of ACBEW for
K from 2.0 (W/m
2·K) to 0.04 (W/m
2·K). With the reduction of
K, the
EIu decreases from 43.18 to 0.89, and the
EIm increases from 0.65 to 5.10. When
K is 0.1 (W/m
2·K), the
EI is the smallest in
Figure 2.
3.3. Walls with Same Heat Transfer Coefficient (K = 0.3 (W/m2·K))
In engineering practice, EPS and Rockwool are commonly used as thermal insulation materials, sand-lime bricks. and aerated concrete blocks as infill wall materials. ACBRW, ACBEW, sand-lime brick EPS wall (SLBEW), and sand-lime brick Rockwool wall (SLBRW) are four optional construction schemes of the insulation wall with
K = 0.3 (W/m
2·K) in Shenyang, assuming a transport distance of 200 km by the gasoline truck.
Figure 4 shows the environmental performance of different construction schemes with
K = 0.3 (W/m
2·K).
EI of ACBRW, ACBEW, SLBEW, and SLBRW are 12.21, 13.03, 19.15, and 20.16, and the variation mainly results from the different environmental performance during production, transportation, and disposal with the different materials.
3.4. Windows with Same Heat Transfer Coefficient (K = 2.0 (W/m2·K))
Windows with the heat transfer coefficient of 2.0 (W/m
2·K) are available in two products as shown in
Table 3, which gives the basic data of 1-m
2 plastic steel window (PSW) and wooden window (WW) during its 50-years of service life in Weifang.
Figure 5 shows the
EI of PSW and WW at different stages. The
EI of wooden window is 46.28, which is 1.91 more that of plastic steel windows. The
EIt and
EIm of WW are 0.15 and 2.95, respectively, which are obviously higher than 0.09 and 1.09 of PSW.
3.5. Composited Building Envelopes with Same Heat Transfer Coefficient (Kav = 1.07 (W/m2·K))
The combination of one plastic steel window and two insulation walls is two facades with different window-to-wall ratios of 0.5 and 0.4 and an average heat transfer coefficient of 1.07 (W/m
2·K). One facade is 50 m
2 PSW windows and 50 m
2 ACBEW (
K=0.15(W/m
2·K)), and the other facade is 40 m
2 PSW windows and 60 m
2 ACBEW (
K = 0.45(W/m
2·K)).
Figure 6 shows the environmental performance of composited building envelopes with same heat transfer coefficient. The facade with larger windows and thicker walls has a greater impact on the environment.
EI of 0.5PSW + 0.5ACBEW is 25.49, which is 0.55 more than 0.4PSW + 0.6ACBEW. The
EI of 0.4PVC + 0.6ACBEW is 40% of
EI of PSW with =2.0 (W/m
2·K) and 60% of
EI of ACBEW with =0.45(W/m
2·K), which is the simplified method by area weighting.
3.6. Discussion
(1) Location and EI.
The location is a major factor in determining environmental performance throughout the life cycle in the heated area. The EI of the envelope during the whole life and use increases with the degree of coldness. When the K value of the envelope is reduced in chilly cold regions, the decrease of EI is significantly greater than that in cold regions.
(2) K and EI.
The heat transfer coefficient K is the most important of the three design variables for EI. The decrease of K value causes the decrease of EIu and the increase of EIm, EIt, EIc, and EIw. The variable K has a critical point to decrease, and as K decreases further, EI increases instead. The critical point is the optimal solution for the variable K for the life cycle environmental impact.
(3) Choice of Building Materials and EI.
In the case of the same K value, the choice of material will affect the EI in other stages except for the usage. The performance of the environmental and thermal insulations of EPS and aerated concrete blocks are better than those of Rockwool and sand-lime bricks. The ACBEW should be preferred for thermal insulation exterior walls. The environmental performance of PSW is better than WW during production and transportation. Due to the shortage of wood resources, the EIm of wooden windows is much higher than PSW. PSW should be preferred for the energy-saving window.
The
EI of ACBEW with
K = 2.0 (W/m
2·K) is 44.19 in
Figure 3, which is less than the
EI of PSW and WW with the same
K in
Figure 5. The environmental and thermal insulation performance of ACBEW is better than PSW and WW. Combined with the results in
Figure 6, the larger the window size, the greater the environmental impact of the same
K facade.
(4) Transportation Distance and EI.
The transportation distance of building materials has a significant impact on the life cycle environment. To further quantify the impact of the transportation distance and take ACBRW in
Figure 2 as an example, the proportional curve of
EIt is drawn according to the change of transportation distance and project location, as shown in
Figure 7. With the increase of
D, the proportion of
EIt to
EI becomes larger. This increase is particularly pronounced in warmer districts of the heating areas. Long-distance transportation of regional building materials is an important factor for
EI.
(5) Importance of Different Stages.
Figure 8 shows the proportions of environmental impact in 5 stages, the data of which are from 52 cases in the model verification section. The 52 cases are a collection of various independent variables, and the importance of stages could be reflected by the median and median values. The figure shows their importance: usage > production > transportation > disposal > construction. Since the amount of construction machinery used is less and most are small machines, the environmental impact during the construction phase is minimal.
(6) Applicability for the optimal design.
EI is a dimensionless, single evaluation result, which makes it easier for architects to optimize the design of the energy-saving envelopes. Case studies show that the model can optimize in terms of heat transfer coefficient, structure, window-to-wall ratio, choices of building materials, and manufacturer.
(7) Further research.
The building is made up of building components. The Case with different window-to-wall area ratios suggest that the EI of sub-component can be used to calculate the EI of a component and even simplify its environmental assessment process of a whole building. In the future, through different definitions of functional units, the building components data can be established including their attributes (such as space, structure, lighting, acoustics, etc.) and environmental performance. The entire building can be quickly evaluated and optimized by the data.
4. Conclusions
The evaluation model can be used to optimize the envelope structure from two performance of energy-saving and environment. This design involves two design variables (K and D) and their expansion (choice of building materials, window-to-wall area ratio, etc.). The method of defining functional units from thermal insulation attribute can be used to evaluate building components of other attributes in the life cycle and further study the environmental impact of the entire building.
K of building envelope is the parameter of the greatest impact on environmental performance and has a greater impact on the environment in colder districts of the heating areas. K has a critical value, which is the value that has the smallest environmental impact over the entire life cycle. It is necessary to research an environmental impact during a life cycle in establishing the standards of K for the insulation building envelope. The building material of good performance of the environmental and thermal insulation should be selected for the insulation envelopes. Aerated concrete EPS walls and wooden windows are the first choices for envelope construction from the environmental impact throughout the life cycle.
In the life cycle environment, the use phase and production phase of the building envelope are undoubtedly the most important, followed by the transportation and disposal phase. The environmental impact of the construction process of the thermal insulation wall could be negligible. The choice of building materials should consider the transportation distance, which may be the key factor determining life cycle environmental performance.


