Abstract
For more efficient development planning, food-energy-water (FEW) nexus indicators should be provided with higher spatial and temporal resolutions. This paper takes Zhangye, a typical oasis city in Northwest China’s arid region, as an example, and uses the unweighted, geometric mean method to calculate a standardized, quantitative, and transparent estimation of the FEW nexus for each county. The role of influencing factors is also analyzed. The results showed that (1) the coordination of the FEW nexus in each county gradually increased from 2005 to 2015. Spatially, the distribution of the FEW nexus showed a tendency to be higher in the southwestern region and lower in the northeastern region. (2) Food security and water security were weaker than energy security. Specifically, there were more limitations to food accessibility, water availability, and water accessibility than for other indexes. (3) The FEW indexes are positively associated with per capita GDP (Gross Domestic Product) and negatively correlated with the average evaporation and altitude of each county (district). Decision makers should concentrate on combining industrial advantages, developing water-efficient ecological agriculture, and improving production quality to increase market competitiveness and should actively explore the international market.
1. Introduction
As the most fundamental resources of economic and social development [1,2], food, energy, and water are closely interrelated [3,4,5,6,7,8,9]. With the growth of the population, urbanization and climate change as well as people’s demand growing for food, energy and water, it is estimated that the nine billion people living on earth will need 30% more water, 40% more energy, and 50% more food to survive by 2030 [7,10,11]. This will give rise to enormous challenges in accessing sufficient food, energy and water, especially in regions that are shortage of water resources [7,12], leading to the competition between food and energy production. Therefore, it is of vital importance to manage the synergies and trade-offs among the food, energy and water.
Since the Bonn conference of 2011 proposed the food-energy-water (FEW) nexus approach to increase efficiency, reduce trade-offs, build synergies, and improve governance across sectors, the FEW nexus have increasingly drawn worldwide attention [7,13,14]. From that point forward, research on FEW nexus has been reported in great detail. In particular, since 2016, an increasing number of papers related to FEW nexus have been published. There are both qualitative and quantitative studies. In terms of qualitative research, some scholars propose that water, energy, and food interact and have intricate interrelationships [15,16,17]. Some researchers indicate that comprehensive thinking should be used to solve the problems and challenges between FEW and to serve the sustainable development of the social economy and resource environment [14,18,19,20]. Some scientists compare the functions and deficiencies of the existing nexus modeling methods and aim to enable decision makers to determine the tools that best suit their research needs and goals [6,21,22,23,24,25]. In quantitative studies, in the aspect of research scale, Willis et al. develop a global Pardee RAND (nonprofit corporation in America at https://www.rand.org/) food-energy-water security index (FEW Index) to provide information for development agencies and others studying food, energy, and water resources [9]. Some scientists try to manage the water-energy-food nexus at the regional scale [11,26]. Some researchers quantify the water-energy-food nexus at the watershed scale [7,8,10,27,28,29]. Li et al., Bai et al., and Wang et al. analyzed China’s water-energy-food nexus at the national scale [2,30,31]. Gondhalekar and Ramsauer operationalized the urban water-energy-food nexus for climate change adaptation in Munich, Germany [32]. Hussien et al. developed an integrated model based on a survey of 419 households to capture the interactions between WEF at the end-use level in household scale [33]. The details of these studies can be summarized as follows: scholars establish FEW nexus analysis frameworks and models, quantify the interrelationships between FEW nexus and explore methods for analyzing and simulating FEW nexus from the aspects of economics, statistics, and system dynamics [2,7].
However, there are some gaps in the current literature. First, there are relatively few higher resolution studies on a county scale in the existing articles. In practice, the process of resource management depends more on smaller scale evaluation results. Second, there are few studies on analyzing the spatiotemporal distribution and driving forces of FEW nexus from the perspective of geospatial. The variation in FEW nexus is closely related to socioeconomic factors and natural conditions. The spatial distribution characteristics of FEW nexus and the influence mechanism of geospatial on FEW nexus can be more intuitively revealed from a geographical view. Once again, the selection and calculation of indicators in the current quantitative methods are relatively complicated and not concise. For example, assigning weights to indicators is a major challenge [34]. Finally, the internal mechanism of the FEW nexus is unclear.
Therefore, this study takes six counties (districts) of the Zhangye city as typical cases and uses an unweighted, geometric mean to calculate the FEW nexus indexes from a more intuitive and simple perspective in 2005–2015. The simple combination of indicators can allow us to easily understand the influences of these basic resources on the development of human beings. It also uses geographical information system (GIS) to analyze the spatiotemporal distribution characteristics of FEW nexus indexes from a view of geospatial and reveals the influence mechanism of geospatial on it by using multiple stepwise linear regression to diagnose the influencing factors of it in each county (district) of Zhangye. The results of this study fill the gap in analyzing FEW nexus from a geospatial perspective and offer a basis for policy makers to manage FEW nexus efficiently, coordinately and environmentally friendly through the analysis of the influence mechanism of it. It also provides a reference for the development of similar agricultural areas.
2. Materials and Methods
2.1. Study Area
Zhangye, an artificial oasis, is located in the midstream of the Heihe River Basin (97°20′ E~102°12′ E, 37°28′ N~39°57′ N), which is the second largest inland river in the arid region of Northwest China [35,36], and is characterized by irrigated cropland [37,38]. The highest and lowest altitudes of this region are 5565 m and 1200 m, respectively, and topographically, the northwest is lower than the southeast (Figure 1). The area of the Heihe River Basin in Zhangye city was 10,009 m2, the average flow was 66 m3/s, and the annual runoff was 2.082 billion m3 in 2015. The annual mean air temperature ranged from 4.9 °C to 9.5 °C, and annual precipitation was approximately between 113 mm and 422 mm, while potential evaporation reached 1384–1861 mm in this region in 2015. The region administers one district and five counties, which are Ganzhou District, Linze County, Gaotai County, Minle County, Shandan County, and Sunan Yugur Autonomous County (hereinafter referred to as Sunan County), including 60 townships and 836 villages, with a population of 1.22 million residents. Most of the farmland in this district and counties depends on water for irrigation, which is extracted from the Heihe River and groundwater. Agricultural production serves as a pillar supporting social and economic development, while water is an important limiting factor controlling food production [39,40]. Recently, the population’s increasing growth and the rapid development of the economy in the city have intensified water shortage problems, leading to serious ecological degradation downstream of the Heihe River basin [7].
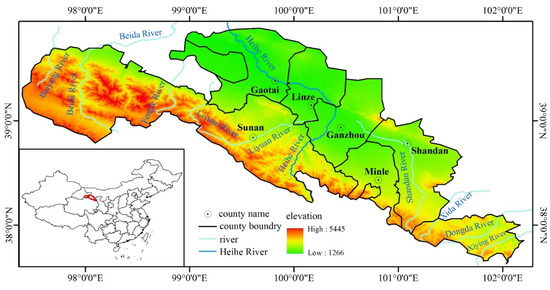
Figure 1.
A sketched map of the study area.
2.2. Data Processing
The data in this paper are from the Gansu Development Yearbooks [41], Gansu Rural Yearbooks [42], Zhangye City Statistical Yearbooks [43], Zhangye Water Bureau, Ganzhou District Statistical Yearbooks, Sunan County Statistical Yearbooks, Minle County Statistical Yearbooks, Linze County Statistical Yearbooks, Gaotai County Statistical Yearbooks, and Shandan County Statistical Yearbooks. The time period is from 2005 to 2015. Due to the long time series, some indicators have missing values in some years, such as the average number of water heaters owned per 100 rural households in 2006 and 2007, the number of people who have safe drinking water in rural areas in 2005, 2011, 2012, and 2013, the total water supply of each county from 2011 to 2014 and sectional grain output in 2012. To ensure the continuity of indicators over time series, the trend function, which is an interpolation method, is used to substitute for the missing values. Meanwhile, to make a comparison between the indicators, we normalized the data of each indicator. The maximum and minimum values to normalize indicators are shown in Table 1. The details of the method for normalizing are seen in Willis et al. [9].

Table 1.
Logical minimum and maximum values used to normalize indicators.
2.3. Methods
2.3.1. FEW Index
The FEW index consists of the food subindex, energy subindex, and water subindex; the formula is as follows:
In this expression, represents the food subindex, represents the energy subindex, and represents the water subindex.
- (1)
- Food Subindex
In this study, the food subindex is calculated based on two aspects, availability and accessibility, which are included in the above definition. The formula is as follows:
where denotes food availability and denotes food accessibility.
- ①
- Food Availability
We used the ratio of per capita energy supply to minimum dietary energy required to represent food availability, which can be expressed as follows:
where AES denotes the average energy supply, and MDER denotes the minimum dietary energy requirements. Based on China Food Composition [44], the food supply obtained from the statistical yearbooks is converted into the corresponding energy supply. Then, the per capita energy supply (in kilocalories per capita per day) is calculated based on the population of each county. MDER comes from the Joint FAO/WHO/UNU Expert Consultation on Human Energy Requirements [45]. Combining the MDER (also in kilocalories per capita per day) required by people of different ages per day with the population of different ages, the MDER of Zhangye city is calculated.
- ②
- Food Accessibility
We combined affordability with diversity to explain the concept of access to a quality diet, which can be expressed as follows:
where represents affordability, and represents diversity.
- a.
- Food Accessibility
This indicator is calculated by the ratio of the per capita consumption expenditure of households on food to the per capita disposable income of households.
where represents the consumption expenditure on food, and represents the disposable income of households.
- b.
- Diversity
One of the important factors to ensure healthy lives is to have a high-quality diet. Undernutrition and nutritional imbalance are the causes of many diseases. We used energy from non-starchy food divided by energy provided by all food to represent diversity.
where represents the energy from non-starchy food, and represents the energy provided by all food. The nutrients needed by the human body are mainly from grains, beans, tubers, edible oils, meat, milk, eggs, fruits, and vegetables. Among these, grains, tubers, and some beans represent starchy foods, and the rest are non-starchy foods. Based on China Food Composition [44], the non-starchy food supply obtained from the statistical yearbooks is converted into the corresponding energy supply.
- (2)
- Energy Subindex
We selected electricity and clean energy, which have little impact on human social development because their effluent is less polluting to the air. The formula that calculates the energy subindex can be expressed as follows:
where denotes energy availability, and denotes energy accessibility.
- ①
- Energy Availability
Energy availability exists when a county’s electricity infrastructure can meet the needs of individuals and thereby promote human development. We used per capita electricity consumption in rural areas to calculate energy availability. Electricity consumption includes industrial electricity, agricultural electricity, commercial electricity, residential electricity, public facility electricity, and other electricity. All of these activities are closely related to human life; thus, electricity consumption can well reflect the development of society.
where denotes the electricity consumption in rural areas, and denotes the rural population.
- ②
- Energy Accessibility
We use an unweighted geometric mean of percentage electrification and the average number of water heaters owned per 100 rural households to calculate energy accessibility.
where denotes the percentage electrification, and denotes the average number of water heaters owned per 100 rural households. Energy accessibility is expressed as individuals have access to clean forms of energy for domestic uses. We used the administrative villages that have electricity divided by the total number of administrative villages to represent the electrification rate and the average number of water heaters owned per 100 rural households to represent the percentage using clean fuels. In Zhangye, the energy source for water heaters is most often electricity and solar energy. Therefore, the clean energy mentioned in this article mainly refers to solar energy.
- (3)
- Water Subindex
Water resources are one of the main substances on which human beings live. For the water subindex, we also focused on adaptive capacity in addition to availability and accessibility. We used the unweighted geometric mean to calculate the water subindex; the expression is as follows:
where denotes water availability, denotes water accessibility, and represents water adaptive capacity.
- ①
- Water Availability
Water availability means that the amount of water that is used can meet the amount needed to support basic domestic activities. We used a ratio of the per capita domestic water consumption to the per capita minimum water consumption required to meet basic needs to express water availability. Gleick considers 50 liters of water per capita per day to be the basic domestic water consumption requirement [46].
where denotes domestic water consumption, and denotes the minimum water consumption required to meet basic needs.
- ②
- Water Accessibility
Water accessibility reflects the access of each county’s population to improved drinking water. It was measured by two variables—tap water usage rate and the percentage of people who have safe drinking water. The tap water rate is expressed as a ratio of the households who have tap water to the total households, whereas the percentage of people who have safe drinking water is expressed as a ratio of the people that have safe drinking water to the total population. “Safe drinking water” or “improved drinking water” mentioned in this article refers to that residents’ have timely and convenient access to sufficient, clean, and affordable drinking water.
where represents the tap water usage rate, and represents the percentage of people who have safe drinking water.
- ③
- Water Adaptive Capacity
Water adaptive capacity means the availability of water resources to meet new needs or to compensate for declines in existing sources. While long-term series of total water resources data of each county were not available, we used the total water supply of each county to replace the total water resources. We used the total water supply divided by the population to calculate the water adaptive capacity.
where denotes the total water supply, and denotes the population.
2.3.2. Multiple Stepwise Linear Regression Model
Because the spatial distribution of food, energy and water resources is closely related to natural conditions, transportation and socioeconomic elements, we used multiple stepwise linear regression to analyze the factors (Table 2) affecting the spatial variation in the FEW indexes. The model is as follows:
where is the FEW index of each county, is the regression constant, are the regression coefficients, and are the independent variables.
Table 2.
The spatial influencing factors of the food-energy-water (FEW) indexes.
3. Results and Discussion
3.1. Temporal Analysis of the FEW Nexus from 2005 to 2015
The FEW index of each county (district) showed an upward trend from 2005 to 2015 (Figure 2A–F) as a whole. The FEW indexes of Ganzhou, Sunan and Linze increased steadily, while the indexes of Minle, Gaotai and Shandan fluctuated greatly. The food subindex of Ganzhou, Sunan, Linze, and Gaotai mainly denoted an upward trend from 2005 to 2014 and a downward trend from 2014 to 2015. However, the index of Minle initially rose and then declined from 2005 to 2015: the period of 2005–2009 was the rising stage, 2009–2012 was the declining stage, and after 2013 was the stabilization stage. The index of Shandan declined initially and then rose from 2005 to 2015. The energy subindex of each county (district) fluctuated significantly. For example, the energy subindex of Ganzhou has increased significantly since 2012. This resulted from the increasing average number of water heaters owned per 100 rural households since 2012. Gaotai and Shandan were also subject to large fluctuations in the average number of water heaters owned per 100 rural households. The water subindex of each county (district) represented an upward trend as a whole.
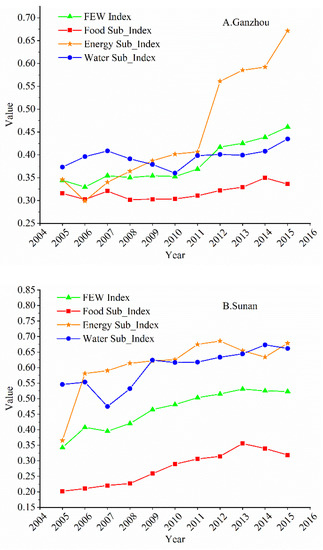

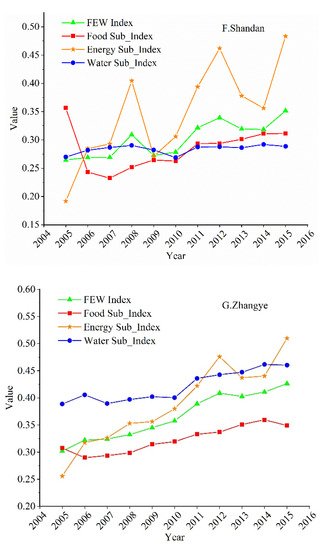
Figure 2.
Temporal variation in the FEW nexus from 2005 to 2015. A–F represent temporal variation in the FEW nexus of each county (district); G represents temporal variation in the FEW nexus of Zhangye (average value).
During these 11 years, the quality of residents’ lives gradually improved, people’s awareness of ecological environmental protection increased, the structure of the planting industry further adjusted, production efficiency improved [47,48], and the security of the FEW nexus of Zhangye City progressed steadily (Figure 2G). Compared with the FEW nexus of each county, in addition to the energy subindex, the average FEW index of Zhangye city, the food subindex and the water subindex all increased steadily from 2005 to 2015. The energy subindex of Zhangye City showed a gradually rising trend from 2005 to 2012, a downward trend in 2013 and 2014, and increased again in 2015.
3.2. Spatial Distribution of FEW Nexus from 2005 to 2015
- (1)
- Food subindex
The food subindex is composed of food availability and food accessibility. The spatial distribution of the food subindex was mapped using ArcGIS10.2 and illustrated in Figure 3. The results showed that overall, the food subindexes of Gaotai, Linze, and Ganzhou were larger than those of other counties. From 2005 to 2015, the food subindexes of Gaotai, Linze, and Ganzhou gradually increased, while the indexes of Minle and Shandan showed the inverse trend. This result means that food security in the former counties slowly improved, while that of the latter counties weakened.
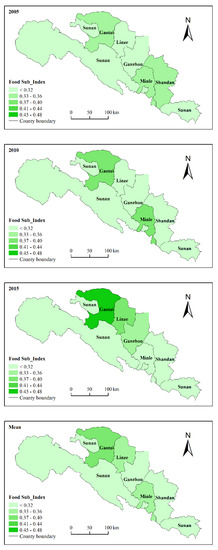
Figure 3.
Spatial distribution of the food subindex in Zhangye from 2005 to 2015.
Because Zhangye is located in arid and semi-arid areas in northwestern China, the productivity of crop farming is constrained by limited water resources. Ganzhou, Linze, and Gaotai have flat terrain, and the main stream of the Heihe River flows through this area. The irrigation conditions are thus convenient. Ecological agriculture is mainly developed by adjusting the planting structure and improving irrigation technology. Shandan and Minle are far from the irrigation canals, and the crops are transformed from high-water-consumption and low-yield crops to drought-resistant crops. Therefore, food production is more secure in Gaotai, Linze, and Ganzhou.
- (2)
- Energy subindex
The energy subindex is determined by energy availability and energy accessibility. The spatial distribution of the energy subindex is presented in Figure 4. In general, the energy subindex of each county (district) gradually increased. Examining the average over the 11 years, Sunan had the largest index value, followed by Ganzhou.
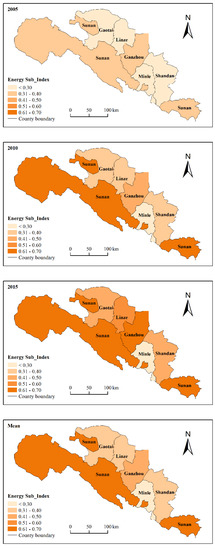
Figure 4.
Spatial distribution of the energy subindex in Zhangye from 2005 to 2015.
- (3)
- Water subindex
The water subindex reflects water availability, water accessibility and water adaptive capacity. Figure 5 shows the spatial distribution of the water subindex from 2005 to 2015. The index of each county (district) basically increased. Among them, Sunan, Gaotai, Linze, and Ganzhou represented larger index values, while Minle and Shandan showed smaller index values. The Heihe main stream flows through Sunan, Ganzhou, Linze, and Gaotai, and thus the water resources are relatively abundant. In addition, the adjustment of the agricultural planting structure and the advancement of irrigation technology have increased the water use efficiency of these four counties, so their water subindexes are highly coordinated. However, Minle and Shandan are far from the main stream of the Heihe River and are located in mountainous areas. Water resources are relatively lacking in these counties, so their water subindex coordination is lower.
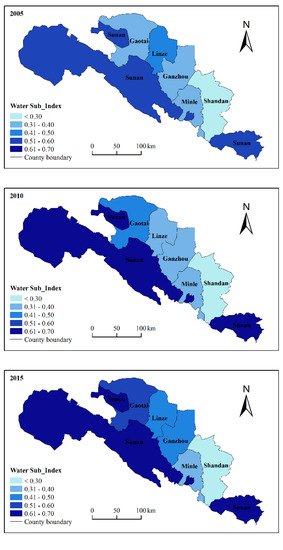
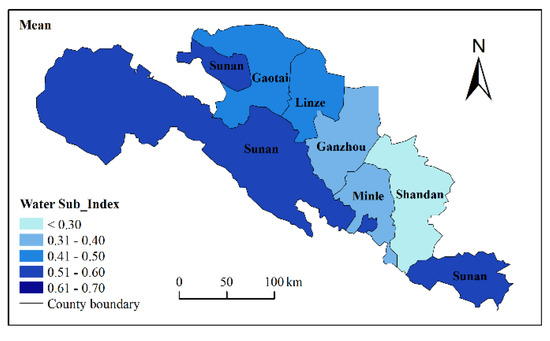
Figure 5.
Spatial distribution of the water subindex in Zhangye from 2005 to 2015.
- (4)
- FEW index
Data from the FEW indexes reveal the geographic distribution of resource security among counties (district) (Figure 6). The distribution of the FEW nexus indexes reveals expected patterns globally. The overall FEW indexes are generally higher in the southwestern areas and lower in the northeastern areas. Examining the average value over 11 years, the order of the FEW index of each county (district) is Sunan > Gaotai > Ganzhou > Linze > Shandan > Minle. Combined with Figure 1, the main channel of the Heihe River flows through Sunan, Ganzhou, Linze, and Gaotai, and the water resources are relatively abundant. In addition, the terrain of Ganzhou, Linze, and Gaotai is relatively flat, and the planting industry is developing well. Sunan is a minority area located in the northern foot of the Qilian Mountains. It has rich natural resources as well as ice and snow melt water, and its per capita disposable income ranks first, so the FEW indexes of Sunan, Ganzhou, Linze, and Gaotai are higher. The terrain of Minle is high in the south and low in the north. It belongs to the temperate continental desert steppe climate. The annual average precipitation is 351 mm, and the water resources are relatively scarce. Shandan has a minimum elevation of 1550 meters and a maximum elevation of 4441 meters. The terrain is surrounded by mountains on three sides and is high in the southeast and low in the northwest. It is a continental alpine and semi-arid climate. Therefore, the FEW indexes of Shandan and Minle are lower.
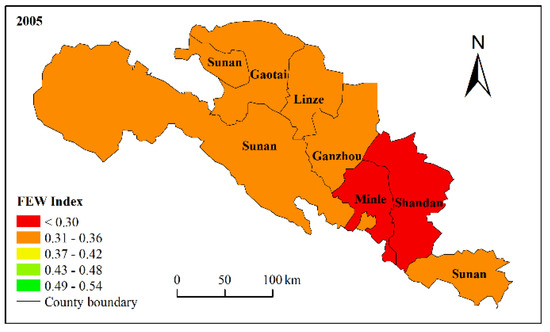
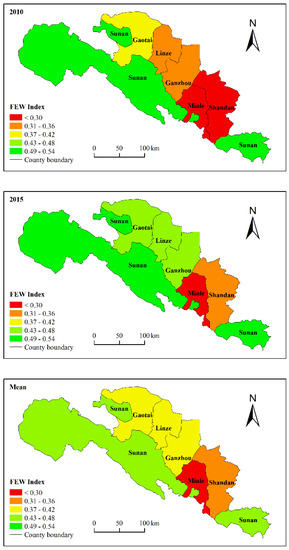
Figure 6.
Spatial distribution of the FEW index in Zhangye from 2005 to 2015.
By reviewing the average index value over the 11 years in Figure 7, we can relatively easily identify which sector or county should receive focused development efforts. First, water accessibility, energy availability, and energy accessibility have relatively higher values than other indexes overall. Second, Ganzhou has a higher value for energy accessibility and water availability and a lower value for water accessibility and food accessibility. Sunan has a higher value for food accessibility, energy availability, energy accessibility and water availability and a lower value for food availability. Minle has higher value for water accessibility and a lower value for energy availability, energy accessibility, water availability and water adaptive capacity. Linze has a higher value for water adaptive capacity and food availability and a lower value for food accessibility. Gaotai has a higher value for water adaptive capacity, food availability and food accessibility, and a lower value for energy availability and water accessibility. Shandan has higher value for water accessibility and energy availability and a lower value for food availability, energy accessibility, water adaptive capacity, and water availability.
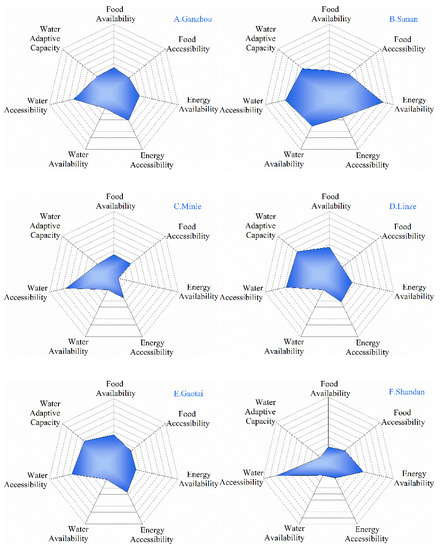
Figure 7.
The average index values of the subindexes.
Analyzing the indexes that make up the subindexes can provide further insight into the reasons for resource insecurity. For example, Sunan and Shandan have lower food availability, which suggests that the amount of food has drawn attention. Ganzhou and Linze have lower food accessibility, and residents’ awareness of a diverse diet needs to be strengthened. Minle County has lower energy availability, which indicates that generation capacity needs to be developed to improve the human development level. Ganzhou and Gaotai have lower water accessibility, which suggests that they should improve their ability to provide residents with access to safe drinking water. Minle and Shandan have lower energy accessibility, water availability and water adaptive capacity, and they should improve their distribution infrastructure and capability to meet basic domestic water needs.
3.3. Driving Analysis of FEW Index Variation
The social economy and natural conditions jointly act on the FEW nexus. Therefore, we selected 10 indicators, including the three categories of socioeconomic elements, natural conditions and traffic locations (Table 2), and used multiple stepwise linear regression to analyze the influencing factors of FEW nexus in each county (district) of the city. Considering the collinearity between independent variables, we calculated the variance inflation factor (VIF) of independent variables (Table 2) and excluded variables with VIF greater than 2 when we used multiple stepwise linear regression to model it. At a significance level of 0.1, we obtained a linear model of factors and FEW indexes. Table 3, Table 4 and Table 5 explain the R square, variance analysis and coefficients of the models. The R square of model 3—0.993—is the optimal one. The model is as follows:
Table 3.
Model summary.
Table 4.
ANOVA a (analysis of variance) of the model.
Table 5.
Coefficients a of the model.
The FEW indexes are related not only to the social economy but also to the natural environment. They are positively correlated with per capita GDP and negatively correlated with the average evaporation and altitude of each county (see model 3). The magnitude of the influence (absolute value) of these three factors on the index is as follows: per capita GDP > average altitude > average evaporation. The FEW nexus is closely related to people’s living standards. Per capita GDP objectively reflects the level and extent of social development in each county (district). A higher per capita GDP means a higher investment orientation, input capacity and input level in terms of residents’ income, living standards and social construction. The per capita GDP of each county (district) increased annually, and accordingly, the government’s efforts to support local agriculture had the same trend. The government increased investment projects, actively guided farmers to optimize the planting structure, vigorously developed characteristic industries and improved the grass-roots agricultural technology extension service system to further strengthen agricultural technology support capabilities and lay the foundation for the sustainable development of water resources and plantation in the city. Nevertheless, poor infrastructure such as improved water, sanitation, roads, and rural public welfare and low agricultural mechanization in high-altitude and high-evaporation areas is not conducive to the development of agriculture and the rural economy. Dispersed farmland-forest networks, uneven and unsymmetrical land, and relatively aged agricultural waterworks have become stumbling blocks to large-scale production and mechanized operations, resulting in inefficient water resource utilization and relatively backward agricultural economic development.
3.4. Discussion
More effort is required to advance holistic assessments of the FEW nexus. This research provides a standardized, quantitative, and transparent estimation of FEW nexus indexes for each county (district) by using an unweighted, geometric mean. In practice, the process of resource management depends more on county scale evaluation results. Meanwhile, the simple combination of indicators can allow us to easily understand the influences of these basic resources on the development of human beings. It also uses GIS to analyze the spatiotemporal distribution characteristics of FEW nexus indexes from a view of geospatial and reveals the influence mechanism of geospatial on it. The results of this study fill the gap in analyzing a FEW nexus from a geospatial perspective and offers a basis for policy makers to manage FEW nexus efficiently, coordinately and environmentally friendly through the analysis of the influence mechanism of it. It also provides a reference for the development of similar agricultural areas.
The FEW nexus indexes calculate the degree of coordinated development among food, energy and water. However, the interrelationships of the FEW nexus are complex, it doesn’t measure tradeoffs between economic profits and environmental impacts. Second, we base on the actual situation in the study area and referring to the existing research on the FEW nexus when selecting the impact variables and don’t perform the sensitivity analysis. Third, although this method can provide a standardized, quantitative, and transparent estimation of FEW nexus indexes, if any indicator has a value of 0, it will affect the calculation result of the FEW nexus indexes. Last but not least, research on the long-term sequence of FEW nexus in each county (district) requires mass data. But due to errors in data collection, some indicators have missing values (see Section 3.1 for details). We averaged the values for the years before and after the missing values to substitute for them by the interpolation method. This may lead relative indexes to be overestimated or underestimated. Meanwhile, Zhangye is China’s corn seed production base and is rich in garden produce, delivering agricultural products across the country. When calculating food availability, we considered it to be a self-sufficient city and did not take into account inputs and outputs. Therefore, in the next work, we will consider the inputs and outputs when calculating food security and analyze the tradeoffs between economic development and environmental impact.
4. Conclusions
FEW indexes use an integrated set of indicators to provide a holistic view of the availability of and access to the resources that are critical to human development within a county. There are four points in the conclusion. (1) The coordination of the FEW nexus in each county (district) gradually increased during the period of 2005–2015, while there was still space for improvement. Among them, food security and water security were weaker than energy security. (2) Economic conditions and water resources determined the spatial distribution pattern of the FEW nexus. In general, the spatial distribution of the FEW indexes showed a tendency toward higher values in the southwest and lower values in the northeast. (3) Ganzhou had relative limitations in food and water accessibility; Sunan had relatively low values for food availability; the lower indicators in Gaotai and Linze were for food accessibility, water accessibility and energy availability; nevertheless, Minle and Shandan had more challenges on all indexes. (4) The social economy and natural conditions jointly act on the FEW nexus. The FEW index is positively associated with per capita GDP and negatively correlated with the average evaporation and altitude of each county.
Although the coordination of the FEW nexus in the city has improved, food and water security still need to be further improved. First, this city has superior basic agricultural conditions. It is the country’s largest corn seed production base and a breeding base for millions of beef cattle, and it produces a large amount of crop straw and livestock and poultry manure every year. On the basis of the existing ecological agriculture development, this region should focus on combining its industrial advantages and comprehensively utilizing resources to grow the industrial chain and actively develop water-efficient ecological agriculture [48]. Second, in mountainous areas, we should adjust the planting structure and cultivate low-water-consumption and high-economic-benefit crops (for example, Chinese herbal medicines, potatoes, edible mushrooms, hybrid rapes, etc.) to improve water use efficiency [49,50]. Finally, we should strengthen the construction of high-quality food bases, increase investment in science and technology to enhance the competitiveness of food in internal markets, and rely on the “Belt and Road” initiative to vigorously develop the international market [47].
Author Contributions
Conceptualization, Y.F. and C.H.; methodology, Y.F. and F.Z.; software, Y.F.; resources, J.G., Y.G. and X.S.; data curation, Y.F. and J.G.; writing—original draft preparation, Y.F.; writing—review and editing, Y.F. and F.Z.; visualization, Y.F.; supervision, F.Z. and C.H.; project administration, C.H.; funding acquisition, F.Z., C.H. and J.G. All authors have read and agreed to the published version of the manuscript.
Acknowledgments
This work was supported by the Strategic Priority Research Program of the Chinese Academy of Sciences (grant number XDA19040500), the Fundamental Research Funds for the Central Universities of Lanzhou University (lzujbky-2017–213), and National Natural Science Foundation of China (grant number 41571516).
Conflicts of Interest
The authors declare no conflict of interest.
References
- Food and Agriculture Organization. Refinements to the FAO Methodology for Estimating the Prevalence of Undernourishment Indicator. 2014. Available online: http://www.fao.org/3/a-i4046e.pdf (accessed on 20 December 2018).
- Wang, Q.; Li, S.; He, G.; Li, R.; Wang, X. Evaluating sustainability of water-energy-food (WEF) nexus using an improved matter-element extension model: A case study of China. J. Clean. Prod. 2018, 202, 1097–1106. [Google Scholar] [CrossRef]
- Food and Agriculture Organization. Walking the Nexus Talk: Assessing the Water-energy-food Nexus in the Context of the Sustainable Energy for All Inititaative. 2014. Available online: http://www.fao.org/3/a-i3959e.pdf (accessed on 28 March 2019).
- Zhang, X.; Vesselinov, V.V. Integrated modeling approach for optimal management of water, energy and food security nexus. Adv. Water Resour. 2017, 101, 1–10. [Google Scholar] [CrossRef]
- Liu, J.; Hull, V.; Godfray, H.C.J.; Tilman, D.; Gleick, P.; Hoff, H.; Pahl-Wostl, C.; Xu, Z.; Chung, M.G.; Sun, J.; et al. Nexus approaches to global sustainable development. Nat. Sustain. 2018, 1, 466–476. [Google Scholar] [CrossRef]
- Zhang, C.; Chen, X.; Li, Y.; Ding, W.; Fu, G. Water-energy-food nexus: Concepts, questions and methodologies. J. Clean. Prod. 2018, 195, 625–639. [Google Scholar] [CrossRef]
- Li, M.; Fu, Q.; Singh, V.P.; Ji, Y.; Liu, D.; Zhang, C.; Li, T. An optimal modelling approach for managing agricultural water-energy-food nexus under uncertainty. Sci. Total Environ. 2019, 651, 1416–1434. [Google Scholar] [CrossRef] [PubMed]
- Sahle, M.; Saito, O.; Furst, C.; Yeshitela, K. Quantifying and mapping of water-related ecosystem services for enhancing the security of the food-water-energy nexus in tropical data-sparse catchment. Sci. Total Environ. 2019, 646, 573–586. [Google Scholar] [CrossRef] [PubMed]
- Willis, H.H.; Groves, D.G.; Ringel, J.S.; Mao, Z.; Efron, S.; Abbott, M. Developing the Pardee RAND Food-Energy-Water Security Index: Toward a Global Standardized, Quantitative, and Transparent Resource Assessment; RAND Corporation: Santa Monica, CA, USA, 2016; Available online: https://www.rand.org/pubs/tools/TL165.html (accessed on 4 August 2018).
- Yang, Y.C.E.; Ringler, C.; Brown, C.; Mondal, M.A.H. Modelling the agricultural water-energy-food nexus in the Indus River basin, Pakistan. J. Water Resour. Plan. Manag. 2016, 142, 4016062. [Google Scholar] [CrossRef]
- White, D.J.; Hubacek, K.; Feng, K.; Sun, L.X.; Meng, B. The Water-Energy-Food Nexus in East Asia: A tele-connected value chain analysis using inter-regional input-output analysis. Appl. Energy 2018, 210, 550–567. [Google Scholar] [CrossRef]
- Karabulut, A.A.; Crenna, E.; Sala, S.; Udias, A. A proposal for integration of the ecosystem-water-food-land-energy (EWFLE) nexus concept into life cycle assessment: A synthesis matrix system for food security. J. Clean. Prod. 2018, 172, 3874–3889. [Google Scholar] [CrossRef]
- Kurian, M. The water-energy-food nexus. Trade-offs, thresholds and transdisciplinary approaches to sustainable development. Environ. Sci. Policy 2017, 68, 97–106. [Google Scholar] [CrossRef]
- Ai-Saidi, M.; Elagib, N.A. Towards understanding the integrative approach of the water, energy and food nexus. Sci. Total Environ. 2017, 574, 1131–1139. [Google Scholar] [CrossRef] [PubMed]
- Rasul, G. Food, water, and energy security in South Asia: A nexus perspective from the Hindu Kush Himalayan region. Environ. Sci. Policy 2014, 39, 35–48. [Google Scholar] [CrossRef]
- Ringler, C.; Willenbocke, D.; Perez, N.; Rosegrant, M.; Zhu, T.; Mattews, N. Global linkages among energy, food and water: An economic assessment. J. Environ. Stud. Sci. 2016, 6, 161–171. [Google Scholar] [CrossRef]
- Cai, X.; Wallington, K.; Shafiee-Jood, M.; Marston, L. Understanding and managing the food-energy-water nexus—Opportunities for water resources research. Adv. Water Resour. 2018, 111, 259–273. [Google Scholar] [CrossRef]
- Chang, Y.; Li, G.; Yao, Y.; Zhang, L.; Yu, C. Quantifying the water-energy-food nexus: Current status and trends. Energies 2016, 9, 65. [Google Scholar] [CrossRef]
- Gallagher, L.; Dalton, J.; Bréthaut, C.; Allan, T.; Bellfield, H.; Crilly, D.; Cross, K.; Gyawali, D.; Klein, D.; Laine, S. The critical role of risk in setting directions for water, food and energy policy and research. Curr. Opin. Environ. Sustain. 2016, 23, 12–16. [Google Scholar] [CrossRef]
- Liu, J.; Mao, G.; Hoekstra, A.Y.; Wang, H.; Wang, J.; Zheng, C.; van Vliet, M.T.H.; Wu, M.; Ruddell, B.; Yan, J. Managing the energy-water-food nexus for sustainable development. Appl. Energy 2018, 210, 377–381. [Google Scholar] [CrossRef]
- Endo, A.; Burnett, K.; Orencio, P.; Kumazawa, T.; Wada, C.; Ishii, A.; Tsurita, I.; Taniguchi, M. Methods of the water-energy-food nexus. Water 2015, 7, 5806–5830. [Google Scholar] [CrossRef]
- Byers, E.A. Tools for tackling the water-energy-food nexus. Chang. Adapt. Socio-Ecol. Syst. 2015, 2, 112–114. [Google Scholar] [CrossRef]
- Kaddoura, S.; El Khatib, S. Review of water-energy-food Nexus tools to improve the Nexus modelling approach for integrated policy making. Environ. Sci. Policy 2017, 77, 114–121. [Google Scholar] [CrossRef]
- Albrecht, T.R.; Crootof, A.; Scott, C.A. The Water-Energy-Food Nexus: A systematic review of methods for nexus assessment. Environ. Res. Lett. 2018, 13, 043002. [Google Scholar] [CrossRef]
- Dargin, J.; Daher, B.; Mohtar, R.H. Complexity versus simplicity in water energy food nexus (WEF) assessment tools. Sci. Total Environ. 2019, 650, 1566–1575. [Google Scholar] [CrossRef] [PubMed]
- Jalilov, S.-M.; Amer, S.A.; Ward, F.A. Managing the water-energy-food nexus: Opportunities in Central Asia. J. Hydrol. 2018, 557, 407–425. [Google Scholar] [CrossRef]
- de Strasser, L.; Lipponen, A.; Howells, M.; Stec, S.; Bréthaut, C. A Methodology to Assess the Water Energy Food Ecosystems Nexus in Transboundary River Basins. Water 2016, 8, 59. [Google Scholar] [CrossRef]
- Jalilov, S.-M.; Keskinen, M.; Varis, O.; Amer, S.; Ward, F.A. Managing the water–energy–food nexus: Gains and losses from new water development in Amu Darya River Basin. J. Hydrol. 2016, 539, 648–661. [Google Scholar] [CrossRef]
- Basheer, M.; Wheeler, K.G.; Ribbe, L.; Majdalawi, M.; Abdo, G.; Zagona, E.A. Quantifying and evaluating the impacts of cooperation in transboundary river basins on the Water-Energy-Food nexus: The Blue Nile Basin. Sci. Total Environ. 2018, 630, 1309–1323. [Google Scholar] [CrossRef]
- Li, G.; Huang, D.; Li, Y. China’s Input-Output Efficiency of Water-Energy-Food Nexus Based on the Data Envelopment Analysis (DEA) Model. Sustainability 2016, 8, 927. [Google Scholar] [CrossRef]
- Bai, J.F.; Zhang, H.J. Spatio-temporal variation and driving force of water-energy-food pressure in China. Sci. Geogr. Sin. 2018, 38, 1653–1660. [Google Scholar] [CrossRef]
- Gondhalekar, D.; Ramsauer, T. Nexus City: Operationalizing the urban Water-Energy-Food Nexus for climate change adaptation in Munich, Germany. Urban Clim. 2017, 19, 28–40. [Google Scholar] [CrossRef]
- Hussien, W.E.A.; Memon, F.A.; Savic, D.A. An integrated model to evaluate water-energy-food nexus at a household scale. Environ. Model. Softw. 2017, 93, 366–380. [Google Scholar] [CrossRef]
- Yigitcanlar, T.; Dur, F.; Dizdaroglu, D. Towards prosperous sustainable cities: A multiscalar urban sustainability assessment approach. Habitat Int. 2015, 45, 36–46. [Google Scholar] [CrossRef]
- Li, X.; Cheng, G.D.; Liu, S.M.; Xiao, Q.; Ma, M.G.; Jin, R.; Che, T.; Liu, Q.H.; Wang, W.Z.; Qi, Y.; et al. Heihe Watershed Allied Telemetry Experimental Research (HiWATER): Scientific objectives and experimental design. Bull. Am. Meteorol. Soc. 2013, 94, 1145–1160. [Google Scholar] [CrossRef]
- Huang, C.; Chen, W.; Li, Y.; Shen, H.; Li, X. Assimilating multi-source data into land surface model to simultaneously improve estimations of soil moisture, soil temperature, and surface turbulent fluxes in irrigated fields. Agric. For. Meteorol. 2016, 230–231, 142–156. [Google Scholar] [CrossRef]
- Cheng, G.D.; Li, X.; Zhao, W.Z.; Xu, Z.M.; Feng, Q.; Xiao, S.C.; Xiao, H.L. Integrated study of the water-ecosystem-economy in the Heihe River Basin. Natl. Sci. Rev. 2014, 1, 413–428. [Google Scholar] [CrossRef]
- Li, X.; Yang, K.; Zhou, Y.Z. Progress in the study of oasis-desert interactions. Agric. For. Meteorol. 2016, 230–231, 1–7. [Google Scholar] [CrossRef]
- Falkenmark, M.; Rockström, J. The New Blue and Green Water Paradigm: Breaking New Ground for Water Resources Planning and Management. J. Water Resour. Plan. Manag. 2006, 132, 129–132. [Google Scholar] [CrossRef]
- D’Odorico, P.; Davis, K.F.; Rosa, L.; Carr, J.A.; Chiarelli, D.; Dell’Angelo, J.; Gephart, J.; MacDonald, G.K.; Seekell, D.A.; Suweis, S.; et al. The global food-energy-water nexus. Rev. Geophys. 2018, 56, 456–531. [Google Scholar] [CrossRef]
- Gansu Development Yearbook Editorial Board. Gansu Development Yearbook; China Statistics Press: Beijing, China, 2006–2016. Available online: http://tongji.cnki.net/kns55/navi/NaviDefault.aspx (accessed on 25 July 2019).
- Gansu Rural Yearbooks Editorial Board. Gansu Rural Yearbooks; China Statistics Press: Beijing, China, 2006–2016. Available online: http://tongji.cnki.net/kns55/navi/NaviDefault.aspx (accessed on 25 July 2019).
- Zhangye City Statistics Bureau and Zhangye City Investigation Team, National Bureau of Statistics. Zhangye City Statistical Yearbooks; Qinghua Printing House of Zhangye Computer Service Center: Beijing, China, 2005–2015. Available online: http://www.zhangye.gov.cn/tjj/ztzl/tjsj/ (accessed on 25 July 2019).
- Yang, Y.; Wang, G.; Pan, X. China Food Composition; National Institute of Nutrition and Food Safety: Beijing, China, 2009. [Google Scholar]
- Food and Agriculture Organization. Human Energy Requirements: Report of a Joint FAO-WHO-UNU Expert Consultation. Food & Nutrition Bulletin 2001, October 17–24, Rome. Available online: http://www.fao.org/3/a-y5686e.pdf (accessed on 9 November 2018).
- Gleick, P.H. Basic Water Requirements for Human Activities: Meeting Basic Needs. Water Int. 1996, 21, 83–92. [Google Scholar] [CrossRef]
- Li, M.; Zhang, J.; Liu, H. The optimization and adjustment of planting structure in Zhangye City. J. Anhui Agric. Univ. 2018, 45, 556–561. [Google Scholar]
- Zhang, P. Sustainable Development Patterns and Mechanism for High-Efficient Eco-Agriculture in Zhangye City; Gansu Agricultural University: Lanzhou, China, 2013. [Google Scholar]
- Ran, H. Study on the Adjustment of Industrial Structure under the Restriction of Shortage of Resources in Zhangye Area of the Middle Reaches of Heihe River; Northwest Normal University: Lanzhou, China, 2004. [Google Scholar]
- Jiang, Z. Study on Agricultural Structure Adjustment under Restriction of Water Resources in North-West China; Northwest Agriculture & Forestry University: Xian, China, 2008. [Google Scholar]


© 2020 by the authors. Licensee MDPI, Basel, Switzerland. This article is an open access article distributed under the terms and conditions of the Creative Commons Attribution (CC BY) license (http://creativecommons.org/licenses/by/4.0/).