Article

Towards Sustainable Mining: Exploiting Raw Materials from Extractive Waste Facilities

by
Giovanna Antonella Dino
1,
Alessandro Cavallo
2,*,
Piergiorgio Rossetti
1,
Ernő Garamvölgyi
3,
Renáta Sándor
3 and
Frederic Coulon
4
1
Department of Earth Sciences, University of Turin, 10125 Torino, Italy
2
Department of Earth and Environmental Sciences, University of Milan-Bicocca, 20126 Milano, Italy
3
Bay Zoltán Nonprofit Ltd. for Applied Research, H3519 Miskolc, Hungary
4
School of Water, Energy and Environment, Cranfield University, Cranfield MK43 0AL, UK
*
Author to whom correspondence should be addressed.
Sustainability 2020, 12(6), 2383; https://doi.org/10.3390/su12062383
Submission received: 23 January 2020 / Revised: 13 March 2020 / Accepted: 16 March 2020 / Published: 18 March 2020
(This article belongs to the Section Environmental Sustainability and Applications)

Abstract

:
The focus of the present research is on the exploitation of extractive waste to recover raw materials, considering the technological and economic factors, together with the environmental impacts, associated with extractive waste quarrying and dressing activities. The present study, based on a case history from Northern Italy (Montorfano and Baveno granite quarrying area), was intended to validate the presented interdisciplinary approach for evaluating economic and environmental impacts associated with extractive waste facility exploitation (from granite waste to products for the ceramic industry and by-products for the building industry). A shared methodology was applied to determine extractive waste characteristics (geochemistry, petrography, and mineralogy), waste volume (geophysical, topographic, and morphologic 3D characterization) and potential exploitable products and by-products. Meanwhile, a Life Cycle Assessment (LCA) was applied to determine the environmental impacts associated with the extraction and processing phases.

1. Introduction

1.1. General Background and Targets of the Present Research

The demand for raw materials (RM) and critical raw materials (CRM) is continuously growing; this increment is highly connected to the development of climate-benefit technologies as well as intra-technology and high-technology [1]. In other words, the demand for RM and CRM will be more and more dependent on which technologies will become dominant in the marketplace. In fact, several recent studies examining material and metal demand for supplying clean and hi-tech technologies report that these technologies will result in considerably more material-intensive demand than traditional fossil fuel mechanisms and non-hi-tech elements (Rare Earth Elements—REE, Co, Te, Se, Nd, In, Ga) [2,3]. Currently the commodities considered “critical” for EU economy are mainly constituted by REE [4,5,6,7,8] and base and precious metals such as copper, lithium, aluminum, silver, steel, nickel, lead, and zinc [9]. The supply of these CRM is highly connected to international geopolitics strategies and global market conditions as most of the CRM are exploited in non-EU countries (Table 1), therefore causing high economic dependence for the EU.
Raw materials supply is still guaranteed by ore deposit exploitation. New clean technologies and hi-tech need RM and CRM, often not known or exploited in the past. Such incremental amounts of RM/CRM cannot be totally supplied by recycling activities, consequently mining activities have been improving increasingly at global level, and modern and more efficient technologies and mining techniques need to be applied to guarantee a sustainable mining [11]. Previously, mining activity and mining waste (also referred to as extractive waste—EW) management were approached mainly considering the environmental hazards and landscape degradation connected with extraction and processing. RM/CRM extractive processes (deposit exploitation and mineral dressing) are characterized by inputs/outputs which interact with the environment (Figure 1), potentially causing environmental impacts and health risks for citizens that must be investigated and monitored [12] (Table 2).
With the aim of outlining a comprehensive approach for EW exploitation, this study presents a recent interdisciplinary research conducted on granite EW facilities (Montorfano and Baveno area, Northern Italy), where sustainable recovery of feldspar for the ceramic industry, together with by-products for civil and buildings industries, were investigated. The research was carried out in two different periods (2009 and 2016), investigating, by means of field surveys and laboratory characterization (described in chapter 2), four different EW facilities. During the survey carried out in 2016 a wider geochemical characterization was set to evidence the content of REE associated with monazite present in the original ore deposit. In parallel the LCA connected to the processing of the EW was arranged to evaluate the environmental impacts associated with the exploitation and dressing phases.
In the following Section 1.2 a brief focus on the environmental impacts and potential waste recovery associated with EW facilities is presented.

1.2. Focus on Environmental Impacts and Potential Waste Recovery Associated with Extractive Waste Facilities

The Extractive Waste Directive (EWD, Directive 2006/21/EC), provides measures, procedures, and guidance to prevent and reduce as far as possible any adverse effects on the environment and human health resulting from the management of EW. The main environmental impacts connected to mining activity are referred to as tailings and waste-rock (WR) management facilities (TMF and WRMF); these impacts are strictly connected to site characteristics and ore deposit typology. Furthermore, impacts are associated with land take and to the potential emissions during operation or in the after-care phase. Moreover, bursts or collapses of TMF and WRMF can cause severe environmental damage and problems connected to health safety [20]. In order to assess the techniques used and to ensure they are the most appropriate for the specific circumstances, in terms of environmental, safety, technical and engineering aspects, a risk assessment is applied [21,22], which is linked to the analysis to evaluate the risks for the environment associated with exploitation and processing activities [23,24]. The risk assessment includes not only the identification of the ‘risk sources’ but also the evaluation of the probabilities of actual failure, as well as the severity of the likely consequences following from such a failure. Several scenarios must be considered, and, on the basis of the possible impacts, emergency or contingency response, plans have to be developed (risk management strategy and action plans and procedures). It is often necessary to conduct an Environmental Impact Assessment (EIA), which requires integration of knowledge about the project as it is being designed, the natural and social environments in which the project is situated, and community and stakeholder concerns. Although it is evident that mining activity caused, and in some cases still causes, huge environmental and health impacts [25,26], recent research is changing the perspectives, considering EW facilities as potential new ore bodies to investigate and exploit for RM/CRM recovery [3,27,28,29]. Old EW facilities often present a significant content of non-exploited minerals: modern processing technologies make possible the exploitation of minerals not mined in the past (e.g., sphalerite vs calamine) and potentially CRM which are often associated with minerals exploited for RM supply [12]. REE associated with feldspar in granite EW, Platinum Group Elements—PGE to pentlandite (Ni exploitation), Ge-Ga-In-Cd to sphalerite (Zn-Pb exploitation), etc. [30] are some examples of CRM which can be associated with exploited minerals. Together with minerals and CRM, different secondary raw materials (SRM) can be contemporarily exploited from EW facilities (e.g., for aggregate production, armor stones, etc.). Furthermore, from the processing of RM exploited from EW facilities, several by-products can be recovered together with the main products. The case study here presented is a paradigm of the production of main products, by products, SRM and (potentially) CRM from EW facilities.
In general, it is possible to think about EW facilities (waste rocks and tailings) exploitation, when:
  • the RM/CRM of the new exploitation were not the original target of the exploitation (e.g., sphalerite; feldspar; REE; PGM; hi-tech elements) [30,31] or when processing activities were inefficient, or metal prices had changed (exploitation now economically viable) [32];
  • site remediation or reclamation is needed to prevent harm to human health and to the environment (e.g., AMD, airborne dust release, etc.) [33] or when the removal of leachable minerals present in the EW can help the risk reduction strategy [12];
  • there is a risk of depleting natural resources and a continuous implementation of waste production which lead local/national policy and strategy to invest in landfill mining and enhanced landfill mining [34].

2. Materials and Methods

The present study, based on a case history from Northern Italy (Montorfano and Baveno granite quarrying area. See Section 2.1), was intended to validate the presented interdisciplinary approach for evaluating economic and environmental impacts associated with EW facility exploitation (from granite EW facility to products for the ceramic industry and by-products for the building industry and infrastructures). Two different surveys were carried out: in 2009 and 2016, investigating four different EW facilities (Braghini, Ciana-Tane Pilastretto, Sengio, and Montorfano). The first field survey was intended to estimate the quantity and quality of EW still present in the exploited EW facilities (Braghini, Ciana-Tane Pilastretto, and Sengio); the second one (in 2016) was carried out to find a new ore body to exploit, which presents WR with adequate characteristics to feed the existent treatment plant.
A shared methodology (described in the following) was applied to determine EW characteristics (geochemical, petrographical, and mineralogical), EW facility volume (geophysical and topographic and morphologic 3D characterization), and potential exploitable products, by-products (and CRM) (see Section 2.2). Meanwhile, the Life Cycle Assessment (LCA. See Section 2.3) was applied to determine the environmental impacts associated with the extraction and processing phases.

2.1. Site Description

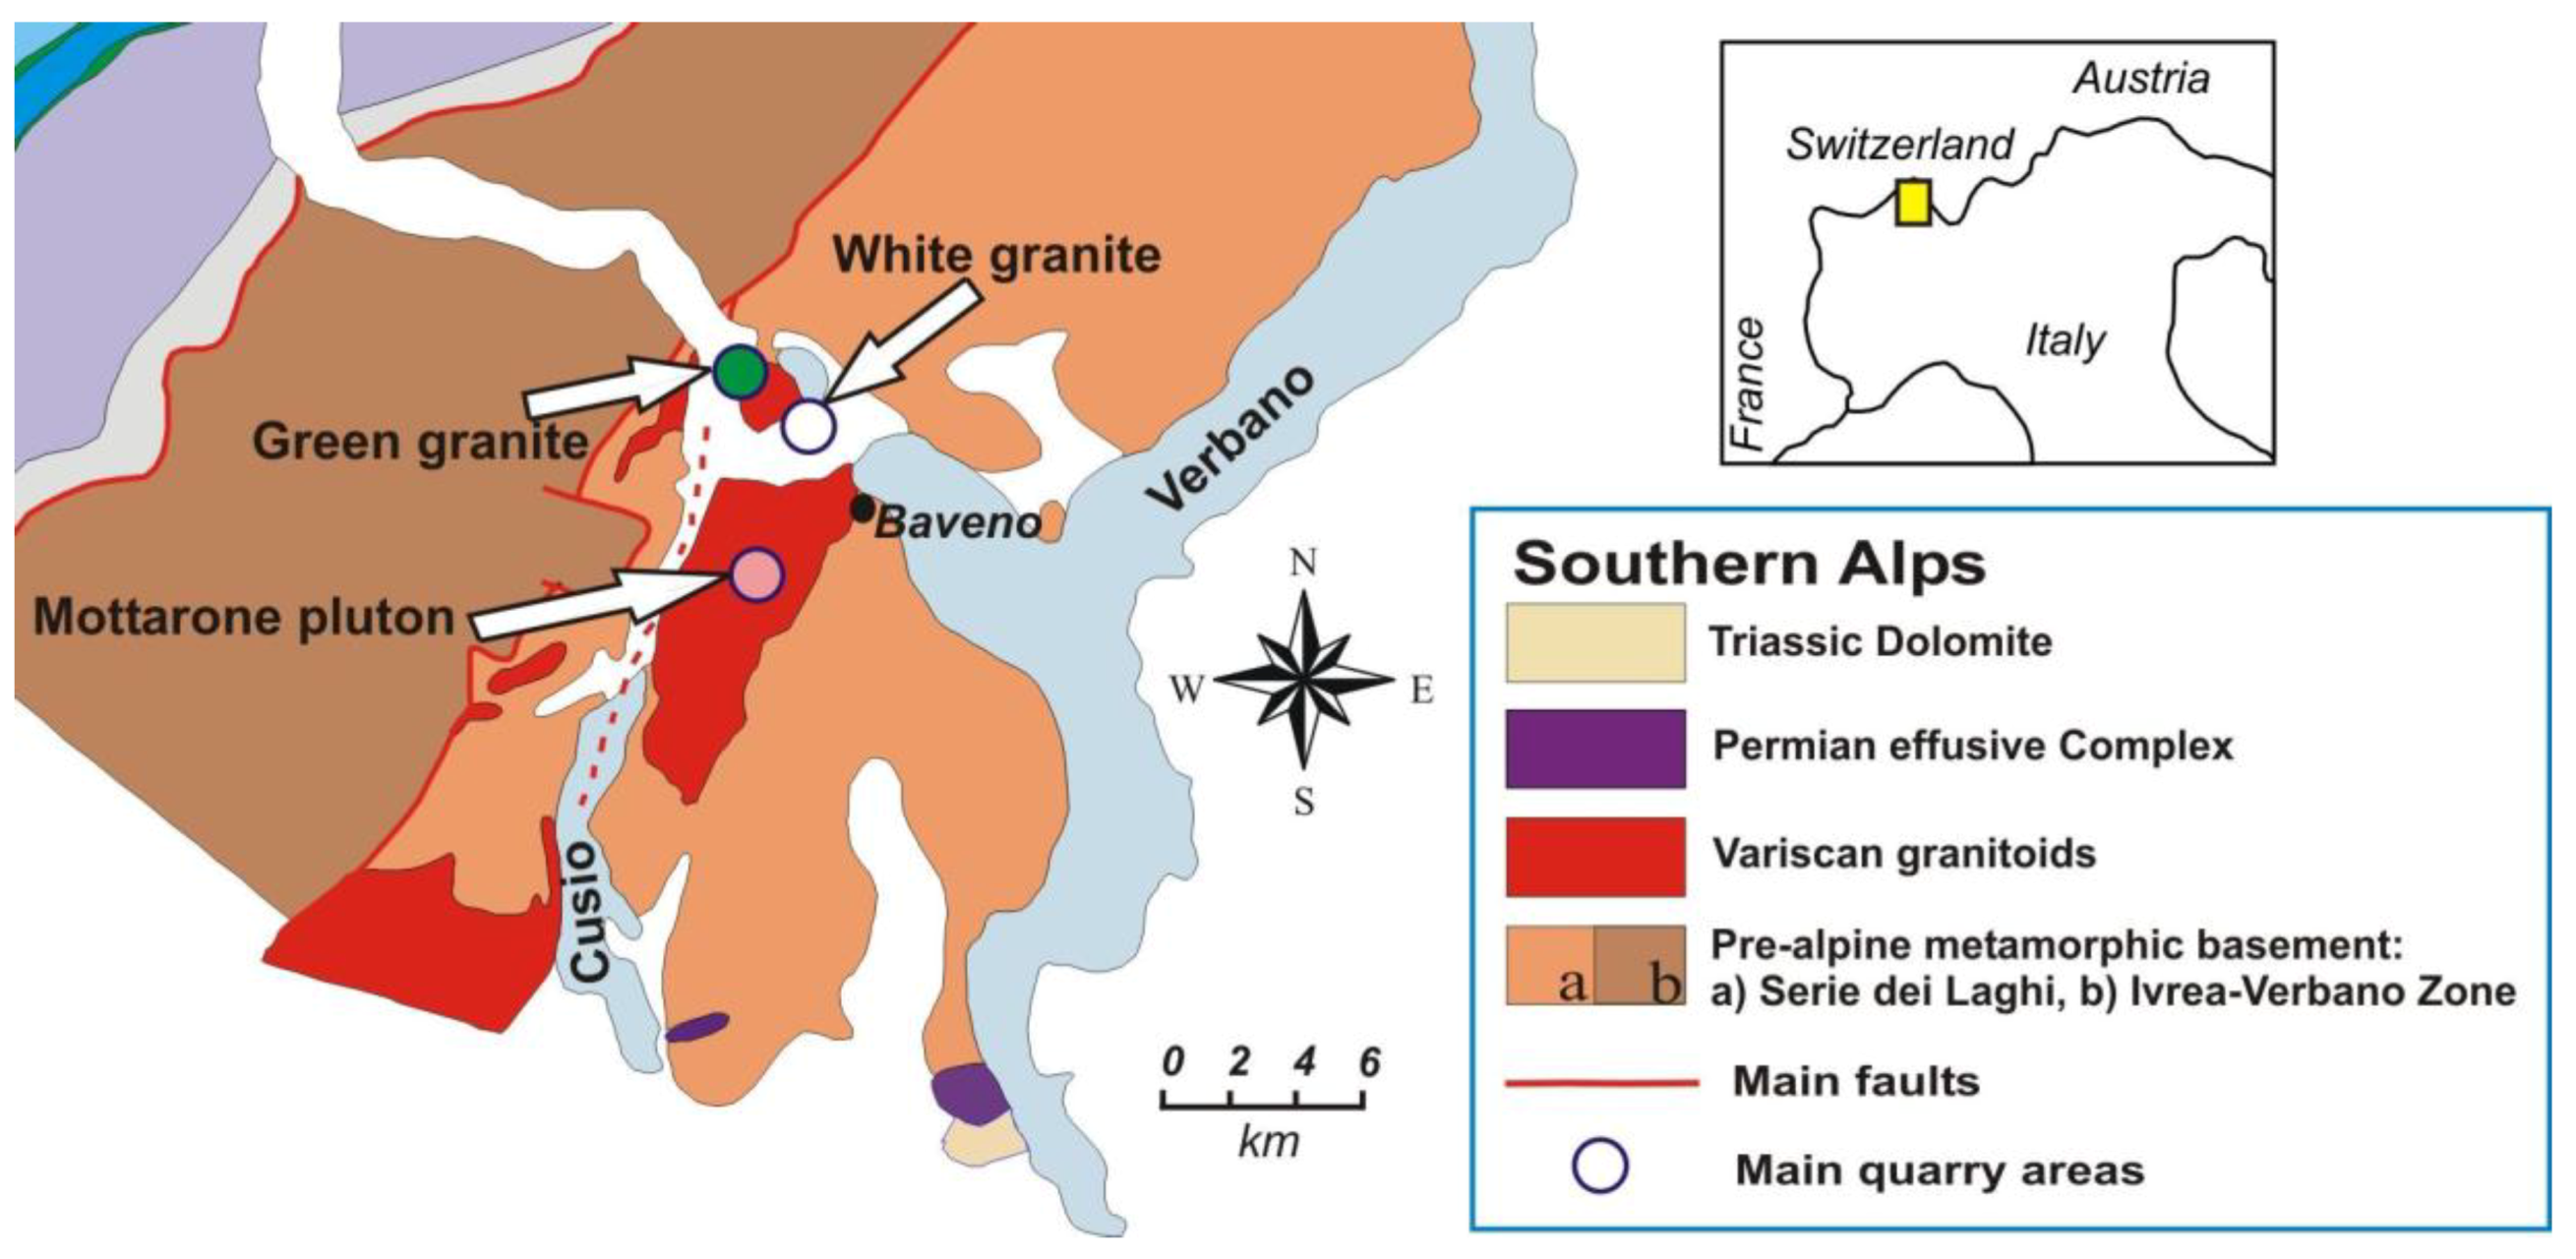
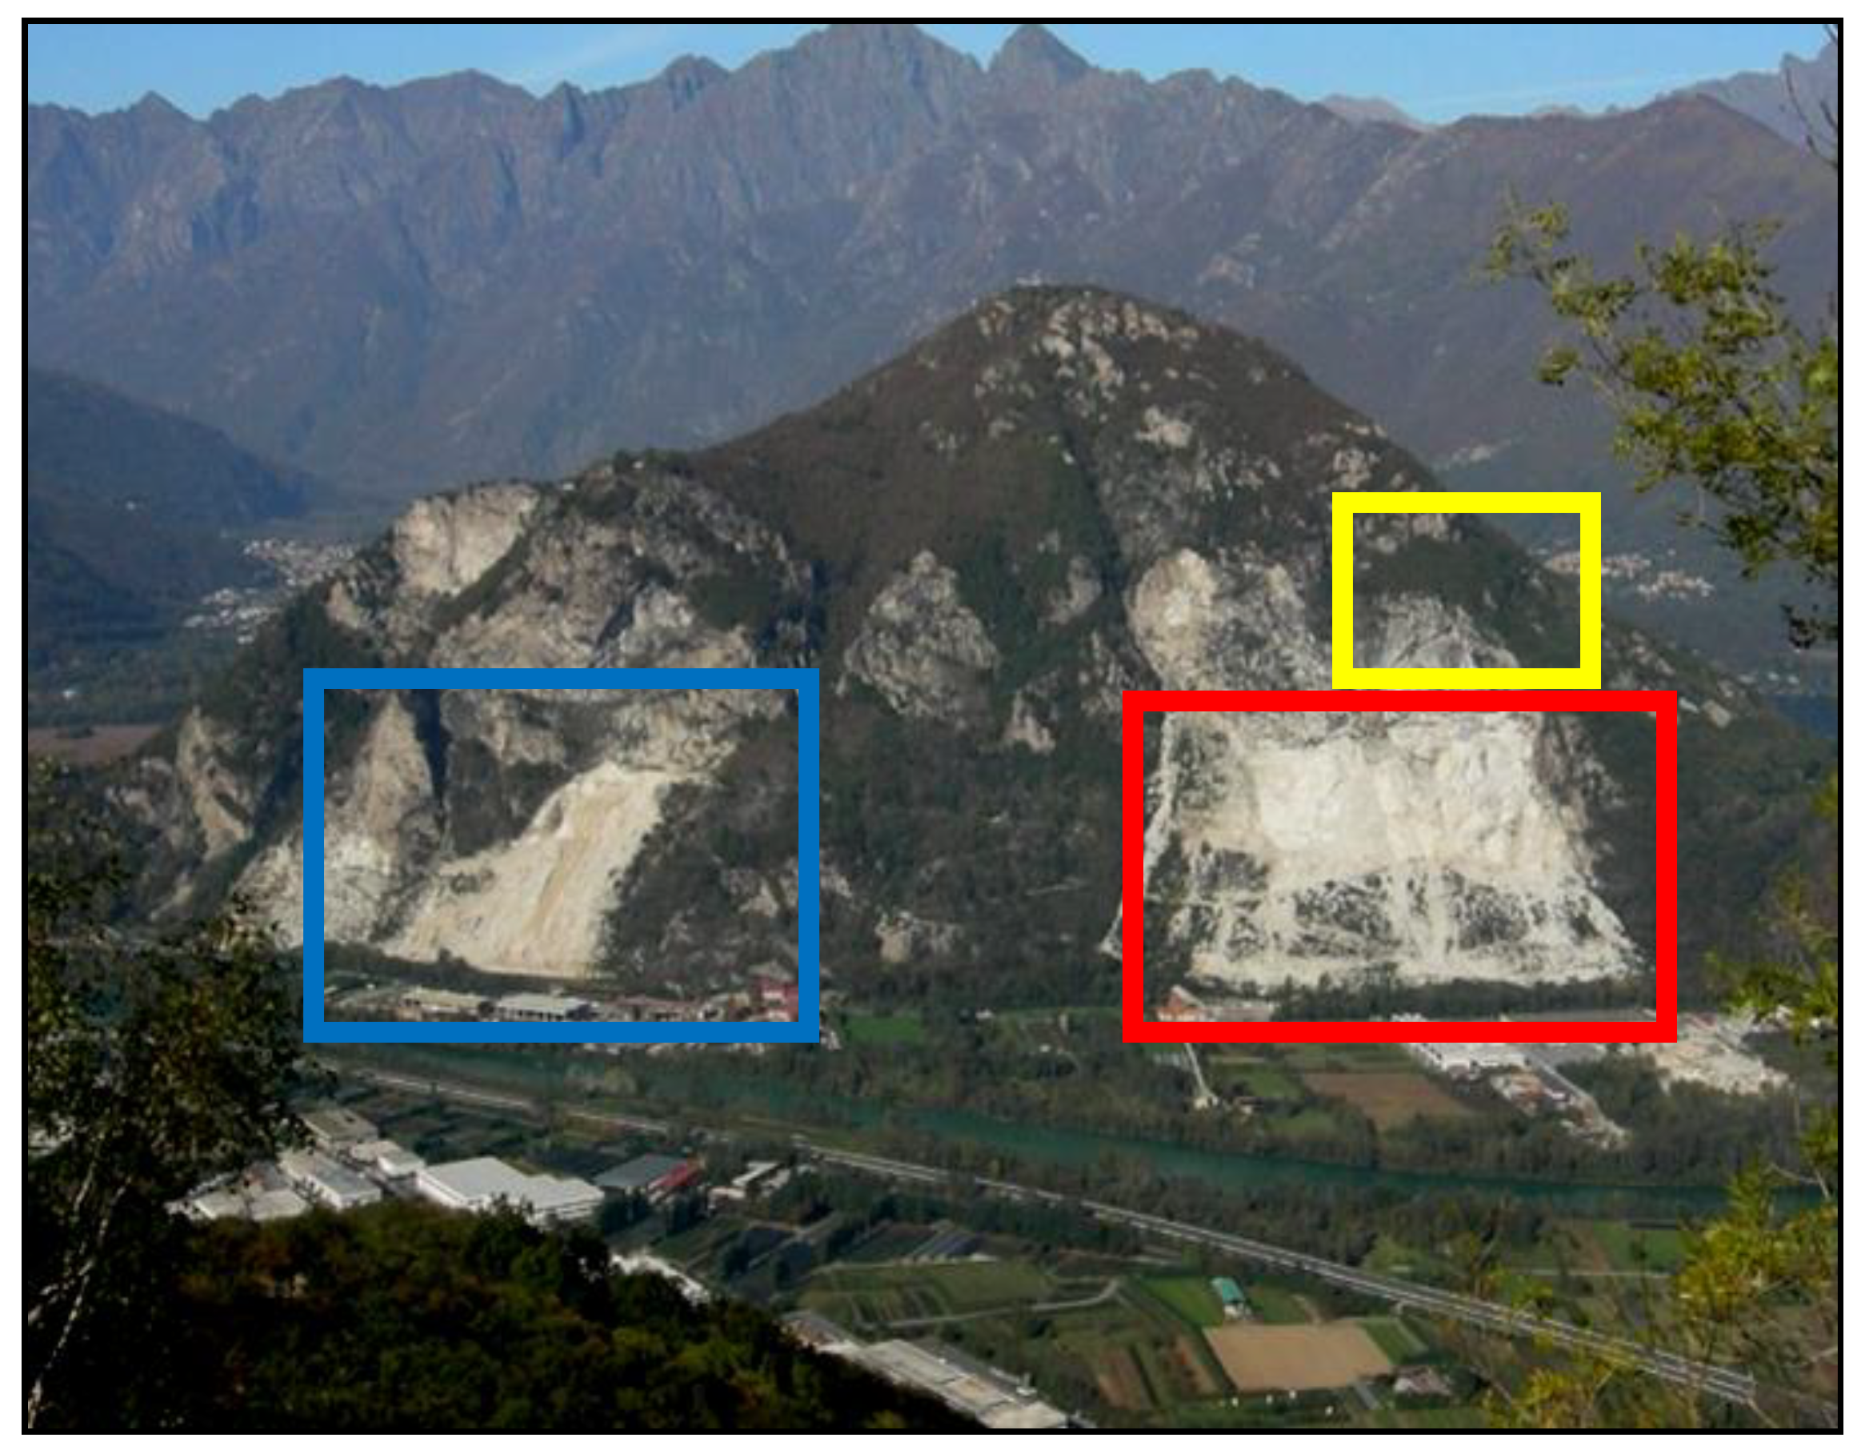
The sites are in the Verbano Cusio Ossola area (Piedmont, Northern Italy), well known for dimension stone exploitation and for granite quarrying (“Graniti dei Laghi”). The investigated sites are located in two granitic massifs: Montorfano massif, within Montorfano and Verbania municipalities, and Monte Camoscio massif, in the Baveno municipality. These late Variscan granites (around 280 My) are intruded in the Hercynian basement (southern Alps), including the “Serie dei Laghi” (upper continental crust), to the south-east and the “Ivrea-Verbano Zone” (lower continental crust) to the north-west (Figure 2). The well-known pink “Rosa Baveno” granite pertains to the Baveno pluton: it has a medium-fine homogeneous grain size, a massive texture, and the main rock-forming minerals are quartz, perthitic K-feldspar, plagioclase, and biotite, with small amounts of amphibole (hornblende) and chlorite. Typical accessory minerals are zircon, apatite, allanite, monazite, and traces of sulfides. The white “Bianco Montorfano” granite has a comparable mineralogical composition, but K-feldspar is white, and it occasionally contains mafic microgranular enclaves (“Schlieren”) and sulfides (especially arsenopyrite), which negatively affect the quality of the stone (rust-colored spots). The green “Verde Mergozzo” granite occurs on the north-western slope of the Montorfano, and the green color of this granite (given by chlorite and epidote) is due to post emplacement hydrothermal metasomatism. The granite exploitation in these areas officially started in the middle of the fifteenth century and has to date produced a huge quantity of EW, due to the inefficient (and old) quarrying techniques [35]; EW was stocked (up to the 80s of the 20th century) on the lower side of the mounts (Montorfano and Monte Camoscio), thus forming differently shaped EW facilities, showing a total volume of about 2 Mm3 [36,37]. The huge volumes of WR present on the hillsides (Figure 3) are a clear example of the problems connected with mining activities: evident hazard for citizens, significant environmental and landscape impacts, visual impacts for a rather touristic area as the investigated one (close to Maggiore and Mergozzo lakes and to the Ossola Valley).
Since 1995, a mining company started to exploit three different EW facilities (Sengio, Ciana-Tane Pilastretto, and Braghini, Figure 2 and Figure 3), by converting the granite WR facilities into a new “deposit” for feldspar and quartz exploitation, contemporarily producing several other commercial by-products employed in building, infrastructure and glass industries. This was done by creating a dedicated mineral dressing plant that, after crushing, milling and sieving the material, strongly improves feeding material characteristics through an electromagnetic separation. These deposits are progressively running out due to the continued exploitation, therefore the company investigated other EW facilities (Montorfano EW facility in yellow in Figure 3) in the area, which show similar characteristics.
The main product is commercially known as F60P (quartz feldspar mixture: 60% of feldspar, mostly K-feldspar), whose production is about 65,000 t/year. Different by-products, obtained after the enrichment of the produced waste (mainly powder granite and fractions enriched in ferromagnetic minerals), and commercially known as SNS-sand (premix for building uses), NGA- coarse black sand (used for industrial sandblasting), SF-wet feldspar (for the ceramic industry), and SF100 and SF200 (used as fillers in cement industries), have to be added to the F60P production. The total amount of by-products is about 110,000 t/year.

2.2. Sampling, Mine Waste Characterization, and Ore Recovery Estimation

As introduced, two different field activities were carried out in order to characterize and estimate the volume of the investigated EW facilities: in 2009 [37] and 2016 (Figure 3) In both cases, EW samples (small pieces of rock chips) were collected using a hammer and chisel from blocks present in the facilities or using a hand shovel in the case of small size rocks. During the two field campaigns petrological and geochemical characterization was carried out. The petrological data have been previously published [38]; here only the geochemical characterization is described.
In 2009, two different square nets were used as follows: a square net of about 50 m per side was used for Sengio and Ciana-Tane Pilastretto while a net of about 30 m per side was used at the Braghini quarry dump: the different net measures are due to the morphology of the investigated sites. Overall 78 samples were taken in total as follows (Table 3): 26 samples from the Sengio EW facility, 30 from the Ciana-Tane Pilastretto area, and 22 from the Braghini area. The treatment at laboratory scale was used to mimic what normally happens in the active treatment plant; briefly, the process can be summarized as a progressive grinding (by means of jaw crushers and roller mills) and screening. The obtained material (WR) was then treated by means of three passages in a magnetic separator (permanent magnet cylinders), in order to obtain the final product (first step: 1SM; second step: 2SM; third step: 3SM). A geochemical characterization of the major and minor elements was carried out using an X ray spectrometer—Siemens SRS 303 on both the original rocks (WR) and on the treated material (1SM, 2SM, and 3SM). The geochemical analysis of the major elements was fundamental to evaluate the Fe2O3 grade of each sample, in order to estimate the Fe content average for each EW facility.
In 2016 the Montorfano EW facility was split into a square net of about 10 m per side (the area is smaller and easier to access than the three areas investigated in 2009). A total of 8 samples were collected from Montorfano EW facility; other 8 samples were collected from the active treatment plant (representing feeding materials, products—F60P, and the different by-products) (Table 3). The collected samples were treated at laboratory scale (drying, crushing, milling, screening) in order to have representative samples for geochemical characterization. No simulation at laboratory scale of the dressing plant was carried out; at this stage only the geochemical characteristics (alkalis, Fe2O3, etc.) of the potential feeding material was required, together with the characterization of the different products and by- products. In addition to the geochemical characteristics as for the major elements, REE presence in the original rock and in the magnetic by-products was evaluated (potential CRM content associated with monazite present in the original granite). The following geochemical methods were adopted:
  • lithium metaborate/tetraborate fusion ICP-OES for major and minor elements;
  • lithium metaborate/tetraborate fusion ICP-MS for REE.
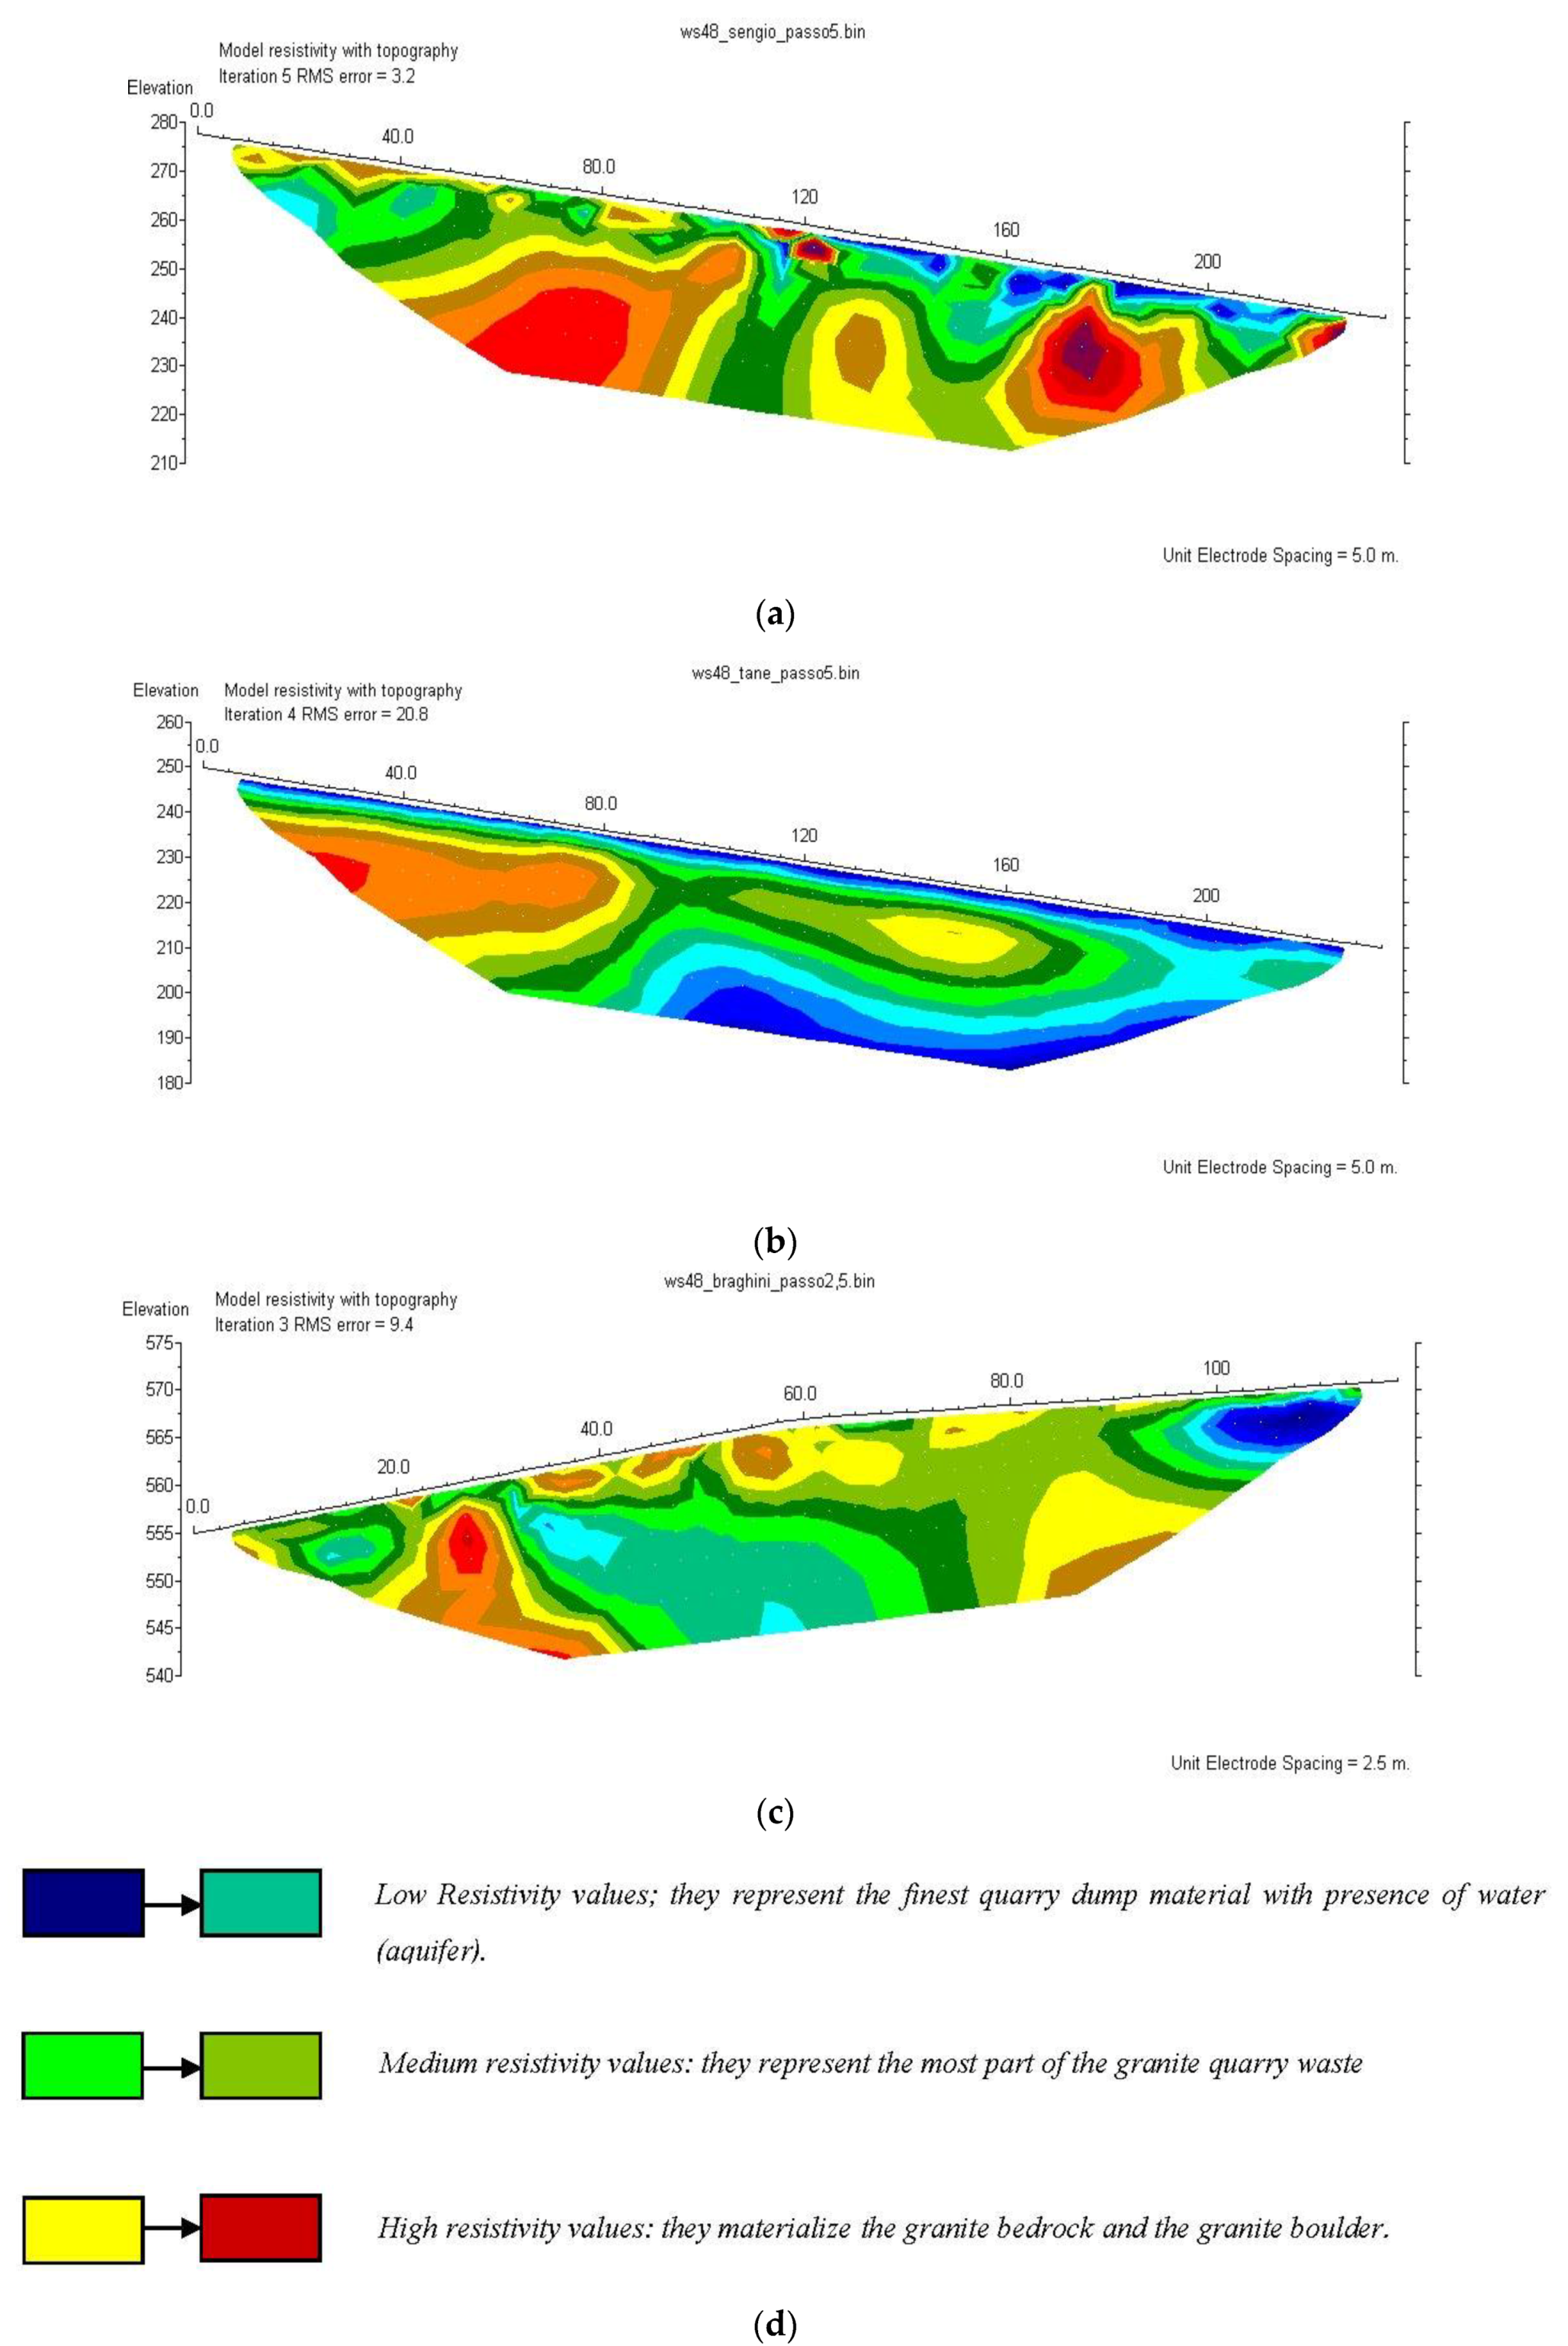
To estimate the volume of the EW facilities, geophysical survey, topographic, and morphologic 3D characterization were carried out. Briefly, the electrical tomography investigation was carried out in 2009, together with a field survey to estimate the area and the thickness of the three investigated waste deposits (Sengio, Ciana Tane-Pilastretto, and Braghini). Thanks to a processing phase, the collected field data (resistivity data) were processed to obtain a resistivity model of the investigated area and a 2D resistivity cross section [38]. It was then possible to estimate the deepness of the granitic bedrock in the cross section, thanks to the use of different colors, which correspond to different resistivity values. The resistivity difference can be related to the unconformity of the granitic waste and bedrock.
In the Sengio area the tomography track is positioned in the median sector of the dump, through an internal working road that crosses the whole volume. The parameters for the geophysical survey were: 5 m of electrode distance to obtain a length of 240 m, and a sampling rate of 250 ms. The same configuration as the Sengio area was used in the Ciana-Tane Pilastretto area. In this area the position of the cross section was set in the basal sector of the waste volume. Finally, in the Braghini EW facility the tomography cross section was set at a N–S direction, crossing the waste area in the lowest sector of the deposit; in this case the configuration of the survey was as follows: 48 electrodes, at a distance of 2.5 m for every electrode, with a total section of about 117.5 m.
The considerable grain size distribution of the material conditioned the electrical signal response. Thanks to the geophysical and field surveys, it was possible to estimate both the thickness and the area of the EW deposits and, consequently, calculate the volume of the three EW facilities (assuming that the EW filled the empty spaces of past activities).
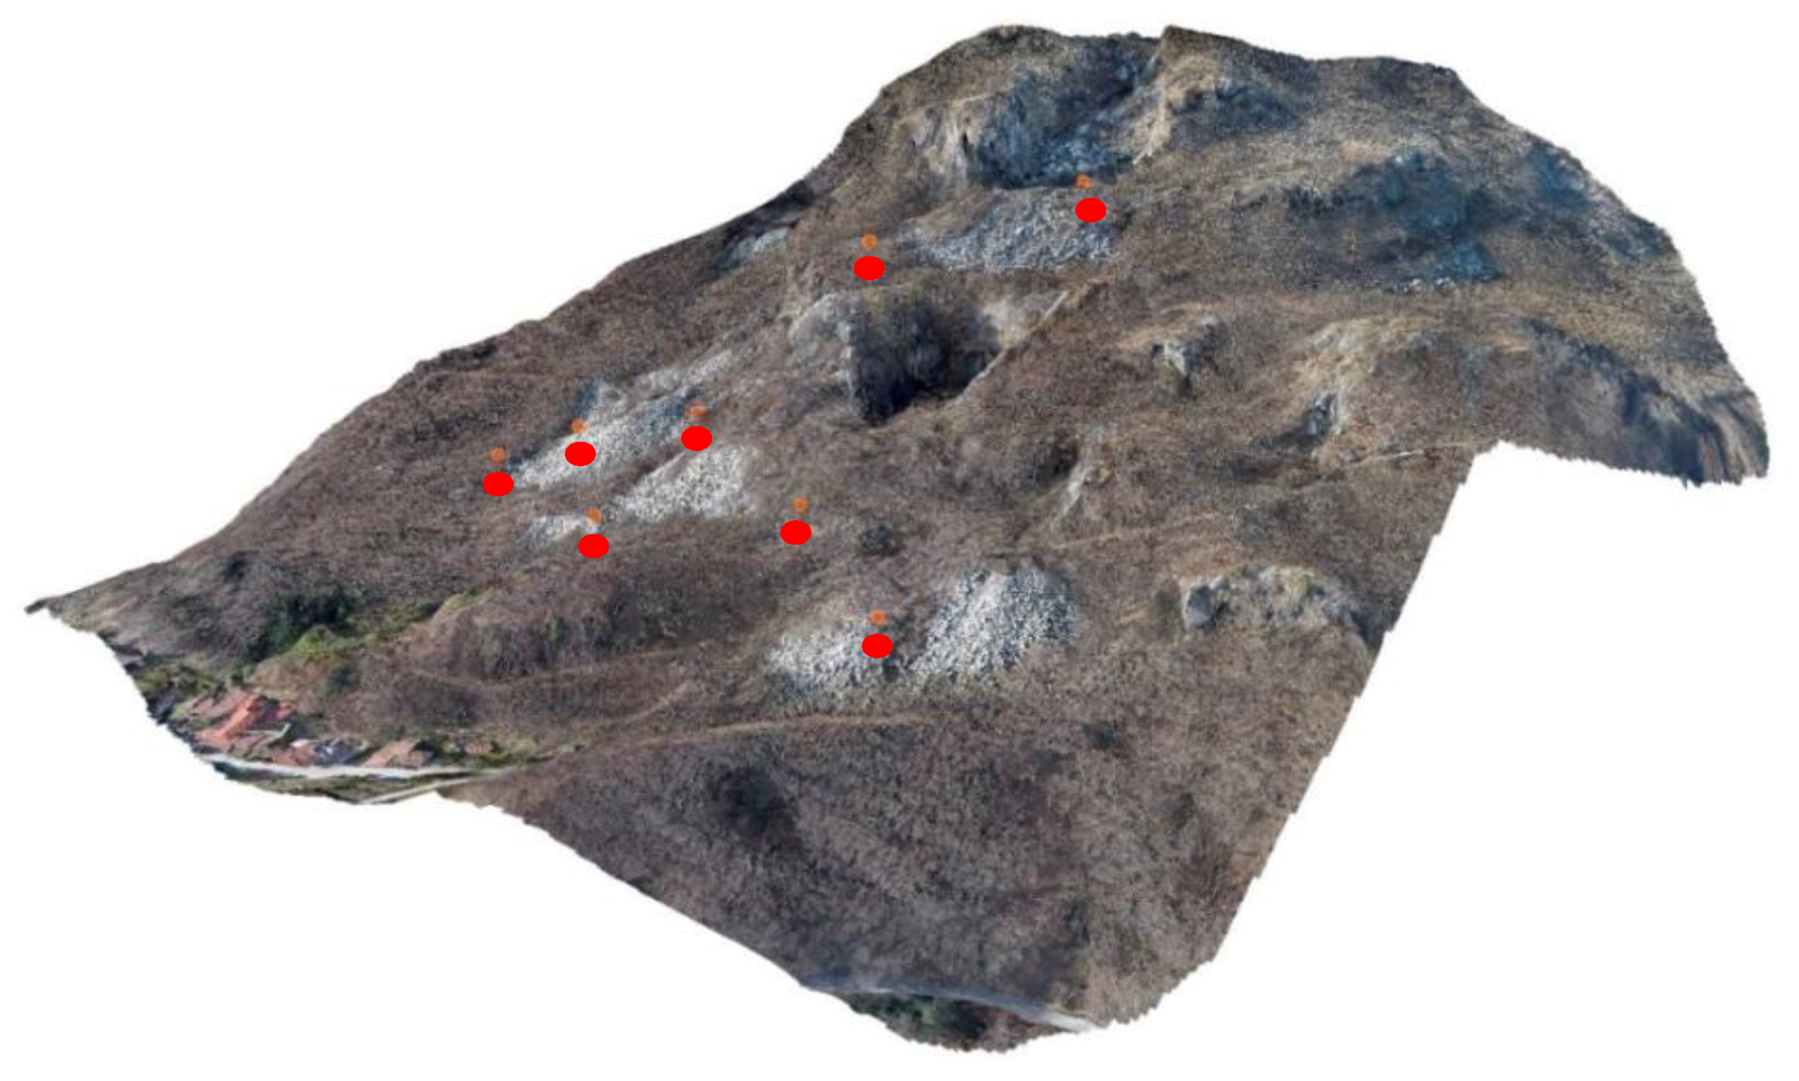
The topographic and morphologic 3D characterization of the Montorfano site was set in 2016 to obtain, with a GIS project, a detailed reconstruction of the topographic surfaces, useful for the site modelling and to evaluate the volume of the EW facilities [30]. Following the preliminary site inspection and analysis, the most suitable survey method was chosen. An aerial laser scanning based digital elevation model (DEM), digital orthophoto and site treatment maps, was carried out. Topographic map data were collected using unmanned aerial vehicle (UAV)—drone photogrammetry-based surveys, as well as other traditional survey methods. The output of the photogrammetry process is typically a map, drawing, measurement, and a 3D model. Nowadays, classic aerial photogrammetry is often replaced by Structure from Motion (SfM) techniques, where the camera is mounted on a helicopter or a UAV and is usually pointed vertically towards the ground. Multiple overlapping photos of the ground are taken as the aircraft flies along a flight path. These images are later processed to obtain, for example, geometric corrected images (orthophotos) and Digital Surface Models (DSM). After conducting the field surveys (UAV flight and Ground control point survey), post-processing activities for the data obtained (matching photo survey, building the point cloud in a local reference system, mesh wrapping and filtering of outliers, texturing 3D model and building an orthomosaic, model georeferencing in the chosen cartographic reference system, exporting the georeferenced orthomosaic and Digital Elevation Model, extracting cross section and contour) are necessary. Thanks to the topographic and morphologic characterization it was possible to estimate the area, the thickness of the EW and, consequently, calculate the EW volume, assuming that the EW filled the empty spaces of past activities.

2.3. Assessing Environmental Impacts for Resource Recovery Activities and SRM Use as Substitute Material

Environmental impact analysis is always crucial in the case of activities with high sustainability impact. Focusing on environmental impacts, standardized life-cycle-analysis (LCA) models and inventories were created using literature or collected material and energy data. The aims of the assessment carried out were the determination of the environmental impacts connected to the recovery activity and the environmental savings from the use of SRMs as substitute material. Main input data for the analysis are as follows:
  • the amount of the total waste/year;
  • the technology tree model representing the technology steps to extract the SRMs from the source;
  • the material and energy flows of each technology steps;
  • the extractable SRMs.
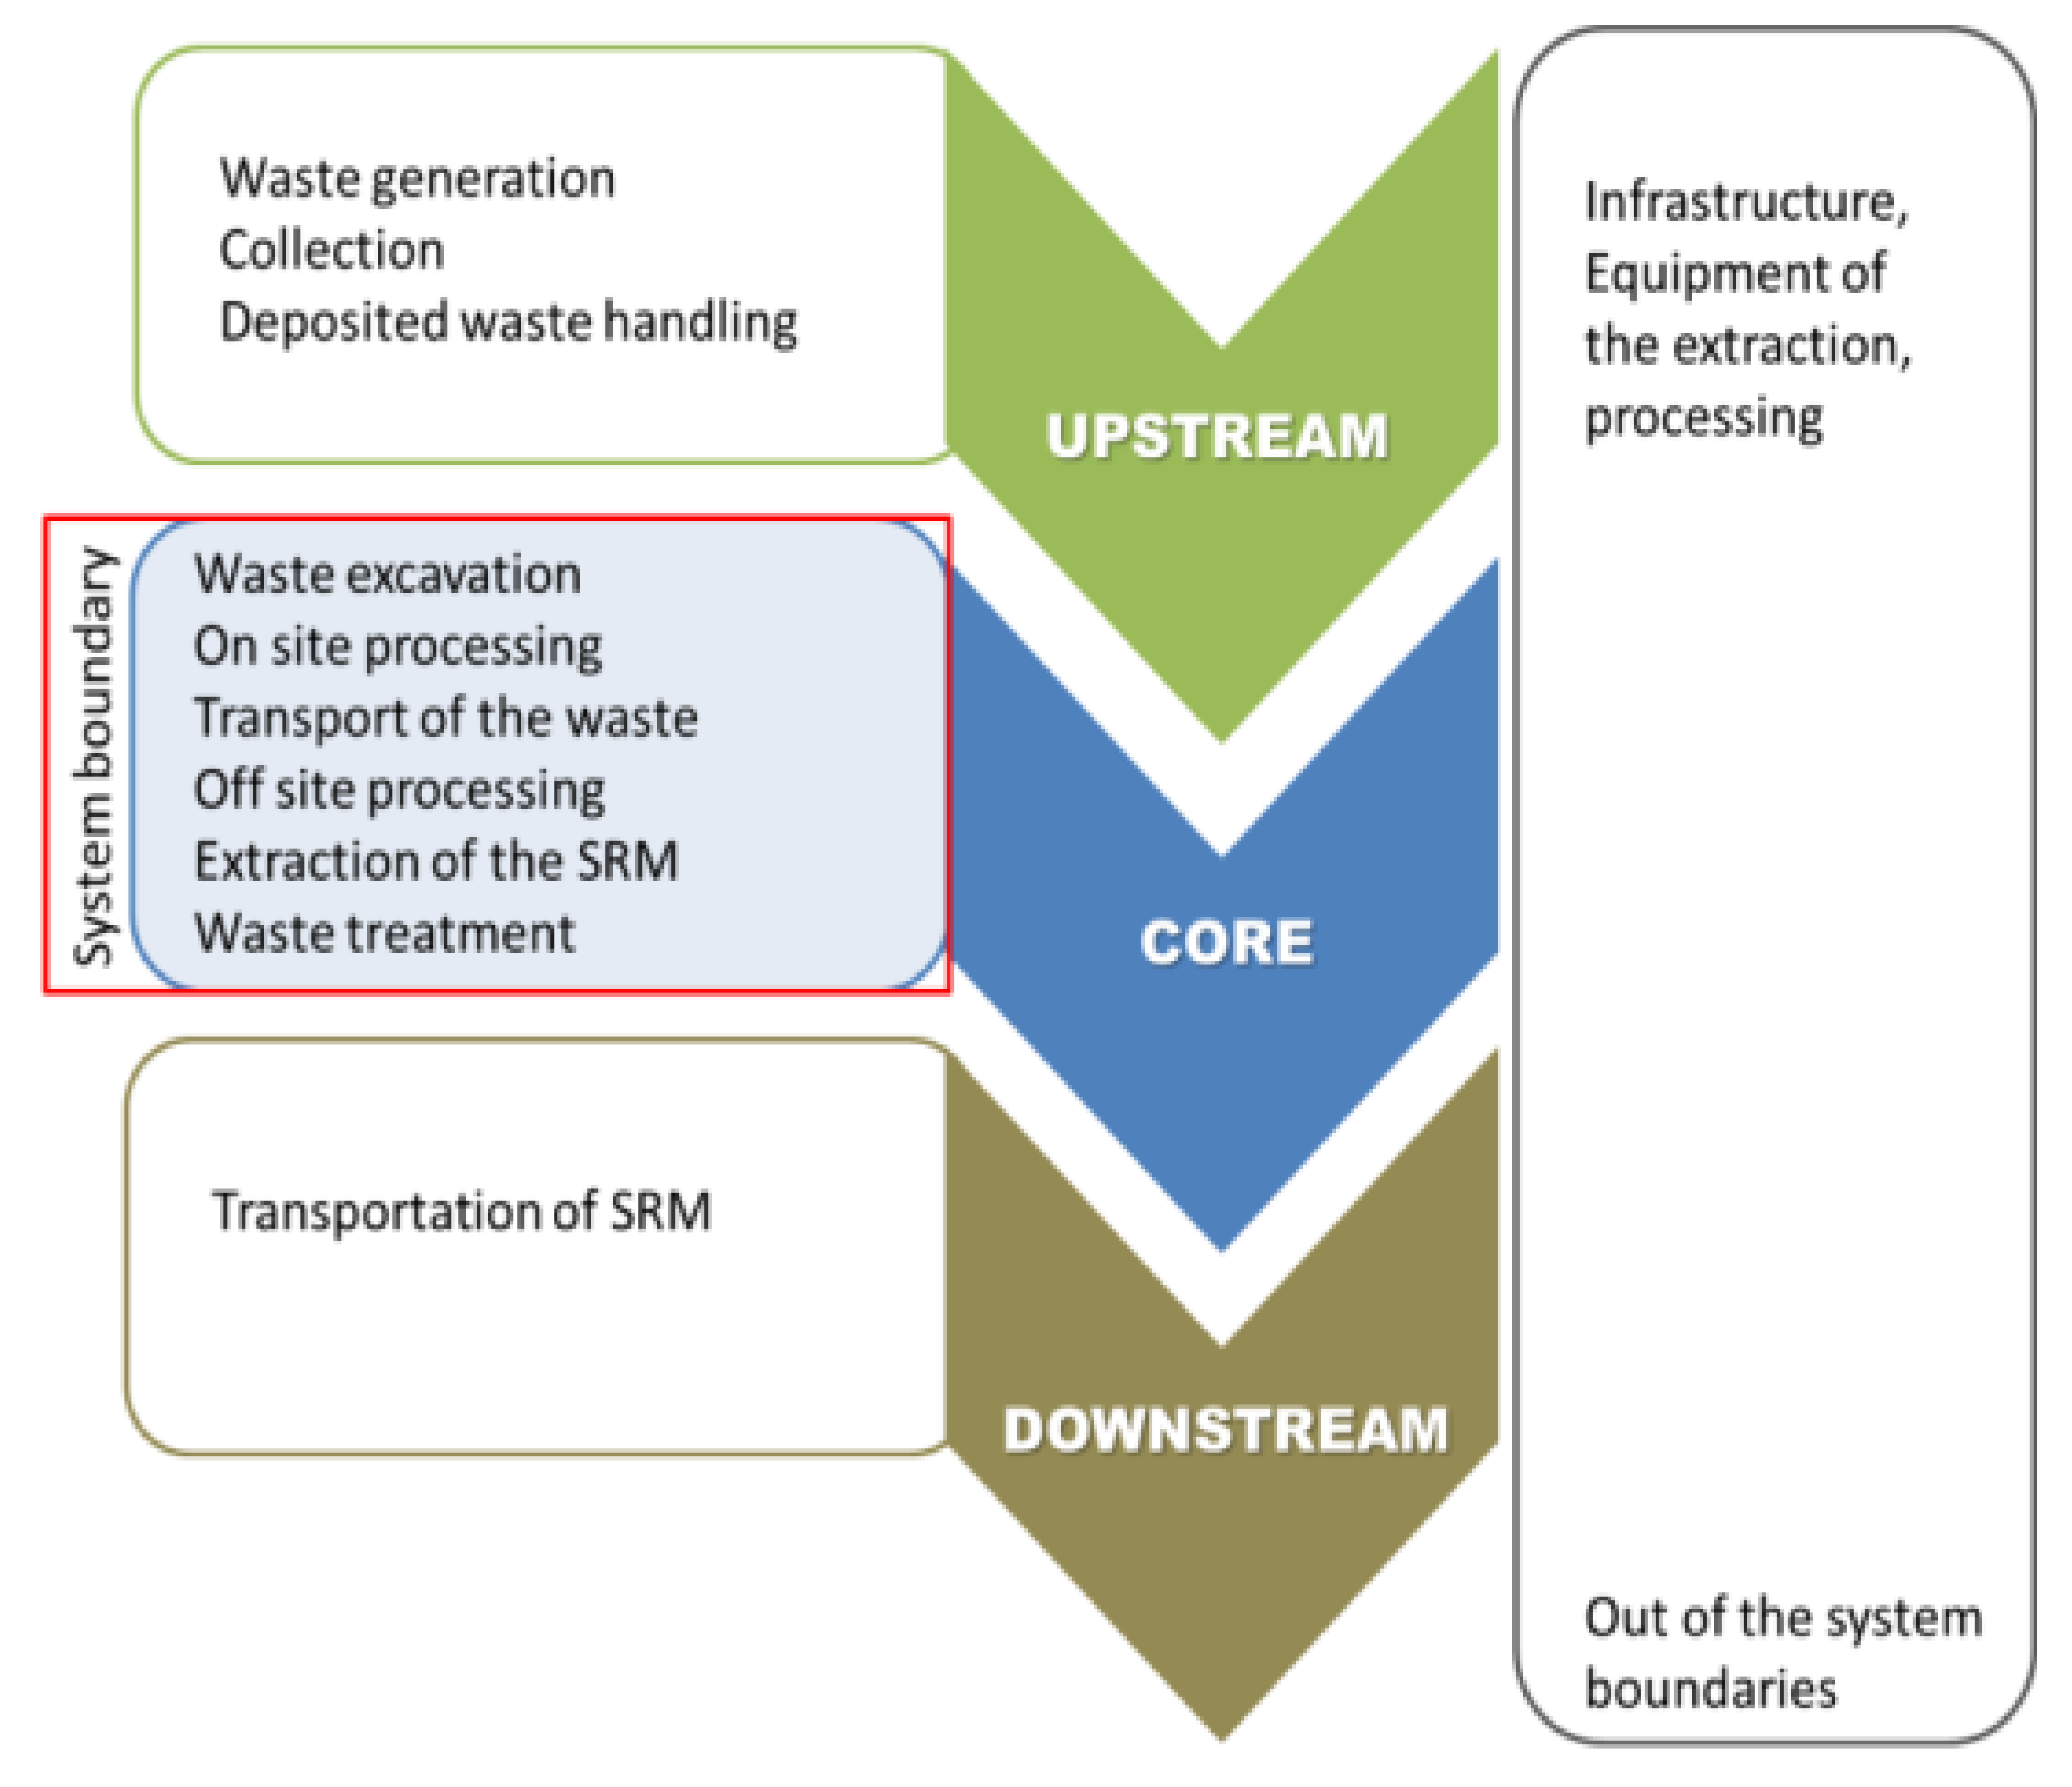
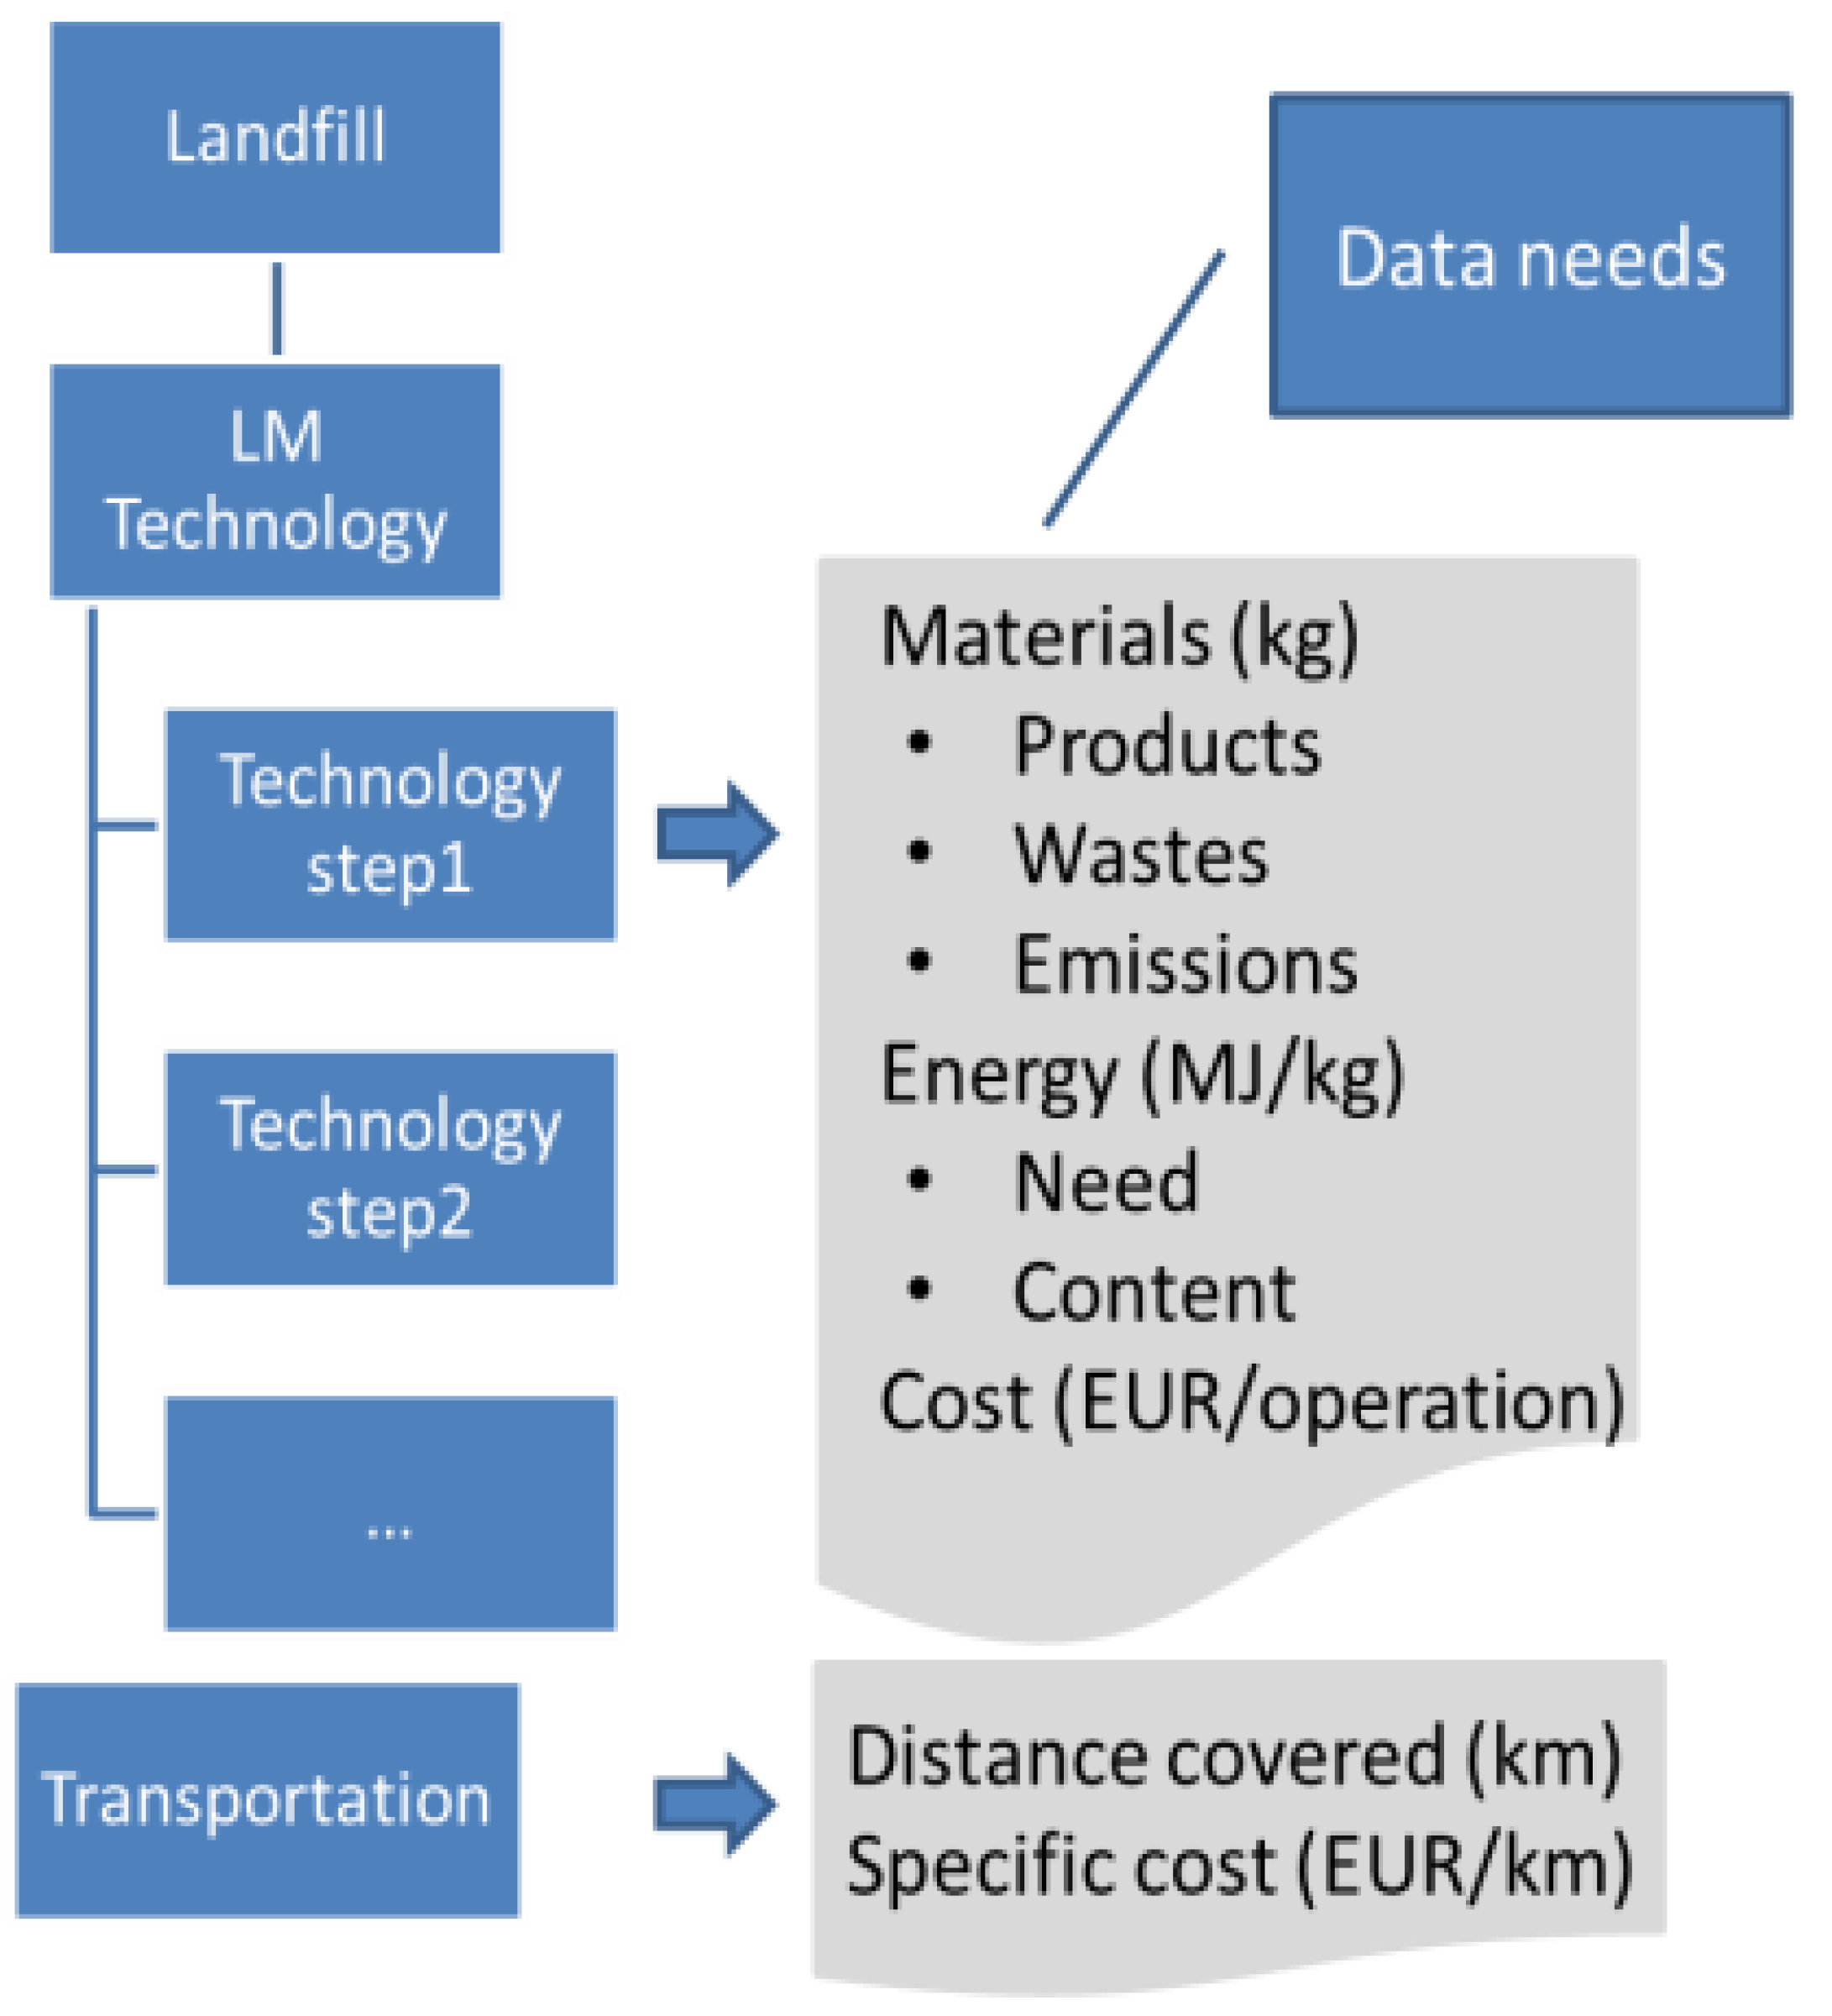
The amount of extractable waste at the site is estimated to be 190,000 tons annually. System boundaries considered were the extraction and transportation to the dressing plant; and the end of the dressing processes that supply SRMs suitable for putting on the market (Figure 4). Transportation of SRM for usage is not considered as part of the system. Infrastructure development is also out of the scope, due to the low impact of long use. Besides, assessments were specific to 1000 kg of extracted material from the site (as functional unit). The process used for the extraction as well as producing marketable SRMs were also included into the model and analyzed. The technology tree model used represented all the technology steps (Figure 5), including their inputs, outputs, energy needs, and suitable equipment. Technology steps could either be onsite or external depending on the possibilities and the availability of equipment. If a technology step was external, ex-site transportation was considered. These data served as the foundations of the input–output analysis for environmental impact assessment.
SRMs extracted from the site (products and by-products) are used as substitute materials. SRMs and their main applications are as follows:
  • Main products (F60P, Feldspar, GRL and F60-40): feldspar for ceramic industry
  • Gravel and sands: for buildings and infrastructures
  • SF and SF100: for bituminous concrete
  • SN: for brick production
  • SNG: for external pavement and industrial surface treatments
  • SNS: for external pavement
  • Armor stone, aggregate for embankment and filler
The corresponding tonnages from the treatment plant are summarized in Table 4. A very high percentage of the incoming material is recovered in the treatment process. As a result, the amount of waste arising during the processes is very low, estimated to be 63 tons annually. Energy demand is significant in the case of such separation processes, which were calculated for each of the four major parts of the process. Data used for the impact analysis were sourced from internal reports and are reported in Table 5.
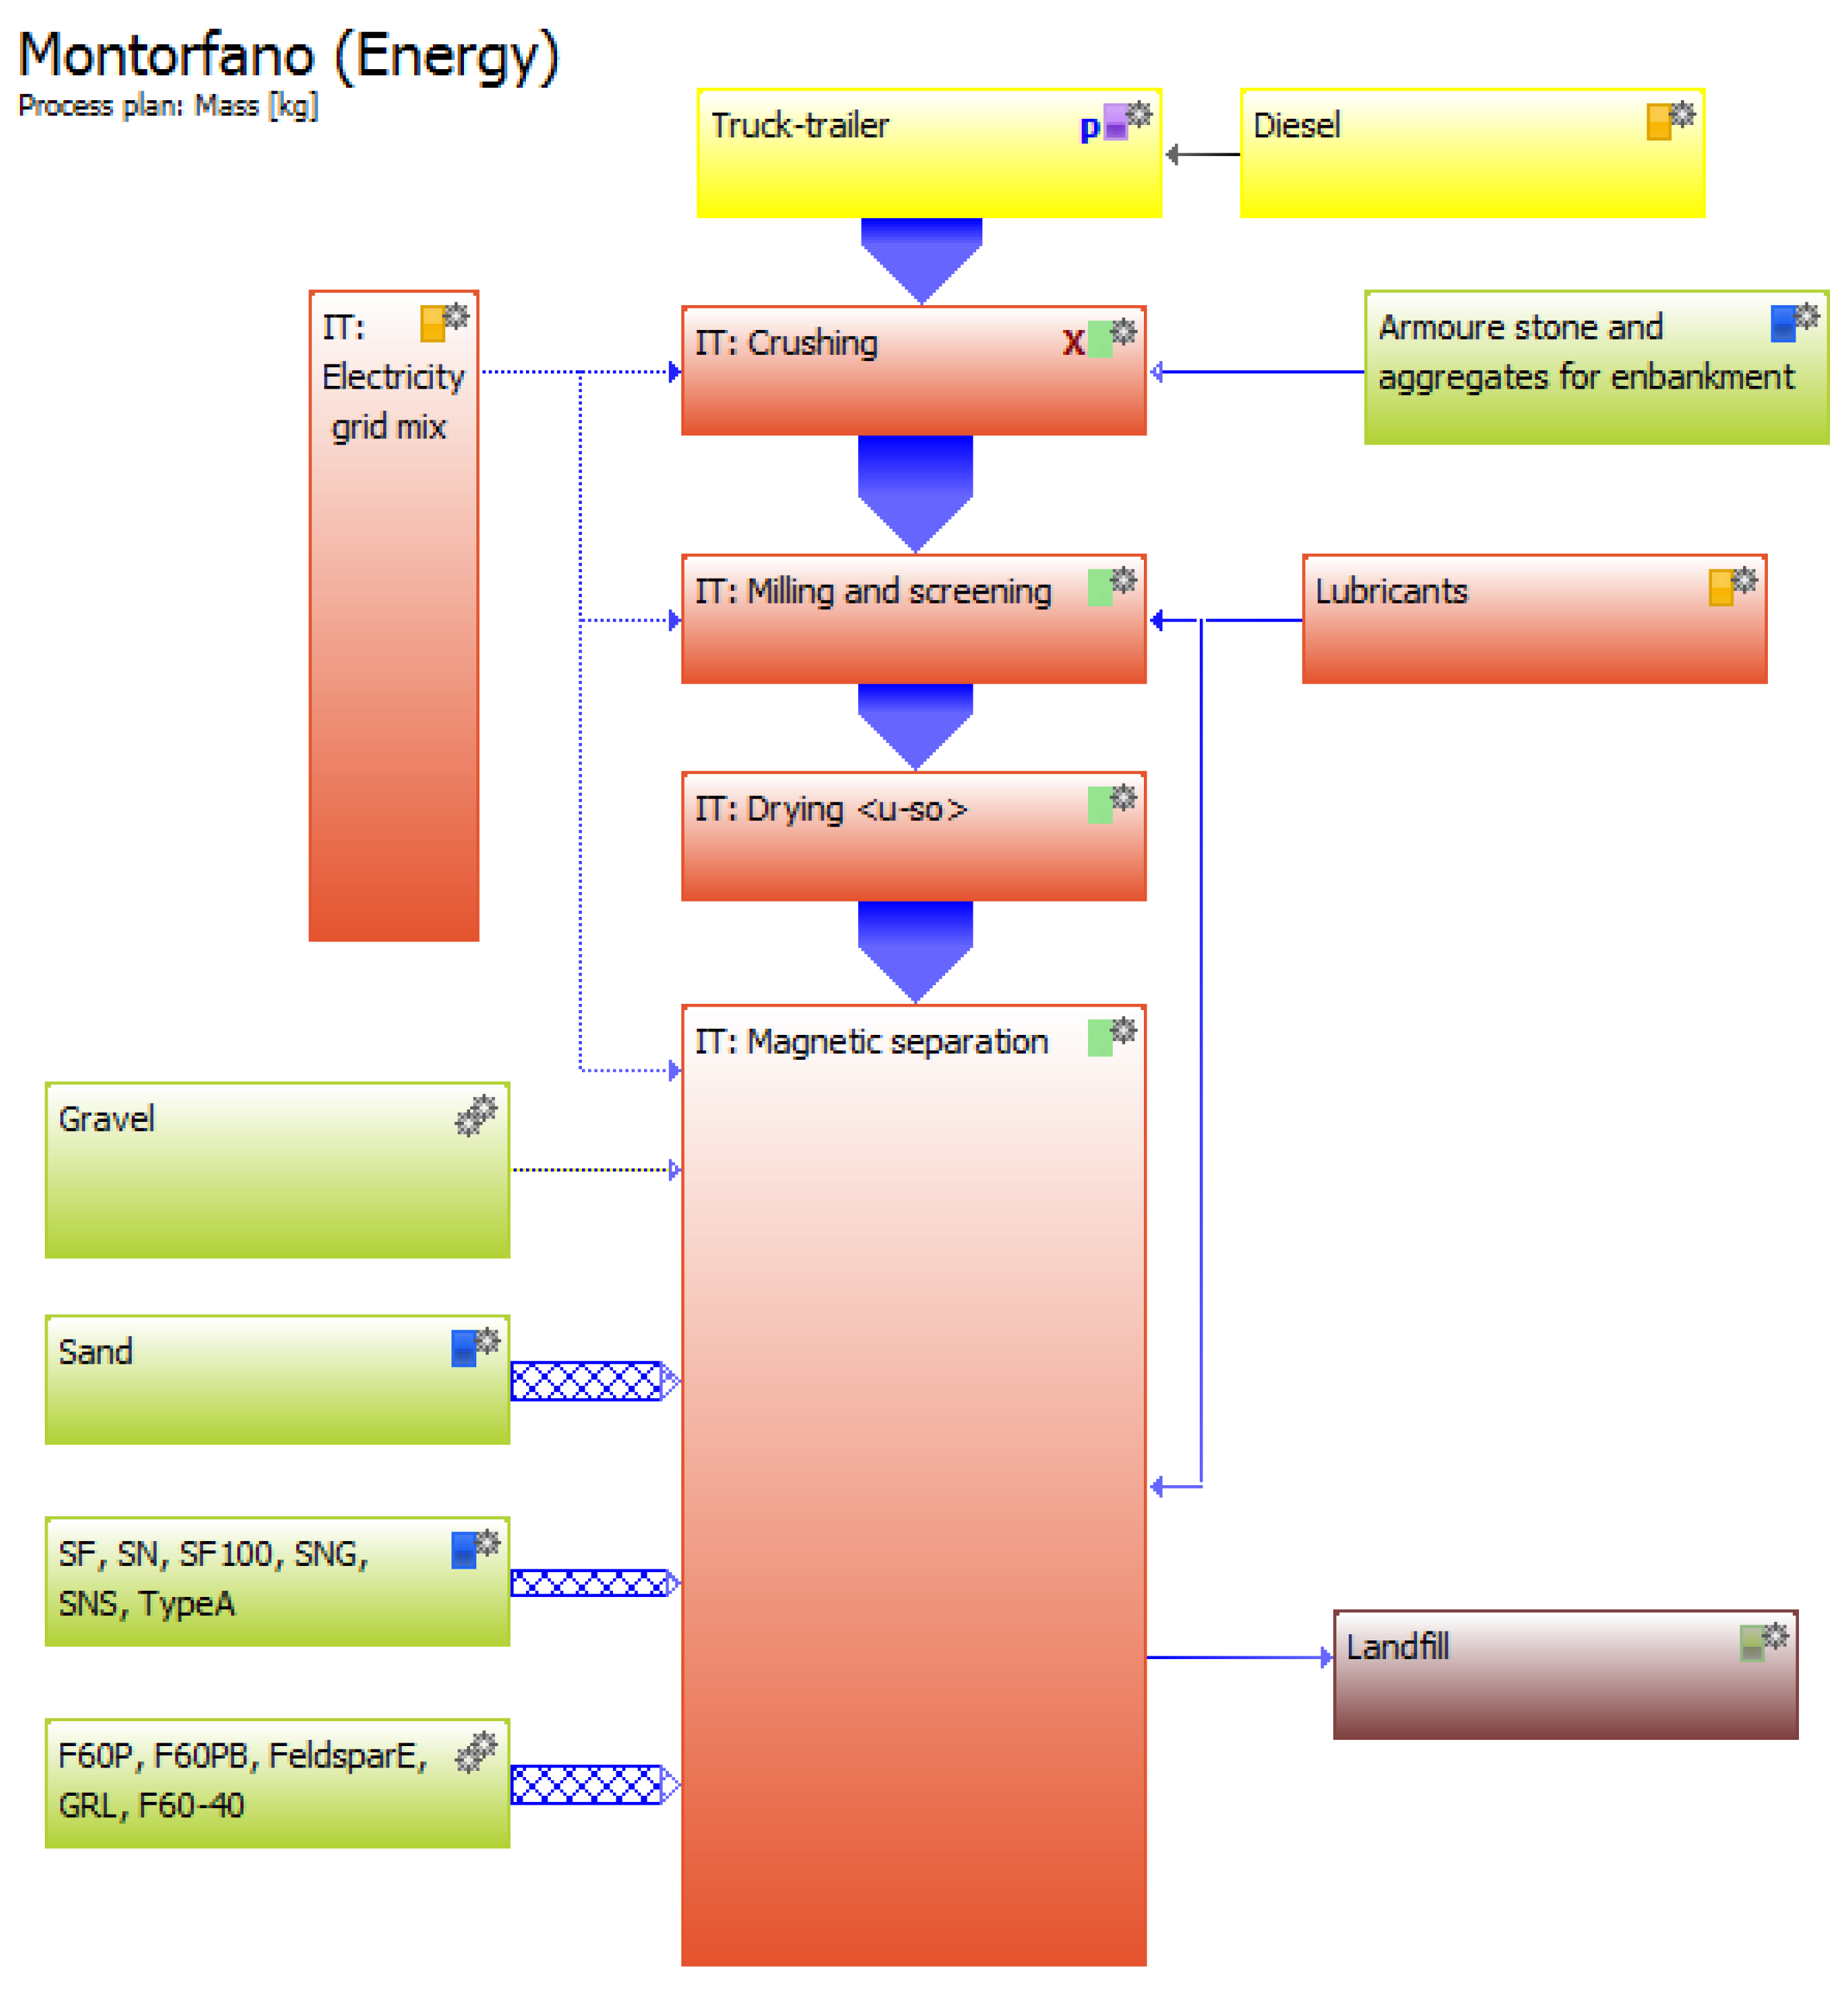
The refinery process was modelled using commercially available life cycle assessment software based on the aforementioned technology steps (Figure 6) and the collected data. For better clarity, all processes were grouped into three basic categories: processes for the dressing plant (red), processes for transportation (yellow), and landfilling (brown). Additionally, environmental savings (green) from the SRM use as substitute material were included into the model to enable the calculation of savings in accordance with the main goals. Modelled activities were analyzed and evaluated using ReCiPe methodology midpoint analysis with hierarchical approach, due to the suitable approach on the timeframe with 100 years for climate change. ReCiPe defines 18 impact indicators at midpoint level. Important impact indicators of climate change (incl. biogenic carbon) and freshwater eutrophication were indicated individually. As weighting was not developed for the mid-point indicators by the ReCiPe authors, midpoint values can be weighted using the PE LCIA Survey 2012. The endpoint indicators can be weighted using the ReCiPe weighting factors developed by the authors or using the weighting factors developed in the PE LCIA Survey 2012 [39]. The PE LCIA Survey 2012 method was used for weighting in the investigations.

3. Results

3.1. Characterization and Volume Estimation

3.1.1. Geochemical Characterization

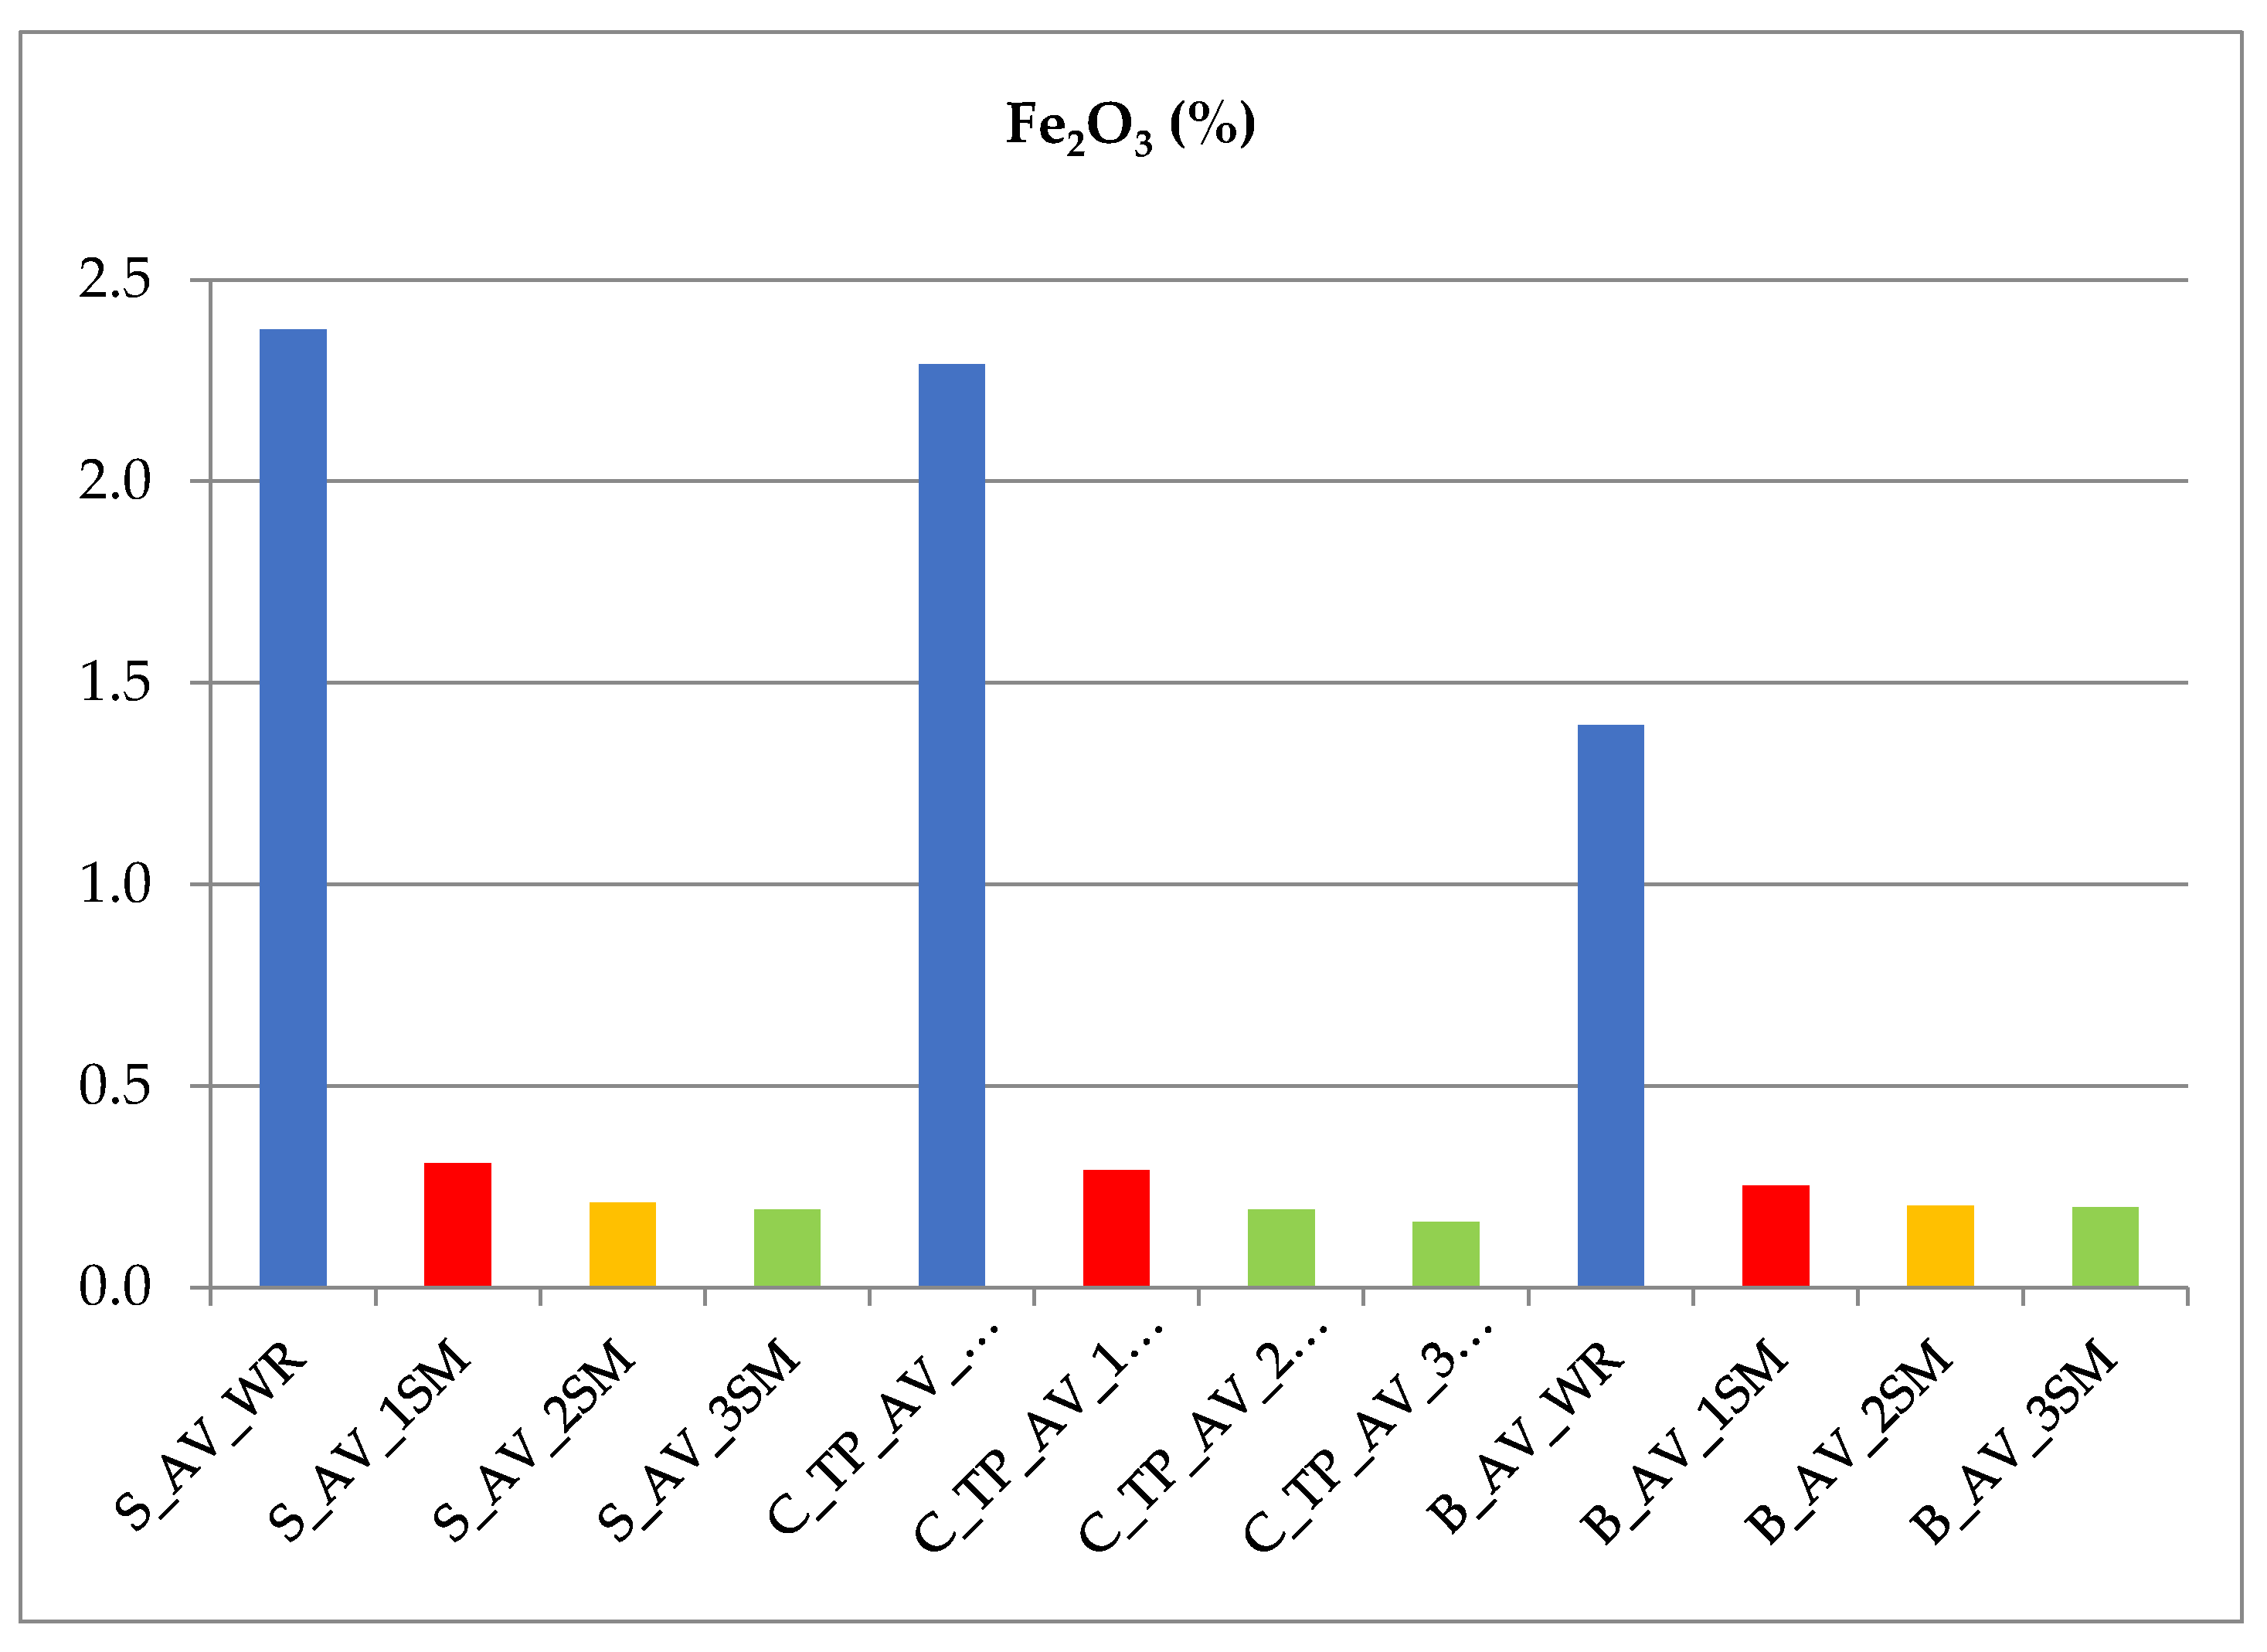
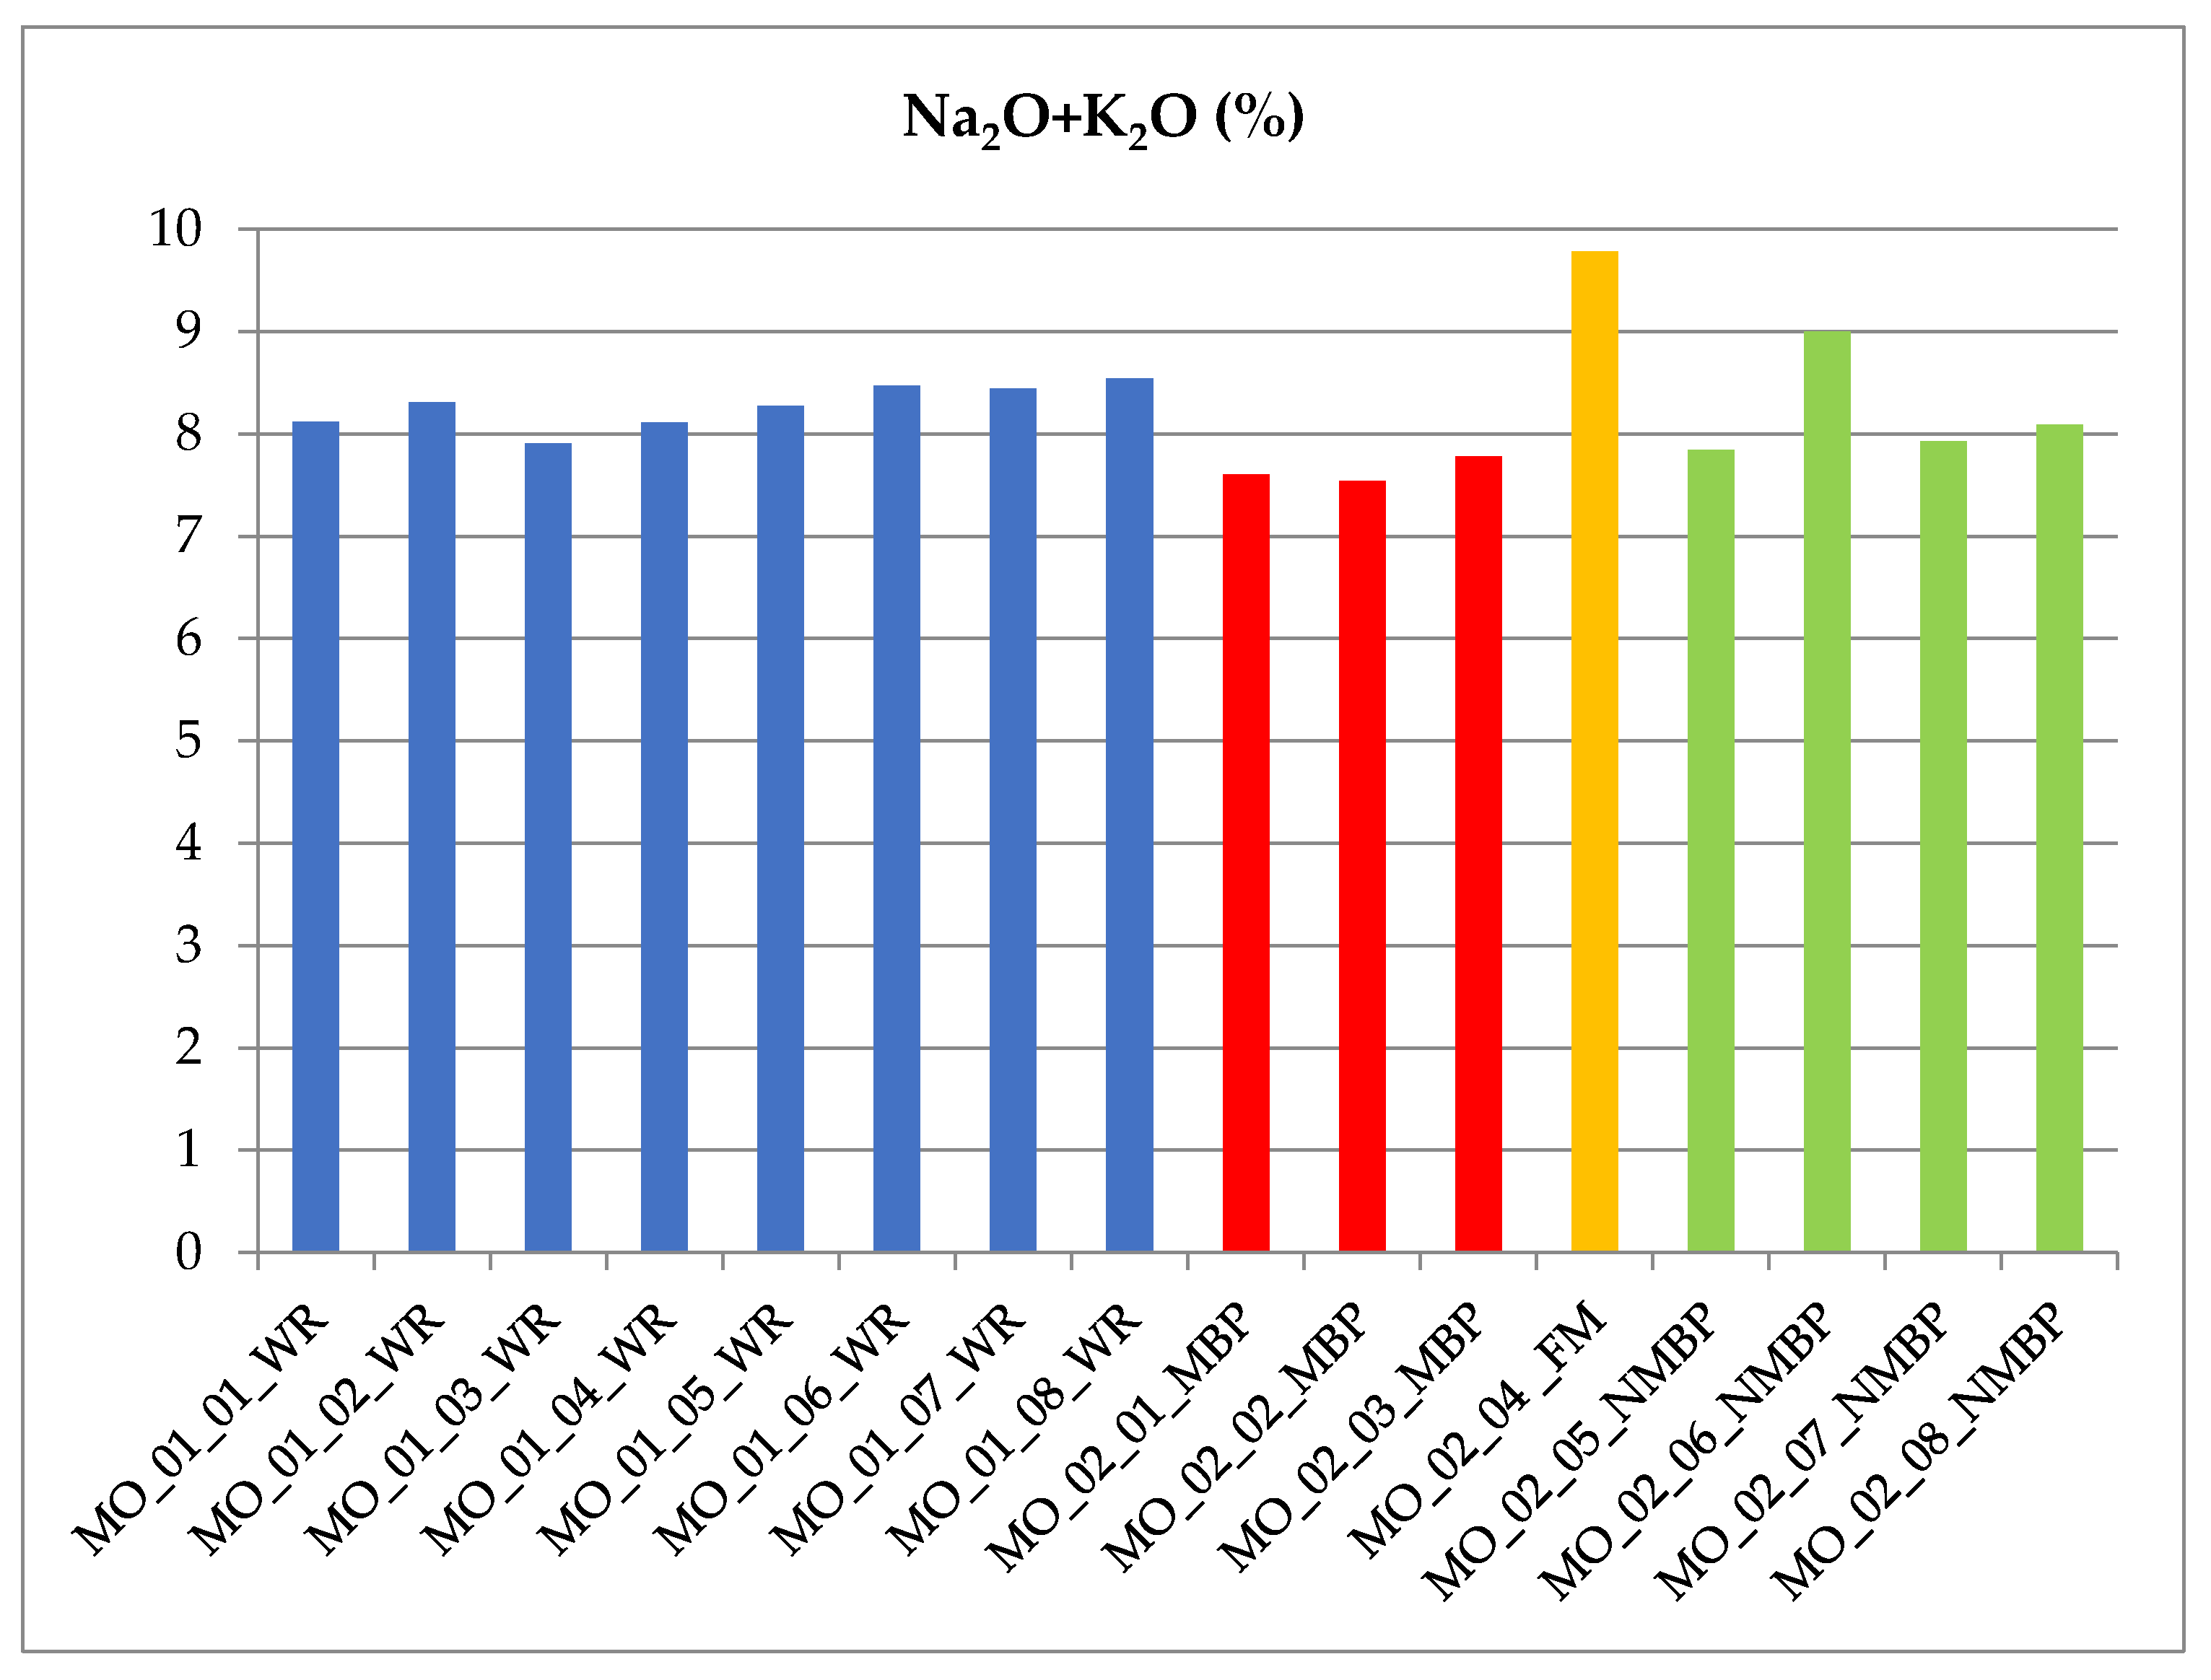
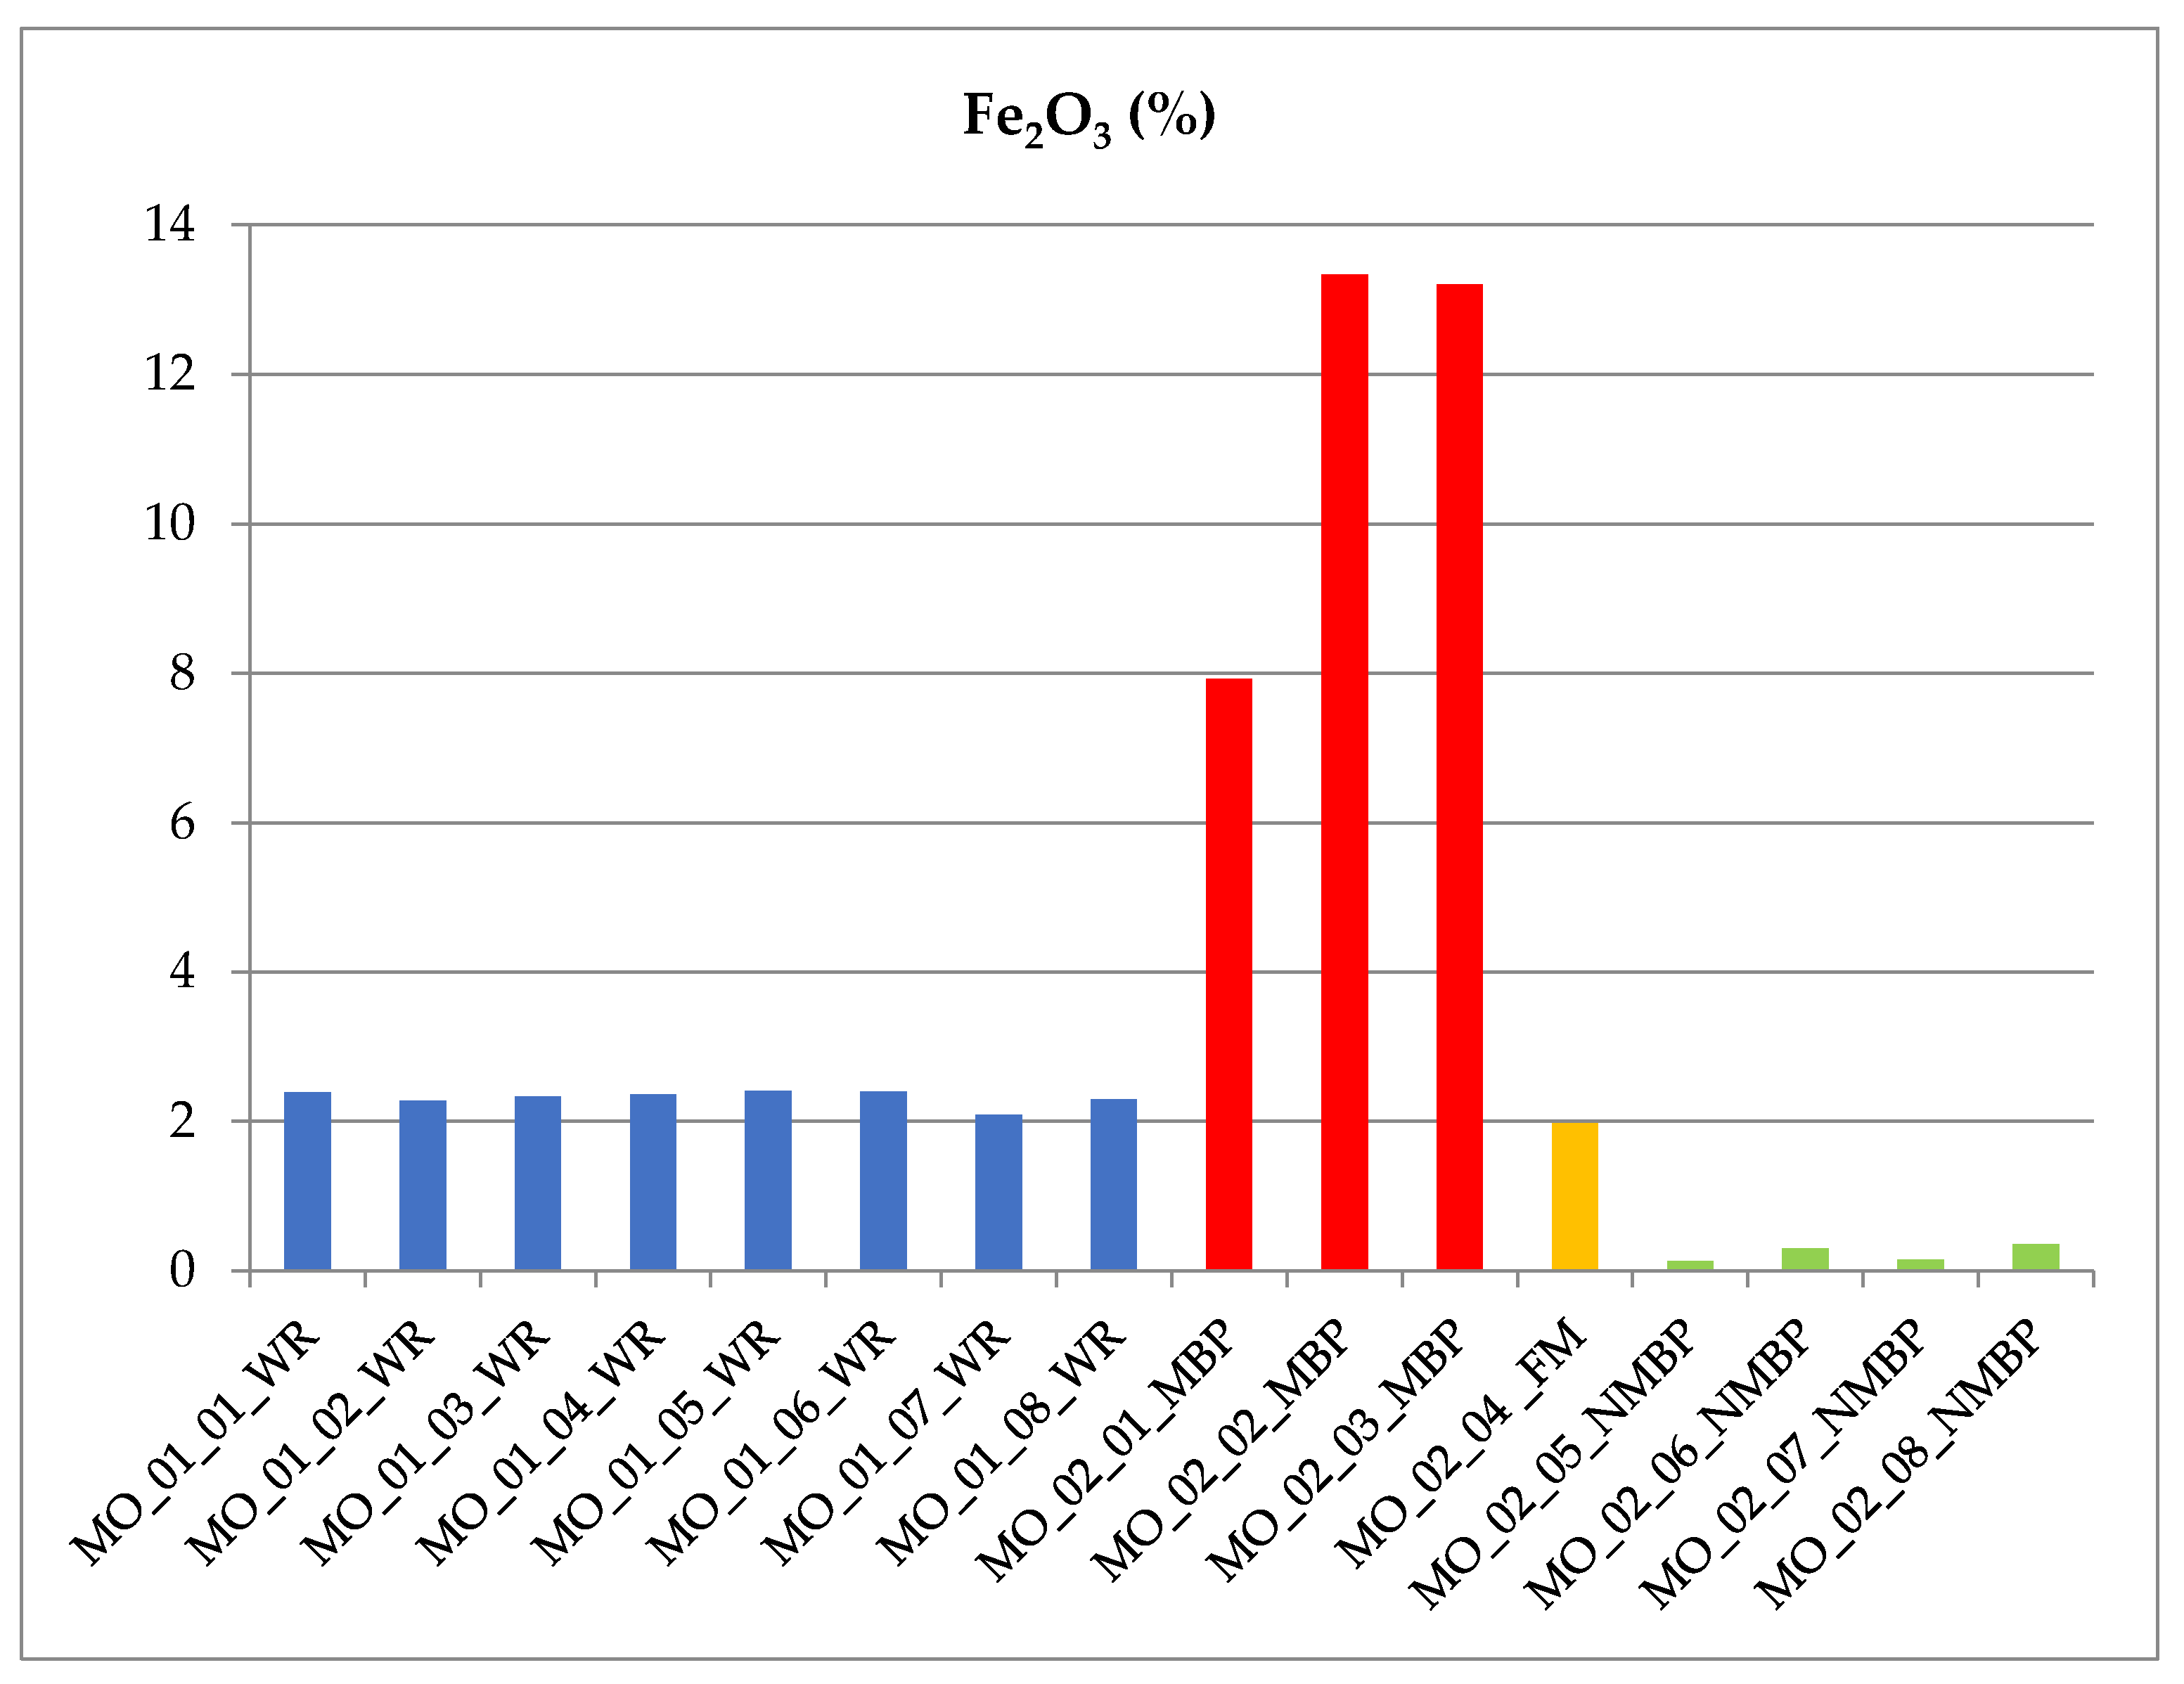
The samples from the three EW facilities, sampled in 2009, show highly homogeneous geochemical features (Table 6 for major elements); alkalis (K2O + Na2O) and Fe2O3tot content are very important for ceramic applications (Figure 7 and Figure 8 respectively). The SM samples show a decrement of Fe2O3 at each treatment step, passing from >1.4% (not good for ceramic industry) to <0.2% (good for ceramic industry). The materials (WR) sampled in 2016 show highly homogeneous geochemical features (Table 7 for major elements). Alkalis (K2O + Na2O) and Fe2O3tot content are reported in Figure 9 and Figure 10, respectively.
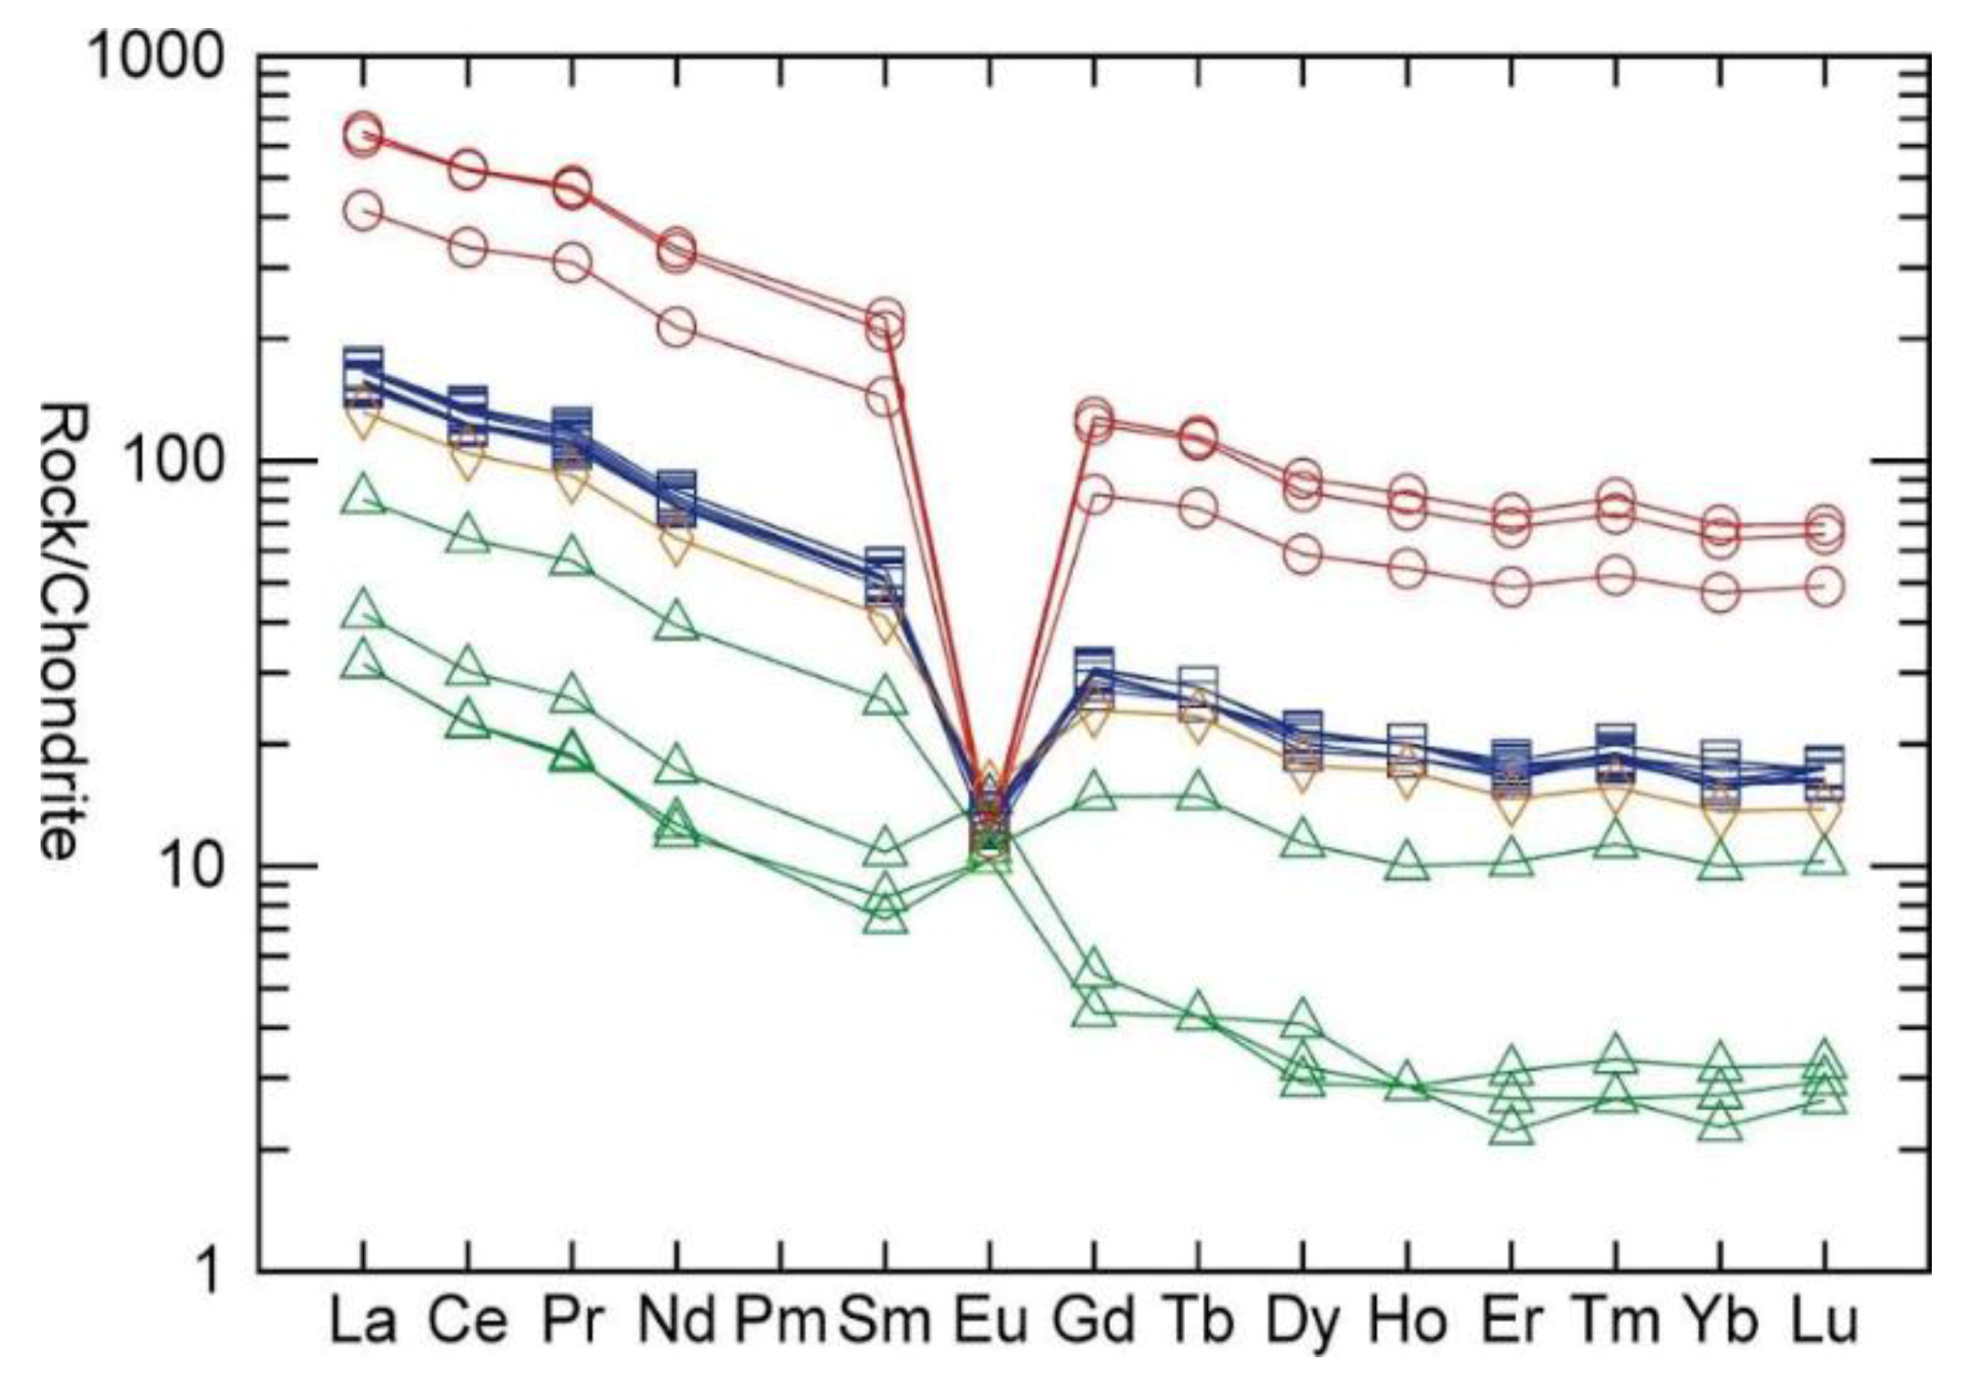
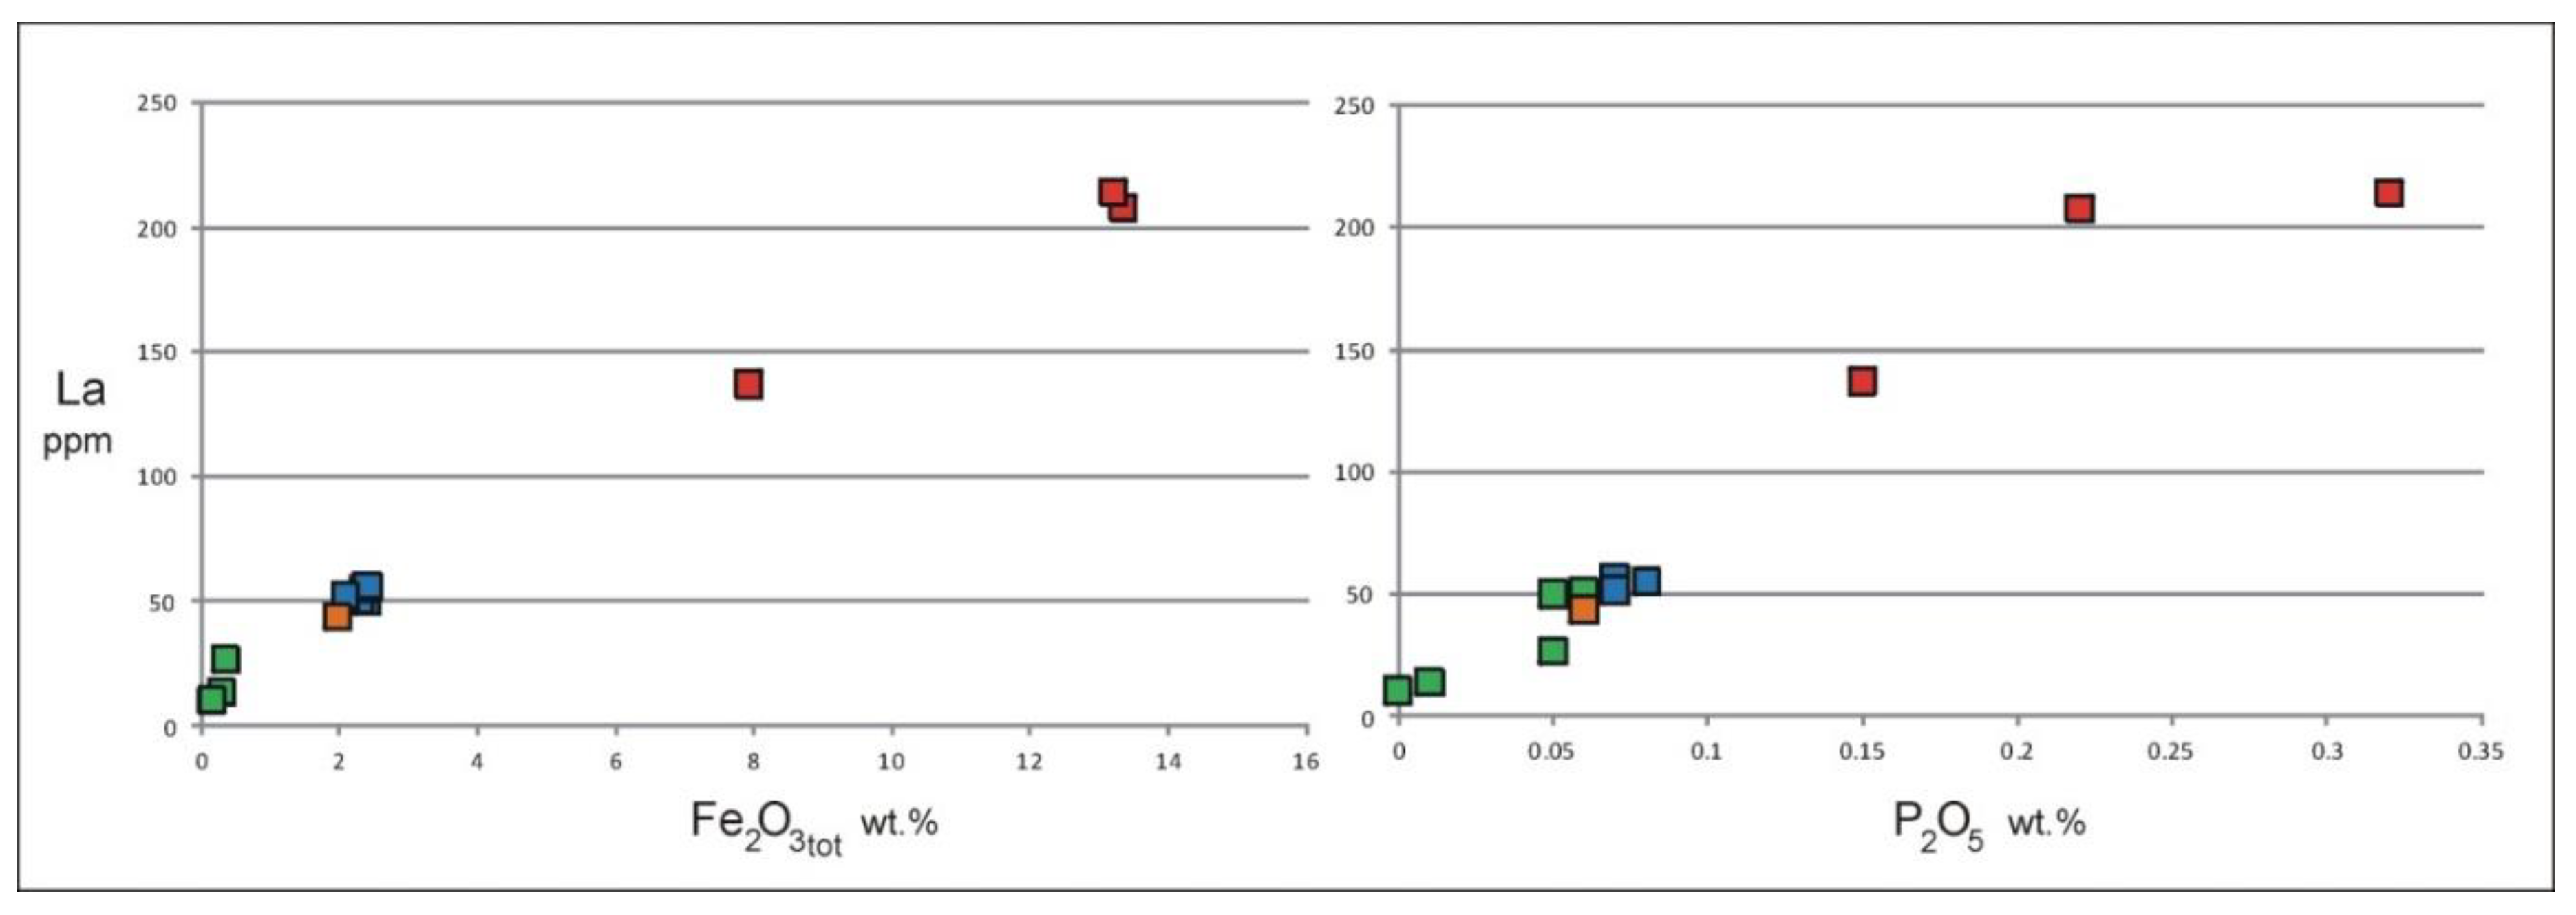
Moreover, an interesting fractionation, in the treatment process, is observed when considering the REE concentration. As shown in Figure 11, the shape of the REE pattern for all samples is broadly the same. There are, however, strong differences concerning the absolute concentrations: all samples of the magnetic fraction are much more concentrated than in the feeding material and can be up to one order of magnitude more concentrated than in the upgraded nonmagnetic portion (Figure 11). Considering La + Ce, the average concentration ranges from 164 ppm (WR) to 585 ppm (magnetic fraction), down to 45 ppm (nonmagnetic fraction; 63 ppm also considering the strongly anomalous MO_02_04 sample). Y and Sc are also enriched in the magnetic fraction. The average total REE (+ Y and Sc) content in magnetic fraction exceeds 1000 ppm (1135 ppm), being up to one order of magnitude more concentrated than in the upgraded nonmagnetic portion. The distribution of the REE between the rock minerals is not obvious. The good correlation which is observed between La (or Ce) and P2O5 (Figure 12) strongly suggest that REE may be concentrated in monazite [(Ce, La, Pr, Nd, Th, Y) PO4], which has been reported from these granitic rocks [40] and is a typical LREE ore mineral worldwide. The monazite is easily recoverable, however, these data must be taken with caution, as additional data on REE distribution among the mineral phases are required.

3.1.2. Volume and Potential Value of the Raw Materials (at the Site)

On the basis of the geophysical survey and field surveys conducted in 2009, the tomographic profiles of the three studied dumps were defined (Figure 13a–c). The configuration and the border between the waste deposit and the substratum of rock are clearly visible. The deepness of the granitic bedrock in the cross section was estimated thanks to the use of different colors, which correspond to different resistivity values (see legend Figure 13d). The resistivity difference can be related to the unconformity of the granitic waste and bedrock. From the parameter reported in Table 8, it was possible to estimate a total volume of the dumps as about 2 Mm3 (about 3.6 Mt). About 20% had to be subtracted from this volume as it was selected in the treatment plant as not being directly utilizable as secondary raw material (SRM) for ceramic. Indeed, this material needs to be treated in another plant (as by-product). Therefore, the resource directly treatable in the treatment plant was estimated to be about 2.9 Mt. Considering a feeding to the plant of nearly 200 t/year, it was then possible to estimate at least 15 years for the production lifetime (from 2009). It is important to underline that the waste amount in the old EW facilities are periodically refilled by the flowing waste.
From the topographic and morphologic 3D characterization conducted in 2016, it was also possible to visualize the area. Figure 14 shows 3D site topography and sampling points for Montorfano EW facilities. The total volume of the investigated area in the Montorfano field survey, was estimated at about 560,000 m3 (about 1.008 Mt). Assuming that about 20% must be subtracted from this volume to be treated in another treatment plant (as happened in the other 3 EW facilities), it was estimated that the resources directly treatable in the main treatment plant in Verbania was about 0.8 Mt. Considering a feeding amount to the plant of nearly 176 t/year, the production lifetime was estimated to be at least about 4.5 years.
The results of the 2016 investigation are in line with the ones concerning the 2009 investigation; thus, if time or financial resources are not sufficient for deeper investigation phases (including magnetic separation during the geochemical characterization and geophysical tests for volume investigation), a faster approach (as the one used in the 2016 investigation activity) can be applied.

3.2. Environmental Impact Assessment

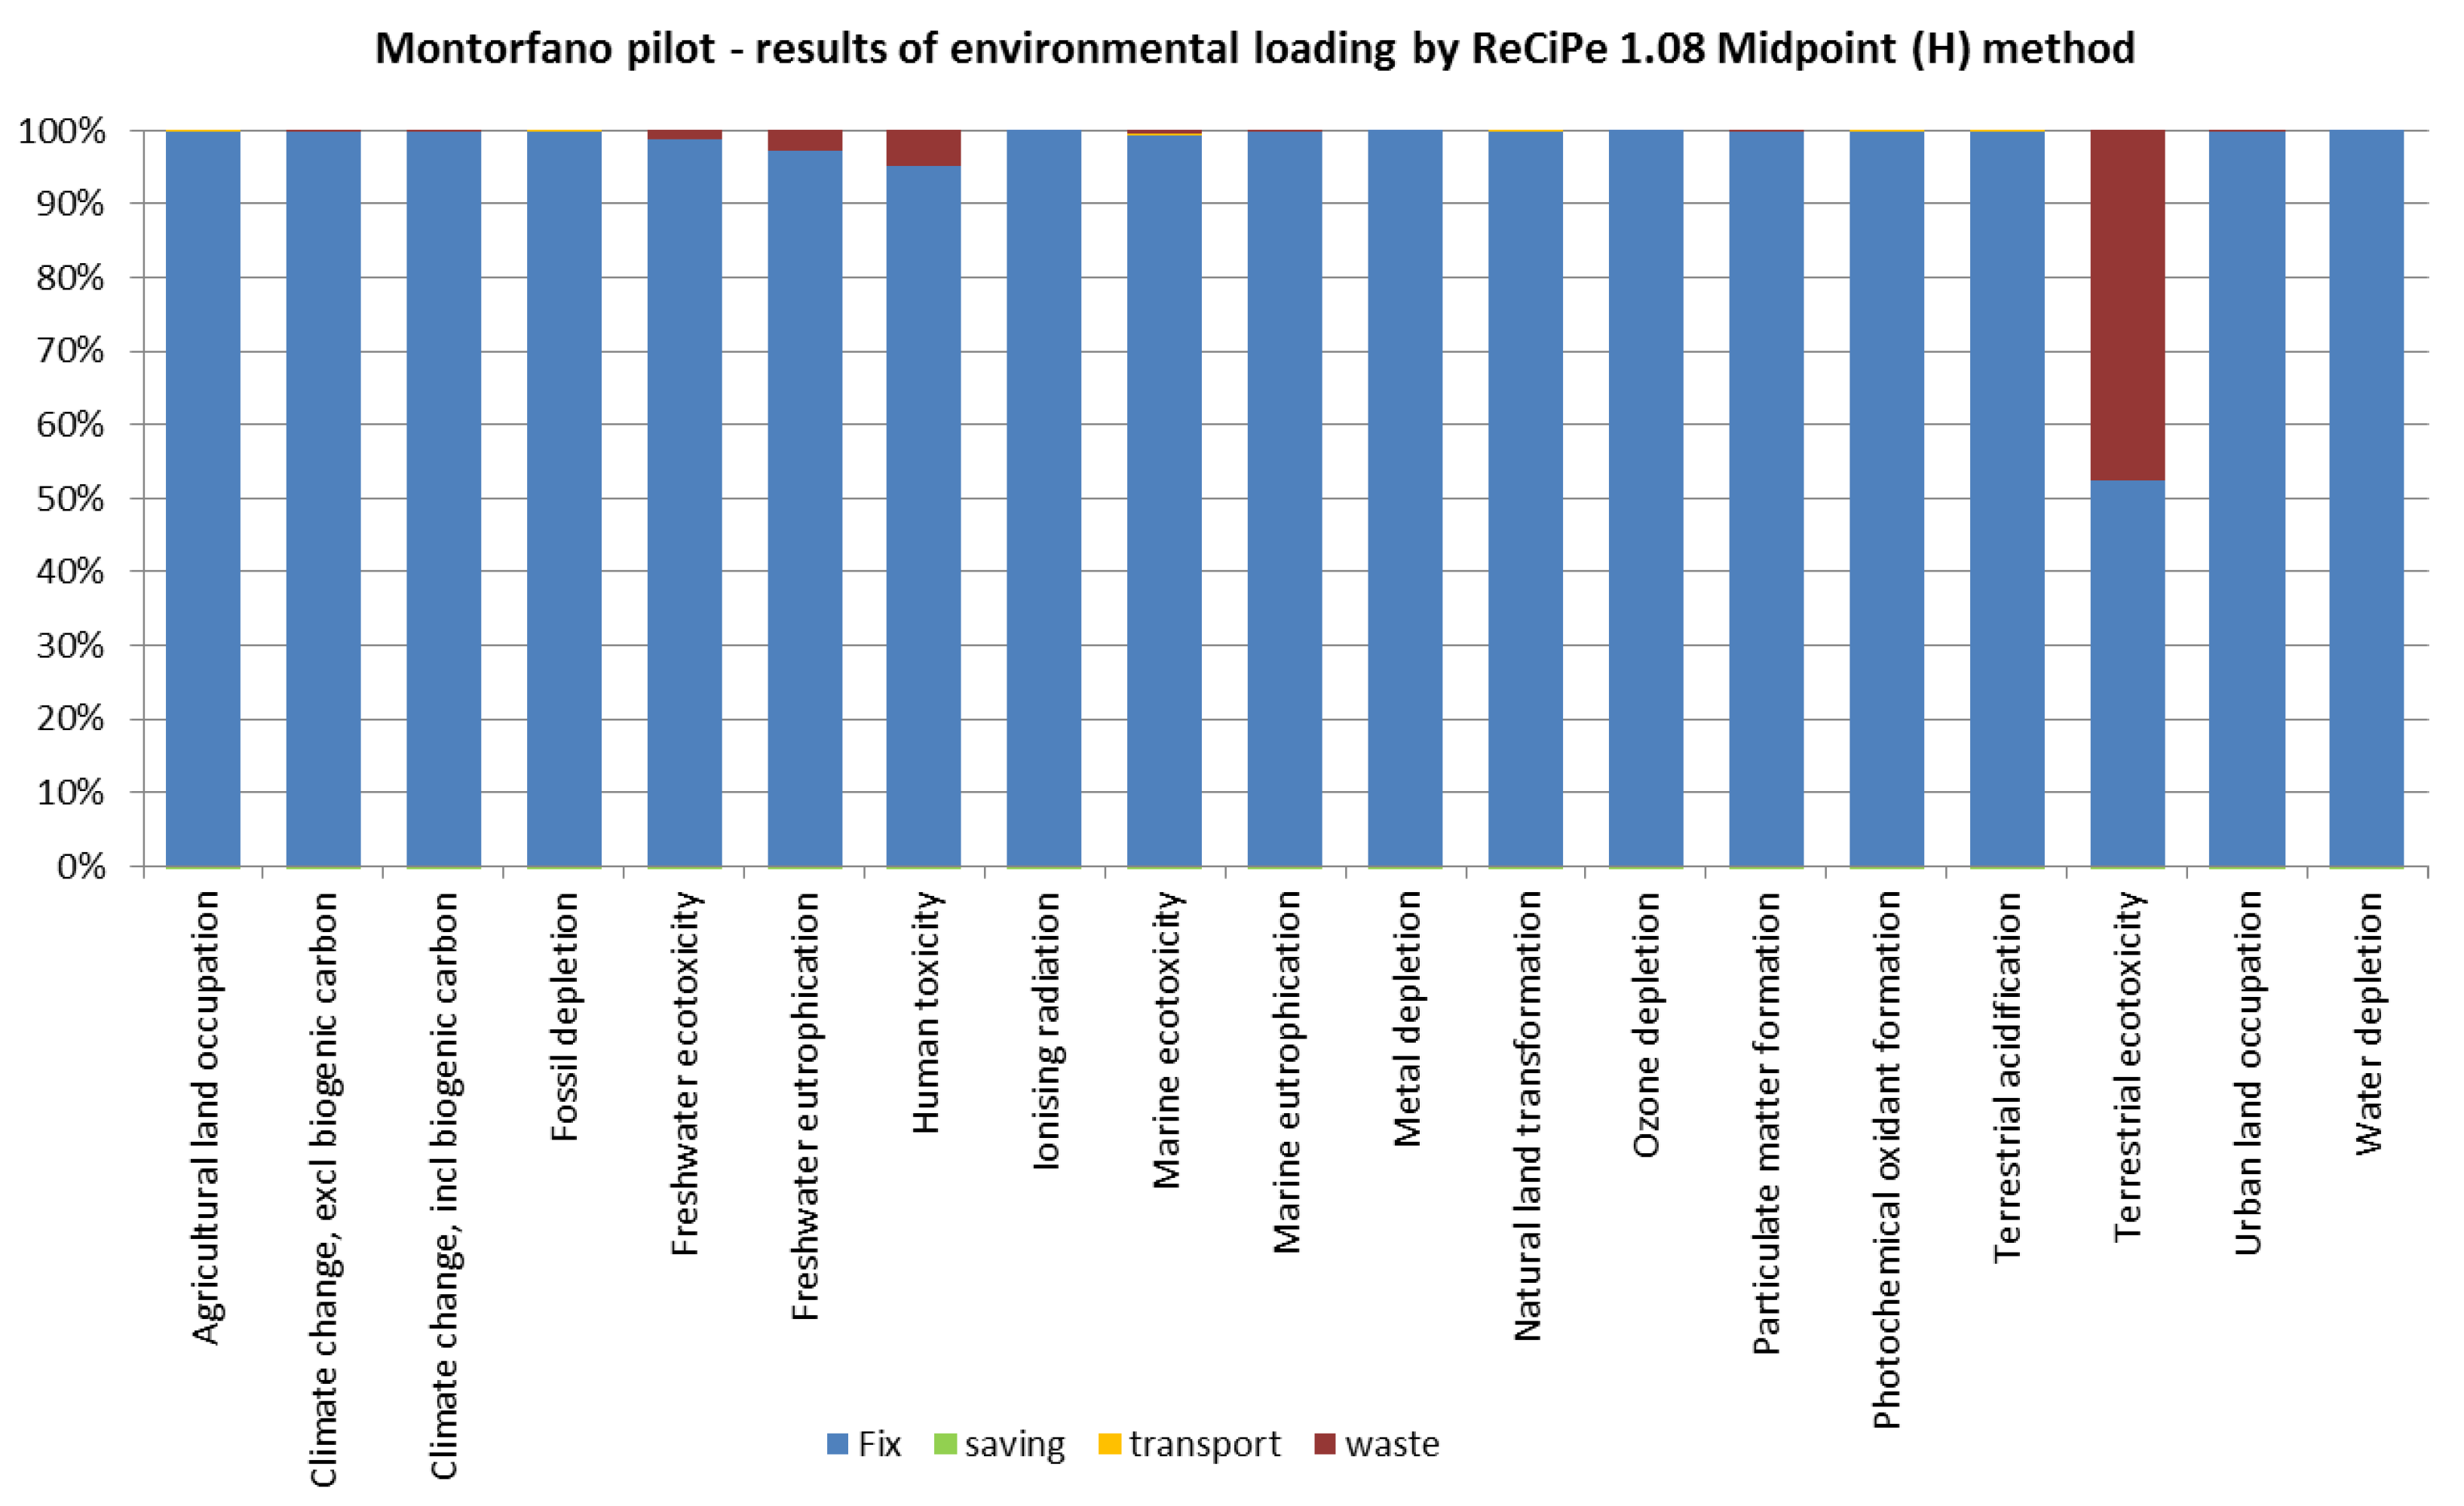
Overall the environmental impacts assessment is summarized in Figure 15 for all indicators. According to the results, the main environmental loads were due to the dressing plant including climate change and freshwater eutrophication ones. Despite landfilling having a minor impact in most of the indicators, it has a significant impact on terrestrial eco-toxicity.
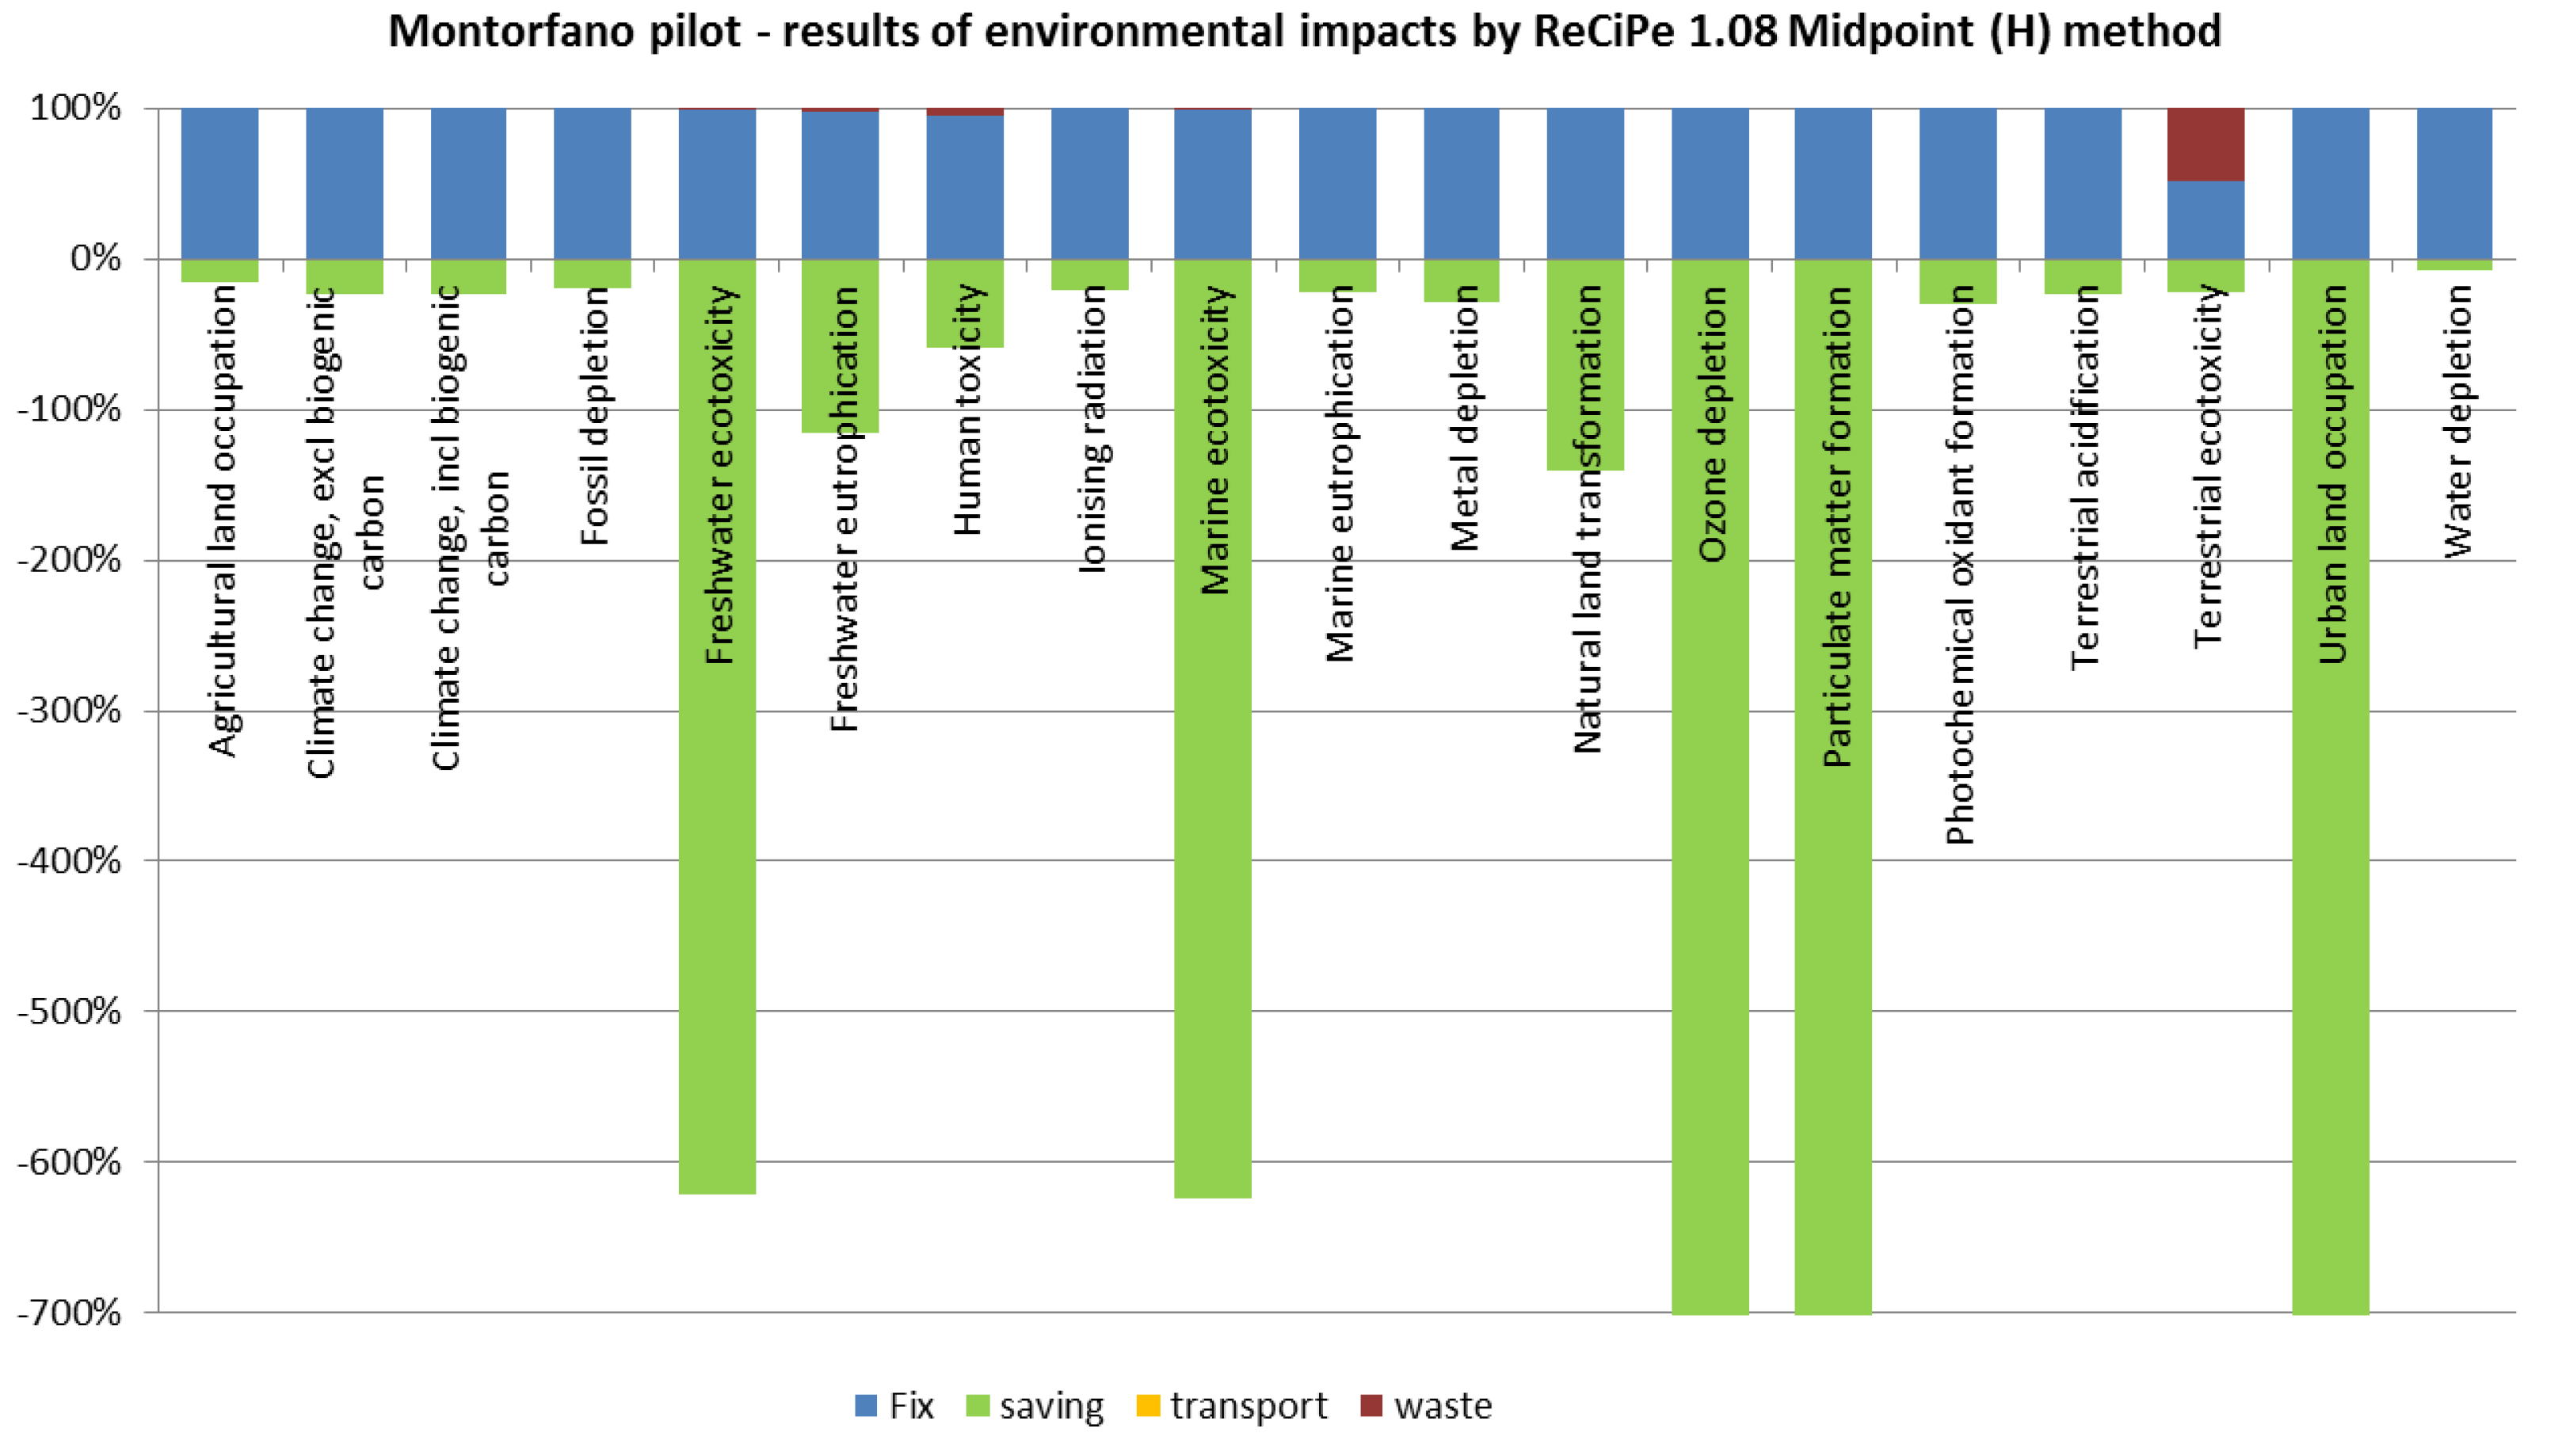
Environmental savings from using SRMs as substitute materials outdo the loads of the corresponding activities in a few impact indicators as indicated in comparing savings and loads (Figure 16).
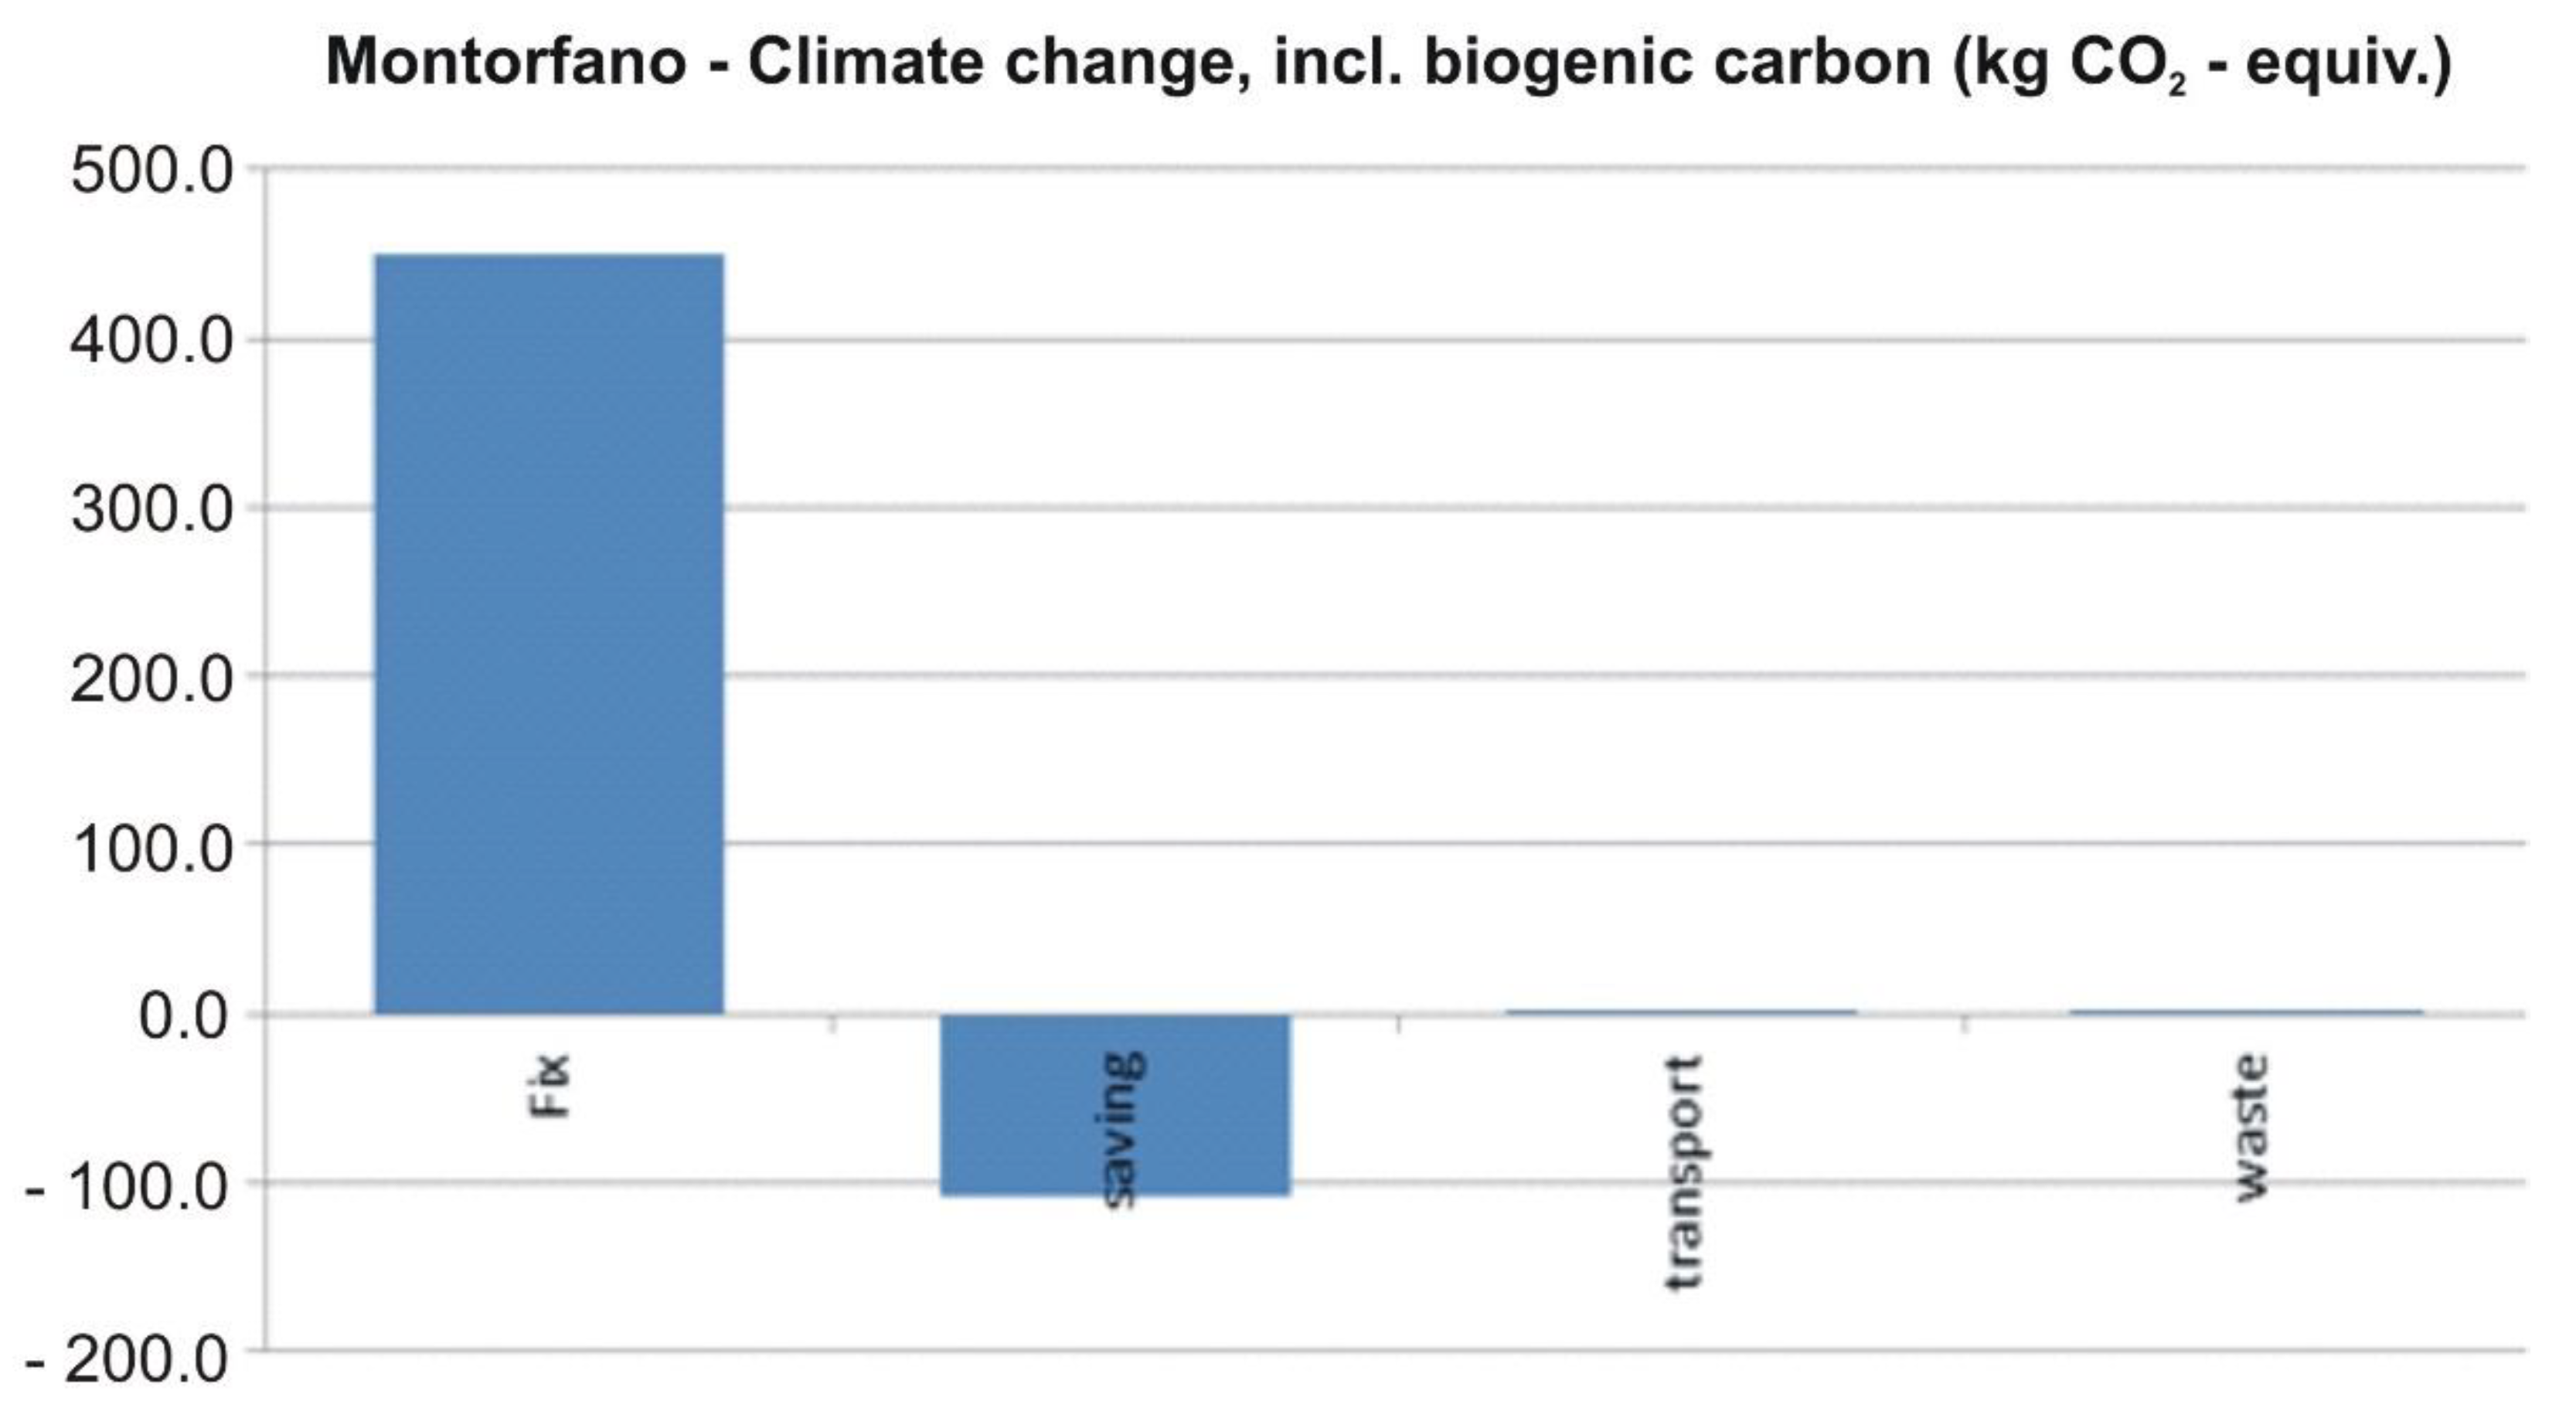
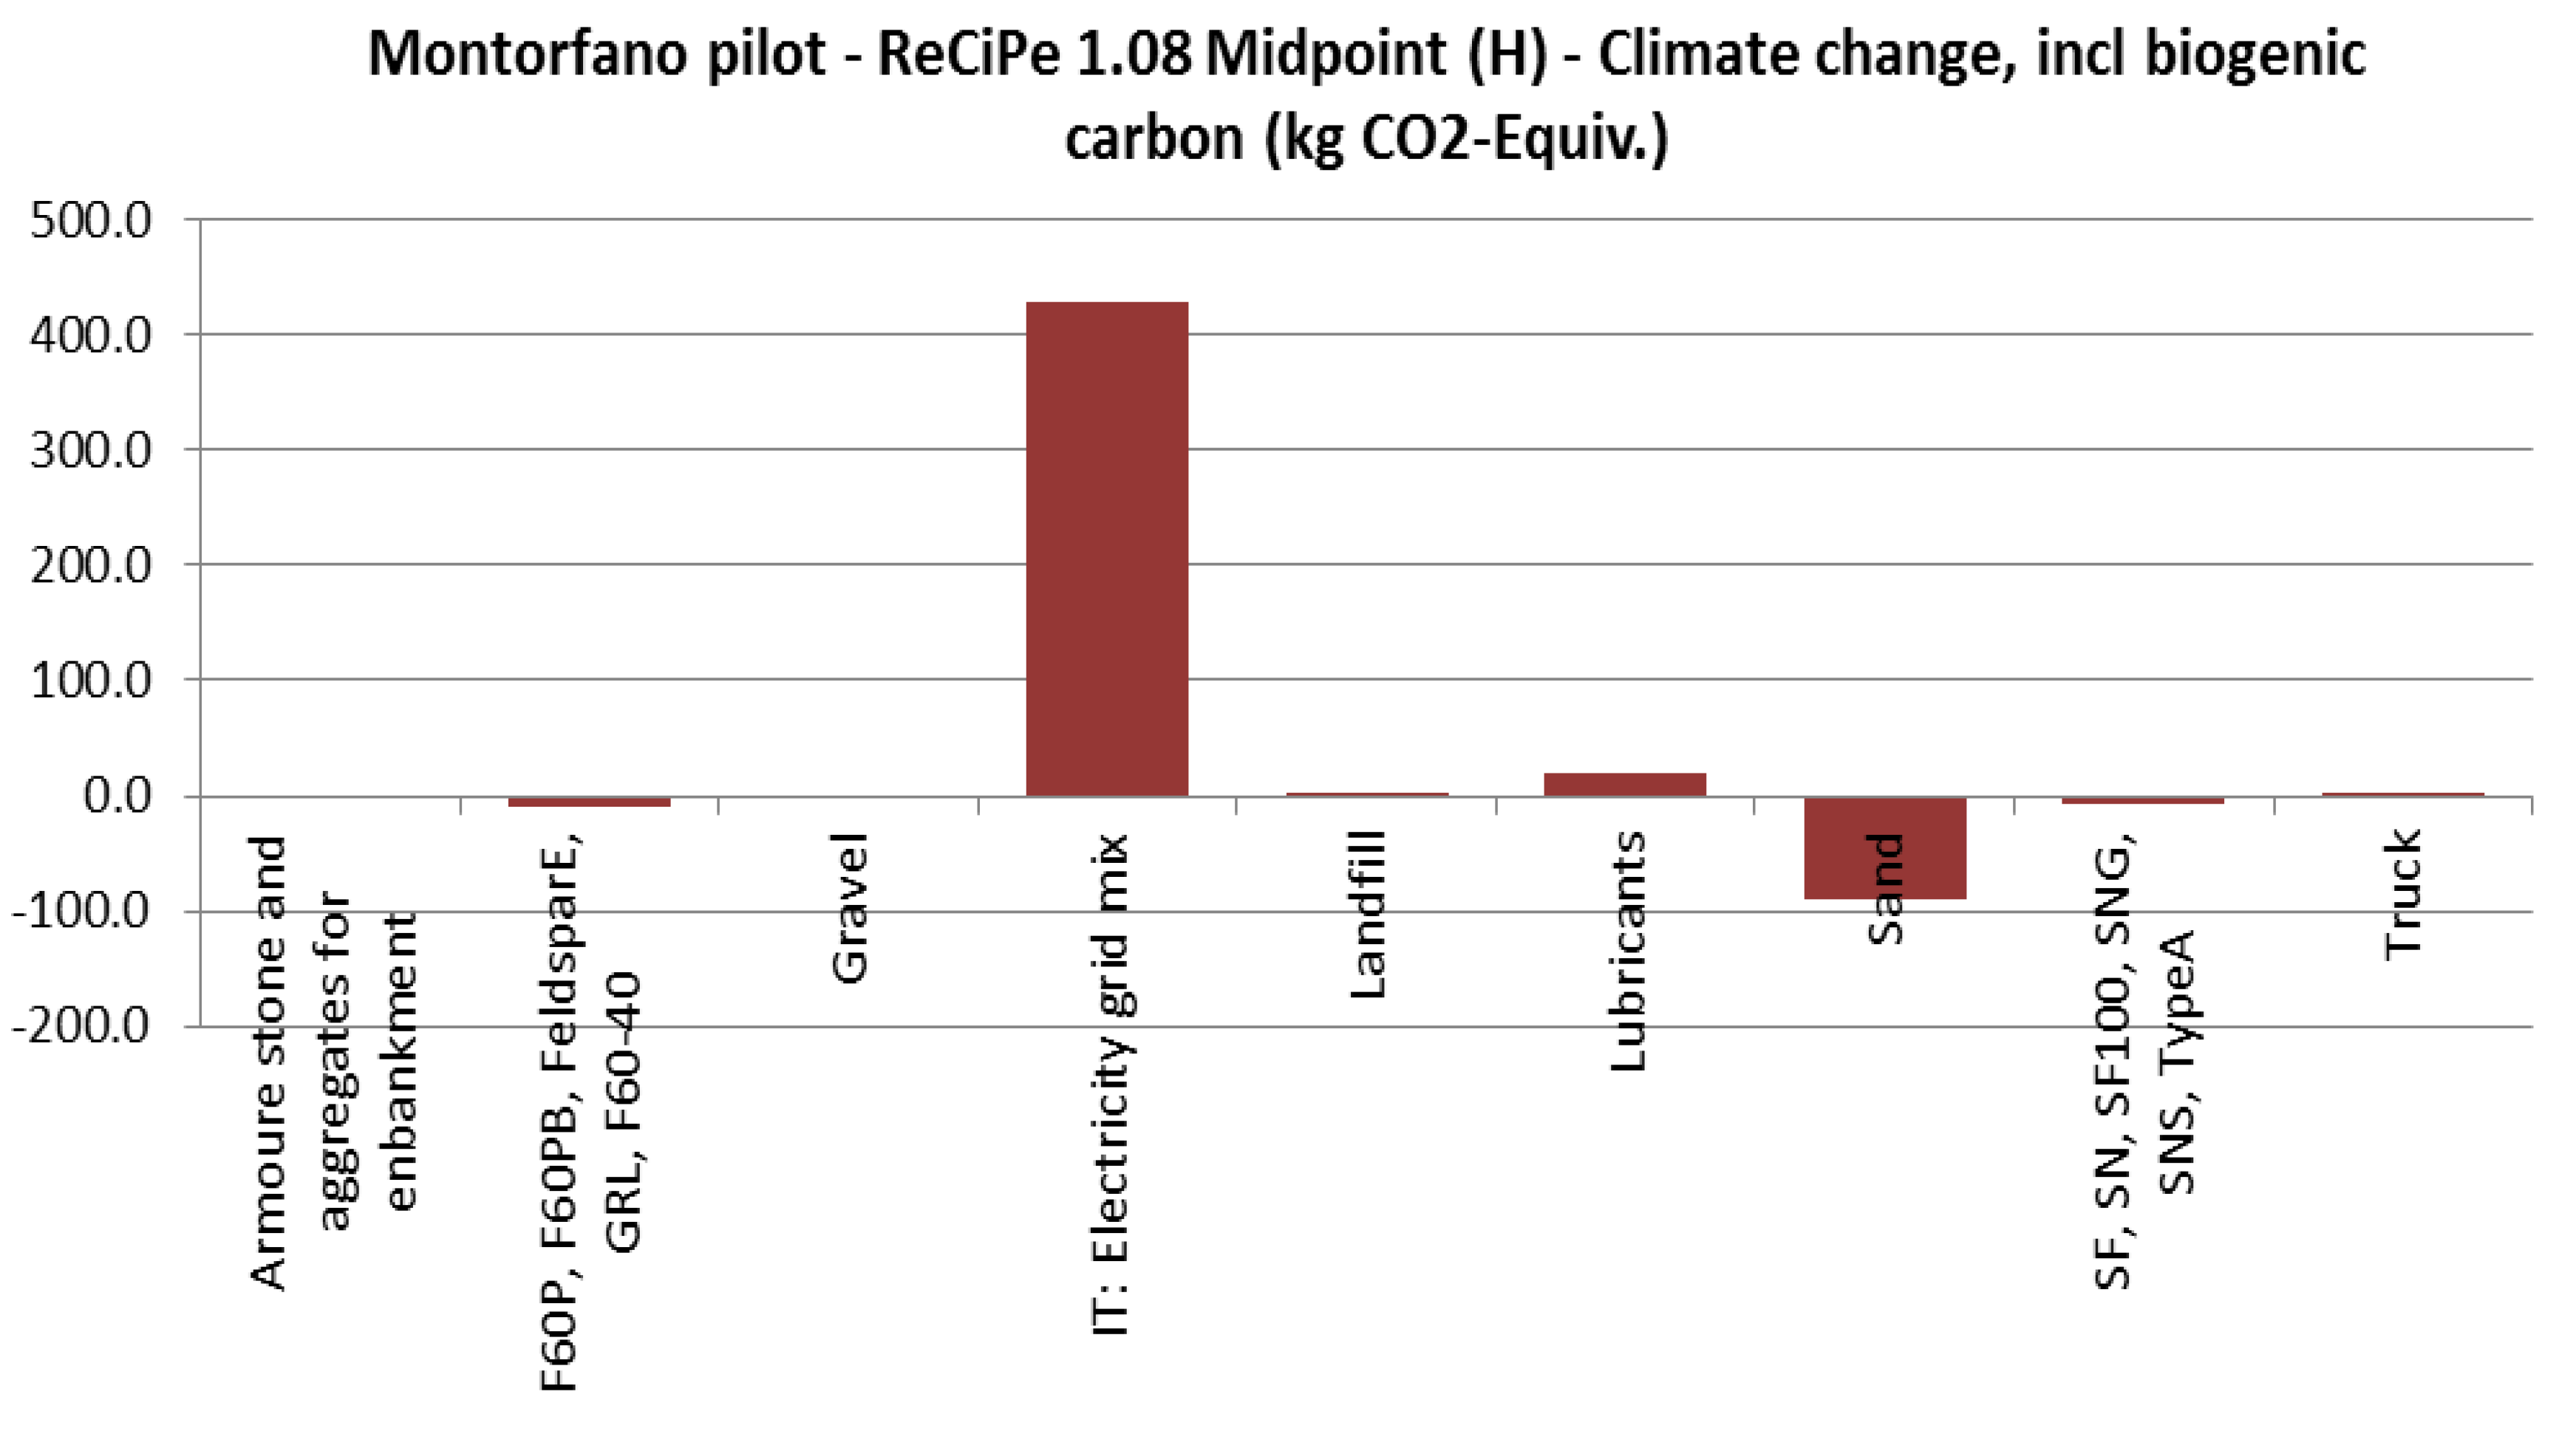
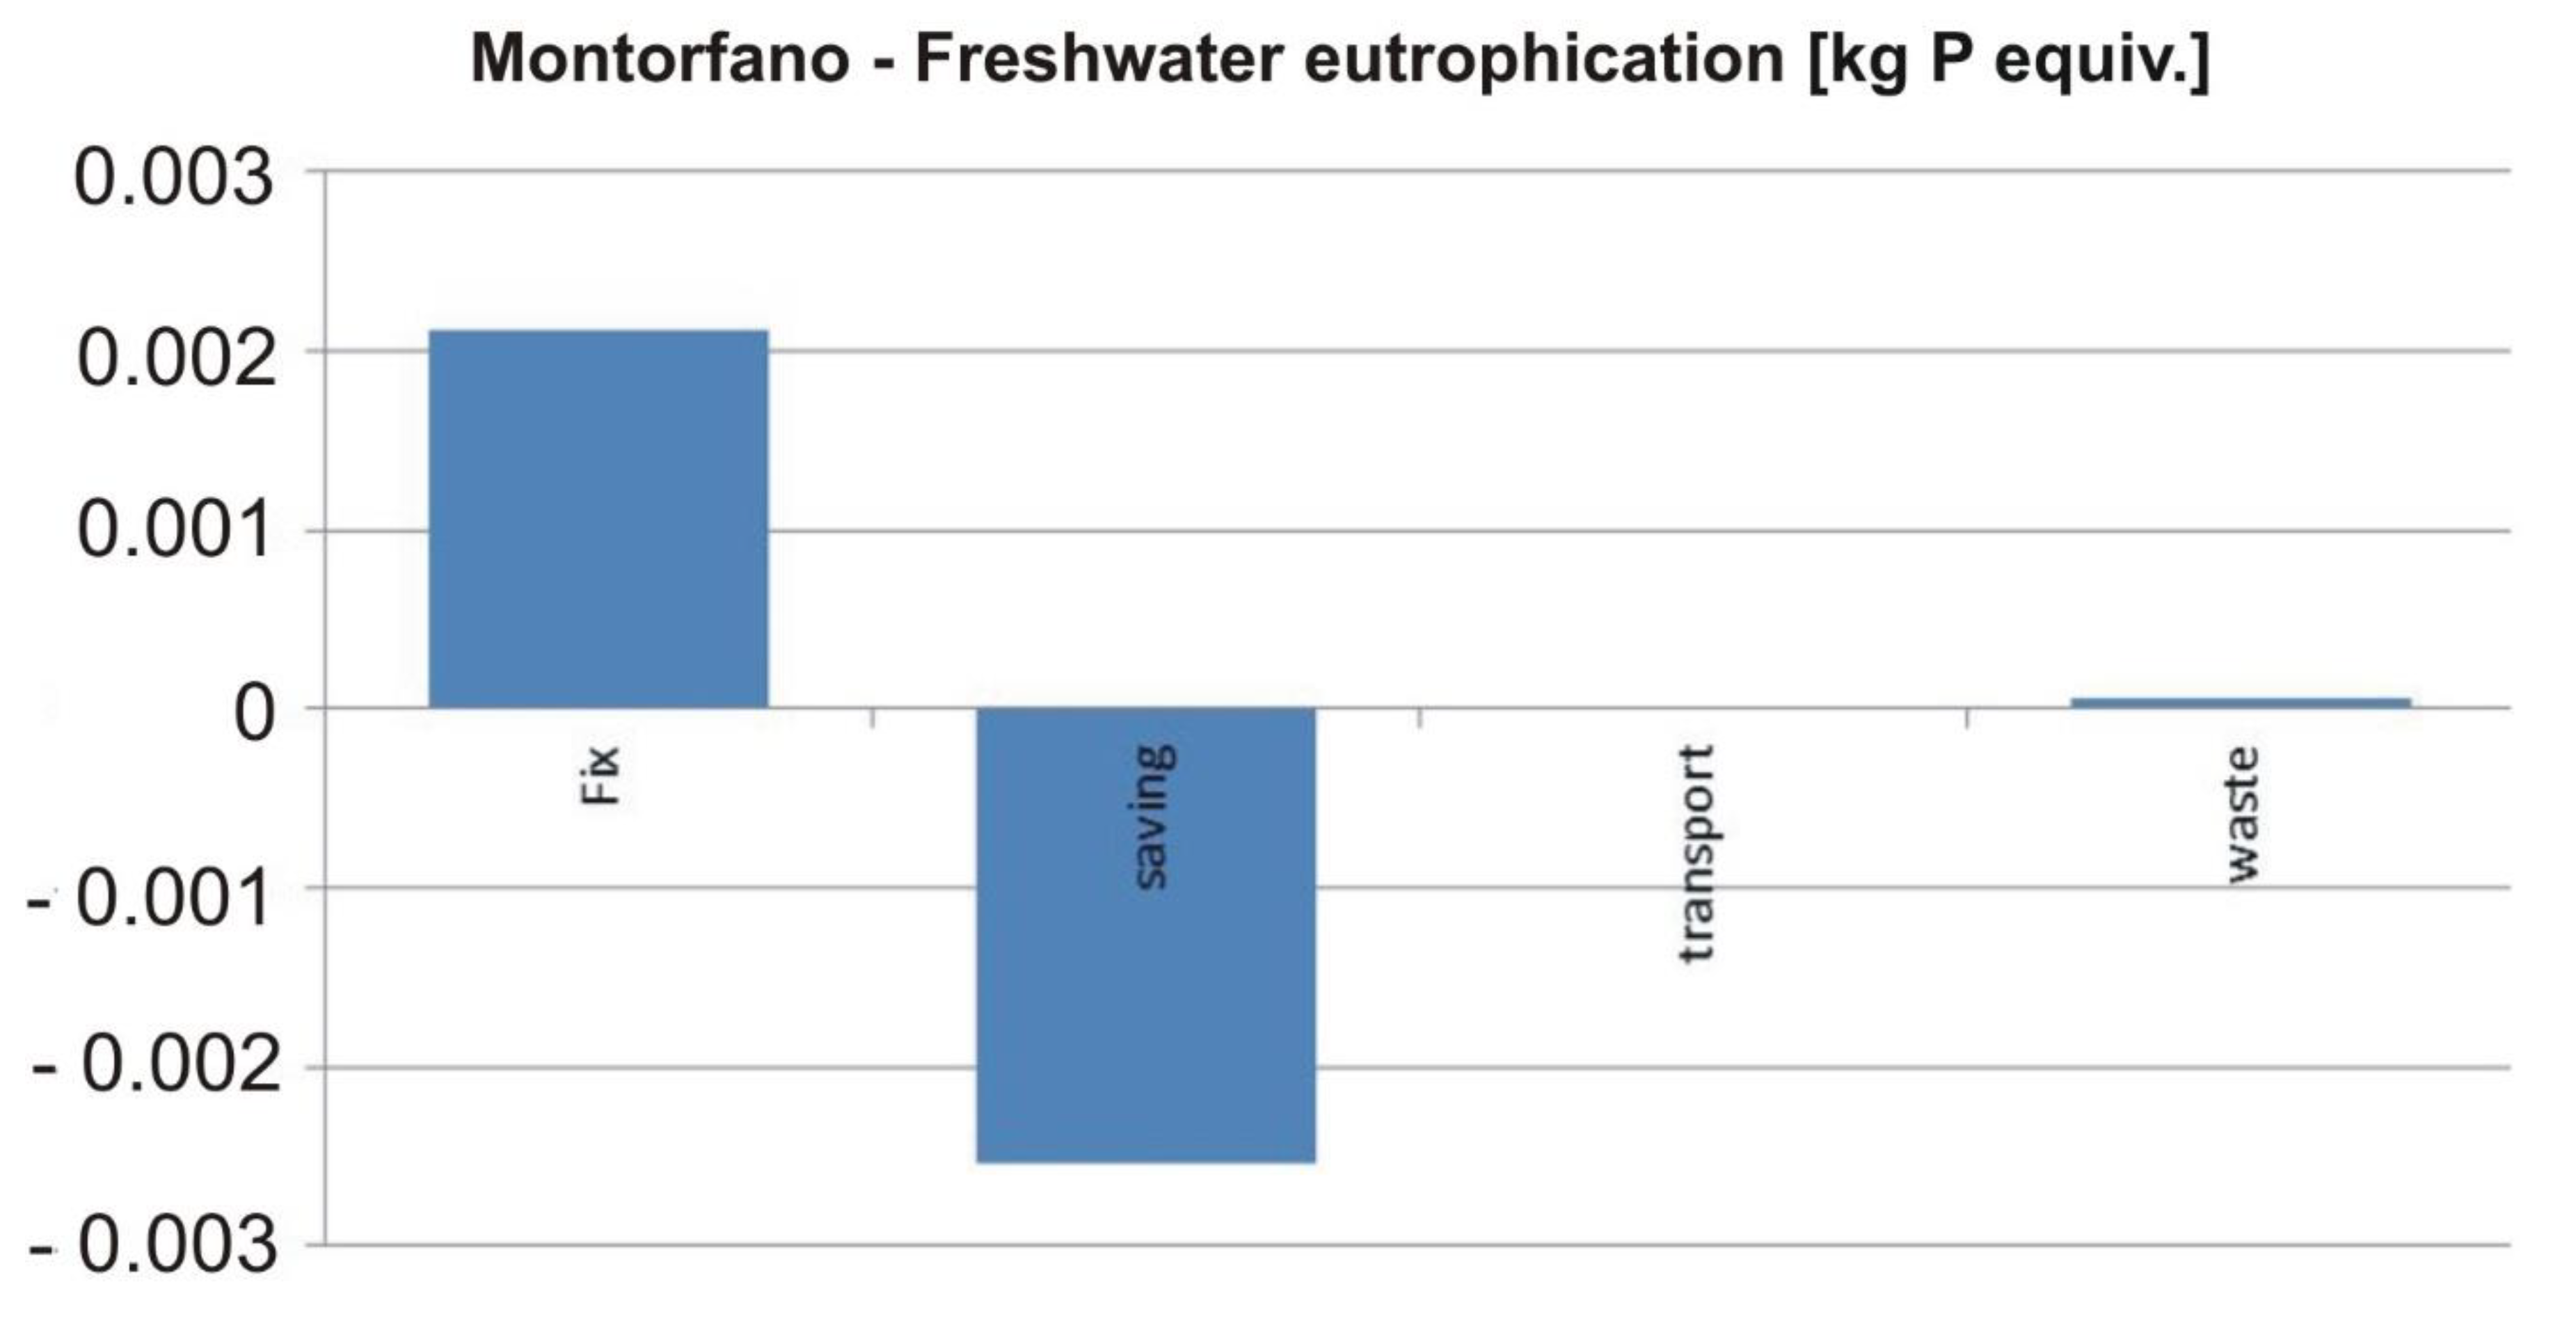
Climate change indicators show significantly higher loads than savings. The energy used for the treatment causes the high load, due to the Italian energy mix, which contains 60% fossil sources. Despite the fact that the recovery of sand generates significant savings in climate change, these savings cannot counterbalance the loads from the treatment process (Figure 17 and Figure 18). As for freshwater eutrophication, phosphate and phosphorous releases to water are avoided due to the process. These result in high savings in freshwater eutrophication. Consequently, the savings are higher than the loads in this impact indicator (Figure 19).
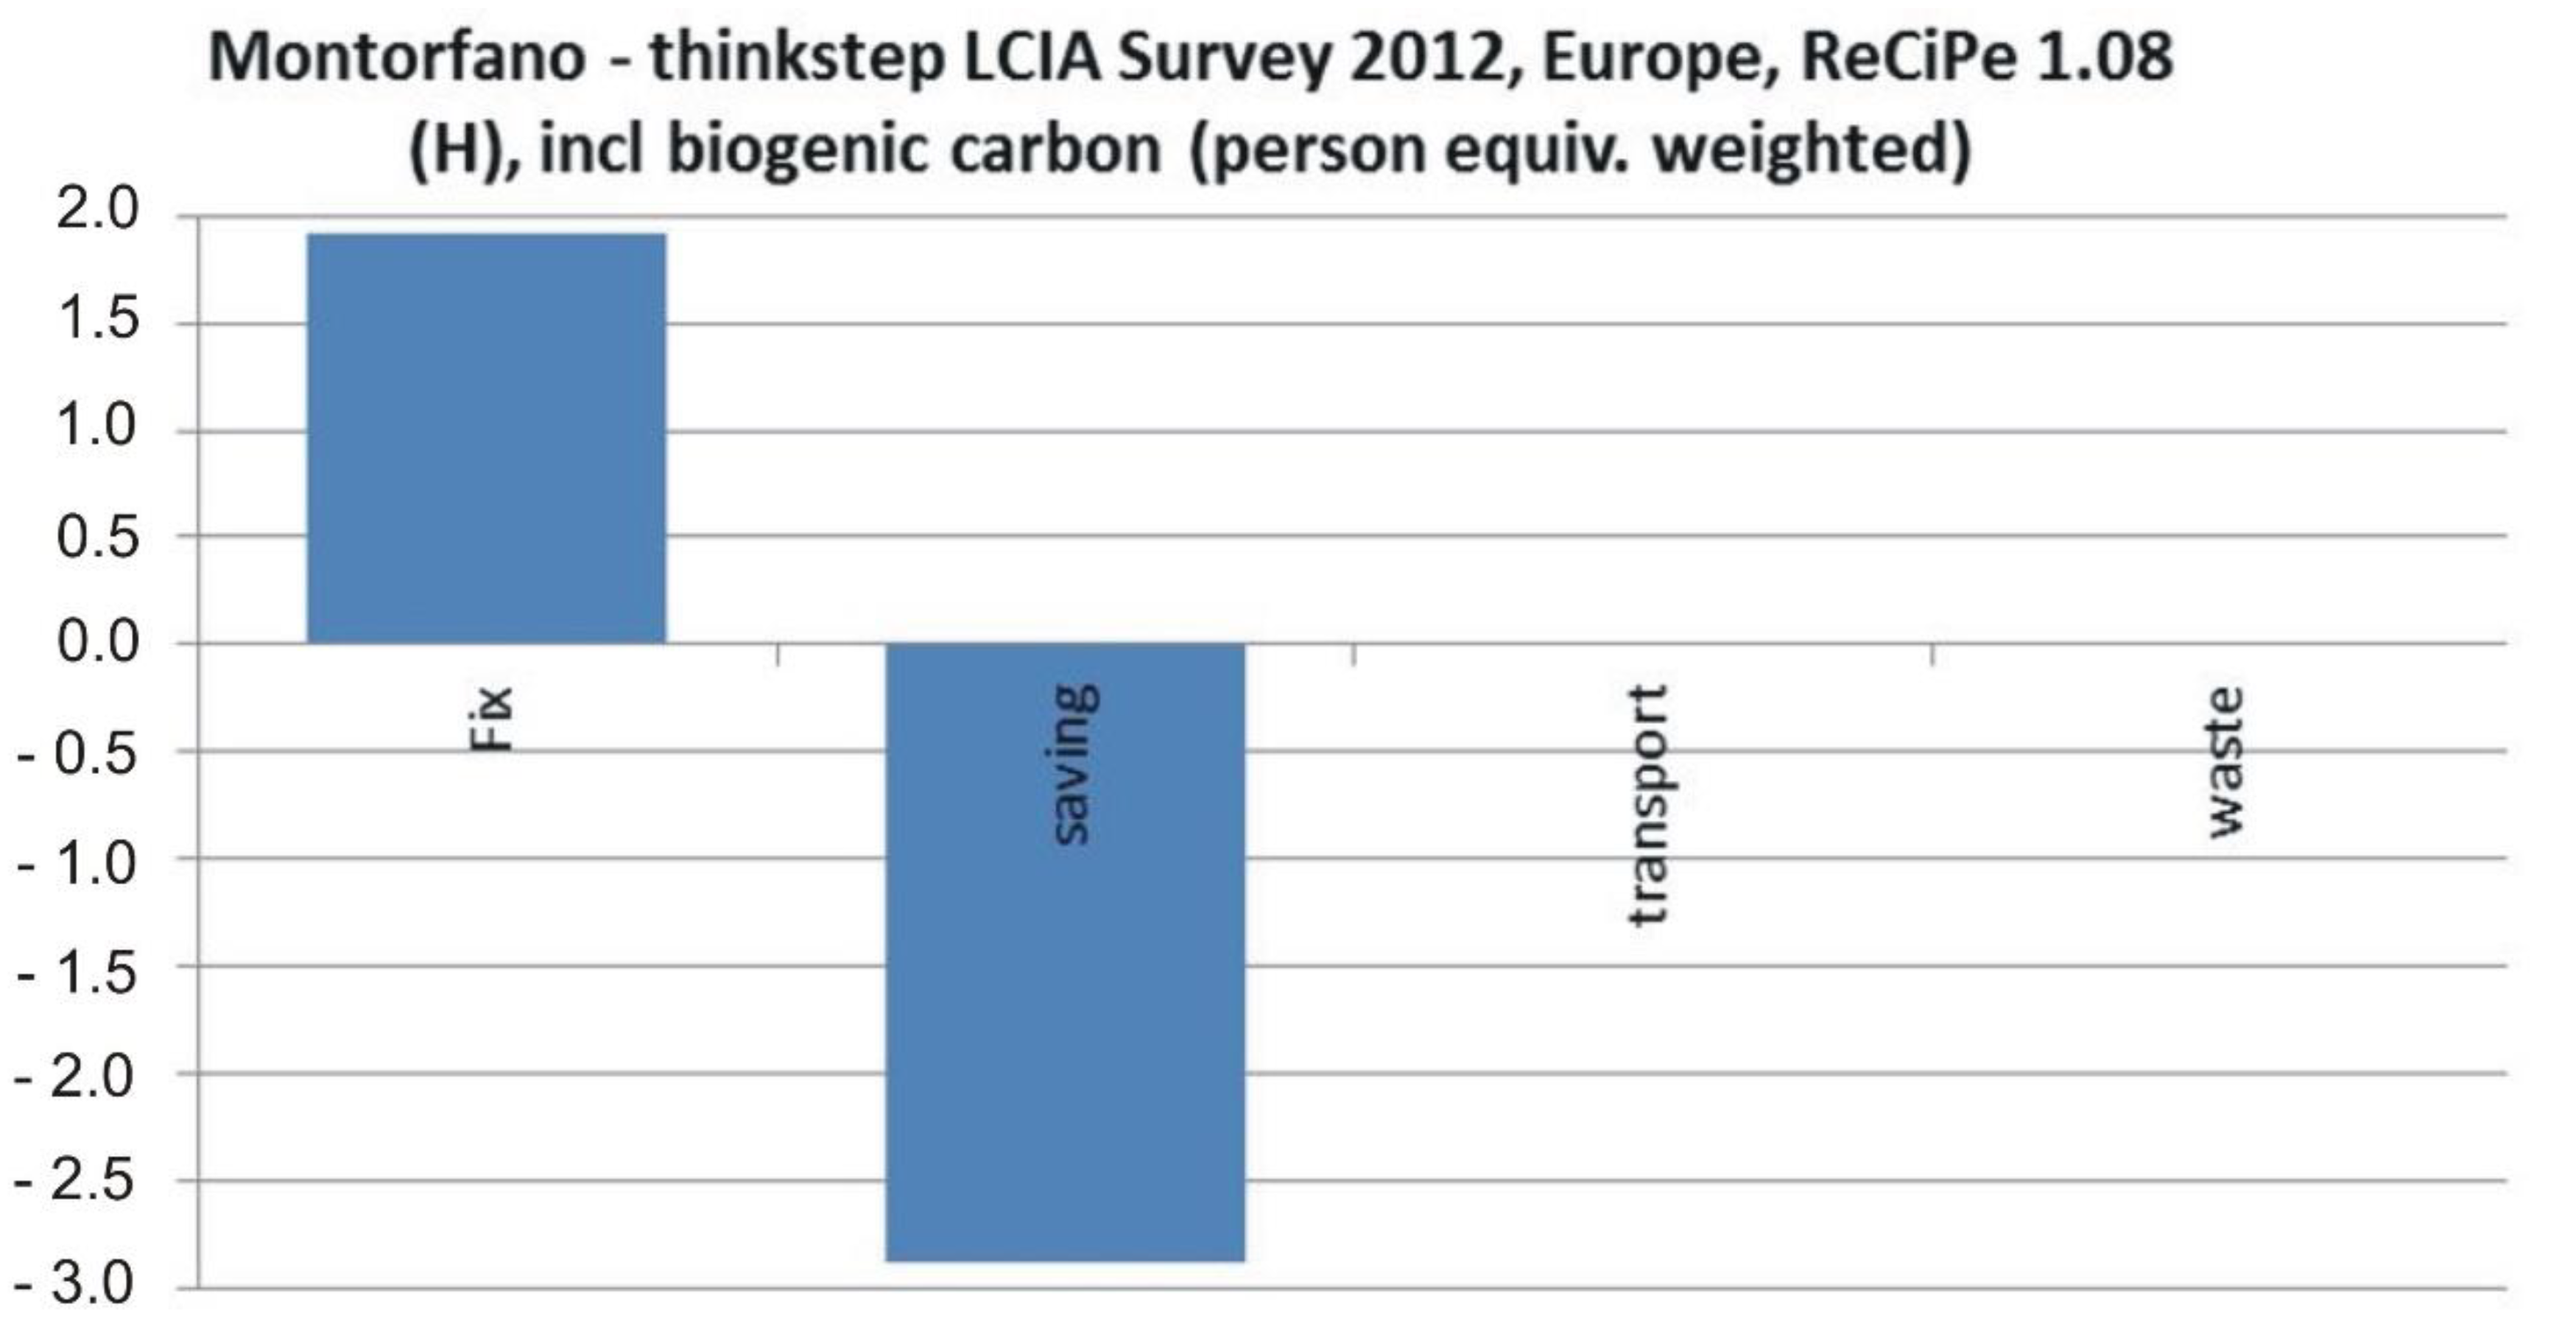
Energy used for treatment causes the main load for climate change. This is due to the Italian energy mix, which contains 60% fossil sources. Despite recovery of sand generating significant savings, the savings cannot counterbalance the loads from the treatment process (Figure 17 and Figure 18). The avoided phosphate and phosphorous release to water results in a high ratio of savings in freshwater eutrophication (Figure 19). Consequently, savings are higher than loads in this impact indicator. Finally, weighted impacts visualize overall outcomes for all extraction and recovery, transport and waste handling processes (Figure 20). As for environmental impacts, these SRM recovery activities are favorable for the environment compared to the use of primary sources: weighted savings are higher than weighted loads as indicated.

4. Conclusions

The present research emphasizes how the systematic recovery of EW should significantly contribute, on the one side, to the environmental and land protection and, on the other, to the safety of the quarries and the supply of RM/CRM/SRM.
The sampled materials from the EW facilities, sampled in 2009 and 2016, show highly homogeneous geochemical features (Al2O3: 13.02–14.65; Fe2O3: 1.40–2.41, TiO2: 0.10–0.26, CaO: 0.54–2.01, MgO: 0.14–0.45, K2O: 4.49–5.18, Na2O: 3.08–3.64. on average from Table 6 and Table 7) for major elements. The alkalis (K2O + Na2O) and Fe2O3tot content of all samples are extremely important for the feldspar industry (l.s.), and the samples obtained after magnetic separation show a decrement of Fe2O3 passing from >1.4% (not good for ceramic industry) to <0.2% (good for ceramic industry). Furthermore, a wider range of geochemical analysis was carried out in 2016 and an interesting fractionation in the treatment process is observed when considering the REE concentration. All samples connected to the magnetic fraction are much more concentrated in REE than the feeding material, moreover, the REE value can be up to one order of magnitude more concentrated than in the upgraded nonmagnetic portion. The total volume of EW facilities was estimated at about 2.1 Mm3.
On the other side, the LCA reports that the main environmental loads, including climate change and freshwater eutrophication ones, are due to the dressing plant. Landfilling shows significant impact in terrestrial eco-toxicity. While climate change indicators show significantly higher loads than savings, the savings and loads in freshwater eutrophication indicator are balanced. The avoided phosphate and phosphorous release to water results in a high ratio of savings in freshwater eutrophication. As for environmental impacts, the SRM recovery activities are favorable for the environment compared to the use of primary sources.
The study illustrates that it is possible to conduct sustainable development mining activities, while delivering profit for the companies involved in the exploitation, valorization, and recovery of the EW stored at EW facilities.
The present research further provided a case study that can help guide best practice for granite EW exploitation to produce the main products for the ceramic industry and several by-products for building and civil applications. The mining of EW waste facilities for RM exploitation can be considered as an example of landfill mining. If we consider the recovery of by-products during the dressing phase this approach can be consider as enhanced landfill mining [26]. In general, the systematic recovery of RM from EW (from ongoing quarrying activity) can help create a supply from unexploited ore bodies. This is in line with the Circular Economy approach, which can be summarized as follows: resource and energy savings, waste recycling, decrement of environmental impacts.

Author Contributions

Conceptualization, G.A.D., P.R., E.G., and F.C.; methodology, G.A.D., E.G., R.S., and F.C.; software, A.C., E.G., R.S.; validation, G.A.D., A.C., and F.C.; formal analysis, G.A.D., P.R., A.C., E.G.; investigation, G.A.D., P.R., A.C., and F.C.; resources, G.A.D., P.R., E.G., and F.C.; data curation, G.A.D., P.R., A.C., E.G., R.S. and F.C.; writing—original draft preparation, G.A.D., P.R., F.C., E.G., and R.S.; writing—review and editing, G.A.D., A.C., and F.C.; visualization, G.A.D., A.C., and E.G.; supervision, G.A.D., P.R., and F.C.; project administration, G.A.D.; funding acquisition, G.A.D., P.R., E.G., and F.C. All authors have read and agreed to the published version of the manuscript.

Funding

This work is part of the SMART GROUND project and has received funding from the European Union’s Horizon 2020 research and innovation program under Grant Agreement No 641988.

Acknowledgments

The authors wish to dedicate the present work to Alberto Trentin: our researching activity concerning circular economy in the extractive industry moved its first steps also thanks to his fundamental contribution during his degree thesis and in the following cooperation. Another special thought goes to Piergiorgio Rossetti, who worked hard during the research activities and passed away during the writing phase. The authors want to thank Mineral Industriali S.p.A. for their help during the investigation processes.

Conflicts of Interest

The authors declare no conflict of interest.

References

  1. Greenfield, A.; Graedel, T.E. The omnivorous diet of modern technology. Resour. Conserv. Recycl. 2013, 74, 1–7. [Google Scholar] [CrossRef]
  2. World Bank Group. End Extreme Poverty. Boost Shared Prosperity; Annual Report; The World Bank: Washington, WA, USA, 2017. [Google Scholar]
  3. Sapford, D.; Brabham, P.; Crane, R.; Evans, D.; Statford, A.; Wright, A. Mine Waste Resources Assessment And Appraisal of Recovery via Mine Water. In Proceedings of the IMWA 2017-13th International Mine Water Association Congress–“Mine Water & Circular Economy–A Green Congress, Rauha, Lappeenranta, Finland, 25–30 June 2017; pp. 956–963. [Google Scholar]
  4. Habib, K.; Wenzel, H. Exploring rare earths supply constraints for the emerging clean energy technologies and the role of recycling. J. Clean. Prod. 2014, 84, 349–359. [Google Scholar] [CrossRef]
  5. Khorasanipour, M.; Rashidi, S. Geochemical fractionation pattern and environmental behaviour of rare earth elements (REEs) in mine wastes and mining contaminated sediments; Sarcheshmeh mine, SE of Iran (2020). J. Geochem. Explor. 2020, 210, 106450. [Google Scholar] [CrossRef]
  6. Edahbi, M.; Plante, B.; Benzaazoua, M. Environmental challenges and identification of the knowledge gaps associated with REE mine wastes management. J. Clean. Prod. 2019, 212, 1232–1241. [Google Scholar] [CrossRef]
  7. Burlakovs, J.; Jani, Y.; Kriipsalu, M.; Vincevica-Gaile, Z.; Kaczala, F.; Celma, G.; Ozola, R.; Rozina, L.; Rudovica, V.; Hogland, M.; et al. On the way to ‘zero waste’ management: Recovery potential of elements, including rare earth elements, from fine fraction of waste. J. Clean. Prod. 2018, 186, 81–90. [Google Scholar] [CrossRef]
  8. Edahbi, M.; Plante, B.; Benzaazoua, M.; Ward, M.; Pelletier, M. Mobility of rare earth elements in mine drainage: Influence of iron oxides, carbonates, and phosphates. Chemosphere 2018, 199, 647–654. [Google Scholar] [CrossRef]
  9. European Commission. List of Critical Raw Materials for the EU; European Commission: Brussels, Belgium, 2017. [Google Scholar]
  10. Dondi, M. Feldspars and other Fluxes for Ceramic Tiles: Sources, Processing, Composition and Technological Behavior. Resour. Conserv. Recycl. 2018, 133, 191–205. [Google Scholar] [CrossRef]
  11. Moran, C.J.; Lodhia, S.; Kunz, N.C.; Huisingh, D. Sustainability in mining, minerals and Energy: new processes, pathways and human interactions for a cautiously optimistic future. J. Clean. Prod. 2014, 84, 1–15. [Google Scholar] [CrossRef]
  12. Carvalho, J.; Diamantino, C.; Rosa, C.; Carvalho, E. Potential recovery of mineral resources from mining tailing of abandoned mines in Portugal. In Proceedings of the 3rd International Symposium on Enhanced Landfill Mining, Lisbon, Portugal, 8–10 February 2016; pp. 501–516. [Google Scholar]
  13. Hudson-Edwards, K.A.; Macklin, M.G.; Miller, J.R.; Lechler, P.J. Sources, distribution and storage of heavy metals in the Rio Pilcomayo, Bolivia. J. Geochem. Explor. 2001, 72, 229–250. [Google Scholar] [CrossRef]
  14. Amos, R.T.; Blowes, D.W.; Bailey, B.L.; Sego, D.C.; Smith, L.; Ritchie, A.I.M. Waste-rock hydrogeology and geochemistry. Appl. Geochem. 2015, 57, 140–156. [Google Scholar] [CrossRef]
  15. Banks, D.; Younger, P.L.; Arnesen, R.-T.; Iversen, E.R.; Banks, S.B. Mine-water chemistry: The good, the bad and the ugly. Environ. Geol. 1997, 32, 157–174. [Google Scholar] [CrossRef]
  16. Lim, M.; Han, G.C.; Ahn, J.W.; You, K.S.; Kim, H.S. Leachability of Arsenic and Heavy Metals from Mine Tailings of Abandoned Metal Mines. Int. J. Environ. Res. Public. Health. 2009, 6, 2865–2879. [Google Scholar] [CrossRef] [PubMed] [Green Version]
  17. Gray, N.F. Environmental impact and remediation of acid mine drainage: a management problem. Environ. Geol. 1997, 30, 62–71. [Google Scholar] [CrossRef]
  18. Béjaoui, I.; Kolsi-Benzina, N.; Sappin-Didier, V.; Munoz, M. Health Risk Assessment in Calcareous Agricultural Soils Contaminated by Metallic Mining Activity under Mediterranean Climate. CLEAN–Soil Air Water 2016, 44, 1385–1395. [Google Scholar] [CrossRef]
  19. Liu, H.; Probst, A.; Liao, B. Metal contamination of soils and crops affected by the Chenzhou lead/zinc mine spill (Hunan, China). Sci. Total Environ. 2005, 339, 153–166. [Google Scholar] [CrossRef] [PubMed] [Green Version]
  20. Grimalt, J.O.; Ferrer, M.; Macpherson, E. The mine tailing accident in Aznalcollar. Sci. Total Environ. 1999, 242, 3–11. [Google Scholar] [CrossRef]
  21. Gerba, C.P. Risk Assessment. In Environmental Microbiology; Elsevier Inc.: Amsterdam, The Netherlands, 2009; pp. 575–587. [Google Scholar]
  22. Mehta, N.; Dino, G.A.; Ajmone-Marsan, F.; Lasagna, M.; Romè, C.; De Luca, D.A. Extractive waste management: A risk analysis approach. Sci. Total Environ. 2018, 622–623, 900–912. [Google Scholar] [CrossRef]
  23. ASTM. Standard Guide for Risk Based Corrective Action Applied at Petroleum Release Sites; ASTM International: West Conshohocken, PA, USA, 1995. [Google Scholar]
  24. ASTM. Standard guide for Risk Based Corrective Action; ASTM International: West Conshohocken, PA, USA, 2015. [Google Scholar]
  25. Lottermoser, B. Mine Wastes: Characterization, Treatment, and Environmental Impacts, 3rd ed.; Springer: Berlin/Heidelberg, Germany, 2010. [Google Scholar]
  26. Tiruta-Barna, L.; Benetto, E.; Perrodin, Y. Environmental impact and risk assessment of mineral wastes reuse strategies: Review and critical analysis of approaches and applications. Resour. Conserv. Recycl. 2007, 50, 351–379. [Google Scholar] [CrossRef]
  27. Dino, G.A.; Rossetti, P.; Biglia, G.; Sapino, M.L.; Di Mauro, F.; Särkkä, H.; Coulon, F.; Gomes, D.; Parejo-Bravo, L.; Zapata Aranda, P.; et al. SMART GROUND project: A new approach to data accessibility and collection for Raw Materials and Secondary Raw Materials in Europe. Environ. Eng. Manag. J. 2017, 16, 1673–1684. [Google Scholar] [CrossRef]
  28. Edraki, M.; Baumgartl, T.; Manlapig, E.; Bradshaw, D.; Franks, D.M.; Moran, C.J. Designing mine tailings for better environmental, social and economic outcomes: A review of alternative approaches. J. Clean. Pro. 2014, 84, 411–420. [Google Scholar] [CrossRef]
  29. Rampacek, C. An overview of mining and mineral processing waste as a resource. Resour. Conserv. 1982, 9, 75–86. [Google Scholar] [CrossRef]
  30. Dino, G.A.; Rossetti, P.; Perotti, P.; Alberto, W.; Sarkka, H.; Coulon, F.; Wagland, S.; Griffiths, Z.; Rodeghiero, F. Landfill mining from extractive waste facilities: The importance of a correct site characterization and evaluation of the potentialities. A case study from Italy. Resour. Policy 2018, 59, 50–61. [Google Scholar] [CrossRef] [Green Version]
  31. Dino, G.A.; Mehta, N.; Rossetti, P.; Ajmone-Marsan, F.; De Luca, D.A. Sustainable approach towards extractive waste management: Two case studies from Italy. Resour. Policy 2018, 59, 33–43. [Google Scholar] [CrossRef]
  32. Alcalde, J.; Kelm, U.; Vergara, D. Historical assessment of metal recovery potential from old mine tailings: A study case for porphyry copper tailings, Chile. Miner. Eng. 2018, 127, 334–338. [Google Scholar] [CrossRef]
  33. Bellenfant, G.; Guezennec, A.; Bodenan, F.; D’Hugues, P.; Cassard, P. Re-processing of mining waste: Combining environmental management and metal recovery? In Proceedings of the Eighth International Seminar on Mine Closure, Cornwall, UK, 18–20 September 2013; pp. 571–582. [Google Scholar]
  34. Jones, P.T.; Geysen, D.; Tielemans, Y.; Van Passel, S.; Pontikes, Y.; Blanpain, B.; Quaghebeur, M.; Hoekstra, N. Enhanced Landfill Mining in view of multiple resource recovery: A critical review. J. Clean. Prod. 2013, 55, 45–55. [Google Scholar] [CrossRef]
  35. Cavallo, A.; Dino, G.A. Granites of the Verbano-Cusio-Ossola district (Piedmont, Northern Italy): Possible candidates for the designation of “global heritage stone province” and a proposal of a geotouristic route. In Engineering Geology for Society and Territory-Volume 5: Urban Geology, Sustainable Planning and Landscape Exploitation; Lollino, G., Manconi, A., Guzzetti, F., Culshaw, M., Bobrowsky, P., Luino, Eds.; Springer: Cham, Switzerland, 2015; Volume 5, pp. 267–271. [Google Scholar]
  36. Bozzola, G.; Dino, G.A.; Fornaro, M.; Lorenzi, A. Technological innovations and secondary raw materials obtained from a virtuous management of wastes connected to mining activities: The examples of Gruppo Minerali Maffei S.p.A. Rend. Online Soc. Geol. Ital. 2010, 11, 519–520. [Google Scholar]
  37. Dino, G.A.; Fornaro, M.; Trentin, A. Quarry Waste: Chances of a Possible Economic and Environmental Valorisation of the Montorfano and Baveno Granite Disposal Sites. J. Geol. Res. 2012. [Google Scholar] [CrossRef] [Green Version]
  38. Cavallo, A.; Bigioggero, B.; Colombo, A.; Tunesi, A. The Verbano Cusio Ossola province: a land of quarries in northern Italy (Piedmont). Per. Mineral. 2004, 73, 197–210, SPECIAL ISSUE 3: A showcase of the Italian research in applied petrology. [Google Scholar]
  39. Thinkstep Recipe Description. Available online: http://www.gabi-software.com/support/gabi/gabi-lcia-documentation/recipe/ (accessed on 1 March 2020).
  40. Boriani, A. The geo-petrological setting of the Verbano-Ossola domain in the frame of the Alps. In Proceedings of the Quarry-Laboratory-Monument Int. Congress, Pavia, Italy, 26–30 September 2000. [Google Scholar]
  41. Nakamura, N. Determination of REE, Ba, Fe, Mg, Na and K in carbonaceous and ordinary chondrites. Geochim. Cosmochim. Acta 1974, 38, 757–775. [Google Scholar] [CrossRef]
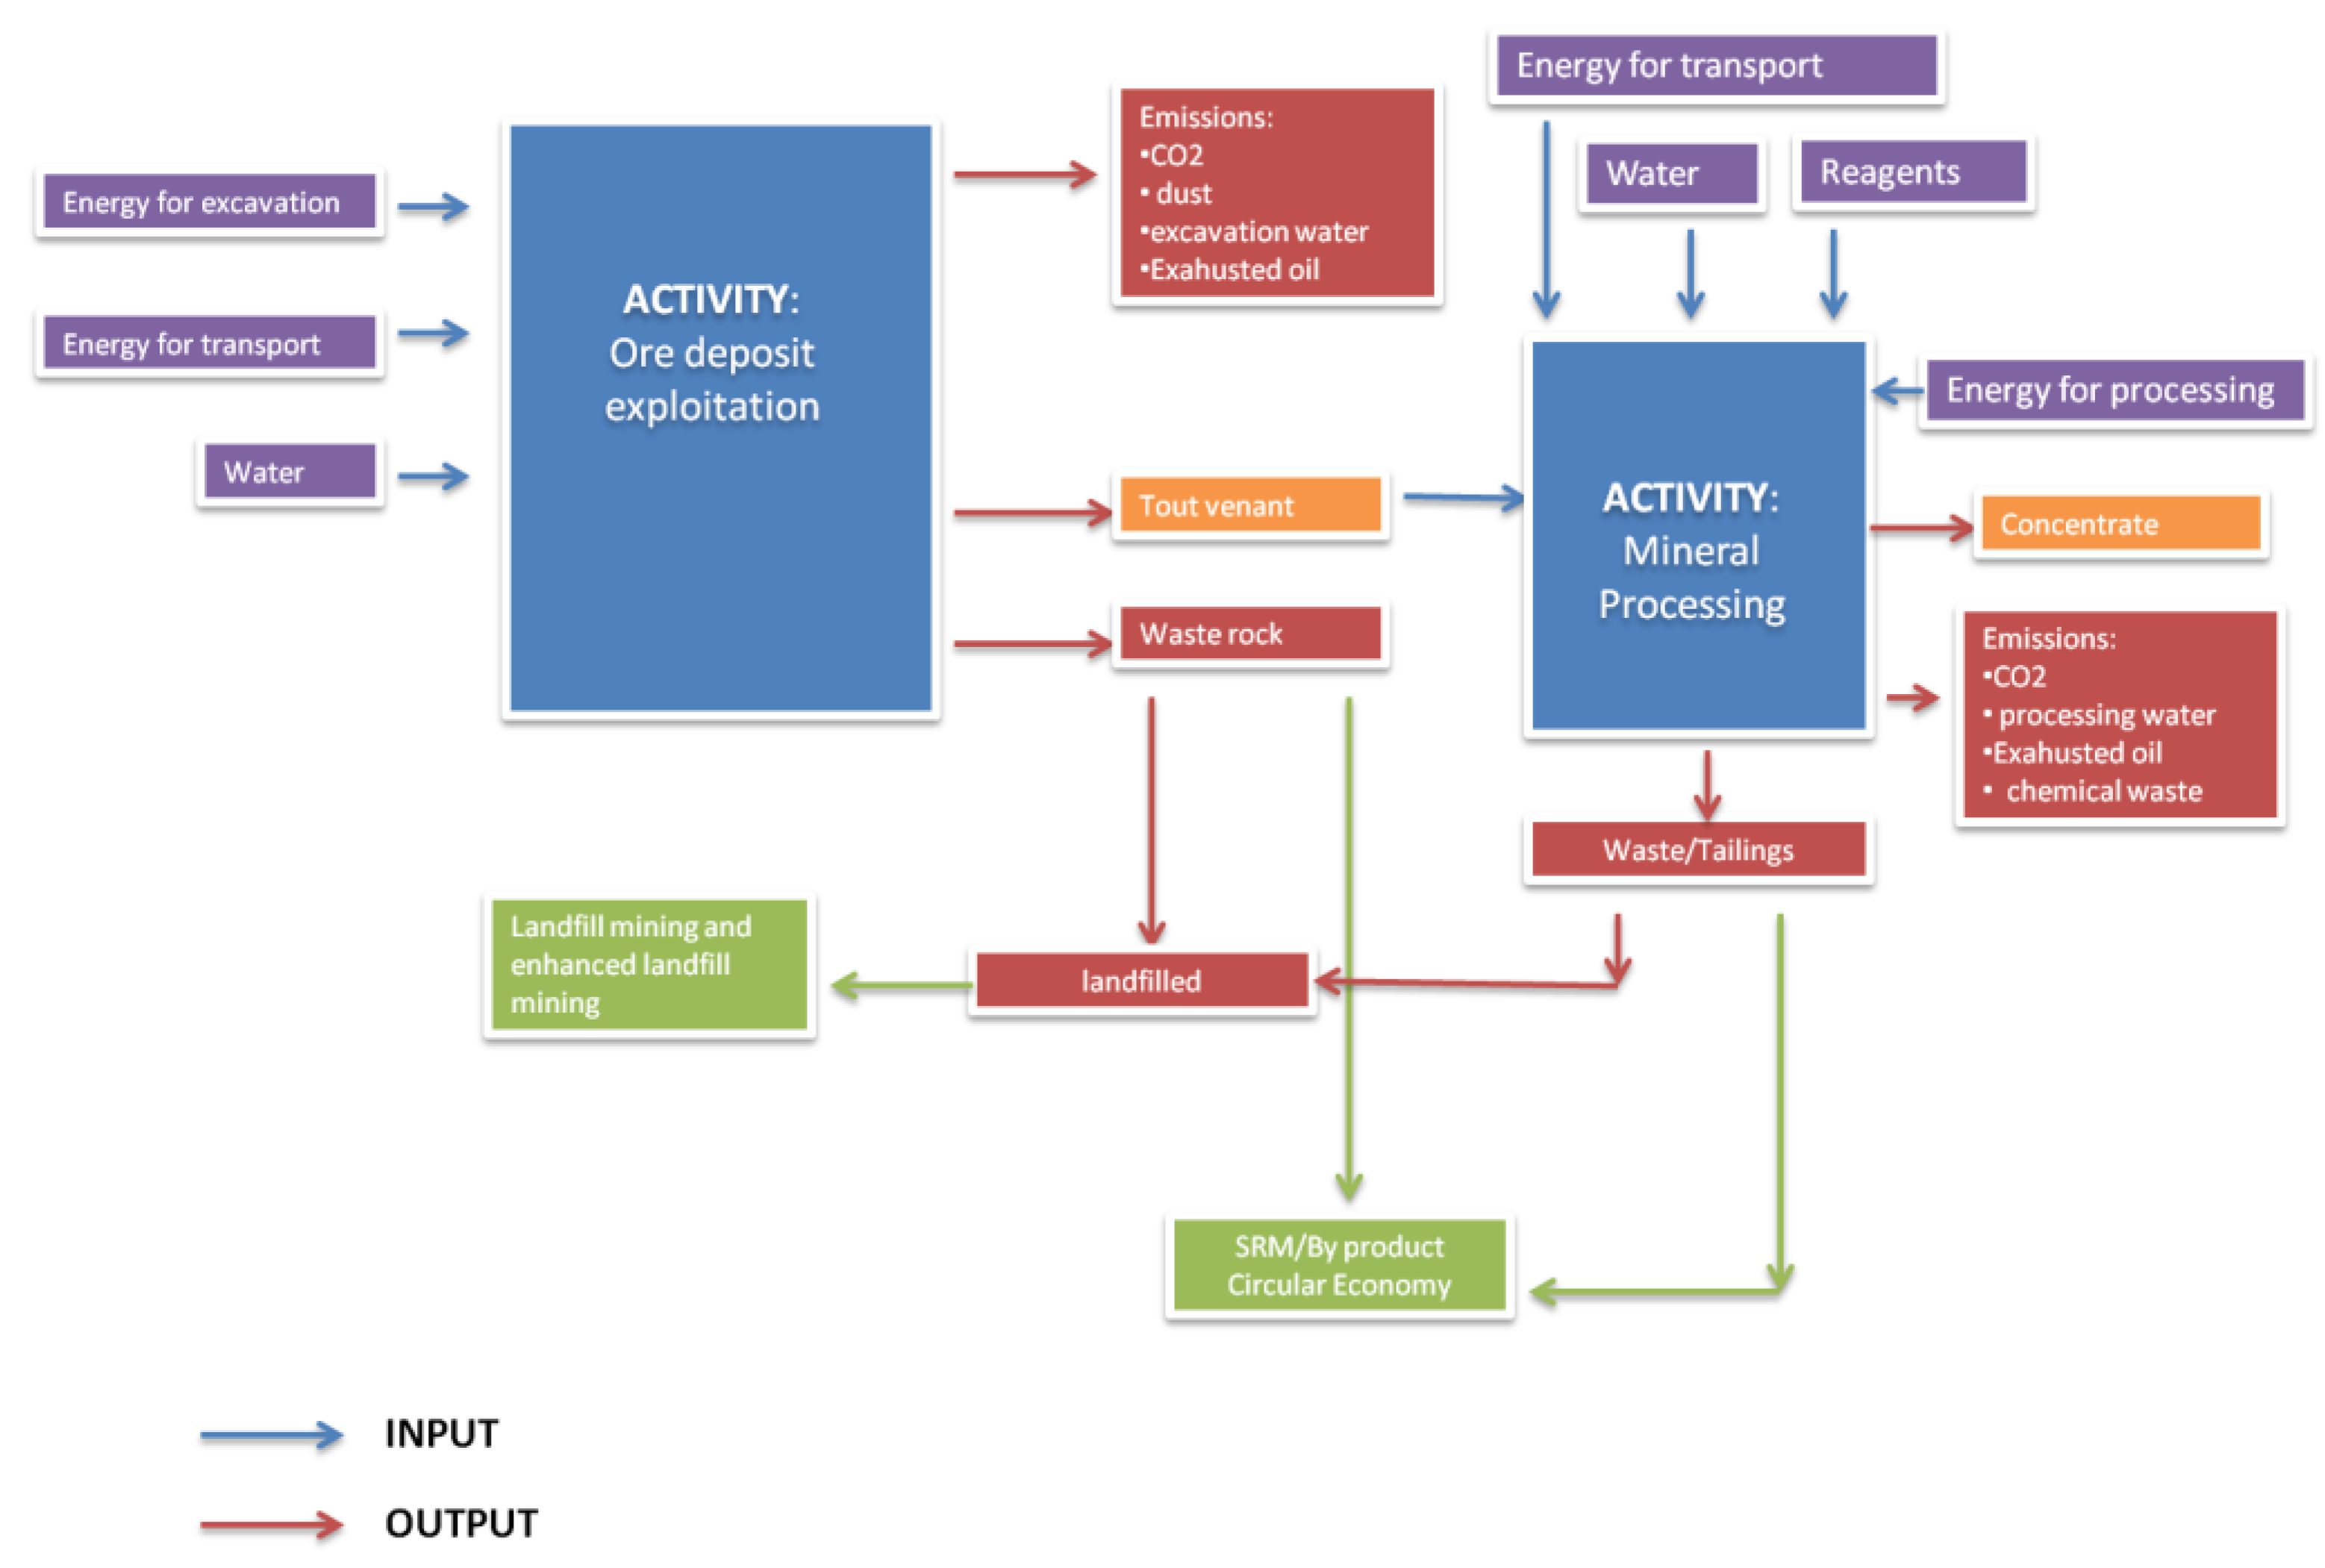
Figure 1. Schematic flow chart of mining and processing activity.
Sustainability 12 02383 g001
Figure 2. Geographic and geological context of the studied area. In the northern part (Montorfano area), it is possible to individuate the white and green granites. The pink dot indicates the Baveno-Mottarone pluton.
Sustainability 12 02383 g002
Figure 3. The Montorfano granite Massif lies very close to the Toce River and Maggiore Lake. The yellow square represents the Montorfano area. The figure shows also Sengio (blue square) and Ciana- Tane Pilastretto (red square) EW facilities. The Braghini EW facility is not reported in the picture (it is on the opposite side of the Toce river and pertains to the Monte Camoscio area).
Sustainability 12 02383 g003
Figure 4. System boundaries for environmental impact assessment.
Sustainability 12 02383 g004
Figure 5. Technology lines are represented as graphs.
Sustainability 12 02383 g005
Figure 6. Life-cycle-analysis (LCA) model of the Montorfano scenario.
Sustainability 12 02383 g006
Figure 7. Concentration of alkalis in the Sengio, Ciana-Tane Pilastretto and Braghini EW facilities (all samples; values in wt %). blue: WR; green: nonmagnetic fraction after each magnetic separation step (1SM, 2SM, and 3SM).
Sustainability 12 02383 g007
Figure 8. Concentration of Fe2O3tot in the S-Sengio, C-Ciana-Tane Pilastretto and B-Braghini EW facilities (all samples; values in wt %). blue: WR; red: nonmagnetic fraction >0.2%; orange: nonmagnetic fraction just above 0.2%; green: nonmagnetic fraction <0.2%.
Sustainability 12 02383 g008
Figure 9. Concentration of alkalis in the Montorfano pilot (all samples; values in wt %). blue: WR; red: treatment plant, magnetic fraction (MBP); green: treatment plant, nonmagnetic fraction (NMBP), orange: feeding material (FM).
Sustainability 12 02383 g009
Figure 10. Concentration of Fe2O3tot in the Montorfano pilot (all samples; values in wt %). blue: waste rock (WR); red: treatment plant, magnetic fraction (MBP); green: treatment plant, not magnetic fraction (NMBP), orange: feeding material (FM).
Sustainability 12 02383 g010
Figure 11. REE pattern for all samples, normalized to chondrite [41], logarithmic scale. Blue: WR; Red: treatment plant, magnetic fraction; Green: treatment plant, nonmagnetic fraction, Orange: treatment plant, feeding material.
Sustainability 12 02383 g011
Figure 12. La–Fe2O3 and La–P2O5 correlations. La as ppm, Fe2O3 and P2O5 as wt %. Blue: WR; Red: treatment plant, magnetic fraction; Green: treatment plant, nonmagnetic fraction; Orange: feeding material.
Sustainability 12 02383 g012
Figure 13. (a) Electrical tomography investigation of Sengio area. (b) Electrical tomography investigation of Tane-Pilastretto area. (c) Electrical tomography investigation of Braghini area. (d) Legend.
Sustainability 12 02383 g013
Figure 14. 3D site topography and sampling points (red dots) based on digital terrain model (DTM) with 1 m resolution and draped orthophoto.
Sustainability 12 02383 g014
Figure 15. Ratio of environmental loads in impact indicators.
Sustainability 12 02383 g015
Figure 16. Environmental loads versus savings (Note: Due to the high saving values in several indicators, the chart has been cut to show other indicators).
Sustainability 12 02383 g016
Figure 17. Loads versus savings in climate change impact indicator.
Sustainability 12 02383 g017
Figure 18. Loads versus savings in climate change impact indicator based on specific processes.
Sustainability 12 02383 g018
Figure 19. Loads versus savings in freshwater eutrophication impact indicator.
Sustainability 12 02383 g019
Figure 20. Weighted loads versus savings.
Sustainability 12 02383 g020
Table 1. World production of Strategic Raw Materials and Industrial Minerals.
Minerals/ElementsWorld Production 2017 (t)Compound Annual Growth Rate of World Mine Production over the Last 10 Years (2007–2016) (%)Main Producers—World (%)EU Prod. (t)—World (%)Main EU ProducersImport to EU-28 (t)
Cobalt135,5255.3Congo6123001.69Finland1368
Aluminum60,537,0004.7China552,260,0003.73Norway a5,455,675
REE b132,0001.6China79.5----
Pt187.102−1.1RSA711.2280.65Finland63.14
Pd211.279−0.4Russia410.9310.44Finland67.70
Rh23.803−0.6RSA8100-5.94
Lithium107,332 c7.5Australia49782 c0.73Switzerland a3294
Graphite943,135−0.1China715720.06-82,377
Feldspar d28,780,000-Turkey31.34,937,00017.15Italy2,688,000
Co, Al, Pt, Pd, Rh, Lt, and Graphite from JRC—RMIS (statistics 2017); import to EU from Eurostat Comex 2018. a not EU-28; b REE: Rare Earth Elements. Data from USGS (https://www.usgs.gov/centers/nmic/rare-earths-statistics-and-information), c in Li2O content; d Data collected from Dondi, 2018 [10]. Apart from feldspar, all minerals in the Table belong to the CRM as defined by mentioned EC 2017 Report.
Table 2. Environmental impacts associated to mining activity.
Emission to airCO2 production, due to tracks and machineries.
Dust connected to rocks and minerals exploitation, processing, transport (e.g., quartz, asbestos, metals).
Noise and potential odor, mainly connected to transport phases, mainly if the mining area has residential housing nearby.
Emission to waterReagents from mineral processing (e.g., as cyanide, xanthates, acids or bases resulting in low or high pH solid or dissolved metals or metalliferous compounds) [13].
Metals due to minerals concentrations in rocks [14,15].
Overall management of water connected to excavation phase, and to water and reagents connected to processing phase, such as: consumption and treatment and/or recycling of reagents (e.g., flotation reagents, cyanide, flocculants), water present in tailing facilities, surface water connected to precipitation, etc. [16].
Exhausted oils and lubricants connected to machineries
Emission to landDust or seepage of liquids from tailings and/or waste-rock management facilities into the ground: e.g., Acid Mine Drainage (AMD) [3,17].
Effluents and dust emitted from controlled or uncontrolled tailings and waste-rock management facilities, potentially toxic in varying degrees to humans, animals, and plants [18,19]. The effluents can be acidic or alkaline and may contain dissolved metals and/or soluble and insoluble complex organic constituents from mineral processing, as well as natural occurring organic substances such as humic and long- chain carboxylic acids from mining operations. The substances in the emissions, together with their pH level, dissolved oxygen content, temperature and hardness may all be important aspects affecting their toxicity to the receiving environment.
Table 3. Summing up of sampled materials during 2009 and 2016 field surveys.
EW FacilityNumber of Collected Samples from the EW FacilitiesSamples CharacteristicsDressing Activity at LabTypologies of Dressing Activity Performed
Braghini22Chip and rock pieces collected from the EW facilityyesGrinding and magnetic separation (first step: 1SM; second step: 2SM; third step: 3SM)
Ciana-Tane Pilastretto30Chips and rocks pieces collected from the EW facilityyesGrinding and magnetic separation (first step: 1SM; second step: 2SM; third step: 3SM)
Sengio26Chip and rock pieces collected from the EW facilityyesGrinding and magnetic separation (first step: 1SM; second step: 2SM; third step: 3SM)
Montorfano8Chip and rock pieces collected from the EW facilitynoCollection of 8 samples from the active treatment plant (feeding material, main product and by- products)
Table 4. Tonnages of SRMs from the active treatment plant.
Material Balance of PilotTotal Mass (tons)
During All Years of Operation (t/y)
Main products86,439
Gravel and sands61,524
SF and SF1005777
SN (black sand; magnetic concentrate)1838
SNG (black sand, magnetic concentrate. Class > 600 µm)6836
SNS (black sand, magnetic concentrate, coming from the production line for F60-401941
Armor stones, aggregate for embankment and filler23,237
TOTAL187,592
Table 5. Energy demand of the technology steps.
Operation TypeEnergy Need (MWh/Year)
Crushing (primary)16
Milling and screening69
Drying44
Magnetic separation51
Table 6. Geochemical analysis on the samples (average) from Sengio (S), Ciana-Tane Pilastretto (C-TP) and Braghini (B) EW facilities and on the not magnetic fraction after three magnetic separation steps (1SM, 2SM, and 3SM). The analytical error is ± 0.01 wt %.
Al2O3
%
Fe2O3
%
MgO
%
CaO
%
Na2O
%
K2O
%
TiO2
%
S_AV_WR13.932.380.281.183.085.120.26
S_AV_1SM13.720.310.111.053.375.060.03
S_AV_2SM13.790.210.101.033.375.110.02
S_AV_3SM13.860.190.101.053.485.050.02
C_TP_AV_WR14.252.290.281.323.314.790.25
C_TP_AV_1SM14.000.290.111.253.524.790.03
C_TP_AV_2SM13.680.190.101.243.484.740.02
C_TP_AV_3SM13.860.160.011.243.534.780.02
B_AV_WR13.021.400.140.543.644.790.10
B_AV_1SM12.850.250.010.463.685.040.01
B_AV_2SM12.820.20<0.010.443.715.050.01
B_AV_3SM12.780.20<0.010.465.575.090.01
Table 7. Geochemical analysis on the samples from Montorfano area and from the active dressing plant. waste rock (WR); magnetic fraction (MBP); nonmagnetic fraction (NMBP); feeding material (FM); the analytical error is ± 0.01 wt %.
SiO2
%
Al2O3
%
Fe2O3
%
MnO
%
MgO
%
CaO
%
Na2O
%
K2O
%
TiO2
%
P2O5
%
MO_01_01_WR71.4113.382.390.040.451.623.324.80.2050.05
MO_01_02_WR71.5513.742.280.0390.291.433.354.960.2080.06
MO_01_03_WR71.7413.812.330.040.311.513.424.490.2250.08
MO_01_04_WR71.7213.862.360.0390.321.413.44.710.2340.08
MO_01_05_WR71.9214.022.410.040.311.493.44.870.2330.07
MO_01_06_WR70.8414.262.40.0410.321.433.395.080.2290.07
MO_01_07_WR70.5613.572.090.0370.32.013.265.180.2050.07
MO_01_08_WR70.5614.652.30.0390.341.333.515.030.2250.07
MO_02_01_MBP63.8114.377.930.1431.21.42.84.80.730.15
MO_02_02_MBP58.1214.9713.340.2281.861.472.275.271.2260.22
MO_02_03_MBP56.4515.8913.20.2251.821.742.525.261.2850.32
MO_02_04 _FM69.1516.241.980.0380.291.573.766.020.2050.06
MO_02_05_NMBP77.0913.020.130.0050.021.213.424.420.012<0.01
MO_02_06_NMBP74.1914.360.30.0080.051.53.735.270.0270.01
MO_02_07_NMBP76.9312.990.150.0050.041.253.424.510.014<0.01
MO_02_08_NMBP75.7213.980.360.0090.061.363.644.450.0360.05
Table 8. Thickness and volumes for the investigate areas.
Quarry Waste DumpsAverage Thickness Calculated Thanks to Tomography Cross S (m)Ore Body Volume(m3)
Sengio20 m361,600
Ciana-Tane Pilastretto25 m1,489,000
Braghini15 m (tomography limit)158,000