2. Theoretical Background
The issues of compatibility between investment and sustainable development in different aspects are very relevant nowadays. Clark et al. (2018) [
7] saw the disconnection that exists between global ambitions and financial realities; Seidl and Nunes (2019) [
8] pointed out that there is a need for new investment and fiscal policy paradigms. In order to reach SDG health targets, scientists analyzed the way to strengthen the investment for a country’s health systems [
9,
10]. Sayer et al. (2017) [
11] highlighted the lack of empirical research on the financing scope towards environmental and developmental sustainability.
However, the issue of financing sustainable development at the country level has received too little attention. There are only a few scientific studies analyzing that issue. Shames et al. (2014) [
12] named various analyzed sources from which the capital could be obtained, admitting the fact that all other financial sources “only fulfill a small fraction of the overall finance required to meet the sustainable development and climate agendas”. It is common that at the highest levels, such as the country and international levels, have been continuously proposed to increase the funding; the role of the private sector is also becoming increasingly essential [
13]. Quentin et al. (2004) [
14] analyzed the different perspectives of rich and emerging countries. They highlighted the principal difficulties, especially in developing countries, in the financing of projects that promote sustainability and capacity development. Radu and Dimitriu (2012) [
15] analyzed the contributions of existing EU financing programs on sustainable development in Romania. Nevertheless, there is an evident lack of profound research dedicated to investment sources for sustainable development at the country level.
According to the Global Sustainable Investment Alliance (GSIA) [
16], Europe is significantly ahead in the growth of sustainable investment. Although each country faces the issue of finding possible investment sources for sustainable development implementation and maintenance, according to Hurley (2019) [
17], there is considerable interest in how sustainable financing can be harnessed in support of the SDGs.
For achieving the SDGs, each country has to find possible investment sources for sustainable development implementation and maintenance. The first document to show brief information on potential financing sources is named the “Monterrey Consensus of the International Conference on Financing for Development“, which provided insights into the following sources: Domestic financial resources, international resources, international trade as an engine for development, external debt, and enhancing the coherence and consistency of the international monetary, financial, and trading systems in support of development [
18].
Later, in 2012, when, at the United Nations Conference on Sustainable Development, “governments decided to establish an intergovernmental process under the General Assembly to prepare options on a strategy for sustainable development financing” [
19], there was no indication about transparent investment sources in sustainable development implementation. Later on, the first report, named “Intergovernmental Committee of Experts on Sustainable Development Financing”, was formed [
20], defining general options about domestic and international public and private financing opportunities. Despite the United Nations’ Addis Ababa Action Agenda (2015) [
21], which aimed at providing the framework to finance defined global ambitions presented as 17 SDGs [
1], there was an official opinion that the situation for sustainable development financing should be examined through a broader lens and that it urgently needs to be re-focused, stating the clear idea that “financing for sustainable development is not a cost, it is an investment” [
22].
All possible sources of investments are summarized quite extensively in the Report of the Intergovernmental Committee of Experts on Sustainable Development Financing [
23] (see
Figure 1).
One of the latest documents that summarizes investment in sustainable development is the “Roadmap for Financing the 2030 Agenda for Sustainable Development”, which states that investments in sustainable development are growing in some areas and countries. There is evidence that investing in the SDGs makes economic sense, with estimates highlighting that achieving the SDGs could open up to 12 trillion USD of market opportunities and create 380 million new jobs. That action on climate change would result in savings of about 26 trillion USD by 2030 [
24].
One of the sustainable development financing sources is EU Structural Funds. However, not all scientists agree that this type of financing has an impact on sustainable development. For instance, Marian et al. (2015) [
25] found out that EU funding had a weak influence in terms of sustainable development in Central and Eastern Europe countries. This could be due to the inadequate distribution of the financing. Klevas et al. (2007) [
26] claimed that, unfortunately, the distribution of funds should have been more oriented towards sustainable development. Branzas and Gurgen (2014) [
27] supported this statement by researching in Romania; according to them, Central and Eastern Europe Countries received the same amount of financing despite the level of their development. According to the authors, this refuted the primary purpose of the funding, which was to reduce the social and economic gap between the EU15 and Romania [
27], i.e., the balanced development of regions has an impact on sustainable development [
28]. The mentioned studies analyzed the EU financial support that was given until 2013. Unfortunately, there is a lack of scientific articles investigating the present situation with financing towards sustainable development, but it could be undoubtedly stated that the levels of EU members’ developments are still very different. Because of that, to receive reliable results, each country should be explored separately. This will help to pinpoint all possible sources of investments for all countries towards sustainable development for each country. The financing sources of the EU countries are presented in
Table 1.
As it could be seen from
Table 1, it is possible to distinguish two main investment sources for the analyzed countries:
Budget assignations, which will be represented as general government expenditures in functions: Economic affairs (General economic, commercial, and labor affairs; agriculture, forestry, fishing, and hunting; fuel and energy; mining, manufacturing, and construction; transport; communication; other industries; R&D economic affairs), environmental protection (waste management; wastewater management; pollution abatement; protection of biodiversity and landscape; R&D environmental protection), housing and community amenities (housing development; community development; water supply; street lighting; R&D housing and community amenities), health (medical products, appliances, and equipment; outpatient services; hospital services; public health services; R&D health), education (pre-primary and primary education; secondary education; post-secondary non-tertiary education; tertiary education; education not definable by level; subsidiary services to education; R&D education) and social protection (sickness and disability; old age; survivors; family and children; unemployment; housing; social exclusion; R&D social protection) [
54].
EU structural funds will be represented as the sum of all programming periods with their main funds: Cohesion Fund (CF); European Regional Development Fund (ERDF); European Social Fund (ESF); European Agricultural Fund for Rural Development (EAFRD); European Maritime and Fisheries Fund (EMFF). By period, it will be: 2000–2006 (CF, EAFRD, ESF, ERDF); 2007–2013 (CF, EAFRD, ESF, ERDF); 2014–2020 (CF, EAFRD, ESF, ERDF and EMFF). The purpose of all of these funds is to invest in job creation and a sustainable and healthy European economy and environment [
55].
Budget assignations and the EU structural funds are undoubtedly the primary sources of financing for sustainable development. However, there are more funding sources for sustainable development that could be distinguished. Clark et al. [
7] claim that green bonds could be treated as such sources. Naim and Begum (2018) [
56] discussed the idea that the banking sector can contribute to sustainable development. The authors state that one such element is the financial institutions’ role in sustainability issues by empowering different economic activities, such as business expansion, national output, ensuring a sustainable investment environment, and more. In addition, they note that the banking sector could make a profound contribution to the development of the country by adding extra value to Gross Domestic Product, Gross National Product, and other metrics of economic output that can directly influence the development of a country [
56]. Lentjushenkova et al. (2019) claim that intellectual capital could be a driver of sustainability [
57]. Jomo et al. (2016) [
58] stated that Public–Private Partnerships (PPPs) could be treated as a tool for sustainable development promotion.
To sum up, any country faces two issues while running the process of sustainable development—the investment sources for sustainability and the way to measure the results of sustainable development of a country.
3. Methodology
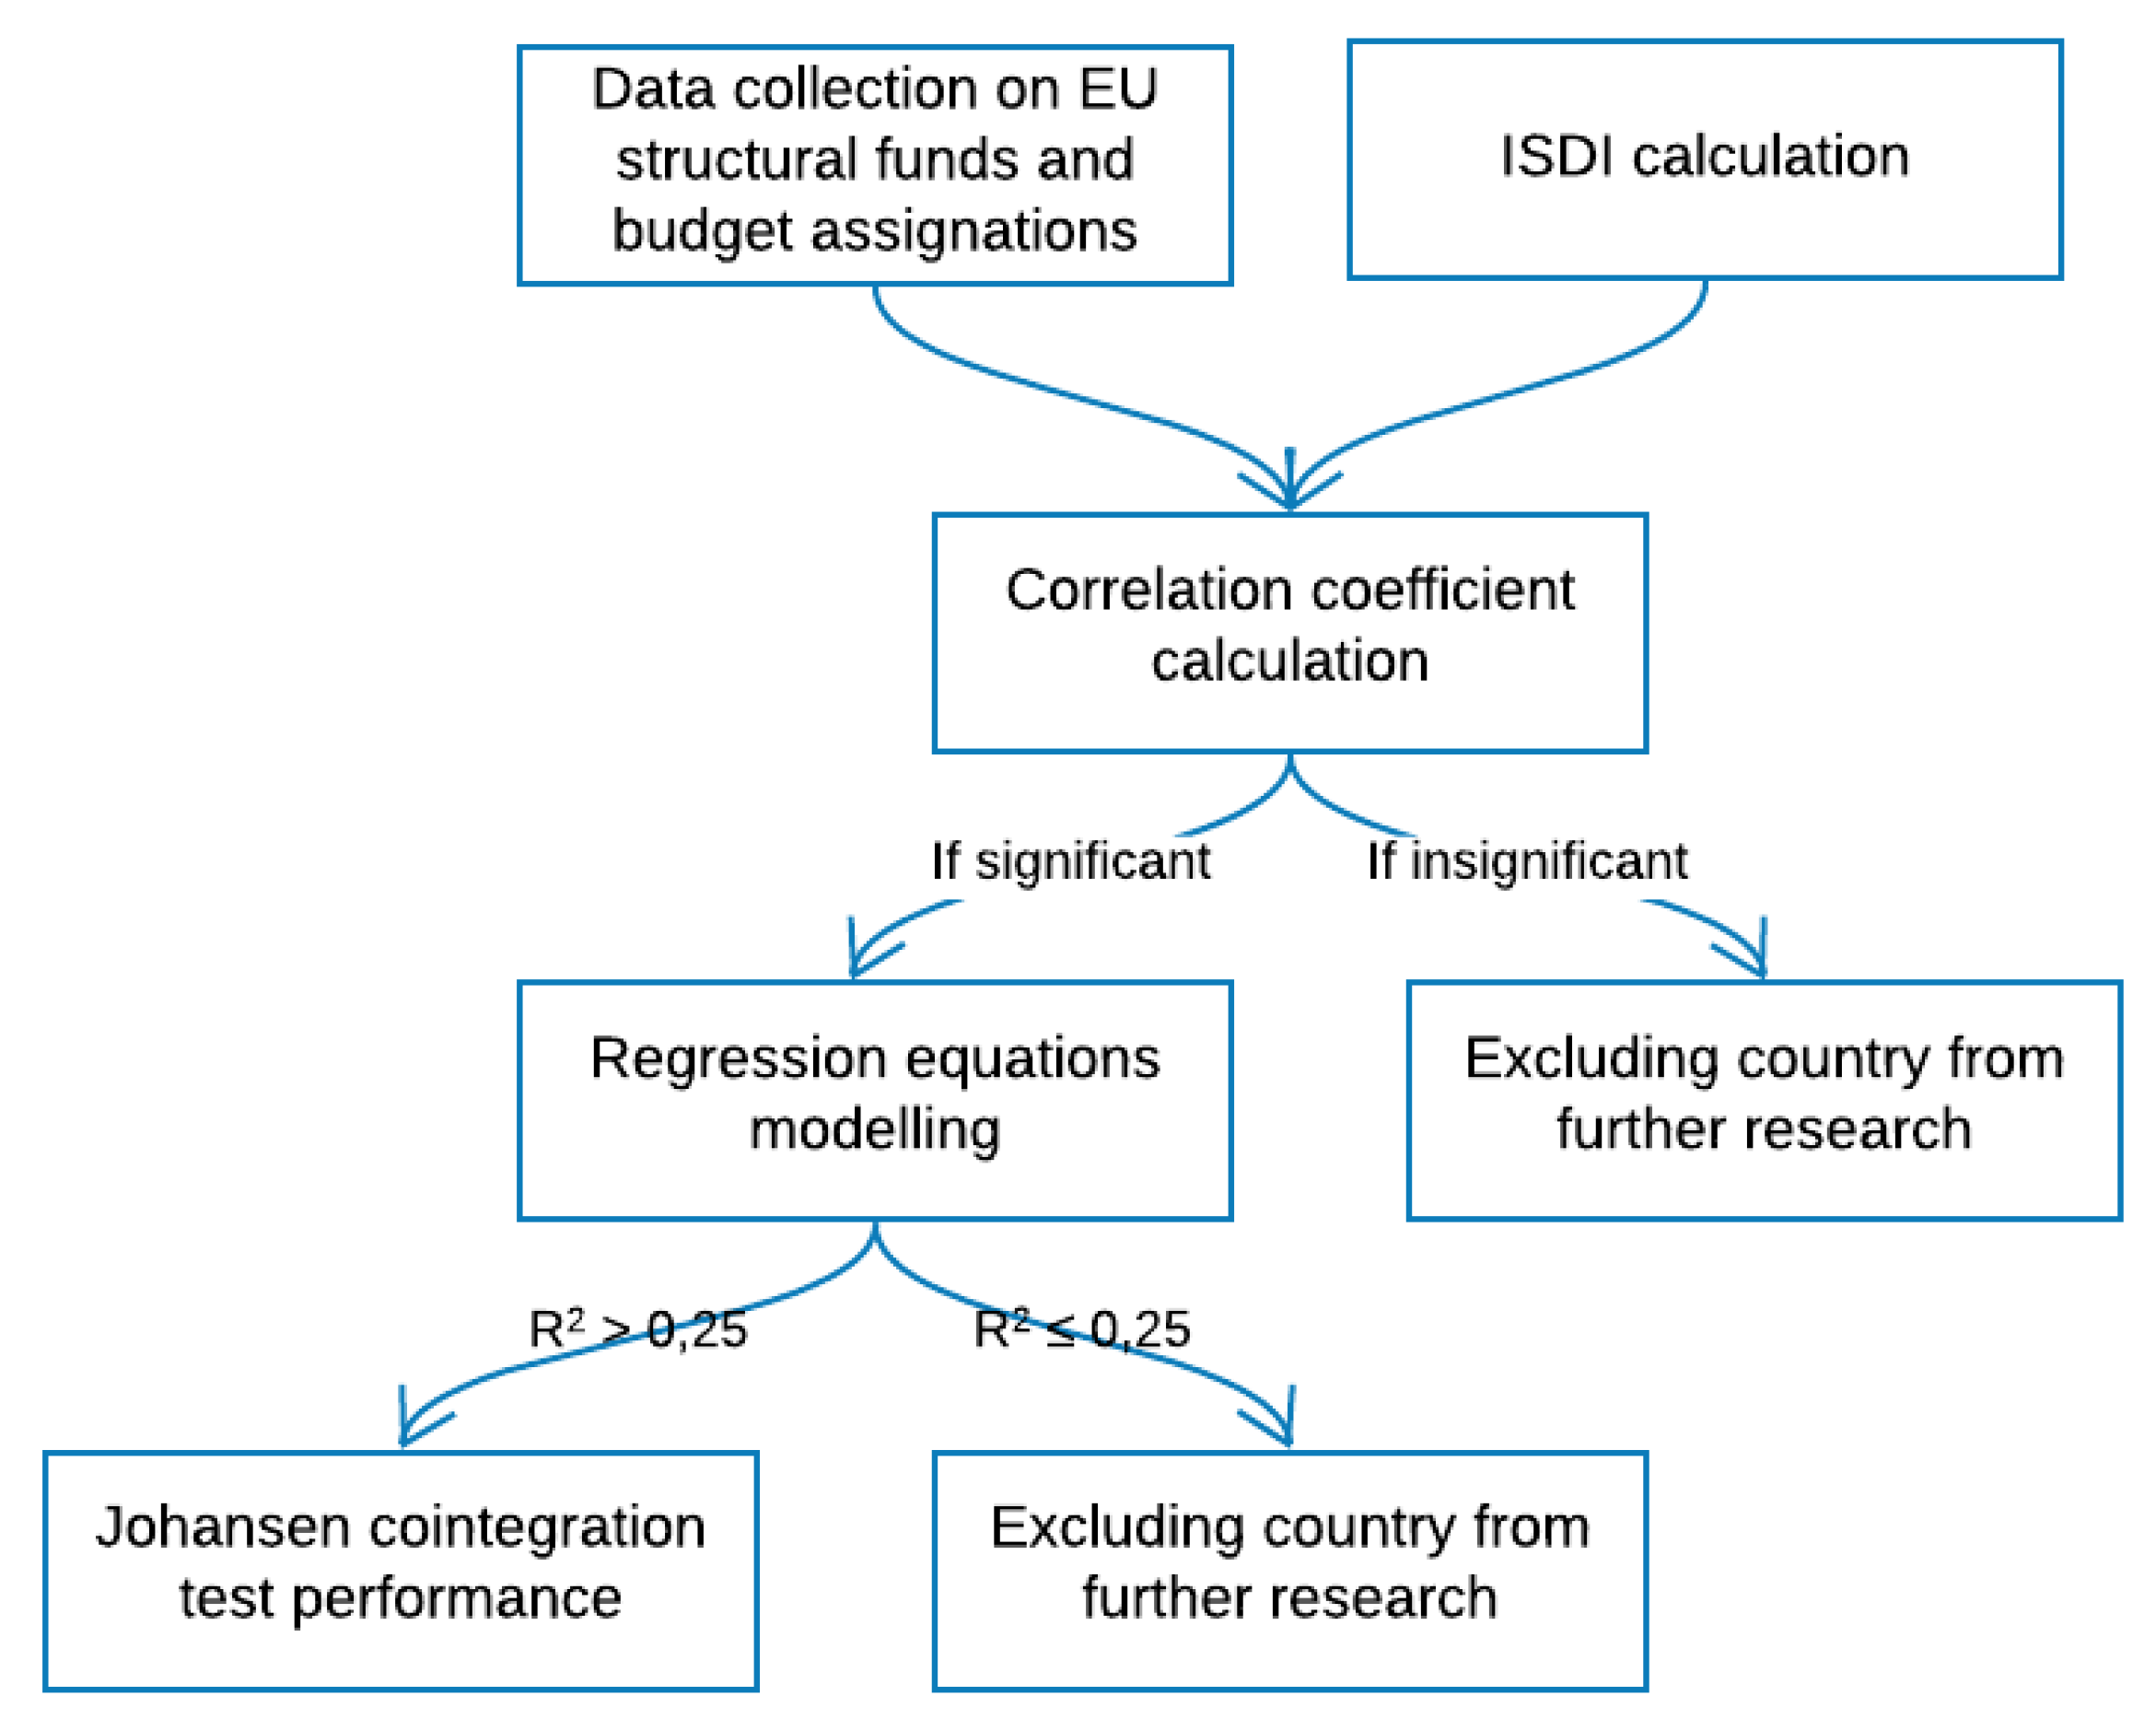
The research consists of four steps. The first step covered the collection of statistical data (i) on budget assignations, and the support from the EU structural funds for twenty-four research countries and the EU average. At the second step, the ISDI was calculated (ii) in order to reveal the current levels of countries’ sustainable development. The third step was dedicated to correlation–regression analysis (iii), which was employed to establish the existence and strength of relationships between budget assignations, EU structural funds, and the ISDI, as well as the impact of budget assignations and EU structural funds on ISDI. At the fourth step, the Johansen Cointegration Test was performed (iv) in order to find out if any long-run relationships between budget assignations, EU structural funds, and ISDI existed. The detailed research scheme is presented in
Figure 2.
ISDI calculations (ii) were carried out for the following EU countries: Belgium, France, Germany, Italy, Luxembourg, Netherlands, Denmark, Ireland, United Kingdom, Greece, Portugal, Spain, Austria, Finland, Sweden, Cyprus, Czech Republic, Estonia, Hungary, Latvia, Lithuania, Malta, Poland, Slovakia, and Slovenia. There are exceptions are Bulgaria, Romania (they joined the EU only in 2007), and Croatia (it joined the EU in 2013), as well as in Greece (there is no EU funding available). The general EU data were used as additional information for the comparison. The relationship establishment according to correlation regression analysis was done (iii) for each of twenty-four EU countries and the general EU data, and the connection between the ISDI and sources of investment (budget assignations and EU structural funds) was identified. The significance of the coefficients and strength of the connection were used to select countries and potential sources of investment for further analysis. The Johansen Cointegration Test (iv) results in interpretation in the long-run perspective, i.e., both analyzed sources of investment have a relationship with ISDI.
Each EU country’s sustainable development was expressed as ISDI. The main advantage of the ISDI calculation methodology is that this methodology is flexible enough to accommodate any sustainable development assessment period and crosscutting and to choose the sustainable development aspects that best reflect the country’s development and the desired level of sustainable development. For example, if a particular aspect of sustainable development becomes obsolete, it can be removed or replaced. If other elements relevant to sustainable development appear, they can be included instead of the former, or simply supplement the entire computing system with a more significant number of indicators [
44]. To sum up, the ISDI is aggregated from three mediums—economic, social, and environmental—and is designed to combine all of them into a single index.
The ISDI could be calculated using the formulas presented below [
59,
60]:
where:
ISDI—integrated sustainable development index
IEcD—economic sustainable development index
ISD—social sustainable development index
IEnD—environmental sustainable development index
ai—weights of sustainability indices, i = 1, 2, 3 (with the condition: ).
Each medium consists of different indicators, which are integrated into a single index. The number of indicators could vary, but each medium should have the same number of indicators in order to keep the balance of sustainable development.
where:
n—number of indicators
Rj—j-th indicator
aj—j-th indicator’s weight (with the condition: )
Im—medium index.
Due to the variety of data and the number of analyzed EU countries, the number of indicators in this research was selected according to the access of the same data for all analyzed countries. The indicators used [
61] in the current study for ISDI calculation are presented in the
Figure 3.
It is important to emphasize that the ISDI shows the changes in the results of a country’s sustainable development performance.
After the ISDI is calculated, the correlation regression analysis is performed. For the analysis, two independent variables are used. They are as follows: Budget assignations (x1) and financing received by countries from EU structural funds (x2), with the ISDI as a dependent variable (y). First of all, the existence of the stochastic relationship is checked. If it exists, regression equations could be developed.
After the correlation–regression analysis, in order to determine how variables interact (i.e., whether sustainable development affects investment sources or vice versa), the Johansen Cointegration Test is employed. The Johansen cointegration test procedure is often used to test for cointegration. The null hypothesis that processes are not cointegrated is tested against the alternative hypothesis that processes are cointegrate.
There are two possible specifications for error correction: That is, two vector error correction models (VECM), but only the first one will be analyzed—The long-run hypothesis:
where:
k—number of delays;
t—time;
ε—uncorrelated random error.
Hypotheses are on the long-run relation . The following null hypothesis is formulated for Johansen’s test: H0: There is a relationship between the dependent and independent variables in the long run. If the p-value is greater than 0.05, the null hypothesis is rejected, and results could be interpreted in the long-run perspective.
4. Empirical Findings
As scientific practice witnesses, any task-oriented analysis requires a short-list of indicators; otherwise, comparisons of the countries and sustainable development management processes are hardly feasible [
62]. For measuring sustainable development, it is common to select and match a certain number of indicators for each of the three (or more) dimensions—economic, social, and environmental [
59]. The indicators for ISDI calculations are presented in the Methodology section. The case calculations of ISDI for the EU are presented in
Appendix A. It should be emphasized that the index does not show the overall development of the country, but rather the growth from the base year. The same principle of ISDI calculations was applied for twenty-five EU countries. As a result, the first countries on the list had the fastest and highest growth compared to countries at the bottom of the list. Index calculation results are presented in the following
Table 2,
Table 3 and
Table 4.
Table 2 shows that the United Kingdom is in the first place because of one primary indicator of growth: The share of renewable energy has increased from 1.1 to 60.31 (percentages of gross final energy consumption), which means that this indicator alone has grown almost 60 times and accounts for the largest share of growth. Lithuania is in the second place because of the rapid growth of all indicators from 2003 to 2017 in every sphere: Social, economic, and environmental. The most significant growth can be seen in GDP, almost three times, and the most significant decrease is in fatal road accidents—more than three times as well. Malta took third place for the same reason as the UK. Additionally, the main indicator of growth—share of renewable energy—increased from 1.00 to 7.17 (percentages of gross final energy consumption), which means that this indicator alone has grown almost seven times, with no results for Phosphates in rivers (mg PO4 per liter). Ireland lined up in fourth place mainly because of the growth of all indicators, but it has some main changes in these indices: The share of renewable energy has grown almost 15 times—from 2.4 to 29.86 (percentages of gross final energy consumption), and there was decrease in fatal road accidents from 8.40 to 3.5 (per 100,000 persons). Slovakia is in the fifth place mainly because of these indicators: a) People at risk of poverty or social exclusion—from 32.00% to 13.09%, b) fatal road accidents— from 12.20 to 5.10 (per 100,000 persons), and c) gross nitrogen balance on agricultural land—from 48.00 to 16.00 (kg per hectare). Luxembourg lined up in sixth place because of mainly one indicator—share of renewable energy—which grew from 0.9 to 6.38 (percentages of gross final energy consumption). Belgium is in seventh place, with a stable growth in all areas, though one indicator, named fatal road accidents, decreased from 11.70 to 5.40 (per 100,000 people). Estonia is in eighth place mainly because of rapid changes in four indicators: GDP grew from 6300 to 18,000 (current prices, euro per capita), purchasing-power-adjusted GDP per capita grew from 11,000 to 23,600 (real expenditures per capita, in PPS), Fatal road accidents decreased from 12.00 to 5.20 (per 100,000 persons), and phosphates in rivers decreased from 0.04 to 0.02 (mg PO4 per liter). Latvia is spotted in ninth place, and four indicators can be highlighted as the main reason for growth: GDP grew from 4600 to 13,900 (current prices, euro per capita), purchasing-power-adjusted GDP per capita increased from 9400 to 20,000 (real expenditures per capita, in PPS), Early leavers from education and training declined from 18.80 to 8.60 (percentages of population aged 18 to 24), and fatal road accidents decreased from 23.30 to 8.50 (per 100,000 persons).
Table 3 shows that the Czech Republic is in the tenth place with the most significant results in fatal road accidents, which declined from 14.20 to 5.40 (per 100,000 people), share of renewable energy grew from 6.90 to 14.76 (percentages of gross final energy consumption), and phosphates in rivers decreased from 0.25 to 0.13 (mg PO4 per liter). Poland lined up in an eleventh place with the highest results in people at risk of poverty or social exclusion, which decreased from 45.00 to 19.50 (percentages), and Fatal road accidents, which declined from 14.80 to 7.50 (per 100,000 people). As it can be seen, some negative results can be pointed out: Expenditure on social protection decreased from 18.90 to 16.40 (percentages of GDP) and greenhouse gas emissions grew from 10.40 to 11.00 (tonnes per capita), which are small changes, but have a negative impact, even though they are slight, and with no results of phosphates in rivers (mg PO4 per liter). Greece could be ranked twelfth with the highlighted following results: Fatal road accidents declined from 12.70 to 3.90 (per 100,000 persons), and share of renewable energy grew from 8.30 to 17.50 (percentages of gross final energy consumption), but with some negative results: The percentage of people at risk of poverty or social exclusion grew from 25.00 to 26.60, and live births reduced from 440,531 to 391,265 (in total). In addition, there was no indication of phosphates in rivers (mg PO4 per liter). Portugal took thirteenth place with significant changes in these indicators: Early leavers from education and training reduced from 41.20 to 12.60 (percentages of population aged 18 to 24) and fatal road accidents declined from 14.60 to 5.80 (per 100,000 persons), with only one negative result: Live births decreased from 112,515 to 86,154 (in total). No phosphates were observed in rivers (mg PO4 per liter). Hungary is in fourteenth place, with the most effected indicators being: Fatal road accidents decreased from 13.10 to 6.40 (per 100,000 people) and share of renewable energy grew from 4.40 to 13.40 (percentages of gross final energy consumption).
Additionally, there are slight differences in the percentages of negative changes; specifically, the indicator of early leavers from education and training grew from 12.00 to 12.50 (percentage of the population aged 18 to 24) and expenditure on social protection decreased from 15.70 to 14.00 (percentage of GDP). Again, no phosphates were found in rivers (mg PO4 per liter). Cyprus lined up in fifteenth place with the following highlighted results: Early leavers from education and training decreased from 17.30 to 8.50 (percentages of population aged 18 to 24), fatal road accidents declined from 13.50 to 6.20 (per 100,000 persons), and share of renewable energy grew from 3.10 to 9.85 (percentages of gross final energy consumption). However, there was a negative result: Phosphates in rivers rose from 0.00 to 0.01 (mg PO4 per liter). Denmark is in sixteenth place, with most noticeable positive indicators: Greenhouse gas emissions decreased from 14.70 to 8.80 (tonnes per capita), share of renewable energy grew from 14.90 to 35.77 (as percentages of gross final energy consumption), and fatal road accidents declined from 8.00 to 3.00 (per 100,000 people). Other indicators experienced insignificant change with negative results; for instance, employment rate went down from 77.30 to 76.90 (as percentages of population aged 20 to 64), the indicator of people at risk of poverty or social exclusion grew from 16.90 to 17.20 (percentages), expenditure on social protection declined from 23.70 to 22.40 (percentages of GDP), and live births decreased from 64,682 to 61,397 (total). The Netherlands took seventeenth place with the most significant changes in these indicators: Early leavers from education and training dropped from 14.30 to 7.10 (as percentages of population aged 18 to 24), fatal road accidents went down from 6.30 to 3.00 (per 100,000 persons), share of renewable energy grew from 2.00 to 6.60 (as a percentage of gross final energy consumption). The negative result of live births decreased from 200,297 to 169,836 (in total). Italy lined up in eighteenth place with the changes of these leading indicators: Fatal road accidents decreased from 11.50 to 5.60 (per 100,000 people), share of renewable energy grew from 6.30 to 18.27 (as percentages of gross final energy consumption), with negative results in these indicators: Live births decreased from 544,063 to 458,151 (in total), and GDP went down from 27,800 to 26,500 (current prices, euro per capita).
The results presented in
Table 4 show that Spain lined up in nineteenth place with the most noticeable changes of indicators being: Fatal road accidents reduced from 12.70 to 3.90 (per 100,000 persons), early leavers from education and training grew from 25.00 to 26.60 (as percentages of population aged 18 to 24), and share of renewable energy grew from 8.30 to 17.51 (as a percentage of gross final energy consumption). However, there were some negative consequences: Live births decreased from 440,531 to 391,265 (in total), the percentage of people at risk of poverty or social exclusion grew from 25.00 to 26.60, and no phosphates were discovered in rivers (mg PO4 per liter). Slovakia ranked twentieth, with small changes in fatal road accidents, which reduced from 12.10 to 5.00 (per 100,000 people), and gross nitrogen balance on agricultural land, which went down from 98.00 to 42.00 (kg per hectare). There was only one small negative change of indicator: Expenditure on social protection declined from 16.70 to 16.20 (percentages of GDP), with no phosphates in rivers (mg PO4 per liter). Germany is in twenty-first place, with two significant positive changes in fatal road accidents, which decreased from 8.00 to 3.80 (per 100,000 people), and share of renewable energy grew from 6.20 to 15.45 (as a percentage of gross final energy consumption). Furthermore, there were three small negative changes: Live births declined from 64,682 to 61,397 (in total), expenditure on social protection decreased from 21.00 to 19.40 (percentages of GDP), and the percentage of people at risk of poverty or social exclusion grew from 18.40 to 19.00. As far as the general situation of Europe is concerned, it ranks twenty-second, with some positive changes in the category of early leavers from education and training, which decreased from 16.40 to 10.60 (as percentages of population aged 18 to 24), fatal road accidents, which declined from 10.40 to 4.90 (per 100 000 person), and share of renewable energy, which grew from 8.50 to 17.53 (as percentages of gross final energy consumption). There were no negative changes, additionally, with no phosphates in rivers (mg PO4 per liter). France took twenty-third place with these increased results: Fatal road accidents decreased from 9.70 to 5.20 (per 100,000 people), share of renewable energy grew from 9.50 to 16.30 (as a percentage of gross final energy consumption), and phosphates in rivers declined from 0.08 to 0.04 (mg PO4 per liter). There was only one negative indicator: Live births went down from 793,893 to 770,045 (in total). Sweden ranked twenty-fourth place with positive changes in fatal road accidents, which decreased from 5.90 to 2.50 (per 100 000 people). Most other indicators registered negative results: Expenditure on social protection declined from 23.00 to 20.20 (percentages of GDP), the percentage of people at risk of poverty or social exclusion grew from 16.90 to 17.70, and gross domestic expenditures on R&D decreased from 3.61 to 3.40 (as percentages of GDP). Austria took twenty-fifth place in terms of positive results in fatal road accidents, which declined from 11.50 to 4.70 (per 100,000 people), and there were two negative indicators: Expenditure on social protection decreased from 21.00 to 20.50 (percentages of GDP), and the percentage of people at risk of poverty or social exclusion grew from 15.70 to 18.10. Finland ranked the last, twenty-sixth place, because of insignificant growth in indicators. However, one of them specified the most: Fatal road accidents decreased from 7.30 to 4.30 (per 100,000 people). In addition, two of indicators were registered as the most negative ones: Gross domestic expenditures on R&D declined from 3.30 to 2.76 (as percentages of GDP) and live births decreased from 56,630 to 50,321 (in total). It is clear from the ISDI results that all countries are growing annually and gradually with some changes. Countries have the most significant growth or decline because of a few fluctuations in the leading indicators, which means that results can be different by eliminating or adding more specific indicators for the needs of a specific country. In every area, these leading indicators can be pointed out with the most significant changes: Growth or decline with the most significant effect for each country on the list of ISDI. From an economic perspective, the most significant positive changes are in GDP, in which three countries had the most significant growth, and purchasing-power-adjusted GDP per capita, in which two countries had the most significant growth. However, the most noticeable negative changes are in: Gross domestic expenditures on R&D in which two countries had the most significant decline. In the social area, the most significant positive changes are in fatal road accidents—twenty-two countries had a significant decline in this indicator—and early leavers from education and training—five countries had a significant decline in this indicator. In addition, the most noticeable negative changes are in the other three indicators: People at risk of poverty or social exclusion, in which six countries had significant growth, expenditure on social protection, in which seven countries had a significant decline, and live births, in which nine countries had a significant decline. From environmental perspective, only one leading indicator can be named that experienced positive changes: Share of renewable energy—in fourteen countries, this indicator can be spotted as one of the main ones which affected the ISDI results the most. From these results can be named one of the most significant indicators that had positive changes: the decline in fatal road accidents. Furthermore, one of the most significant indicators that experienced negative changes was live births.
The countries of the EU, according to the ISDI results, ranked in the following order: United Kingdom, Lithuania, Malta, Ireland, Slovakia, Luxembourg, Belgium, Estonia, Latvia, Czech Republic Poland, Greece, Portugal, Hungary, Cyprus, Denmark, Netherlands, Italy, Spain, Slovenia, Germany, European general rank, France, Sweden, Austria, and Finland.
The second important step is to compare and find out whether there is a link between countries’ sustainable development, expressed as ISDI, and sources of investment—EU structural funds and assignation of budget. Correlation analysis was performed for twenty-four EU countries and general EU data, except for Greece, as there are no data of EU funding available (see
Table 5).
From
Table 5, it is easy to see that in twenty-two countries, there is “very strong positive” relationship, and in three countries, there is “positive, strong” relationship between ISDI and assignation of budget. This shows that assignations have a strong influence across the whole of Europe in ISDI. In addition, according to the interpretation, rising assignations must raise the ISDI.
However, there are other trends in the analysis of European structural funds’ relation with ISDI. One country does not have a relationship. Two countries have a negative correlation (one has very strong, another strong), which should mean that raising the investments will reduce the ISDI. Four countries have a very weak positive relationship. Four countries have a weak positive relationship. Nine countries have a strong positive relationship. Six countries have a very strong positive relationship. In summary of EU funds, fifteen countries have at least a strong positive or very strong connection. Therefore, it can be said that in most countries, this indicator has an impact on the ISDI, and raising funds should raise the ISDI.
Likewise, the significance of the correlation coefficient with the critical value of the correlation coefficient must be evaluated in order to select countries for further regression analysis. In essence, results are displayed in
Table 6.
Table 6 explains that, for Malta, Belgium, France, Germany, Italy, Luxembourg, Netherlands, Ireland, United Kingdom, Greece, Portugal, and Sweden, at least one of the investment sources (assignation of budget or EU structural funds) has a
t value lower than
tcr, and the correlation coefficient is not statistically significant (the stochastic relationship between variables does not exist).
For (marked in bold in the
Table 6) Lithuania, Slovakia, Estonia, Latvia, Czech Republic, Poland, Hungary, Cyprus, Denmark, Spain, Slovenia, Austria, Finland, and the European Union, the
t values are higher than
tcr for both investment sources, and the correlation coefficient is statistically significant (the stochastic relationship between variables exists). In addition to these countries, multiple correlation regression can be performed (see
Table 7).
The multiple correlation regression results highlight three main parts: Equation, determination coefficients (R2), and ratio of variances (F). The first number in the equation shows the basic index and how much the budget assignations (x1) and financial sources received from the EU structural funds (x2) change the index when an additional million euros are invested.
The determination coefficients for all European countries are high enough (0.6 and more), which means that the main factors affecting the dependent variable ISDI are included in the regression equation. The minimal R2 value is in Cyprus (0.755474), i.e., the regression equation explains 75.55 percent scatter of statistical points (which shows the reliability of the equation). In addition, the maximal R2 value is in Malta (0.960748), i.e., the regression equation explains 96.07 percent scatter of statistical points (which shows the reliability of the equation).
The ratio of variances (F) for all countries is more significant than F critical (Fcr); therefore, it can be said that the regression equations are adequate for the real situation (i.e., ISDI with assignation of budget and EU structural funds has linear dependence) and can be applied in planning for practical calculations.
Based on methodological material, a Johansen Cointegration test was performed to test and supplement the correlation–regression analysis results. All countries from the multiple correlation regression were additionally tested: Lithuania, Malta, Slovakia, Estonia, Latvia, Czech Republic, Poland, Hungary, Cyprus, Denmark, Spain, Slovenia, the EU, Austria, and Finland (see
Table 8). The calculations can be found in
Appendix B.
Analyzing the Johansen Cointegration test results, the following interpretations can be distinguished. For the Czech Republic, Denmark, Spain, Slovenia, and Austria (marked in bold in the
Table 8) the null hypothesis was rejected stating that investment sources could be interpreted from the long perspective. In Lithuania, Malta, Latvia, Hungary, Cyprus, and Finland, null hypotheses are accepted, and EU funds and assignation of budget impact can not be interpreted from a long-term perspective.
5. Results and Discussion
The null hypothesis was rejected in the following countries: Slovakia, Estonia, Czech Republic, Poland, Denmark, Spain, Slovenia, the EU, and Austria, which indicates that investment sources can be interpreted from the long-term perspective. In Slovakia, in the long-run, the EU funds have a positive impact, while budget assignations have a negative effect on the ISDI, on average, ceteris paribus. In Estonia, in the long-run, both investment sources have a negative influence on the ISDI, on average, ceteris paribus. In the Czech Republic, Denmark, Spain, Slovenia, and Austria (marked in bold in
Table 8), in the long-run, the EU funds as well as assignation of budget have a positive impact on the ISDI, on average, ceteris paribus. In Poland, in the long-term perspective, the EU funds have a positive impact, while budget assignations have a negative effect on the ISDI, on average, ceteris paribus. In the EU, in the long-run, the EU funds have a negative impact, while assignation of budget has a positive effect on the ISDI, on average, ceteris paribus.
To sum up, the results of the test show that for nine of the fifteen countries studied, the relationship between the variables was tested and is tangible. Most results (five out of nine countries) show that, in the long-run, the EU funds as well as assignation of budget have a positive impact on the ISDI, on average, ceteris paribus. In other words, there are five countries in which both studied variables influence the ISDI positively, creating two long-run relations among the variables. There could be several interpretations of why five out of nine countries showed such results. All five countries are below the top 10 countries’ ISDI results, not showing the most significant changes in the current state of a country’s sustainable development performance. As in this research, the ISDI was used as an indicator representing the current state of the country’s sustainable development, it serves the interaction between the performance changes of sustainable development of a country and the investment sources. The lower level of sustainable development performance results could even mean that the country is not changing a lot due to a stable state and the great success of development during the previous periods.
Moreover, in other countries, both variables did not have a positive impact on the ISDI. This could be because the countries use budget assignations and/or investments from the EU structural funds not for sustainable development, but for other projects. These results could be useful for policy-makers, as they provide a roadmap for strategic planning on the way to sustainable development. Moreover, this could be because the relationships are not linear. Based on that, future research will cover the detailed investigation of the countries in which at least one of the independent variables has a negative impact on the level of sustainable development expressed through the ISDI.
Moreover, the theoretical background pointed out that different countries interpret and distribute investments in their own way. Based on the findings of the study and the analysis of the EU, it was found that, as a whole, a combination of assignation of budget and the EU structural funds can be expected to have a positive impact (and entail growth) on the coherence of five (Czech Republic, Denmark, Spain, Slovenia, and Austria) out of twenty-four countries. Therefore, it can be assumed that the theory takes the right approach that each country must match its investment sources with its capabilities and invest in relevant, sustainable areas.
In order to distinguish the relevant, sustainable areas, the results of the ISDI should be emphasized. In every analyzed area, the leading indicators representing the most significant changes, growth or decline, causing the biggest effect on a country’s ISDI, can be pointed out. From the economic perspective, the most significant positive change is in GDP—three countries had the most significant growth. However, the biggest negative change is in gross domestic expenditures on R&D—two countries had the most noticeable decline. From the social perspective, the most significant positive change is in fatal road accidents—twenty-two countries had a substantial decrease in this indicator. In addition, the most significant negative change is in live births—nine countries experienced a significant decline. From the environmental perspective, only one primary indicator can be named which caused positive changes—a share of renewable energy—in fourteen countries, this indicator can be identified as one of the leading indicators which affected the ISDI results the most.
To conclude the results of the research, it should be emphasized that the results may have been affected by the research limitations. Due to the lack of statistical data, i.e., completed time series, not all of the sustainable development indicators were employed. If more indicators were to be selected instead of the fifteen analyzed indicators (five indicators for each of three levels: Economic, social, and environmental), the results of the ISDI could vary and show different outcomes of the changes in the country’s growth. The unified index for the evaluation of a country’s sustainable development representing actual current results would be very welcome. This research, including another index, could be seen as a future research direction.
Another perspective for the further research direction could rise from the absence of a universal means of investment sources for sustainable development. The combination of assignation of budget and the EU structural funds shows a positive impact and entails growth of the coherence of five (Czech Republic, Denmark, Spain, Slovenia, and Austria) out of twenty-four countries. Different or extended combinations of the investment sources for sustainable development could lead to more optimistic results.
It is worth noting that the period of the research covers the years 2003–2017; therefore, an update for 2018 and 2019 could lead to different results.


