The Impact of Socio-Economic Factors on Sediment Load: A Case Study of the Yanhe River Watershed

Abstract
:1. Introduction
2. Data and Methods
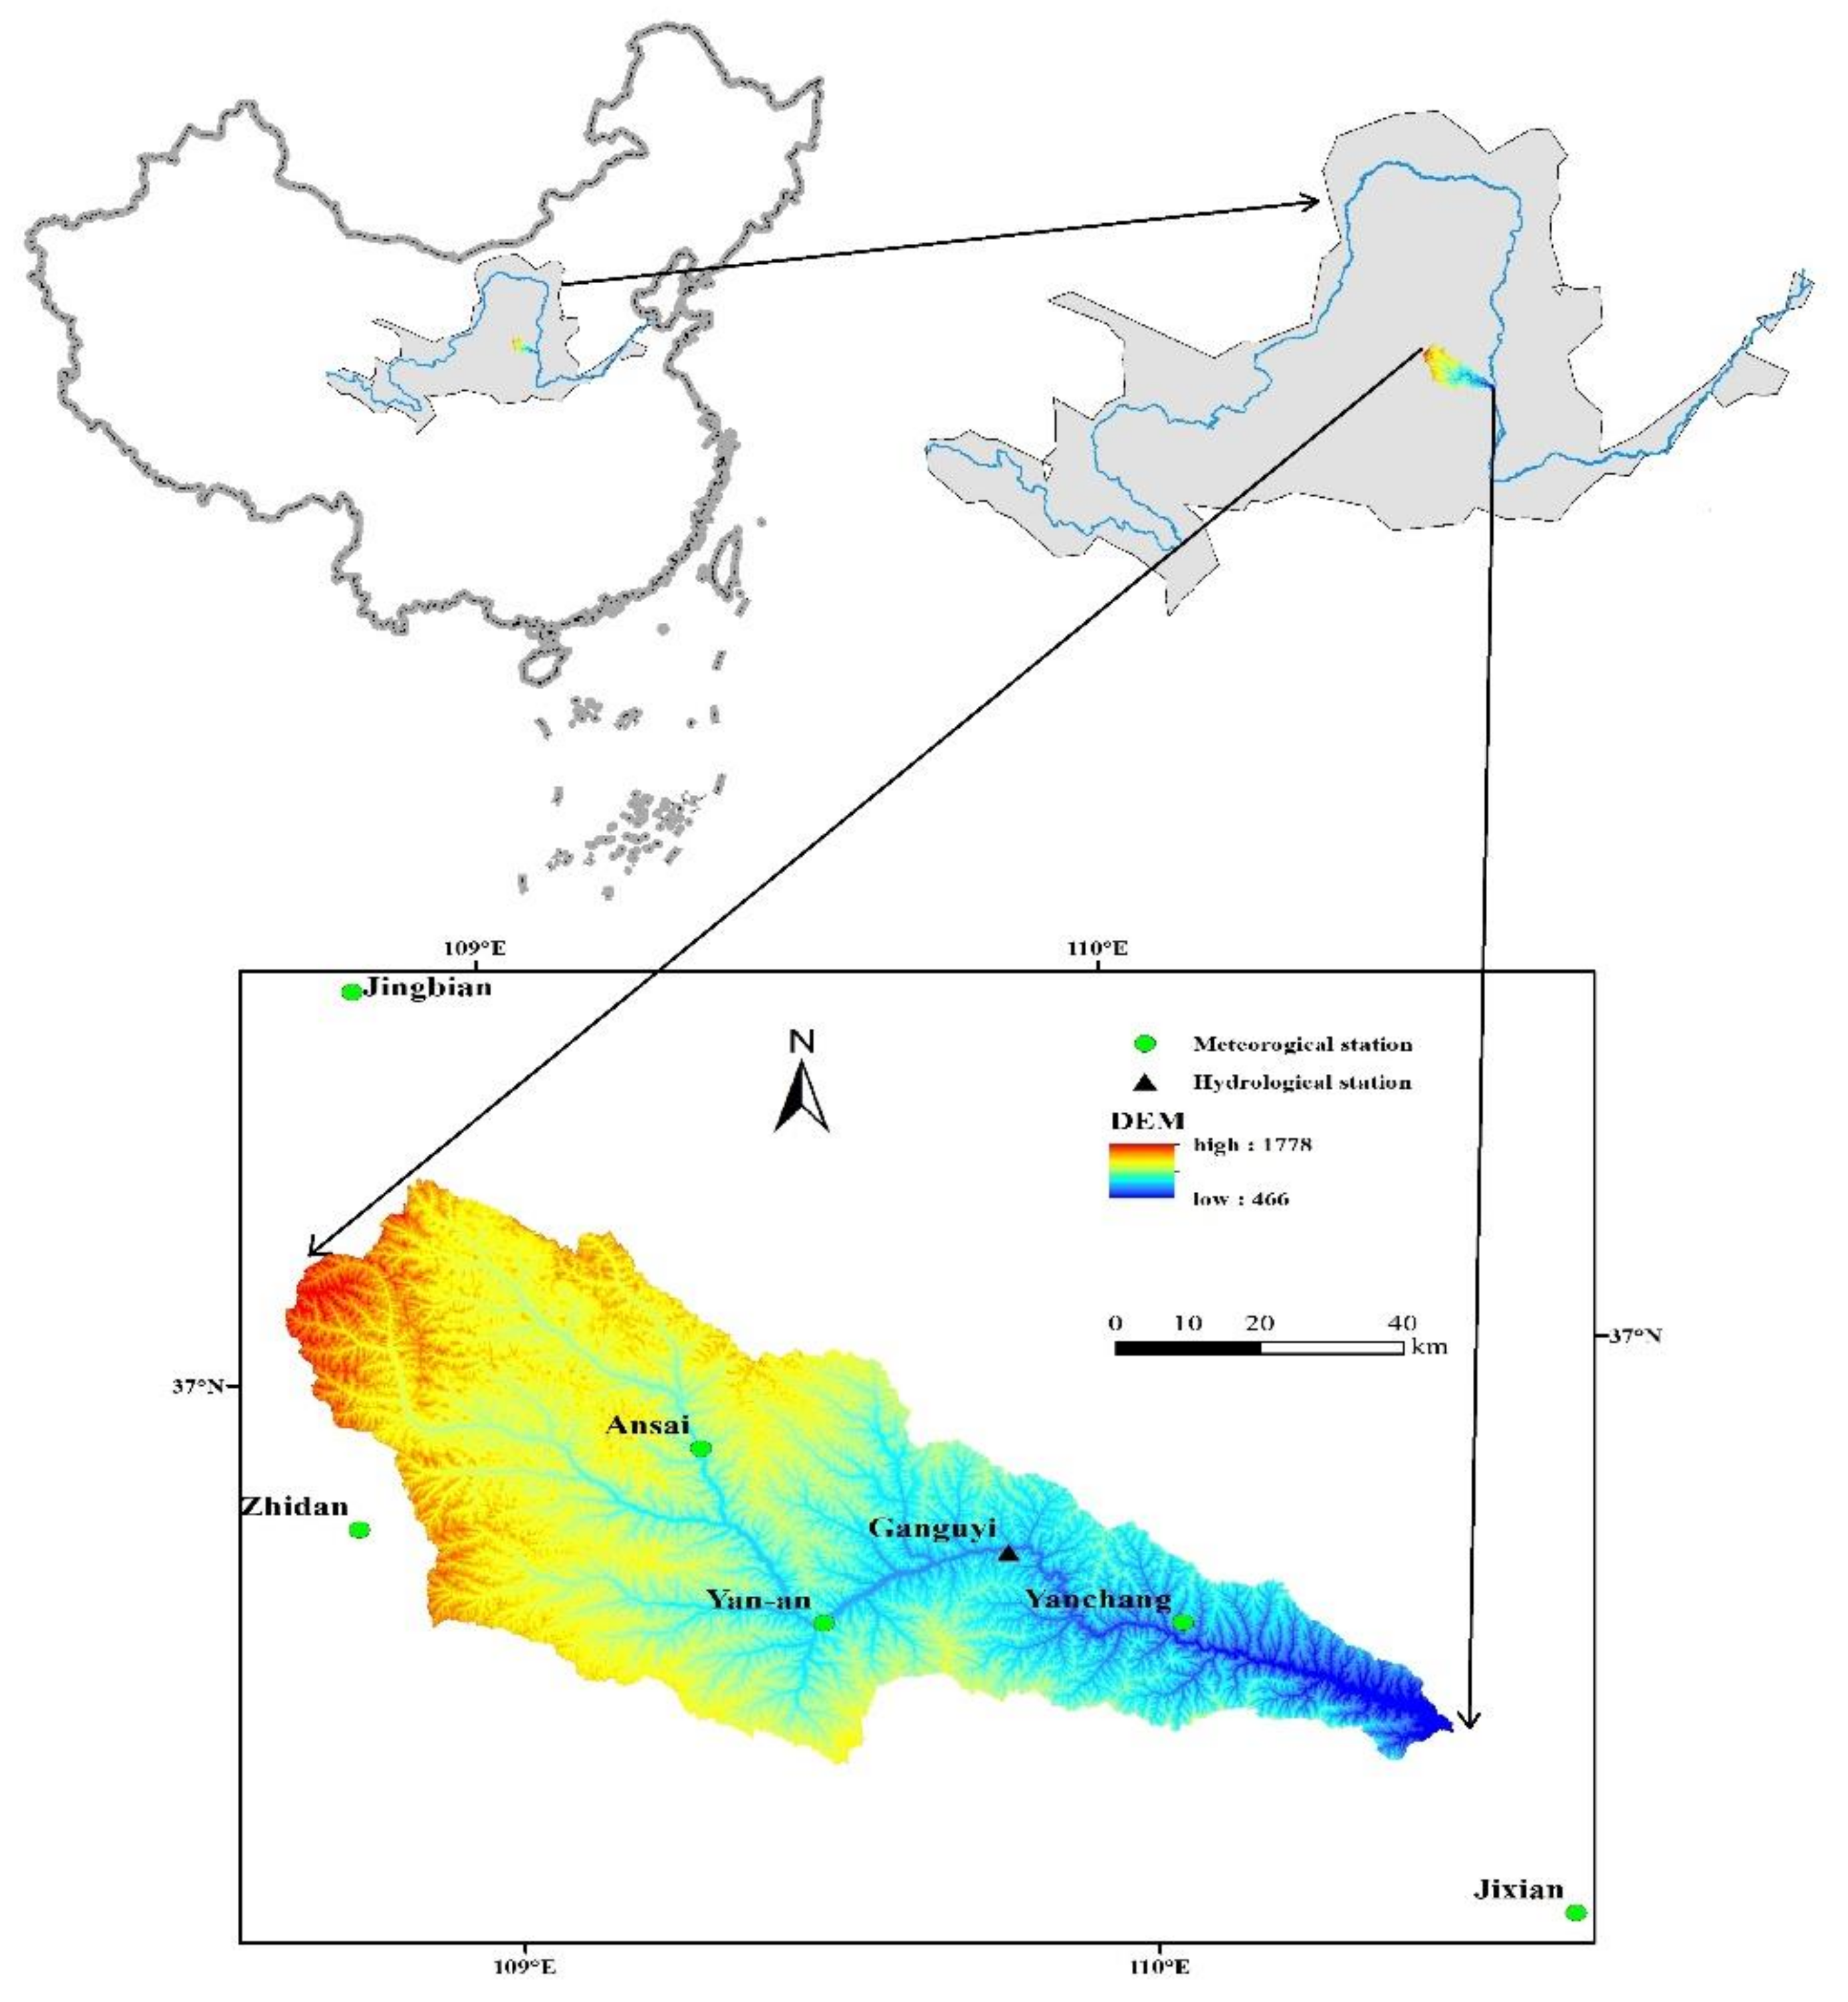
2.1. Study Area
2.2. Data
2.3. Method
2.3.1. Change-Point Analysis
2.3.2. Climate Change and Human Impact Identification Methods
3. Results
3.1. Changes in Runoff, Sediment Load, and Precipitation
3.2. Change-Point Analysis for Sediment Loads
3.3. Change in Maximum Sediment Concentration
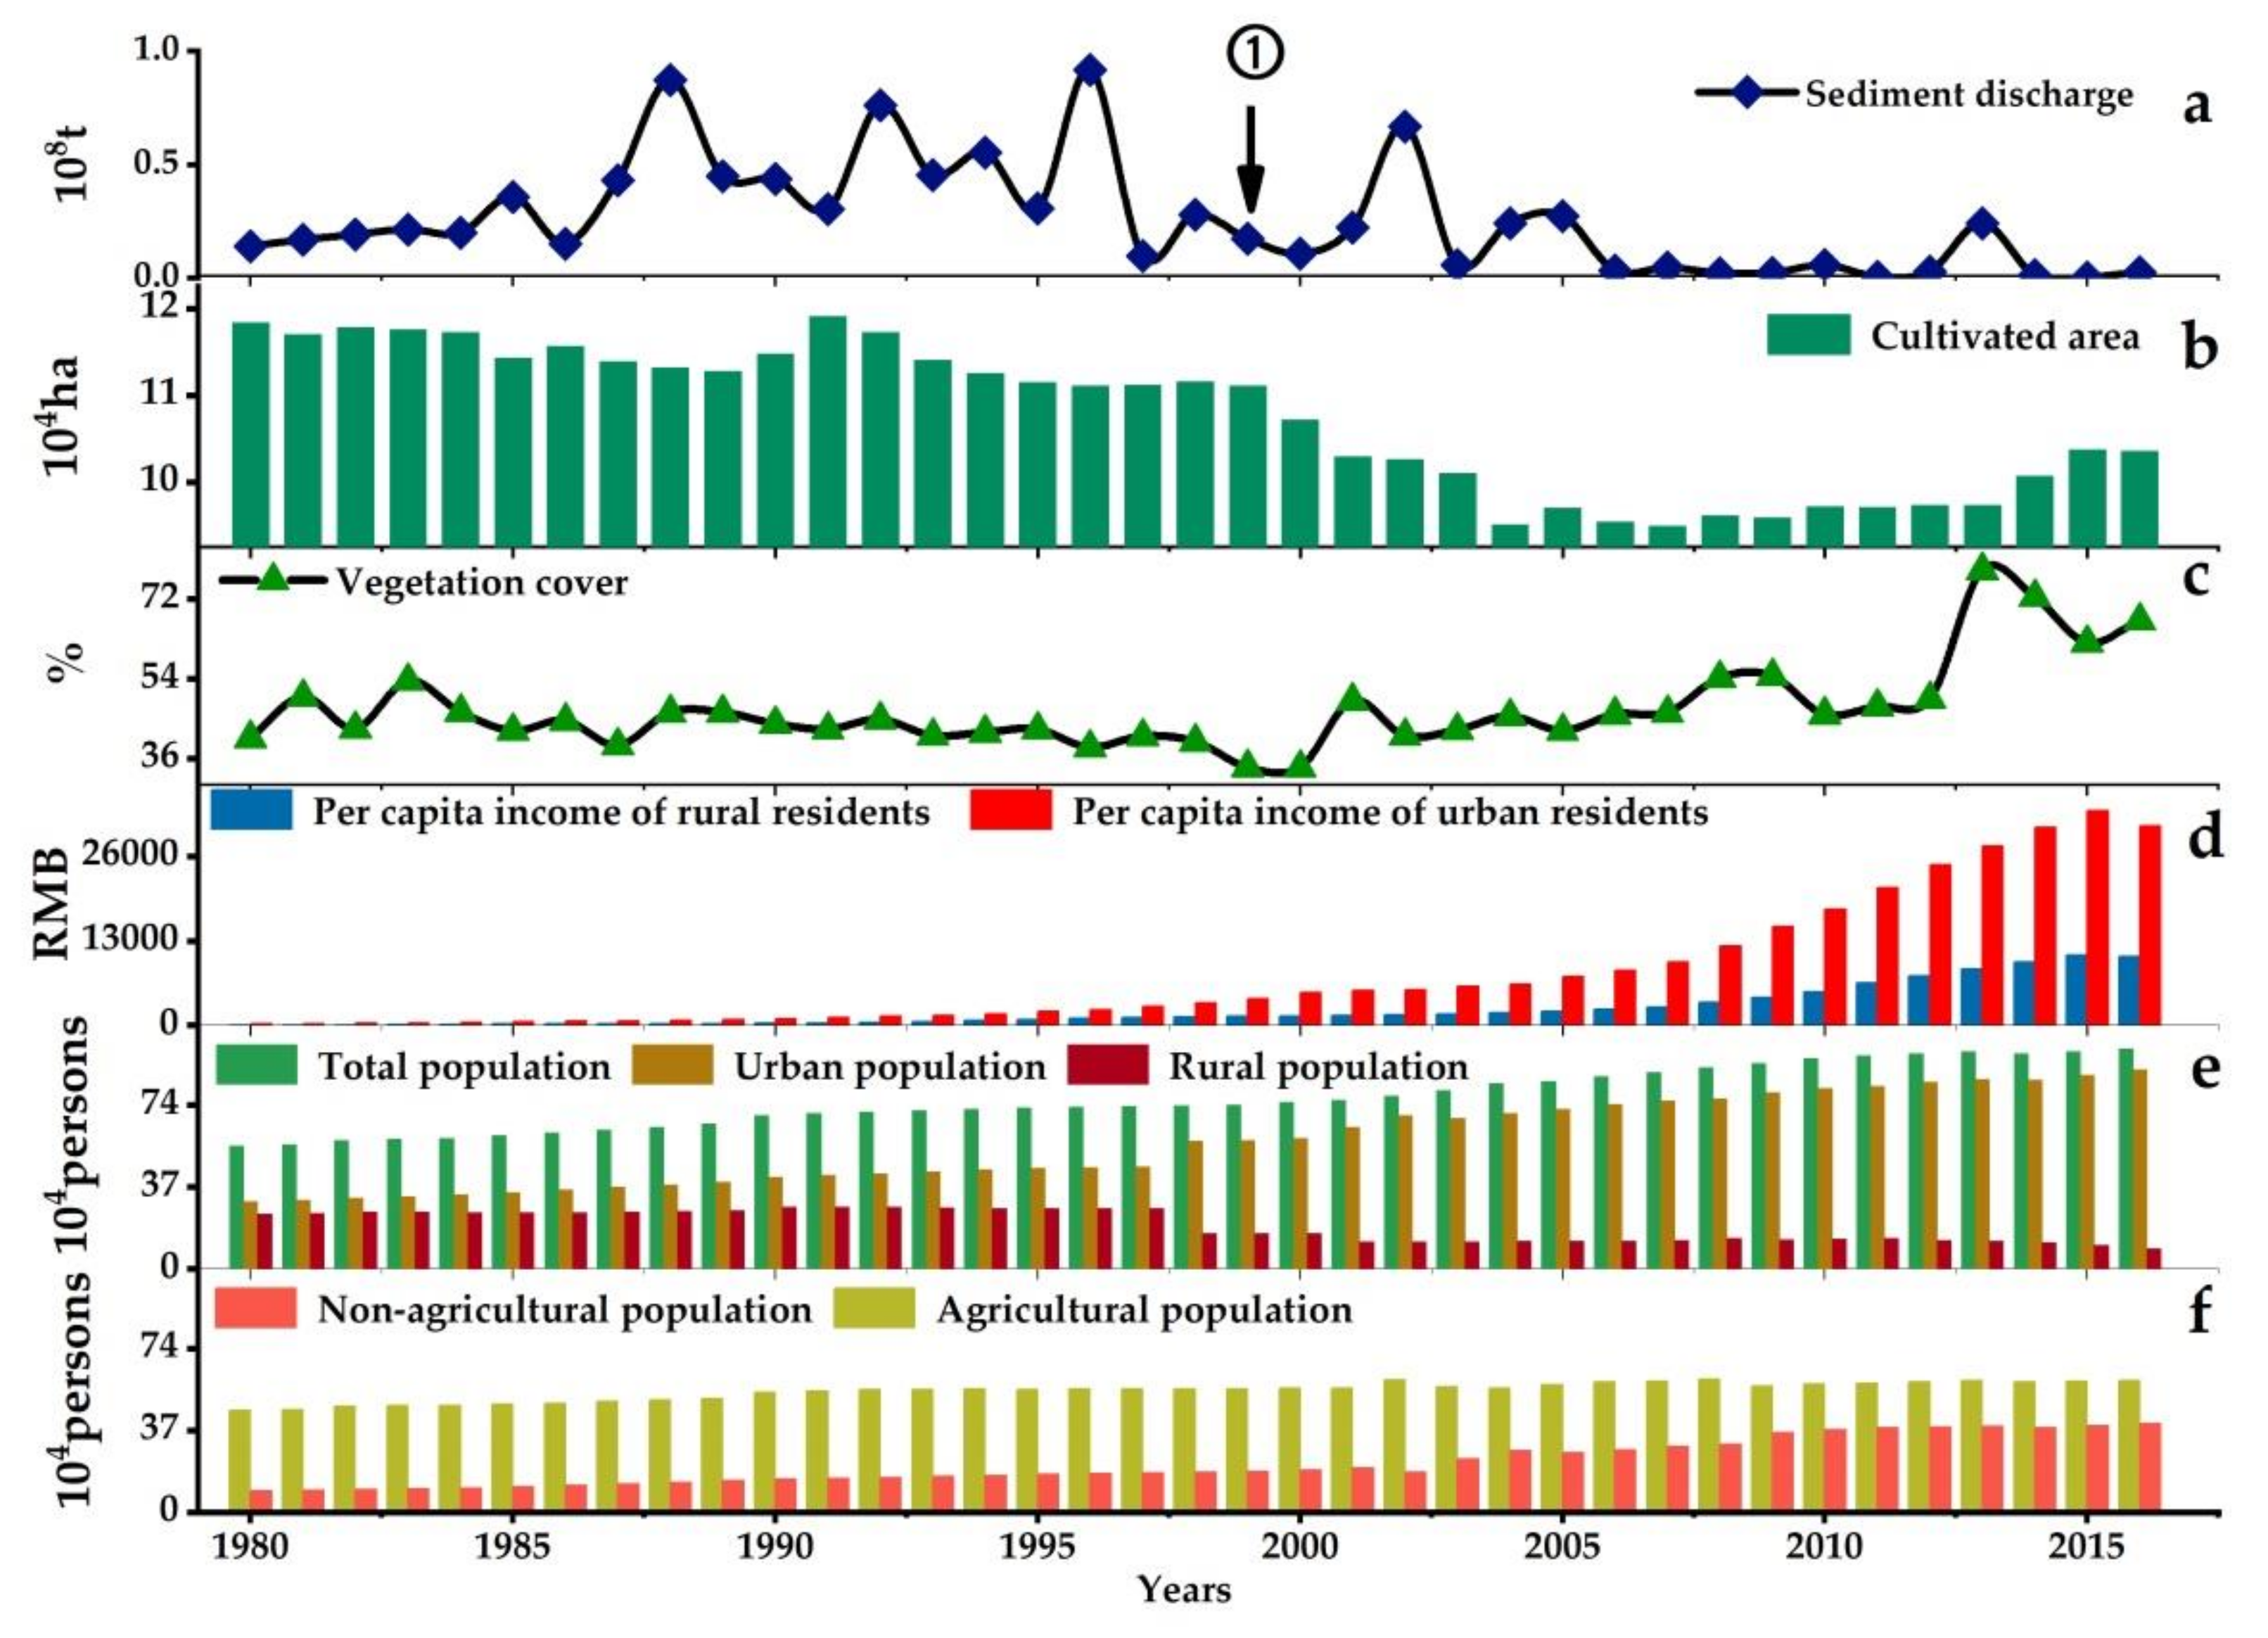
3.4. Changes in Socio-Economic Factors
3.4.1. The Grain for Green Project
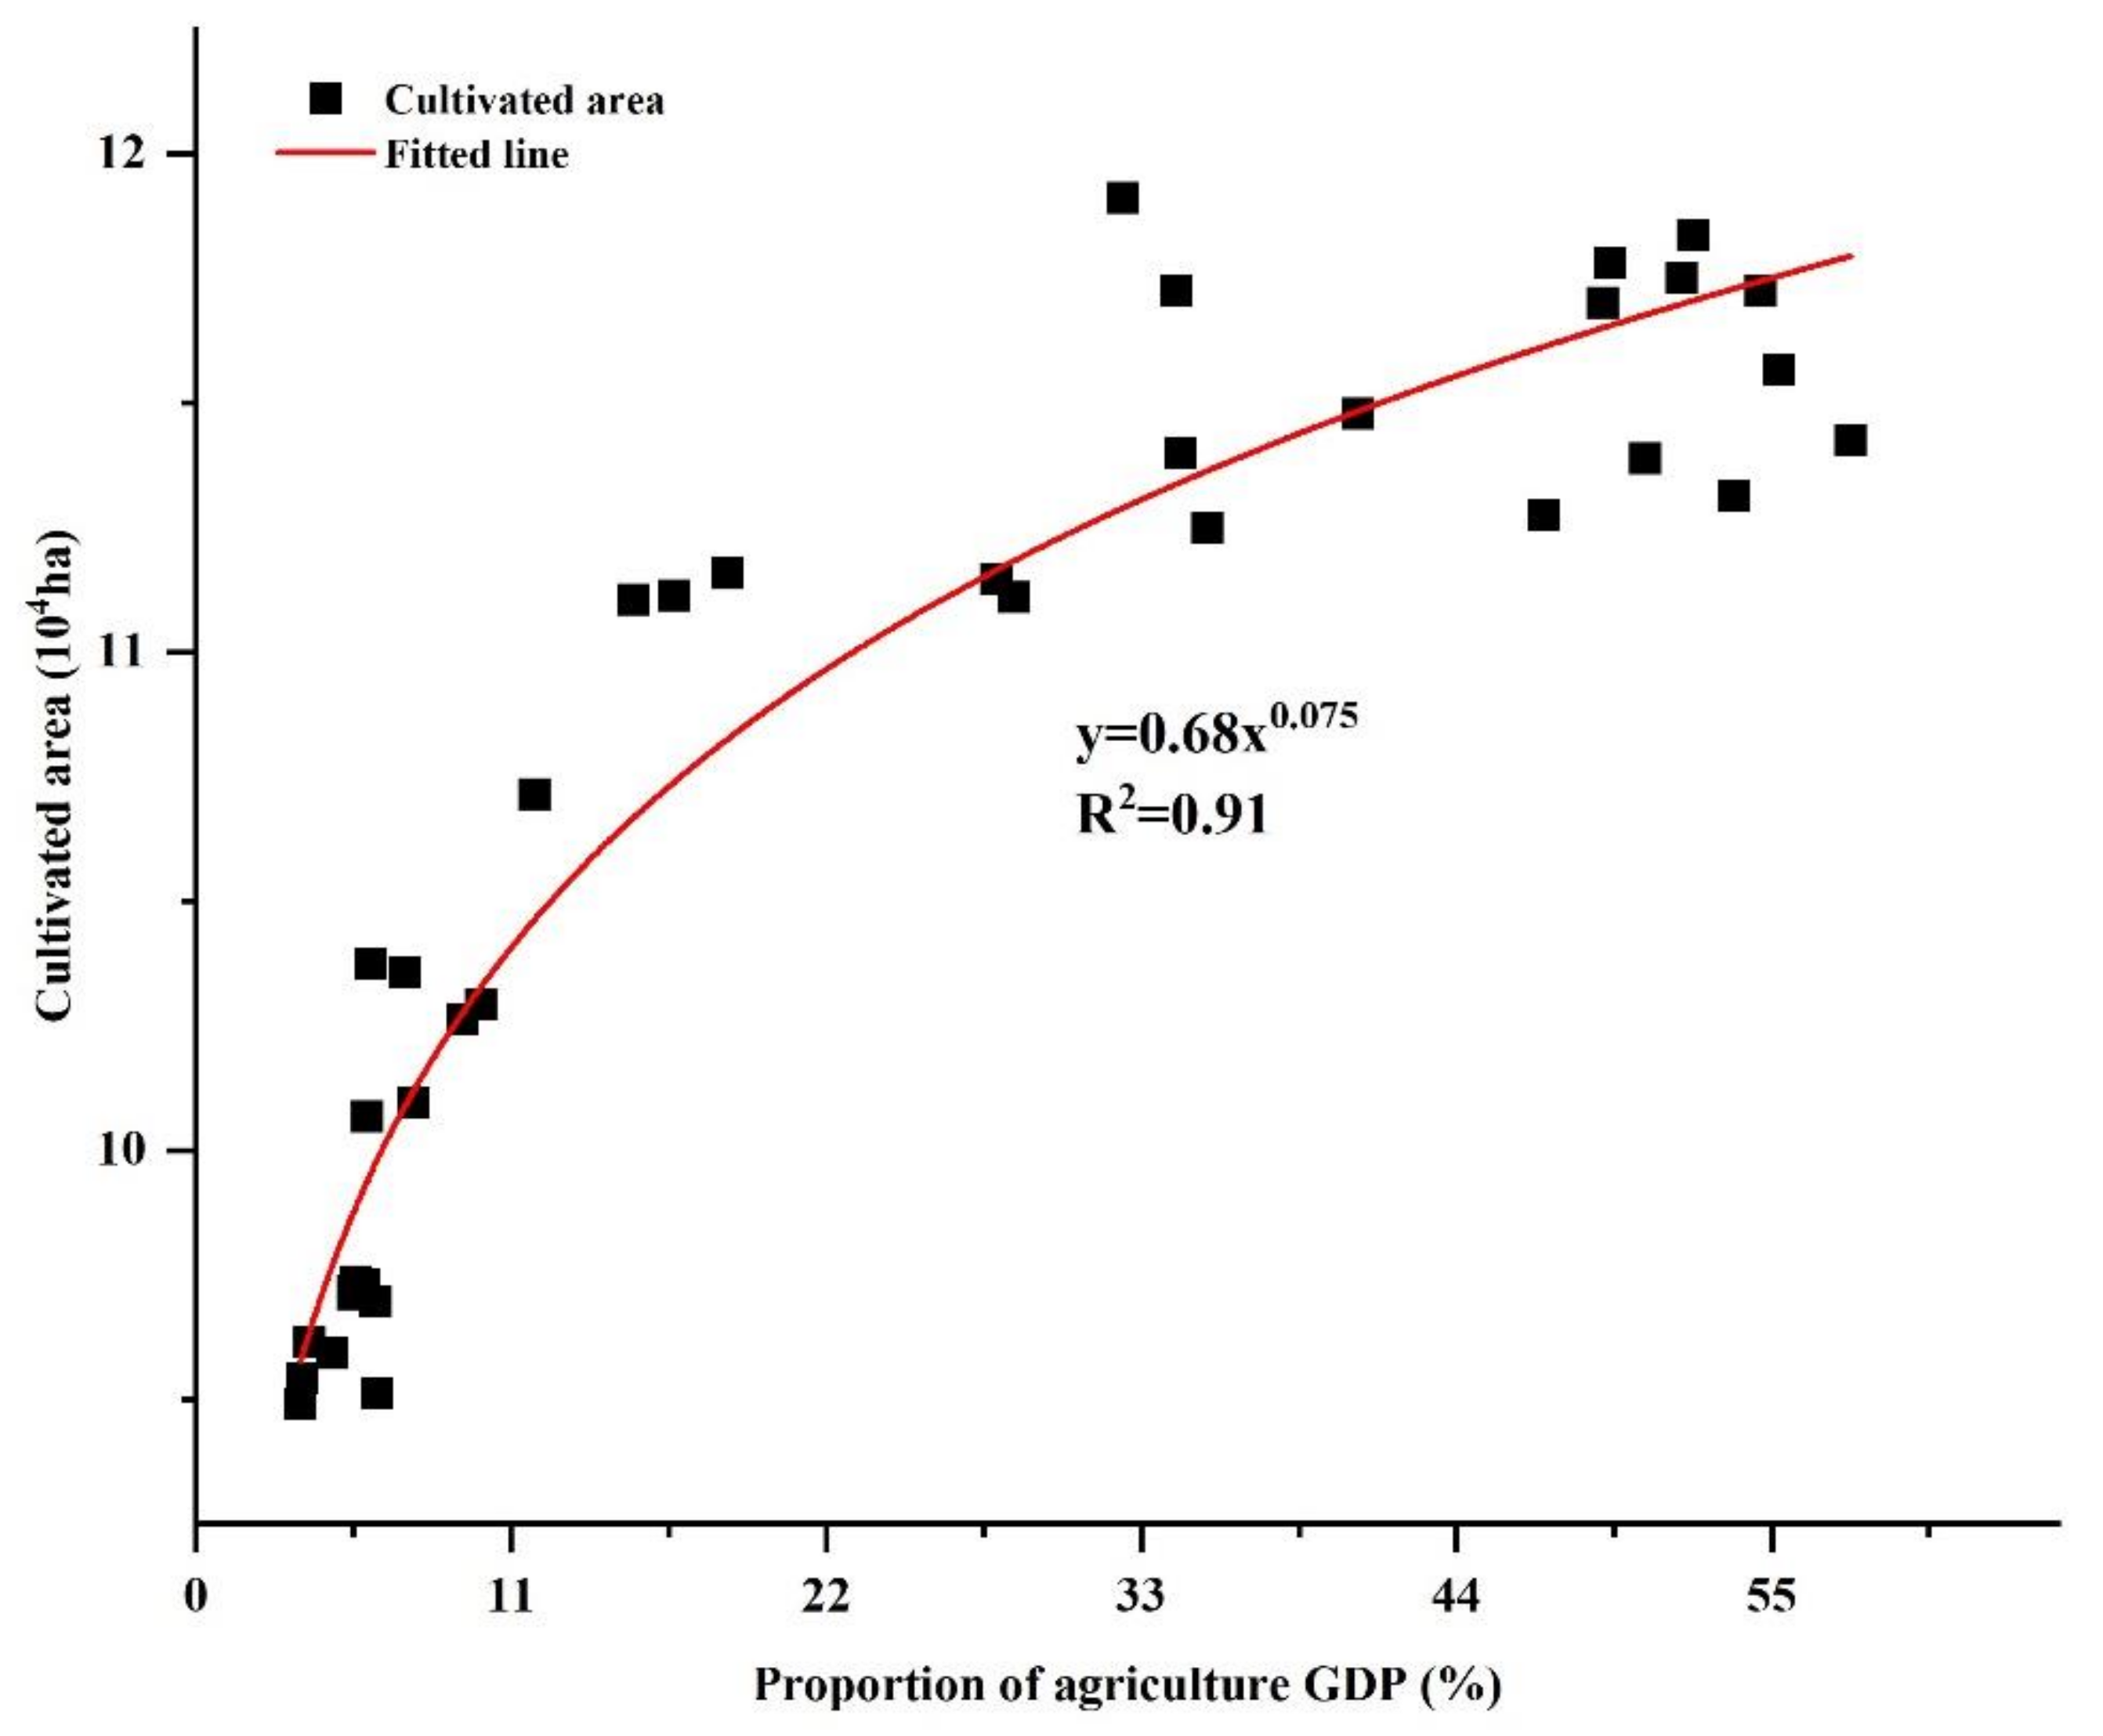
3.4.2. Economic Development and Industrial Restructuring
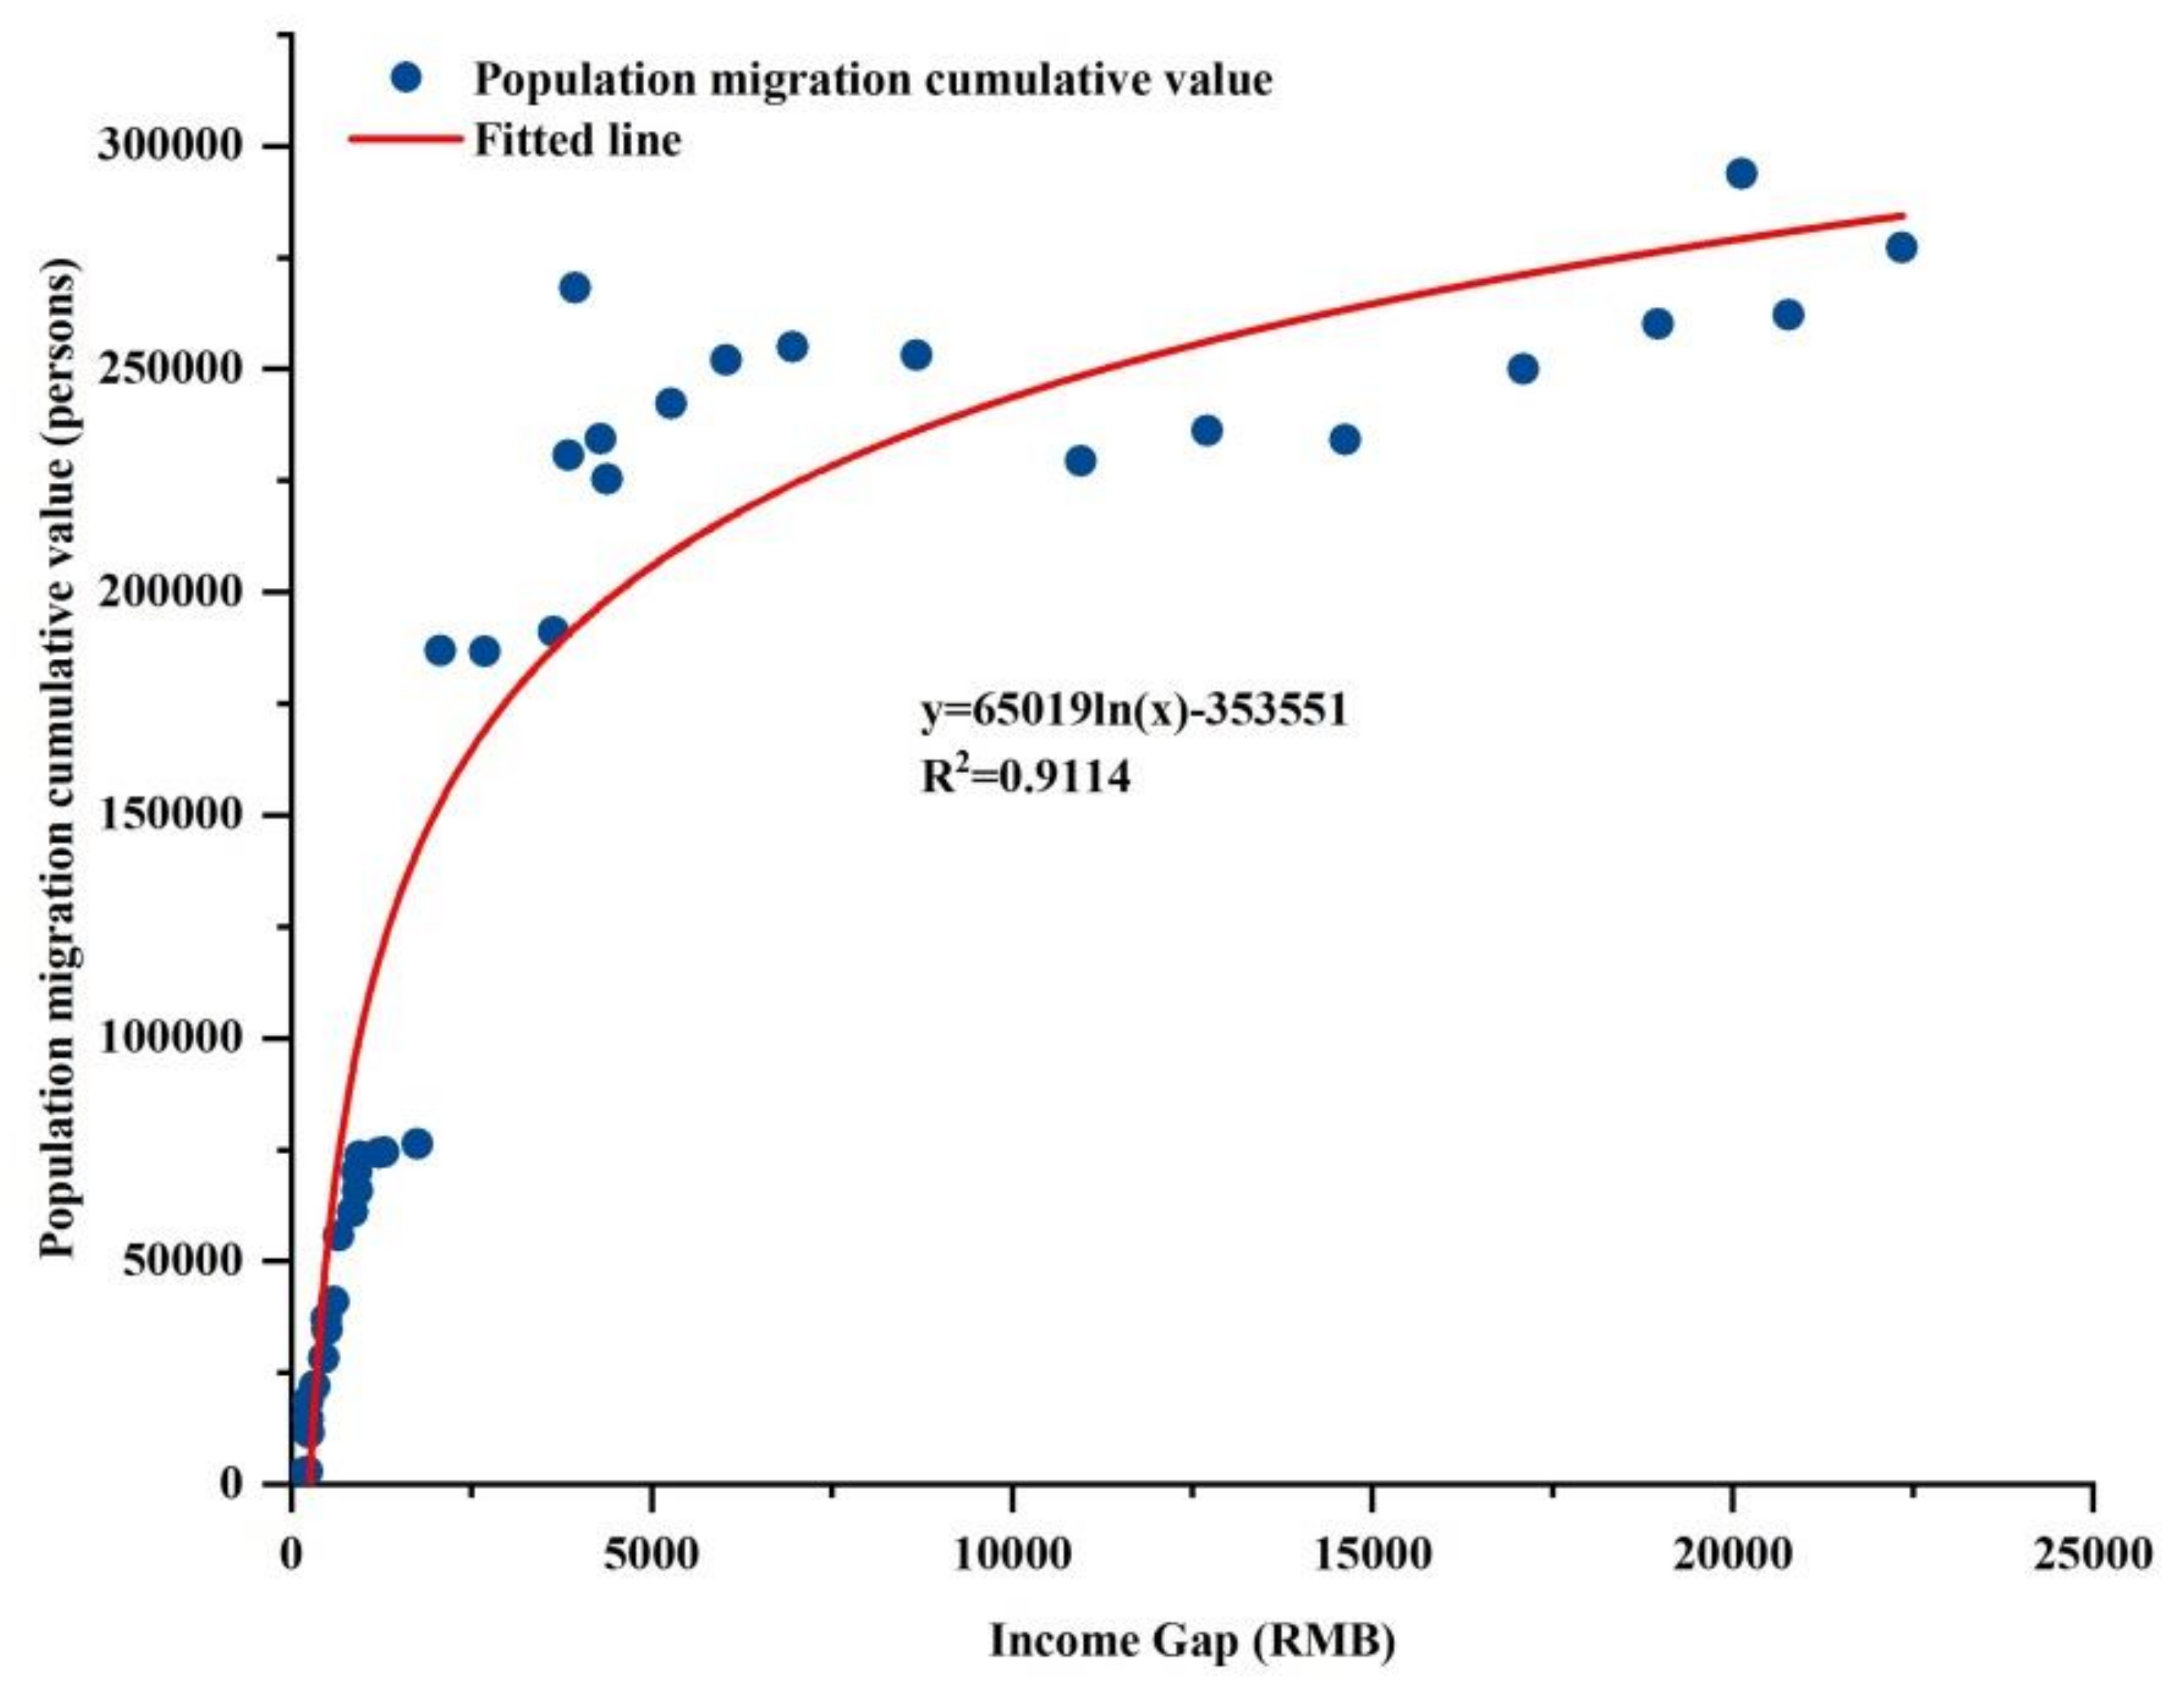
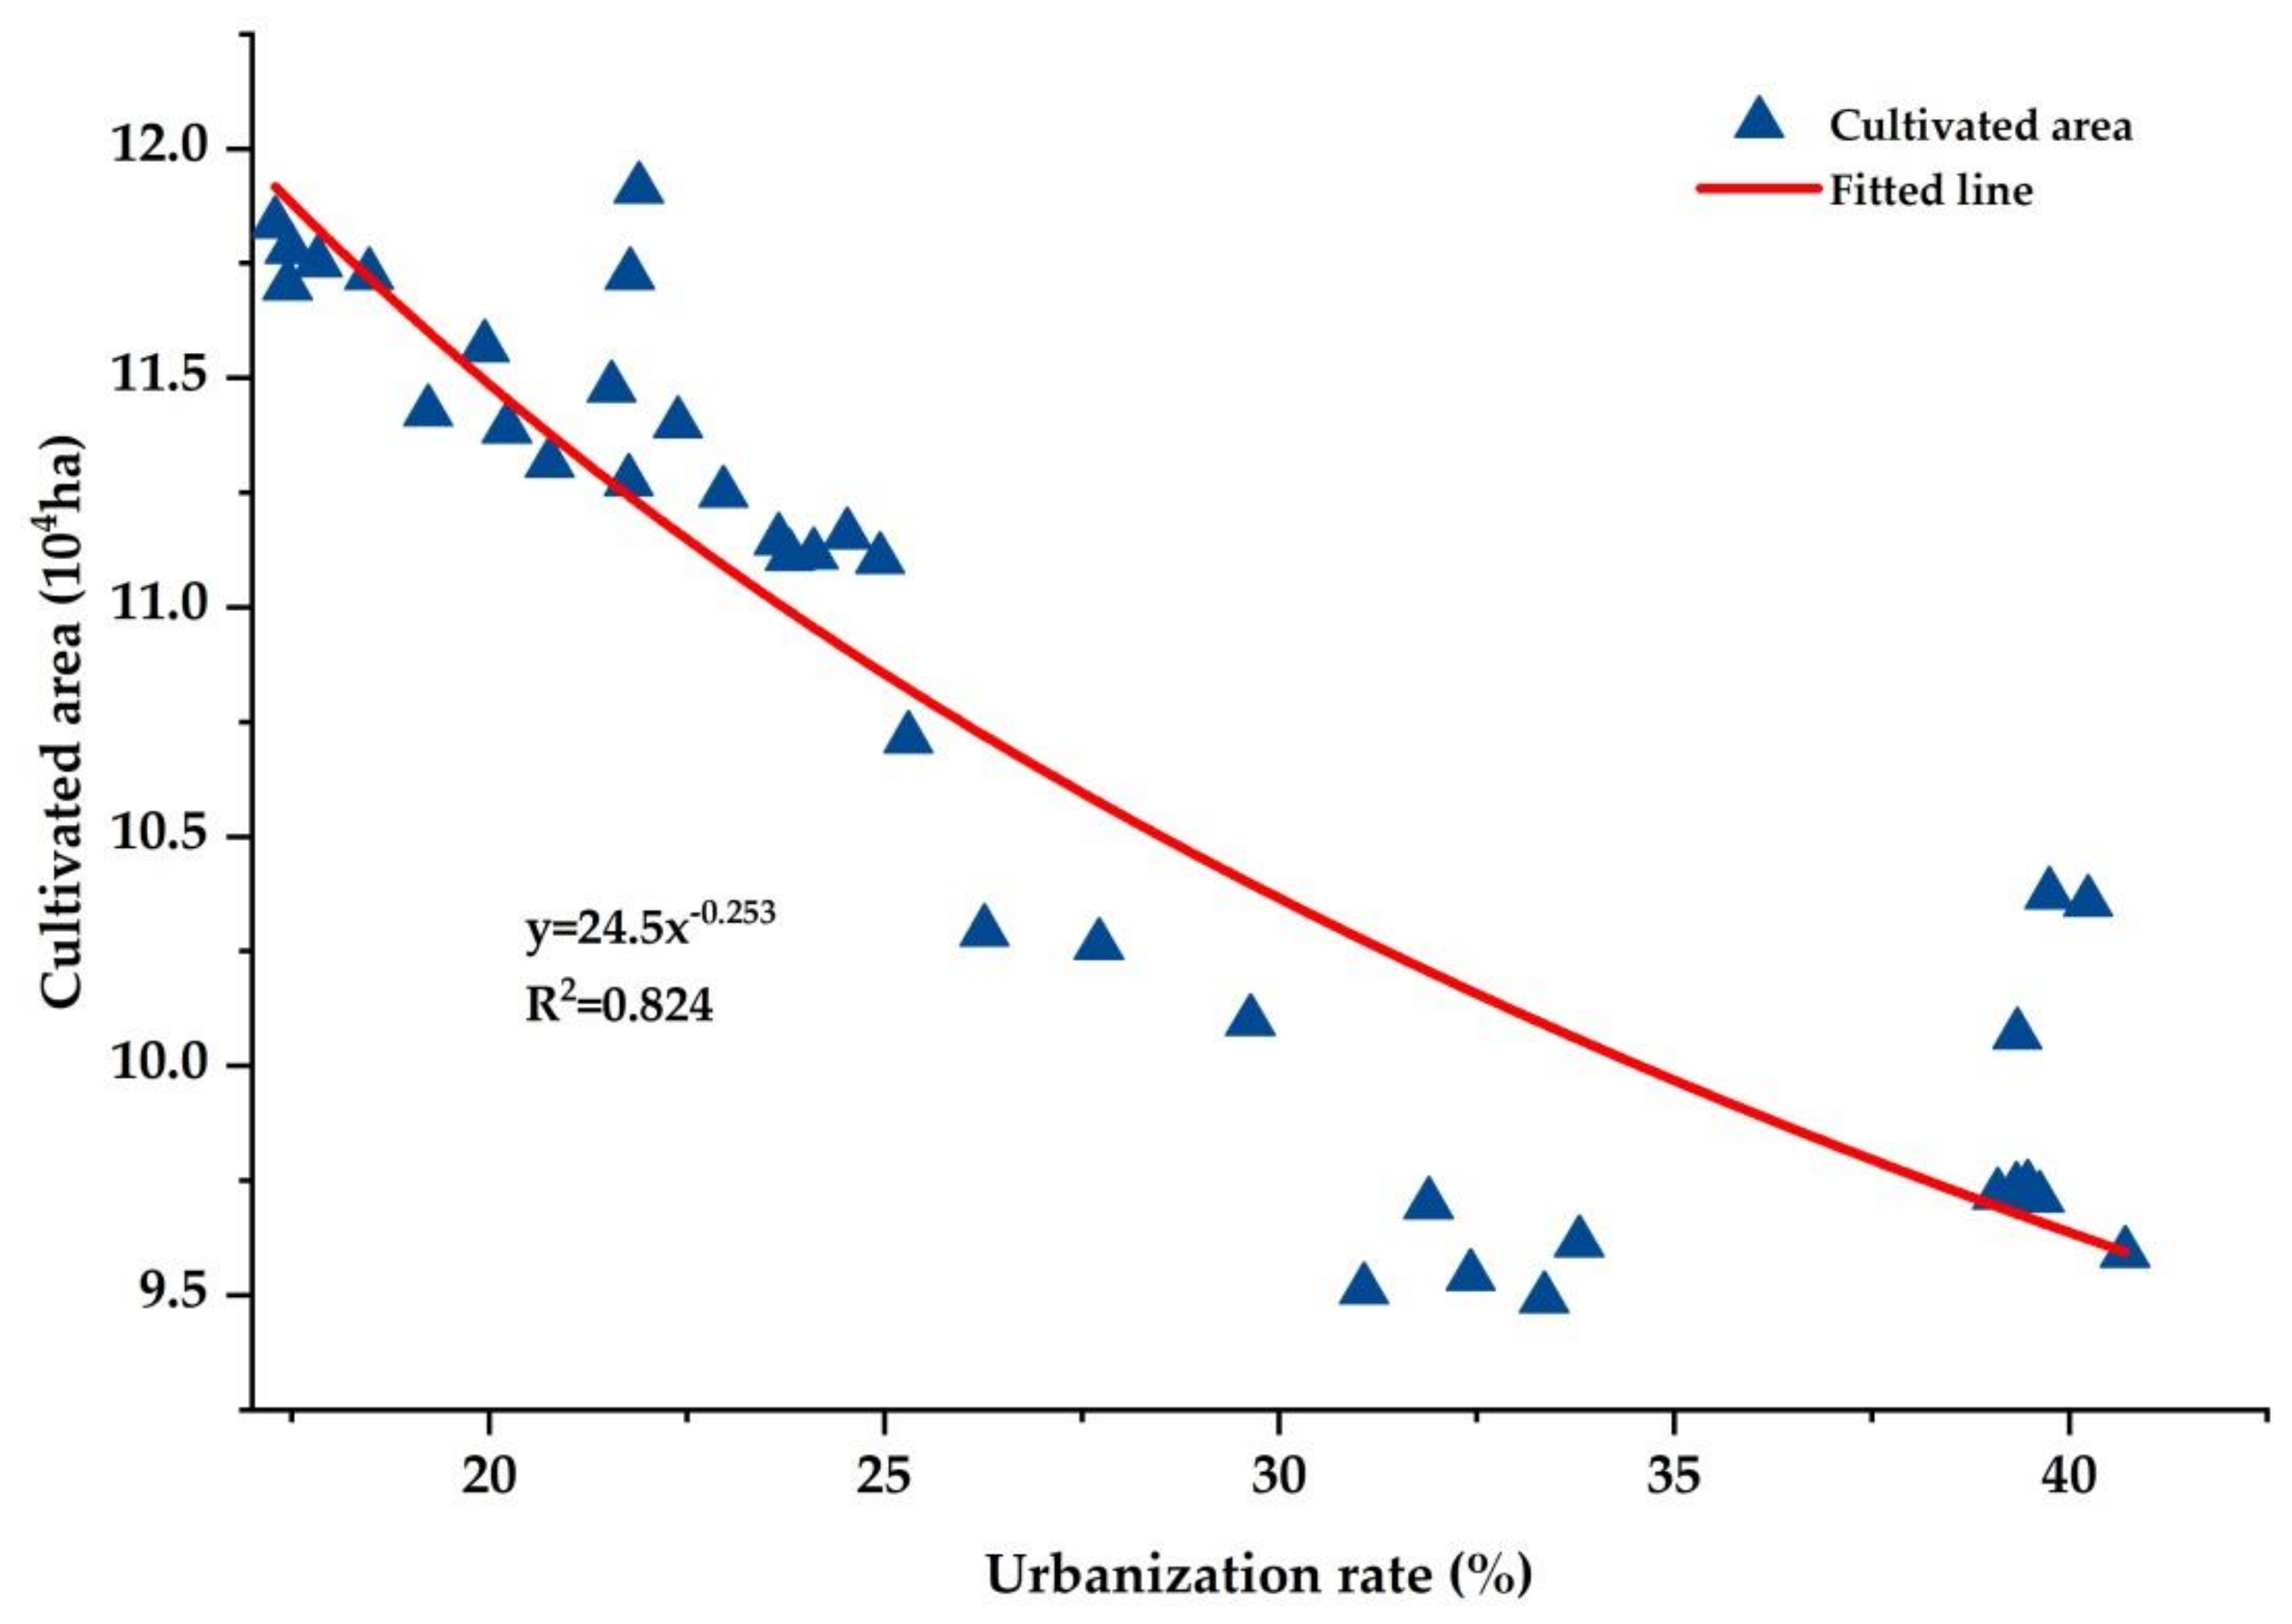
3.4.3. Migration and Urbanization
3.5. Relationship Between Socio-Economic Factors and Sediment Loads
4. Discussion
4.1. Effects of Precipitation and Runoff on Sediment Loads
4.2. Effect of Socio-Economic Factors
4.2.1. Policy Effects
4.2.2. Effect of Economic Development and Industrial Structure Adjustment
4.2.3. Effect of Population Migration and Urbanization
5. Conclusions
Author Contributions
Funding
Acknowledgments
Conflicts of Interest
References
- Downs, P.W.; Gregory, K.J. How Integrated is River Basin Management? Environ. Manag. 1991, 15, 299–309. [Google Scholar] [CrossRef]
- Roy, E.D.; Nguyen, N.T.; White, J.R. Changes in estuarine sediment phosphorus fractions during a large-scale Mississippi River diversion. Sci. Total Environ. 2017, 609, 1248–1257. [Google Scholar] [CrossRef]
- Vigiak, O.; Malagó, A.; Bouraoui, F. Modelling sediment fluxes in the Danube River Basin with SWAT. Sci. Total Environ. 2017, 599, 992–1012. [Google Scholar] [CrossRef]
- Zhao, Y.F.; Zou, X.Q.; Liu, Q.; Yao, Y.L. Assessing natural and anthropogenic influences on water discharge and sediment load in the Yangtze River, China. Sci. Total Environ. 2017, 607, 920–932. [Google Scholar] [CrossRef]
- Liu, J.J.; Zhou, Z.H.; Yan, Z.Q.; Gong, J.G.; Jia, Y.W.; Xu, C.Y.; Wang, H. A new approach to separating the impacts of climate change and multiple human activities on water cycle processes based on a distributed hydrological model. J. Hydrol. 2019, 578, 1–13. [Google Scholar] [CrossRef]
- Shi, P.; Zhang, Y.; Ren, Z.Q.; Yu, Y.; Li, P.; Gong, J.F. Land-use changes and check dams reducing runoff and sediment yield on the Loess Plateau of China. Sci. Total Environ. 2019, 664, 984–994. [Google Scholar] [CrossRef]
- Syvitski, J.P.M.; Vo¨ro¨smarty, C.J.; Kettner, A.J.; Green, P. Impact of humans on the flux of terrestrial sediment to the global coastal ocean. Science 2005, 308, 376–380. [Google Scholar] [CrossRef]
- Ukkola, A.M.; Prentice, I.C.; Keenan, T.F. Reduced streamflow in water-stressed climates consistent with CO2 effects on vegetation. Nat. Clim. Chang. 2015, 6, 75–78. [Google Scholar] [CrossRef] [Green Version]
- Walling, D.E.; Fang, D. Recent trends in the suspended sediment loads of the world’s rivers. Glob. Planet Chang. 2003, 39, 111–126. [Google Scholar] [CrossRef]
- Sun, P.; Wu, Y.; Gao, J.; Yao, Y.; Zhao, F. Shifts of sediment transport regime caused by ecological restoration in the Middle Yellow River Basin. Sci. Total Environ. 2020, 698, 134261. [Google Scholar] [CrossRef]
- Darby, S.E.; Hackney, C.R.; Leyland, J.; Kummu, M.; Lauri, H.; Parsons, D.R. Fluvial sediment supply to a mega-delta reduced by shifting tropical-cyclone activity. Nature 2016, 539, 276–279. [Google Scholar] [CrossRef] [Green Version]
- Evans, D.J.; Gibson, C.E.; Rossell, R.S. Sediment loads and sources in heavily modified Irish catchments: A move towards informed management strategies. Geomorphology 2006, 79, 93–113. [Google Scholar] [CrossRef]
- Trombetta, T.B.; Marques, W.C.; Guimarães, R.C.; Costi, J. An overview of longshore sediment transport on the Brazilian coast. Reg. Stud. Mar. Sci. 2020, 35, 101099. [Google Scholar] [CrossRef]
- Schmidt, A.H.; Gonzalez, V.S.; Bierman, P.R.; Neilson, T.B.; Rood, D.H. Agricultural land use doubled sediment loads in western China’s rivers. Anthropocene 2018, 21, 95–106. [Google Scholar] [CrossRef] [Green Version]
- Yamamoto, T.; Malingin, M.; Pepino, M.M.; Yoshikai, M.; Campos, W.; Miyajima, T.; Watanabe, A. Assessment of coastal turbidity improvement potential by terrigenous sediment load reduction and its implications on seagrass inhabitable area in Banate Bay, central Philippines. Sci. Total Environ. 2019, 656, 1386–1400. [Google Scholar] [CrossRef]
- Mathers, K.L.; Rice, S.P.; Wood, P.J. Temporal effects of enhanced fine sediment loading on macroinvertebrate community structure and functional traits. Sci. Total Environ. 2017, 599, 513–522. [Google Scholar] [CrossRef] [Green Version]
- Gray, A.B.; Pasternack, G.B.; Watson, E.B.; Warrick, J.A.; Goñi, M.A. Effects of antecedent hydrologic conditions, time dependence, and climate cycles on the suspended sediment load of the Salinas River, California. J. Hydrol. 2015, 525, 632–649. [Google Scholar] [CrossRef] [Green Version]
- Bi, N.; Wang, H.; Yang, Z. Recent changes in the erosion–accretion patterns of the active Huanghe(Yellow River) delta lobe caused by human activities. Cont. Shelf Res. 2014, 90, 70–78. [Google Scholar] [CrossRef]
- Jun Peng, S.C.; Ping, D. Temporal variation of sediment load in the Yellow Riverbasin, China, and its impacts on the lower reaches and the river delta. Catena 2010, 83, 135–147. [Google Scholar] [CrossRef]
- Buendia, C.; Bussi, G.; Tuset, J.; Vericat, D.; Sabater, S. Effects of afforestation on runoff and sediment load in an upland Mediterranean catchment. Sci. Total Environ. 2016, 540, 144–157. [Google Scholar] [CrossRef]
- Liu, C.; Walling, D.E.; He, Y. Review: The International Sediment Initiative case studies of sediment problems in river basins and their management. Int. J. Sediment Res. 2018, 33, 216–219. [Google Scholar] [CrossRef]
- Naden, P.S.; Murphy, J.F.; Old, G.H.; Newman, J.; Scarlett, P. Understanding the controls on deposited fine sediment in the streams of agricultural catchments. Sci. Total Environ. 2016, 547, 366–381. [Google Scholar] [CrossRef] [Green Version]
- Tuset, J.; Vericat, D.; Batalla, R.J. Rainfall, runoff and sediment transport in a Mediterranean mountainous catchment. Sci. Total Environ. 2016, 540, 114–132. [Google Scholar] [CrossRef]
- Zhao, G.J.; Kondolf, G.M.; Mu, X. Sediment yield reduction associated with land use changes and check dams in a catchment of the Loess Plateau, China. Catena 2016, 148, 1–17. [Google Scholar] [CrossRef]
- Jin, Z.; Cui, B.; Song, Y.; Shi, W.; Wang, K.; Wang, Y. How many check dams do we need to build on the Loess Plateau. Environ. Sci. Technol. 2012, 46, 8527–8528. [Google Scholar] [CrossRef]
- Huang, L.; Li, X.; Fang, H.; Yin, D.; Si, Y.; Wei, J. Balancing social, economic and ecological benefits of reservoir operation during the flood season: A case study of the Three Gorges Project, China. J. Hydrol. 2019, 572, 422–434. [Google Scholar] [CrossRef]
- Deng, L.; Shangguan, Z.P.; Sweeney, S. "Grain for Green" driven land use change and carbon sequestration on the Loess Plateau, China. Sci. Rep. 2014, 4, 7039. [Google Scholar] [CrossRef]
- Zhou, H.; Van Rompaey, A.; Wang, J.A. Detecting the impact of the “Grain for Green” program on the mean annual vegetation cover in the Shaanxi province, China using SPOT-VGT NDVI data. Land Use Policy 2009, 26, 954–960. [Google Scholar] [CrossRef]
- Yu, Y.; Wang, H.; Shi, X.; Ran, X.; Cui, T. New discharge regime of the Huanghe (Yellow River): Causes and implications. Cont. Shelf Res. 2013, 69, 62–72. [Google Scholar] [CrossRef]
- Zhang, C.; Liu, G.; Xue, S.; Wang, G. Changes in rhizospheric microbial community structure and function during the natural recovery of abandoned cropland onthe Loess Plateau. Ecol. Eng. 2015, 75, 161–171. [Google Scholar] [CrossRef]
- Chen, Y.; Wang, K.; Lin, Y.; Shi, W.; Song, Y.; He, X. Balancing green and grain trade. Nat. Geosci. 2015, 8, 739–741. [Google Scholar] [CrossRef]
- Kondolf, G.M.; Schmitt, R.J.P.; Carling, P.; Darby, S. Changing sediment budget of the Mekong: Cumulative threats and management strategies for a large river basin. Sci. Total Environ. 2018, 625, 114–134. [Google Scholar] [CrossRef] [PubMed] [Green Version]
- Hu, J.F.; Zhao, G.J.; Mu, X.M.; Tian, P.; Gao, P.; Sun, W.Y. Quantifying the impacts of human activities on runoff and sediment load changes in a Loess Plateau catchment, China. J. Soil Sediment 2019, 19, 3866–3880. [Google Scholar] [CrossRef]
- Li, P.; Xu, G.; Lu, K.; Zhang, X.; Shi, P. Runoff change and sediment source during rainstorms in an ecologically constructed watershed on the Loess Plateau, China. Sci. Total Environ. 2019, 664, 968–974. [Google Scholar] [CrossRef]
- Yang, X.N.; Sun, W.Y.; Li, P.F.; Mu, X.M.; Gao, P.; Zhao, G.J. Reduced sediment transport in the Chinese Loess Plateau due to climate change and human activities. Sci. Total Environ. 2018, 642, 591–600. [Google Scholar] [CrossRef]
- Sklenicka, P.; Zouhar, J.; Molnarova, K.J.; Vlasak, J.; Kottova, B. Trends of soil degradation: Does the socio-economic status of land owners and land users matter? Land Use Policy 2019, 1–8. [Google Scholar] [CrossRef]
- Vávra, J.; Duží, B.; Lapka, M.; Cudlínová, E.; Rikoon, J.S. Socio-economic context of soil erosion: A comparative local stakeholders’ case study from traditional agricultural region in the Czech Republic. Land Use Policy 2019, 84, 127–137. [Google Scholar] [CrossRef]
- Whitehead, P.G.; Jin, L.; Macadam, I.; Janes, T.; Sarkar, S. Modelling impacts of climate change and socio-economic change on the Ganga, Brahmaputra, Meghna, Hooghly and Mahanadi river systems in India and Bangladesh. Sci. Total Environ. 2018, 636, 1362–1372. [Google Scholar] [CrossRef] [Green Version]
- Liu, J.; Li, Z.; Zhang, X.; Li, R.; Liu, X.; Zhang, H. Responses of vegetation cover to the Grain for Green Program and their driving forces in the He-Long region of the middle reaches of the Yellow River. J. Arid Land. 2013, 5, 511–520. [Google Scholar] [CrossRef] [Green Version]
- Pettitt, A.N. A non-parametric approach to the change-point problem. J. R. Stat. Soc. 1979, 28, 126–135. [Google Scholar] [CrossRef]
- Karabrk, M.C.; Kahya, E.; Kömüşçü, A.U. Analysis of Turkish precipitation data: homogeneity and the Southern Oscillation forcings on frequency distributions. Hydrol. Process. 2007, 21, 3202–3210. [Google Scholar] [CrossRef]
- Gao, P.; Mu, X.M.; Wang, F.; Li, R. Changes in streamflow and sediment discharge and the response to human activities in the middle reaches of the Yellow River. Hydrol. Earth Syst. Sci. 2011, 15, 1–10. [Google Scholar] [CrossRef] [Green Version]
- Zuo, D.P.; Xu, Z.X.; Wu, W.; Zhao, J.; Zhao, F.F. Identification of streamflow response to climate change and human activities in the Wei River Basin. Water Resour. Manag. 2014, 28, 833–851. [Google Scholar] [CrossRef]
- Gao, P.; Deng, J.C.; Chai, X.K.; Mu, X.M. Dynamic sediment discharge in the Hekou–Longmen region of Yellow River and soil and water conservation implications. Sci. Total Environ. 2017, 578, 56–66. [Google Scholar] [CrossRef] [PubMed]
- Li, Z.W.; Xu, X.L.; Yu, B.F.; Xu, C.H.; Liu, M.X. Quantifying the impacts of climate and human activities on water and sediment discharge in a karst region of southwest China. J. Hydrol. 2016, 542, 836–849. [Google Scholar] [CrossRef]
- Wu, J.W.; Miao, C.Y.; Zhang, X.M.; Duan, Q.Y. Detecting the quantitative hydrological response to changes in climate and human activities. Sci. Total Environ. 2017, 586, 328–337. [Google Scholar] [CrossRef]
- Liu, C.A.; Li, F.R.; Zhou, L.M.; Zhang, R.H.; Yu, J.; Lin, S.L. Effect of organic manure and fertilizer on soil water and crop yields in newly-built terraces with loess soils in a semi-arid environment. Agr. Water Manag. 2013, 117, 123–132. [Google Scholar] [CrossRef]
- Xiao, J. Satellite evidence for significant biophysical consequences of the “Grain for Green” Program on the Loess Plateau in China. J. Geophys. Res. Biogeo. 2014, 119, 2261–2275. [Google Scholar] [CrossRef] [Green Version]
- Liu, W.M.; Luk, M.K.R. Reform and opening up: Way to the sustainable and harmonious development of air transport in China. Transp. Policy 2009, 16, 215–223. [Google Scholar] [CrossRef]
- Cao, Y.G.; Zhou, W.; Qiao, L.Y.; Wang, J.X. Analysis on urban construction land changes and driving forces in Qinghai Province, 2000-2008. J. Arid Land Resour. Environ. 2013, 27, 40–46. (In Chinese) [Google Scholar]
- Naik, P.K.; Jay, D.A. Distinguishing human and climate influences on the ColumbiaRiver_ changes in mean flow and sediment transport. J. Hydrol. 2011, 404, 259–277. [Google Scholar] [CrossRef]
- Wei, Y.; Jiao, J.Y.; Zhao, G.J.; Zhao, H.; He, Z.; Mu, X.M. Spatial-temporal variation and pe-riodic change in streamflow and suspended sediment discharge along the main-stream of the Yellow River during 1950–2013. Catena. 2016, 140, 105–115. [Google Scholar] [CrossRef] [Green Version]
- Zhao, G.J.; Tian, P.; Mu, X.; Jiao, J.; Wang, F.; Gao, P. Quantifying the impact ofclimate variability and human activities on streamflow in the middle reaches of theYellow River basin, China. J. Hydrol. 2014, 519, 387–398. [Google Scholar] [CrossRef]
- Wang, S.; Fu, B.J.; Liang, W.; Liu, Y.; Wang, Y. Driving forces of changes in the water and sediment relationship in the Yellow River. Sci. Total Environ. 2017, 576, 453–461. [Google Scholar] [CrossRef]
- Liang, W.; Bai, D.; Wang, F.; Fu, B. Quantifying the impacts of climate change and ecological restoration on streamflow changes based on a Budyko hydrological model in China’s Loess Plateau. Water Resour. Res. 2015, 51, 6500–6519. [Google Scholar] [CrossRef]
- Xu, J.X. Variation in annual runoff of the Wudinghe River as influenced by climate change and human activity. Quatern. Int. 2011, 244, 230–237. [Google Scholar] [CrossRef]
- Huang, M.; Zhang, L.; Gallichand, J. Runoff responses to afforestation in a watershed of the Loess Plateau, China. Hydrol. Process. 2003, 17, 2599–2609. [Google Scholar] [CrossRef]
- Zuo, D.P.; Xu, Z.X.; Yao, W.Y.; Jin, S.Y. Assessing the effects of changes in land use and climate on runoff and sediment yields from a watershed in the Loess Plateau of China. Sci. Total Environ. 2016, 544, 238–250. [Google Scholar] [CrossRef]
- Qi, Y.X.; Liu, Z.R.; Wang, X.Z. Effect Analysis of Soil and Water Conservation from the Loess Plateau Watershed Rehabilitation Project ( Phase II). Res. Soil. Water Conserv. 2008, 15, 204–207. (In Chinese) [Google Scholar]
- Su, C.H.; Fu, B.J.; Lü, Y.H.; Lu, N.; Zeng, Y.; He, A.N.; Lamparski, H. Land Use Change and Anthropogenic Driving Forces:A Case Study in Yanhe River watershed. Chin. Geogr. Sci. 2011, 21, 587–599. (In Chinese) [Google Scholar] [CrossRef]
- Zhao, G.J.; Mu, X.M.; Gao, P. Soil Erosion, Conservation, and Eco-Environment Changes in the Loess Plateau of China. Land Degrad. Dev. 2013, 24, 499–510. [Google Scholar] [CrossRef]
- Kandasamy, J.; Sounthararajah, D.; Sivabalan, P.; Chanan, A.; Vigneswaran, S.; Sivapalan, M. Socio-hydrologic drivers of the pendulum swing between agricultural development and environmental health: a case study from Murrumbidgee River basin, Australia. Hydrol. Earth Syst. Sci. 2014, 18, 1027–1041. [Google Scholar] [CrossRef] [Green Version]
- Liu, J.; Dietz, T.; Carpenter, S.R.; Alberti, M. Complexity of coupled human and natural systems. Science 2007, 317, 1513–1516. [Google Scholar] [CrossRef] [PubMed] [Green Version]
- Lu, Z.; Wei, Y.; Xiao, H.; Zou, S.; Xie, J. Evolution of the human-water relationships in the Heihe River basin in the past 2000 years. Hydrol. Earth Syst. Sci. 2015, 19, 2261–2273. [Google Scholar] [CrossRef] [Green Version]
- Lu, D.D. Ubranization Process and Spatial Sparwl in China. J. Urban Plan. 2007, 4, 47–52. (In Chinese) [Google Scholar]
- Baker, T.J.; Miller, S.N. Using the Soil and Water Assessment Tool (SWAT) to assess land use impact on water resources in an East African watershed. J. Hydrol. 2013, 486, 100–111. [Google Scholar] [CrossRef]
- López-Moreno, J.I.; Vicente-Serrano, S.M.; Moran-Tejeda, E.; Zabalza, J.; Lorenzo-Lacruz, J.; García-Ruiz, J.M. Impact of climate evolution and land use changes on water yield in the ebro basin. Hydrol. Earth Syst. Sci. 2011, 15, 311–322. [Google Scholar] [CrossRef] [Green Version]


| Years | Precipitation (mm) | Runoff (108m3) | Sediment (108t) | ||||||
|---|---|---|---|---|---|---|---|---|---|
| Mean | Cv | K | Mean | Cv | K | Mean | Cv | K | |
| 1956–1965 | 561 | 0.24 | 2.53 | 2.39 | 0.44 | 3.72 | 0.6 | 0.82 | 36.4 |
| 1966–1975 | 524 | 0.17 | 1.54 | 2.19 | 0.28 | 2.65 | 0.55 | 0.48 | 5.3 |
| 1976–1985 | 544 | 0.31 | 1.5 | 2.18 | 0.29 | 2.63 | 0.37 | 0.99 | 10 |
| 1986–1995 | 494 | 0.37 | 1.65 | 2.21 | 0.22 | 2.04 | 0.47 | 0.42 | 5.8 |
| 1996–2005 | 465 | 0.42 | 2.08 | 1.72 | 0.32 | 2.43 | 0.31 | 0.85 | 15.3 |
| 2006–2016 | 535 | 0.18 | 1.54 | 1.43 | 0.44 | 3.52 | 0.05 | 1.26 | 24 |
| 1956–2016 | 520 | 0.2 | 2.64 | 2.05 | 0.38 | 5.28 | 0.384 | 0.93 | 363.6 |
| Landuse Types | 2000 | 2005 | 2010 | 2015 |
|---|---|---|---|---|
| Arableland | 3217 | 3009.5 | 2375 | 2360.5 |
| Forestland | 808.5 | 1018 | 1074.5 | 1072 |
| Grassland | 3376 | 3373 | 3934.5 | 3915.5 |
| Water | 25 | 22 | 24 | 26 |
| Building | 27 | 31 | 47 | 81 |
| Unutilized land | 2.5 | 2.5 | 1 | 1 |
© 2020 by the authors. Licensee MDPI, Basel, Switzerland. This article is an open access article distributed under the terms and conditions of the Creative Commons Attribution (CC BY) license (http://creativecommons.org/licenses/by/4.0/).
Share and Cite
Zhong, X.; Jiang, X.; Li, L.; Xu, J.; Xu, H. The Impact of Socio-Economic Factors on Sediment Load: A Case Study of the Yanhe River Watershed. Sustainability 2020, 12, 2457. https://doi.org/10.3390/su12062457
Zhong X, Jiang X, Li L, Xu J, Xu H. The Impact of Socio-Economic Factors on Sediment Load: A Case Study of the Yanhe River Watershed. Sustainability. 2020; 12(6):2457. https://doi.org/10.3390/su12062457
Chicago/Turabian StyleZhong, Xue, Xiaohui Jiang, Leilei Li, Jing Xu, and Huanyu Xu. 2020. "The Impact of Socio-Economic Factors on Sediment Load: A Case Study of the Yanhe River Watershed" Sustainability 12, no. 6: 2457. https://doi.org/10.3390/su12062457