Article

Grain Area Yield Index Insurance Ratemaking Based on Time–Space Risk Adjustment in China

1
College of Economics and Management, China Agricultural University, Beijing 100083, China
2
School of Public Finance and Taxation, Hebei University of Economics and Business, Shijiazhuang 050061, China
*
Author to whom correspondence should be addressed.
Sustainability 2020, 12(6), 2491; https://doi.org/10.3390/su12062491
Submission received: 18 February 2020 / Revised: 19 March 2020 / Accepted: 20 March 2020 / Published: 22 March 2020
(This article belongs to the Section Economic and Business Aspects of Sustainability)

Abstract

:
The foundation and sustainable development of agricultural insurance involve accurately determining a premium and establishing a dynamic premium adjustment mechanism that matches the agricultural production risk. Based on the theoretical analysis of the impact of time–space risk adjustment on agricultural insurance ratemaking, we constructed a pure premium ratemaking model based on time-varying risk adjustment and a safety premium ratemaking model based on spatially dependent risk adjustment. Choosing the county grain area-yield index insurance (GAYI) in China as the research object, we obtained the following results: (1) the risk of grain yield per unit area (YPUA) and pure premium rate in most counties decreased significantly with time-varying adjustment, and we observed differences between regions; (2) grain’s spatially dependent risk has a strong negative adjustment effect on the loading factor, but the expansion of insurance underwriting can still rapidly reduce the safety premium rate, mainly due to the reduction in the spatially dependent risk; and (3) based on time-varying risk adjustment and underwriting expansion, the reduction effect of premium rates is obvious, which supports the sustainable commercial operation of agricultural insurance. These research results help to clarify the relationships of premium rates and provide implications on the sustainability of catastrophe management.

1. Introduction

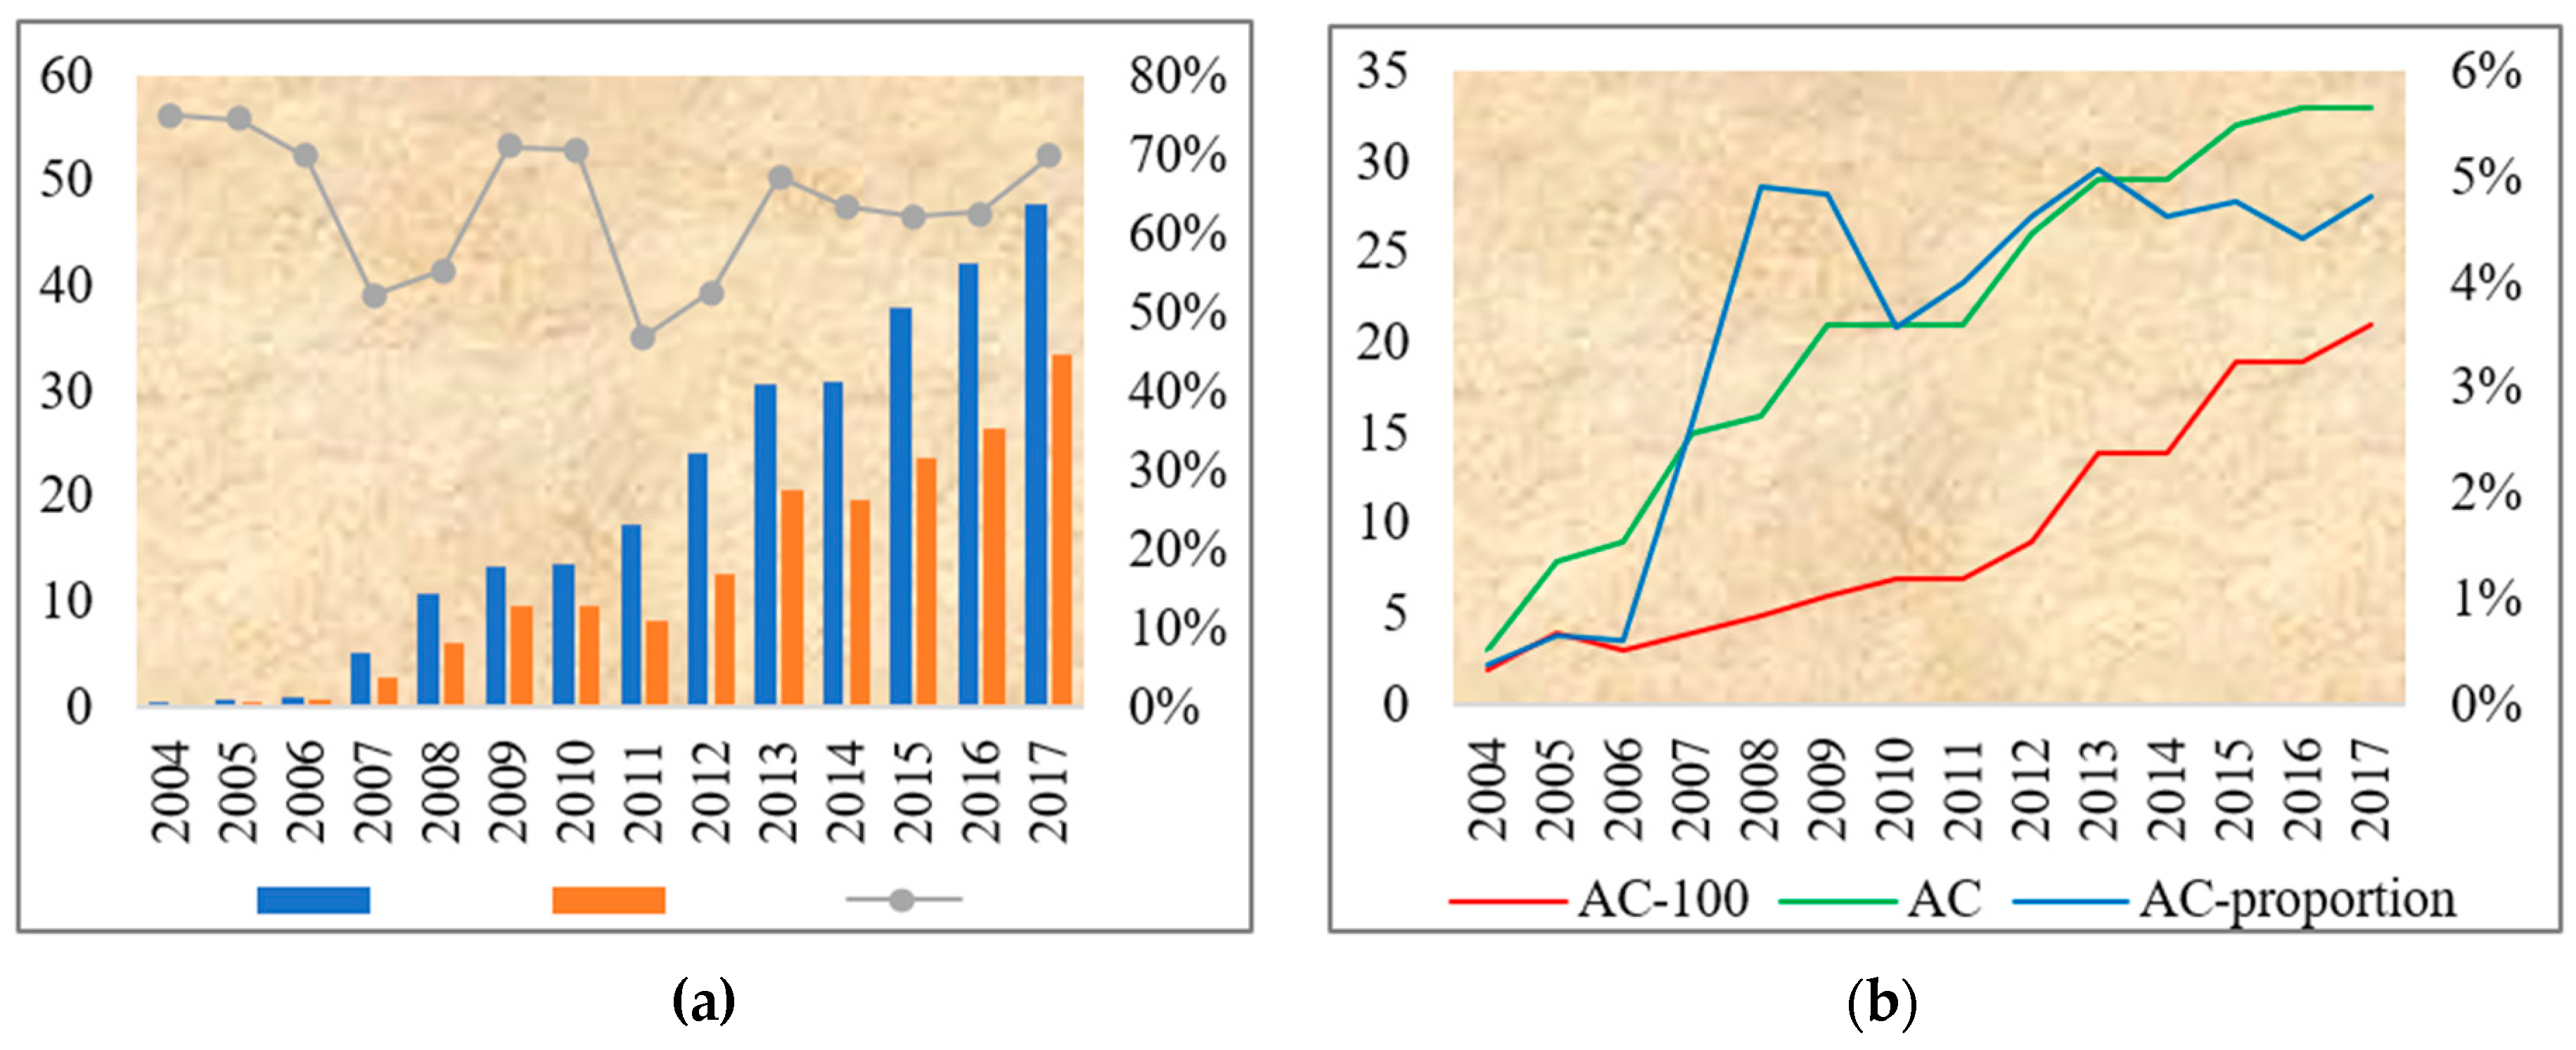
Agricultural insurance has gradually become an important policy incentive and an effective market tool in diversifying agricultural production risks and protecting farmers’ incomes in China [1]. The agricultural insurance premium income increased from 5.1 billion yuan in 2007 to 57.3 billion yuan in 2018. Comprehensive insurance coverage of the major grain crops (maize, wheat, and paddy rice) exceeds 60% [2], the number of agricultural insurance companies is more than 30, and the proportion of agricultural insurance premiums in property insurance is steadily increasing (Figure A1). Overall, agricultural insurance has achieved results in agricultural risk management, and has formed a preliminary-scale agricultural insurance market that ranks second in the world.
However, “there are still some problems in the development of agricultural insurance, which results in a gap between the insurance supply and the actual demand of agriculture, rural areas, and farmers” [3], which is seriously hindering the sustainable development of agricultural insurance. Among these problems, inaccurate premium pricing and an incomplete insurance risk management system are important and fundamental issues urgently requiring solutions in China [4]. First, due to systematic risks [5], biological crop characteristics, and China being dominated by smallholder farming, accurate insurance pricing is difficult. Second, the agricultural insurance program policy experience in China is limited and the main aims in the early stage are to cultivate, develop, and expand the agricultural insurance market; hence, the basic premium ratemaking is relatively weak. For example, China has a severe lack of farm-level crop production data [6], and insurance companies mostly use the loss-ratio ratemaking approach as well as the “one province, one rate” rule. Third, some basic problems with the risk management system of agricultural insurance have not been solved [7], such as the relationship of risk liability between the government and the market, the central government, and the local government [8], and the relationship between a high level of insurance coverage and operation costs or the willingness to pay. These problems are not conducive to the realization of China’s 2030 agricultural insurance development goals of “effective subsidies, secure industries, affordable for farmers, and sustainable institutions” [3].
Scientific and dynamic premium pricing methods help to improve the degree of matching between insurance pricing and agricultural risks, and thus promote the sustainability of the agricultural insurance market by reducing adverse selection and improving demand [9,10]. Global climate change has significantly intensified, and extreme disasters are occurring more frequently. For China, which has relatively limited agricultural resources, the task of adapting to climate change, coping with various agricultural disasters, and stabilizing grain production is arduous [11]. Artificial factors, such as agricultural technological progress [12] and agricultural industrial structure adjustment, will also inevitably create changes in the risk characteristics of agriculture. Both internal and external factors call for scientific and dynamic pricing of agricultural insurance. In addition, scientific and perfect premium pricing mechanisms have guiding significance for the sustainability of the agricultural insurance management system, especially for the sustainability of the risk liability sharing mechanism [13].
Insurance involves a consideration exchange between risks and premiums and focuses on the diversification of risks over time and space [14]. Currently, the main approach used to control the underwriting risk in China’s agricultural insurance firms is to spread the risk over time and adjust the premium rate according to the loss ratio of the premium collected. As a result, insurance firms are encouraged to participate in the agricultural insurance business and obtain benefits in the early stage. However, due to the lack of effective assessment of the core factors, such as the temporal and spatial risks of insured crops as well as disaster adaptability, insurance companies are faced with adverse selection [15] and more uncertain underwriting risks. Inadequate risk assessment and inaccurate pricing are detrimental to the formation of a mature reinsurance market [16], hindering the sustainable development of agricultural insurance. At present, China’s agricultural insurance has entered a new period of high-quality development. The government has proposed to strengthen the agricultural insurance risk zonation and publish the agricultural insurance pure premium rate according to the agricultural production risk, to set up a scientific insurance-rate dynamic adjustment mechanism [3]. However, there are few studies on the relationship between the pure premium and safety premium, especially from a dynamic perspective. Therefore, agricultural risk analysis and insurance pricing from the perspective of time and space is crucial for the sustainable development of the insurance market and the welfare of agricultural producers.
Yield index insurance, which easily determines loss and compensation, is suitable for small households, mitigates moral hazards, and is low cost [17,18], is being piloted in China. The agricultural insurance guidance [3] also proposes to steadily promote area-yield index insurance. This research took grain area-yield index insurance (GAYI) as the research object, and theoretically and empirically analyzed the impact of time-varying risks on pure premium rates and the impact of spatially dependent risks on safety premium rates. We then discussed the results, especially the relationships of the premium rates, and the implications for catastrophe management. As shown in the research framework of Figure 1, the innovation of this research is to fully consider the impact of the time–space risk characteristics of grain on insurance pricing in order to achieve dynamic sustainable pricing that is compatible with the risk characteristics. Then, through the discussion of the premium rates trend and the relationships of the rates, we discuss the implications of the research findings for sustainable catastrophe management. (Figure 1)

2. Methodology

2.1. Pure Premium Ratemaking Based on Time-Varying Risk Adjustment

Grain yield per unit area (YPUA) risk provides an important indication of grain security and is an important basis for premium determination. Especially in the case of yield insurance (including the cost insurance of China), the basic paradigm is to use the detrending YPUA estimate loss ratio [19]. Scholars focused on the types and characteristics of YPUA distribution have summarized the advantages of non-parametric or semiparametric and Bayesian estimation in premium calculations [20,21,22]. Some researchers have conducted detailed studies on the YPUA detrending method [23], grain risk zoning [24], and the ratemaking method [25], constructing the theory of pure premium ratemaking of detrending–distribution fitting–loss estimation–ratemaking.
The time-varying risk characteristics of grain YPUA and the impact on the premium rate have been ignored. The risk of grain YPUA may have obvious time-varying characteristics due to the improvement in agricultural disaster prevention capability, the progress of agricultural technology, the adjustment of the agricultural industrial structure, and changes in a disaster situation [26,27]. Generally, crop YPUA risk is a random or proportional volatility with time or yield growth, corresponding to the constant variance or proportional variance in the yield trend estimation. For example, in the yield estimation model = X μ + ε , the constant variance assumes that the absolute value of YPUA volatility does not statistically change with time, satisfying ε ^ t 2 = σ 2 , which is applicable to short time series data and the additive model y ˜ t = y ^ T + ε ^ t . The proportional variance assumes that the absolute value of YPUA volatility changes in a fixed proportion with time or yield growth (Figure A2a), which satisfies ε ^ t 2 / y ^ t 2 = σ 2 and is applicable to long time series data and the multiplication model y ˜ t = y ^ T ( 1 + ε ^ t / y ^ t ) [28]. Both assumptions assign the same weight to each year’s loss ratio to calculate the multi-year average.
How does the time-varying risk of grain yield affect insurance ratemaking? If the grain YPUA risk increases over time and the same weight is assigned each year to measure the loss, the premium rate will be underestimated; otherwise, the premium rate will be overestimated. In this case, ratemaking would not be fair. Only when the risk has no statistical time-varying trend can the same weight be assigned to each year and still meet the stochastic assumption. In addition, as YPUA sometimes shows a negatively skewed distribution [17] and the risk time-varying trend of a loss year and a normal year may not be consistent (Figure A2b), the asymmetry of grain YPUA loss must be considered. Therefore, in this study, the pure premium ratemaking fully considered the time-varying risk characteristics and their symmetrical effects.
From the existing studies [23,25] and the actual fitting of the grain YPUA of the counties, quadratic regression has a better fitting effect on the grain YPUA trend in China and also suits the law of diminishing marginal growth rate of grain YPUA. The trend estimation model is as follows:
y i t = γ i 0 + γ i 1 t 2 + γ i 2 t + e i t
where y i t is the grain yield observed in county i in year t (t = 1..., T) and e i t represents the random error. Establishing a residual auxiliary regression function was the main idea for finding the trend of the residual error. With this idea and Harri’s research [29], the residual estimated by Equation (1) was used to establish the following optimal auxiliary regression:
e ^ i t 2 = o p t ( y ^ i t , t ,   t 2 ) = σ i 2 y ^ i t θ i
where σ i 2 is the basic variance and θ i is the adjustment coefficient of the residual, indicating that the residual increases exponentially with the yield. As the residual may have asymmetric characteristics [30], the adjustment coefficient can be divided into two parts: θ i = β i + I ( e ^ i t ) δ i with basic adjustment coefficient β i and negative skewness coefficient δ i , where δ i represents the difference in the YPUA risk trend with time between the loss year and the normal years and I ( e ^ i t ) is the indicator function taking a value 1 if e ^ i t < 0 and 0 if e ^ i t 0. We established the scale model under different time dimensions:
e ^ i t a e ^ i t = σ i y ^ i p 0.5 ( β i + I ( e ^ i t ) δ i ) σ i y ^ i t 0.5 ( β i + I ( e ^ i t ) δ i )
where | e ^ i t a | = σ i y ^ i p 0.5 θ i , | e ^ i t | = σ i y ^ i t 0.5 θ i ,   y ^ i p is the predicted yield that is replaced by the fitted dependent variable y ^ i T in county i and e ^ i t a represents the detrended residual, which can be calculated by   e ^ i t a = e ^ i t ( y ^ i p y ^ i t ) 0.5 ( β i + I ( e ^ i t ) δ i ) . When θ i equals 0 or 2, the yield regression model satisfies homoscedasticity or proportional heteroscedasticity. Taking the logarithm of both sides of Equation (2), we can estimate β i and δ i and calculate e ^ i t a through the following model:
l n ( e ^ i t 2 ) = φ i + β i l n ( y ^ i t ) + I ( e ^ i t ) δ i l n ( y ^ i t ) + ϵ i  
Then, the detrended y ^ i t a and y ^ i p a are generated by y ^ i t a = y ^ i p + e ^ i t a and y ^ i p a = y ^ i p + 1 T t = 1 T e ^ i t a , respectively. By setting the insurance coverage level (cov), we can calculate the GAYI pure premium rate:
π i a = 1 T × y ^ i p a t = 1 T m a x ( c o v × y ^ i p a y ^ i t a , 0 ) .

2.2. Safety Premium Ratemaking Based on Spatially Dependent Risk Adjustment

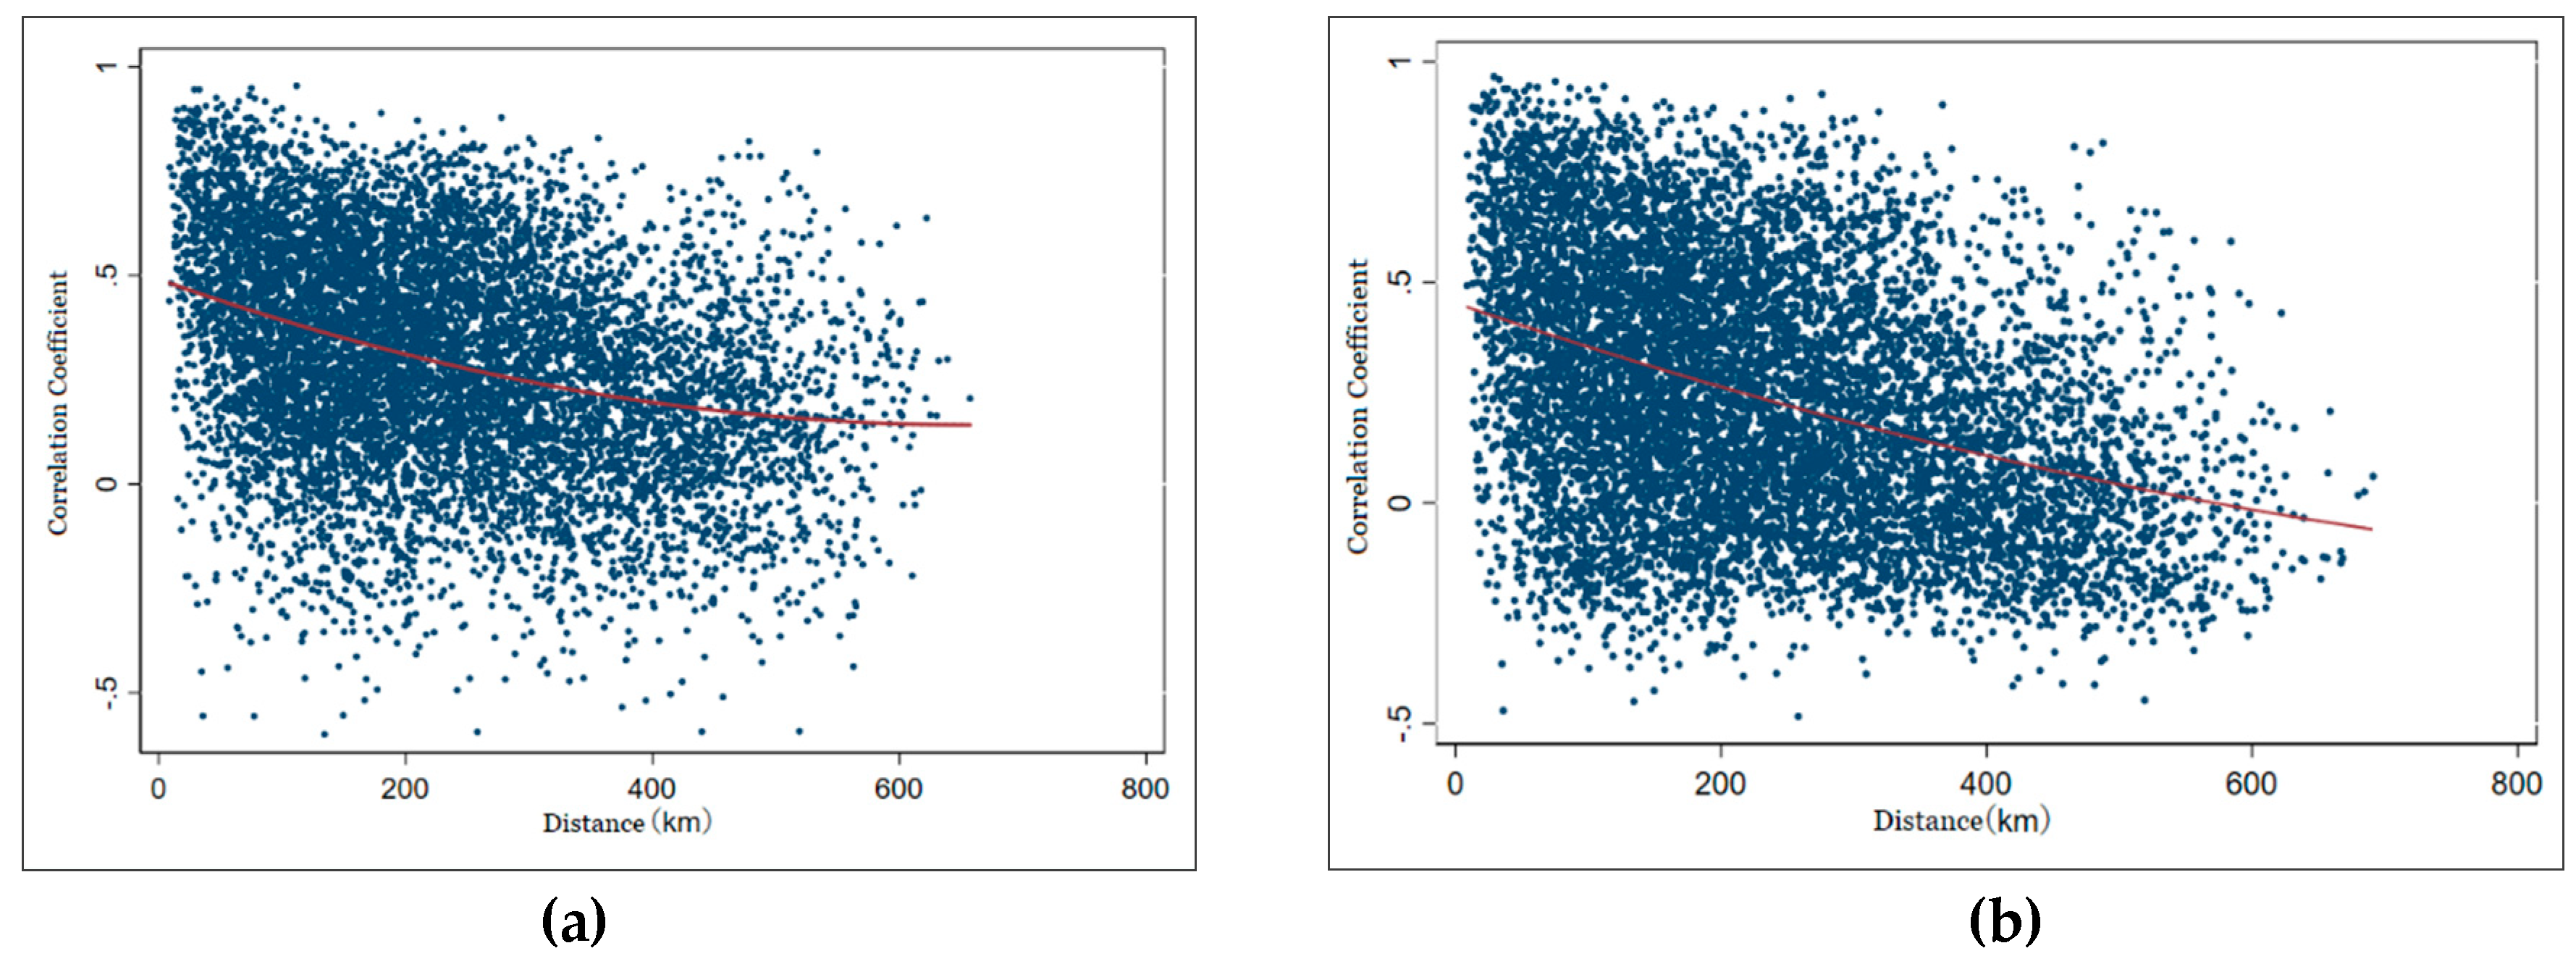
Agricultural insurance is difficult to fully commercialize because crops have systematic risks that lead to catastrophes, such as large-scale meteorological disasters or loss due to diseases and insect pests. The systemic risk of crop insurance is dozens of times that of independent risk [5]. Therefore, a higher additional safety premium rate is required, which results in crop insurance failure in pure commercialization. However, some studies have shown that the correlation of yield loss decreases or even rapidly disappears with an increase in distance, and faster than the correlation of yield [31,32]. An analysis of counties in Hebei also supports this view (Figure A3). Therefore, the additional safety premium due to dependent risk may not be so high with wide underwriting coverage. Management Measures for Agricultural Insurance Catastrophe Risk Reserves (2014) requires insurers to withdraw two enterprise-level catastrophe reserves based on a certain percentage of agricultural insurance premium income and excess underwriting profits. However, the grain reserve rates for China are hard to find, either in research or in practice. Scholars often assume a safety premium rate, such as 0.15–0.25 times the pure premium rate, when calculating gross rates [15,33]. As premium ratemaking in practice is mostly based on indemnity rather than actual crop risk (although they are related), neither the reserve rates setting in practice nor the assumptions in the research necessarily match the actual crop risk. Therefore, the impact of spatially dependent risk on the safety premium is examined below.
An insurance company faces an average indemnity of E ( X t ) = i = 1 N E ( x i t a ) and a loss variance of V a r ( X t ) when it underwrites crop risk in N counties, where   x i t a equals m a x ( c o v × y ^ i p a y ^ i t a , 0 ) and represents the indemnity in county i. The insurance company not only considers the balance relationship between the pure premium income and the indemnity claim but also tries to ensure that the total premium amount is not lower than the indemnity claim at a certain confidence level. The additional safety loading sE( X t ) is levied on the basis of the fair premium to support over-indemnity or purchase reinsurance [34], where s is the loading factor.
Grain yield is a finite-range dependent and has finite variance. Spatial-dependence characteristics can be weakened or even disappear quickly in a large range. Therefore, the central limit theorem supports spatial aggregation analysis of yield loss [31,35]; that is, the distribution of a total loss approximately meets a normal distribution with a mean value of E ( X t ) and variance of V a r ( X t ) [36]:
F X t ( x t ) Φ ( x t ; E ( X t ) , V a r ( X t ) )  
The total premium amount x t = ( 1 + s ) E ( X t ) is substituted into Equation (6) and standardization treatment is conducted:
P ( X t ( 1 + s ) E ( X t ) ) Φ ( x t E ( X t ) V a r ( X t ) ) 1 α
The finite positive correlation distance is not set in the actual calculation because (1) we cannot measure this exact distance; (2) the covariance over this distance is a random value around 0, and the sum can be offset; and (3) whether the sum of covariance over this distance is positive or negative, it has a certain significance for the loading factor. For example, agricultural production is sometimes exposed to disaster risk on a very large scale. By setting a reasonable value α , the loading factor of the county GAYI can be calculated as follows:
s = z a E ( X t ) i = 1 N V a r ( x i t a ) + i = 1 N j = i + 1 N C o v ( x i t a , x j t a )
where z a is the threshold to ensure that the probability of the total premium being less than the total indemnity claim does not exceed α . Therefore, we can obtain the safety premium rate π s a = s E ( X t ) / [ E ( y ^ i p a ) N ] and the overall pure premium rate π a = E ( X t ) / [ E ( y ^ i p a ) N ] . Letting A = i = 1 N V a r ( x i t a ) , B = i = 1 N j = i + 1 N C o v ( x i t a , x j t a ) , and assuming A / E ( X t ) is the independent risk effect, B / E ( X t ) is the adjustment effect of a spatially dependent risk. Then, we can calculate the degree of systemic risk by ( A + B ) /   A [5] and analyze the relationship between the independent risk effect and the adjustment effect of a spatially dependent risk.

2.3. Study Area and Data Collection

The county grain yield data were from the statistical yearbooks of the Henan, Hebei, Shanxi, Hunan, Jilin, Zhejiang, and Fujian provinces from 1989 to 2017. The selected period (maximum 29 years) represented the characteristics of the yield after the implementation of reform and opening up policy and the stabilization of the agricultural production system. Henan, Hebei, and Shanxi provinces are located in North China and are closely connected, with a north–south and east–west span of about 1200 and 800 km, respectively. Jilin, Hunan, Zhejiang, and Fujian provinces are located in Northeast, South, East, and Southeast China. The samples included provinces with a higher geographical concentration and provinces with better dispersion. The variables used included the area sown with grain, total grain yield, and the calculated grain GYPA, with the total grain yield of the seven provinces accounting for 30% of the total national grain yield in 2018. The counties with ages of less than 20 years or severe data gaps were excluded, and data from a total of 625 counties with an average time sequence length of 25.14 years were obtained, included a total of 15,712 annual yield data points. The description and statistics of the samples are shown in Table 1.
The statistical categories for the grain yield (and sown area) in China included maize (32.2%), wheat (20%), rice (39.1%), beans, and tubers. To fully use the time series length of the data, grain yield data were used in this study. Although the performance of different crops facing different disaster risks is not consistent and the use of grain yield data may lead to aggregate bias, the growth characteristics of crops that determine yields tend to change in the same direction in the face of disaster risks. In practice, often only one or two insurers operate in a county covering different crops; thus, aggregate analysis is useful for assessing overall risk. The main objective of this study was to examine the characteristics of time–space risks and their impact on premium rates and analyze the relationship between the rates—not just calculate rates. Therefore, using aggregated data did not affect the main purpose of the study.

3. Results

3.1. Estimated Results of Time-Varying Risk Adjustment Coefficients and Pure Premium Ratemaking

The Ordinary Least Square (OLS) estimation results (Table 2) of Equation (4) suggest that 23.36% of the counties had time-varying risk trends at a significance level of 5%, and the average θ ^ of the total counties (625) and the significant counties (146) was –3.163 and –7.371. Among the significant counties, the risks of grain YPUA increased over time in 33 counties and decreased in 113 counties. The yield risk trends of the three counties were asymmetrical, among which two were negatively skewed. In general, the risk of grain YPUA in our samples decreased significantly with time. However, the risk trends in different provinces were different. For example, the average θ ^ of the significant counties in Hebei and Zhejiang were 0.051 and 1.211, respectively, and the risk decline trends were not obvious. Zhejiang’s agriculture has been severely affected by disaster in the past years, and the level of comprehensive grain risk since 2007 (The disaster level is calculated by (((damage area – inundated area) × 0.1 + inundated area × 0.3)/grain sown area)) was second only to Hainan in eastern China, ranking ninth in the whole of China.
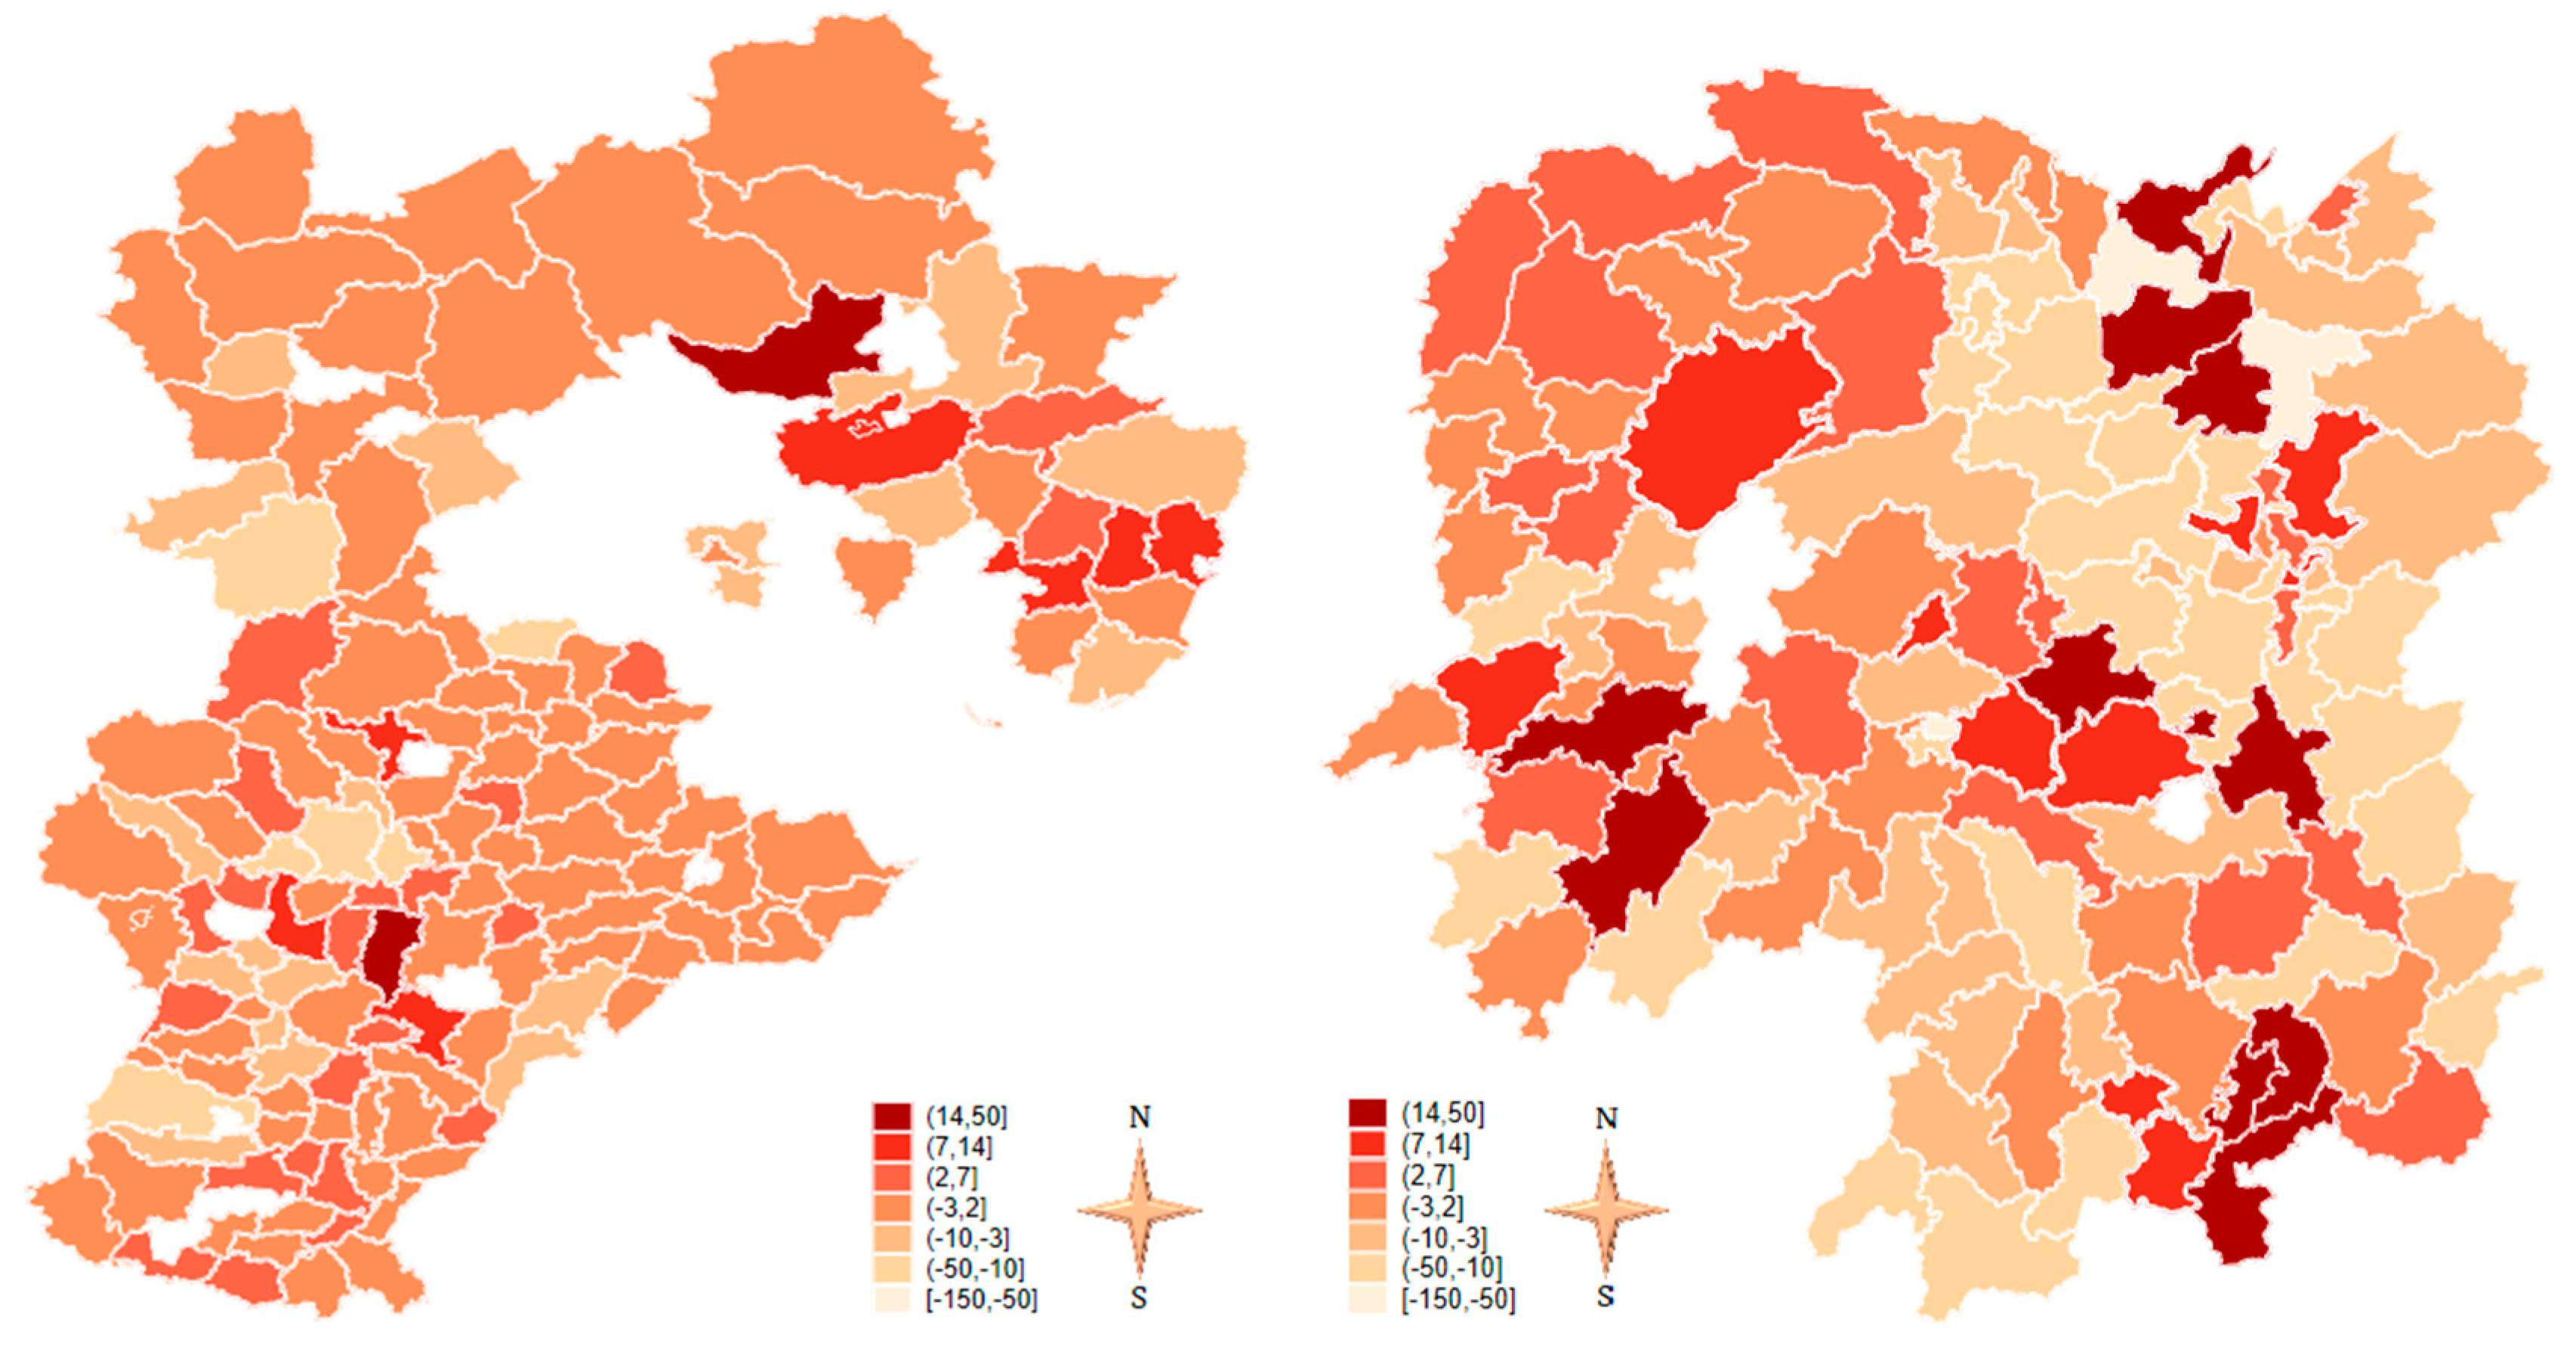
Taking Hebei and Hunan, with more counties of “ θ ^ > 2”, as examples (Figure 2), the counties of “ θ ^ > 2” in Hebei were mainly distributed in the cities of the northeast, such as Chengde, Tangshan, and Qinhuangdao, where there are poor agricultural production conditions. Counties of “ θ ^ > 2” in Hunan were mainly distributed in Loudi and Hengyang, which have a high altitude: Zhangjiajie in the northwest mountain district, Chenzhou in the south, and around the Dongting Lake in Yueyang. Overall, counties with an increased YPUA risk were mainly distributed in areas with relatively poor production conditions or a high risk of disasters.
The premium rates of the counties with significant θ ^ and insignificant θ ^ values were adjusted by θ ^ and “θ = 2”, which is called partial adjustment. The rates of partial adjustment were compared with the rates of all adjustment according to θ ^ and all adjustments according to “θ = 2” (meaning, non-adjustment under the same technical conditions with adjustment). The premium rate results (cov = 100%) are shown in Figure 3. Compared with the adjustment rate by “θ = 2”, all adjustments by θ ^ were closer to the left, while partial adjustments were in between, which indicates that the grain pure insurance premium rate significantly decreased through time-varying adjustments, and the result was more inclined to support lower GAYI pure insurance premiums when considering the time-varying risk.

3.2. Loading Factor and Safety Premium Ratemaking

Based on the counties in Henan, the counties of Hebei, Shanxi, Hunan, Jilin, Zhejiang, and Fujian were added to the sample in order, and seven loading factors and safety premium rates with gradient sample sizes were measured under partial and “θ = 2” adjustments. The results are shown in Table 3. The loading factor decreased rapidly with an expansion of the insurance underwriting, and the decline rate gradually slowed down. Compared with the coverage of only 108 counties in Henan, the loading factor of 625 counties in seven provinces decreased by 56% and 61%, respectively, under the conditions of adjustment by “θ = 2” and partial adjustment. Safety premium rates decreased by 44% and 47%, respectively, which indicated that expanding the coverage of underwriting can significantly reduce the loading factor and, thus, the additional safety premium rate.
We broke down the loading factor into independent risk effects and adjustment effects under the spatially dependent risk. The results are shown in Figure 4. The reduction of spatially dependent risks contributed far more to the loading factor than the independent risk effect, with an increase of the underwriting range. Therefore, if the insurer wants to maintain an overpayment of no more than 5% probability and charge a lower safety premium, expanding the coverage is effective, but the effect mainly comes from the reduction of spatially dependent risks. At the same time, we measured the intensity of systemic risk under partial adjustment and an adjustment by “θ = 2”, which were, on average, 23.89 and 20.31 times the independent risk conditions, respectively, and there were no significant changes with the expansion of the underwriting. Therefore, the effect of insurance premium rate reduction through the expansion of underwriting mainly came from the reduction of spatially dependent risks, rather than the independent risk effect.

3.3. Robustness Test

The choice of trend estimation method may have an impact on the estimation of the time-varying adjustment coefficient. Theoretically, quadratic fitting can better reflect the hypothesis of a diminishing marginal contribution rate of technological progress (replaced by time T) than linear fitting, and it will not be overfitted like cubic regression. Considering the robustness, we took the fitting effect as the standard and used Locally Weighted Scatterplot Smoothing (Lowess) to remove the trend and compare it with the ratemaking result of quadratic fitting. The Lowess method is a non-parametric method using local polynomial regression. It can handle extreme values more robustly and can help alleviate the boundary problem of inaccurate estimation at both ends. It is suitable for more types of data. The disadvantage is that it is easy to produce data-oriented overfitting, but it can be used as a good robustness test tool to test the effect of quadratic terms.
We used the Lowess method to estimate the trend of grain yield and estimate the θ coefficient. The results are shown in Table 4. There were more counties that had a time-varying characteristic in the Lowess method. A total of 100 of the 146 counties with significant θ ^ values obtained by using quadratic detrending were significant in the Lowess method, with a consistency ratio of 68.5% at a significance level of 5%, and the consistency ratio was 73.2% at a significance level of 10%. In addition, 399 of the 479 counties with insignificant θ ^ values obtained by using quadratic detrending were not significant under the Lowess method, with a consistency ratio of 83.3% at a significance level of 5%, and the consistency ratio was 79.1% at a significance level of 10%. The above results show that the empirical test of time-varying risks was robust.
In order to test the robustness of the ratemaking method, the unadjusted rate results were compared with the rate results adjusted by “θ = 2” and θ ^ (Table 5). There was no significant difference between the unadjusted rate and the rate adjusted by “θ = 2”, but there was a significant difference from the rate result adjusted by θ ^ . This shows that the construction of the premium ratemaking method and model did not affect the logic of rate determination on a technical level, and the ratemaking method was robust.

4. Discussion

The average θ ^ (much less than 2) of all counties and significant counties indicates the grain YPUA risk gradually reduces with time, and the average rate reduction through θ ^ adjustment and partial adjustment is 1.57% and 0.63%. Against a background of increasing natural disaster risks, the reduction in yield risk may mainly benefit from the advancement of agricultural technology, such as seed and irrigation technology, the increase of the Chinese government’s investment in agricultural production and agricultural disaster protection [37], and the optimization of the agricultural industrial structure. However, due to poor production conditions in some areas or high risks of natural disasters, the risk situation of grain yield is still not optimistic [38,39].
One of the most important reasons why crop insurance is difficult to fully commercialize is that crops are faced with catastrophe indemnity, which is caused by system risk. This research finds that the loading factor decreased obviously through expanding the coverage of underwriting, which indicates that, although spatially-dependent risk has a strong negative adjustment effect on the loading factor, the expansion of insurance underwriting can still rapidly reduce the safety rate. The reduction of safety rates mainly benefits from the reduction of the spatially dependent risk, not the increase of the independent risk. In addition, the reduction in grain yield risk over time also contributes to the reduction of the loading factor and safety premium rate by 0.03% and 0.67%, respectively.
In order to promote the development of the insurance market, the Chinese government has provided high premium subsidies and temporary catastrophe risk-sharing measures [40]. However, an agricultural reinsurance mechanism and a catastrophe management system are very inadequate [7]. There are many problems, such as non-compensation, adverse selection, and risk responsibility prevarication between insurance companies and the government, which remain unresolved. Some distorted insurance market behaviors, such as rent-seeking and fraudulent subsidies, have even occurred. The results of this research have the following implications for the sustainability of catastrophe management.:
1. Time-varying risk adjustments and the expansion of underwriting can greatly reduce pure and safety premium rates, which can promote the sustainability of supply and demand in the insurance market. This research also finds that the intensity of systemic risk ( ( A + B ) / A ) has no trend change with the increase in insured quantity (N), so the law of large numbers effect (ERP), [31]
E R P = V a r ( X t ¯ ) ( i = 1 N V a r ( x i t a ) ) / N = 1 N i = 1 N V a r ( x i t a ) ( i = 1 N V a r ( x i t a ) + i = 1 N j = i + 1 N C o v ( x i t a , x j t a ) ) ,
can still play a certain role. The market has efficiency advantages, and the results support crop insurance companies to manage catastrophe risks on the premise of commercial operation, which can reduce direct government intervention and improve agricultural insurance marketization;
2. Clearly defining the rate effect of a time–space risk helps to clarify the risk-responsibility relationship between the government and the market. Agricultural insurance has quasi-public product attributes [41], and Chinese agricultural insurance has adopted subsidy measures and adhered to market-oriented operations of agricultural insurance. However, due to the government’s leading role, agricultural insurance companies are less proactive in risk management, and the insurance premium rate is also determined in the game between the government and the market, which is different from the public–private partnership (PPP) approach in the United States and Canada [13]. If insurance companies can adopt accurate risk assessment and ratemaking under efficient policy subsidies, especially considering the pure loss rate in the time dimension and the safety rate under their own coverage, then risk pricing is actually a basic equilibrium premium. The government does not need to provide additional risk protection to prevent the occurrence of prevarication problems after a disaster, which can increase the risk responsibility awareness of insurance companies. If agricultural insurance companies need to further control risks, they can adopt market methods such as purchasing reinsurance or issuing catastrophe bonds. The reinsurance and bond markets should also conduct a full risk assessment of the combined insurance policies of each insurance institution to reduce both the underwriting risk and the adverse selection. The ultimate goal is to promote a better match between agricultural insurance premium rates and agricultural risks and to increase the accuracy and sustainability of risk responsibility sharing;
3. A sound national reinsurance system is conducive to reducing insurance rates and to improving protection capabilities. In this study, the loading factor and the safety rate decreased by 61% and 47%, respectively, with the increase of underwriting. However, this is an ideal state, because the number of institutions that are able to provide coverage across the 625 counties in seven provinces is limited. To achieve the goal of “reducing premiums, increasing demand, and controlling risk”, national reinsurance institutions should be established to achieve a wider range of safety premium rate ratemaking. This conclusion is backed up by practice: the Ministry of Finance of China is leading preparations for the China Agricultural Reinsurance Corp. Regulators can explore the risk-sharing business model of “direct insurance companies bear pure rate risk and reinsurance companies bear safety rate risk”. Reinsurance companies should adopt more market-based pricing based on the number of policy portfolios, risk levels, and other factors to protect fair competition in the direct insurance market and to promote the sustainable development of the reinsurance market;
4. The World Bank (2007) has suggested that the sustainable risk diversification mechanism of agricultural insurance should be risk retention, agricultural insurance, reinsurance (including catastrophe insurance fund, etc.), and government sharing [42]. Therefore, in order to prevent the impact of an extreme catastrophe risk under the two layers of risk protection of direct insurance companies and reinsurance companies, the government and all sectors of society should also establish the higher layer of a catastrophe fund as a supplement to avoid the collapse of the agricultural insurance market.
The research in this article uses aggregated data. If a larger range (such as more counties or townships) and more detailed data of various crops can be obtained, the research results will be more accurate; these are the directions for study in the future.

5. Conclusions

Premium ratemaking that matches the time–space risk is of great significance to the sustainable development of agricultural insurance. Based on the theoretical analysis of the impact of time–space risk adjustment on crop insurance ratemaking, we constructed a pure premium ratemaking model and safety premium ratemaking model based on time–space risk adjustment. Taking the county GAYI of 625 counties in China as the research object, we obtained the following conclusions:
Most of the counties’ grain YPUA risk and pure premium rates decreased significantly with time-varying adjustment, and we observed differences between regions. For example, some counties with relatively poor production conditions or a high risk of disasters showed a trend of increasing risk over time. Rate adjustment based on time-varying can contribute to a reduction of the pure premium rate and safety premium rate by 0.63% (0.57%) and 0.67%, respectively. Grain’s spatially dependent risk has a strong negative adjustment effect on the safety premium factor, but the expansion of insurance underwriting can still rapidly reduce the safety rate, mainly due to a reduction in the spatially dependent risk rather than an increase of the independent risk. The constant lever of systemic risk indicates that the law of large numbers effect (ERP) can still play a certain role. These findings have the following implications for the sustainable development of agricultural insurance:
Precise agricultural insurance pricing based on time-space risk adjustment can guarantee the fairness and sustainability of the insurance market by, for example, reducing adverse selection, and the insurer or government can assess the fairness of premium ratemaking through the findings of this research. Time-varying risk adjustments and the expansion of underwriting can greatly reduce pure and safety premium rates, which supports the sustainable commercial operation of agricultural insurance by, for example, improving demand and supply. In addition, these research results help clarify the relationship between the pure rate and safety rate and that between government and market risk liability and provide a reference for the sustainability of a catastrophe management system.

Author Contributions

Conceptualization, literature review, methodology, writing, and editing by X.L.; initial assessment, review, funding acquisition, project administration, and supervision by J.R.; software and visualization by B.N.; data collection, article collection, and model by H.W. All authors have read and agreed to the published version of the manuscript.

Funding

This research was funded by the National Nature Science Foundation of China and Beijing Social Science Foundation, grant numbers 71873129 and 19GLA002.

Acknowledgments

The authors thank Yinyin Yang (Zhengzhou University), Ruihua Yang (China Agricultural University), and Shisen Li for their technical advice and thank the anonymous reviewers for their detailed and constructive comments.

Conflicts of Interest

The authors declare no conflict of interest.

Appendix A

Figure A1. Growth of premiums, indemnity, and agricultural insurance companies in China. (a) Agricultural insurance premiums, indemnity, and the simple ratio of indemnity; (b) number of agricultural insurance companies (AC) whose agricultural insurance companies premium income exceeds 100 million yuan (AC-100), and the proportion of agricultural insurance premiums in property insurance (AC-proportion).
Sustainability 12 02491 g0a1
Figure A2. Yield trend under loss symmetry and loss asymmetry.
Sustainability 12 02491 g0a2
Figure A3. Trend of the Pearson correlation coefficient of grain yield with distance at the county level in Hebei. (a) Detrended grain yield correlation coefficient for the entire year; (b) detrended grain yield correlation coefficient for the loss year. The loss-year positive correlation disappeared around 600 kilometers, which is close to the 640 kilometers reported in Goodwin [15] and Stohs [43].
Sustainability 12 02491 g0a3

References

  1. Tuo, G.; Li, H. Some Thoughts on Improving China′s Agricultural Insurance System. China Insur. 2019, 8–17. [Google Scholar] [CrossRef]
  2. Zhang, Q.; Wang, K.; Li, Y.; Wang, Y. On the Current situation and Problems of Risk Protection of Agricultural Insurance in China and Relevant Suggestions. Insur. Stud. 2019, 3–18. [Google Scholar] [CrossRef]
  3. Ministry of Finance of the People′s Republic of China. Notice on Printing and Distributing the Guiding Opinions on Accelerating the High-quality Development of Agricultural Insurance. 2019. Available online: http://www.mof.gov.cn/mofhome/jinrongsi/zhengwuxinxi/zhengcefabu/201910/t20191012_3400537.html (accessed on 18 January 2020).
  4. Tuo, G.; Zhu, J. Several Issues to be Solved for Improving on the Agricultural Insurance System in China. Insur. Stud. 2014, 44–53. [Google Scholar] [CrossRef]
  5. Miranda, M.J.; Glauber, J.W. Systemic Risk, Reinsurance, and the Failure of Crop Insurance Markets. Am. J. Agr. Econ. 1997, 79, 206–215. [Google Scholar] [CrossRef]
  6. Ye, T.; Hu, W.; Barnett, B.J.; Wang, J.; Gao, Y. Area Yield Index Insurance or Farm Yield Crop Insurance? Chinese Perspectives on Farmers′ Welfare and Government Subsidy Effectiveness. J. Agr. Econ. 2019, 71, 144–164. [Google Scholar] [CrossRef] [Green Version]
  7. Bao, L.; Jiang, S. A Research on the Mechanism of Agricultural Insurance Catastrophe Risk Dispersion. Insur. Stud. 2019, 36–51. [Google Scholar] [CrossRef]
  8. He, X.; Wang, K. Justification and Path Selection for Public Finance to Support the Risk Diversification Mechanism of Agriculture Insurance. Issues Agric. Econ. 2013, 34, 36–40. [Google Scholar] [CrossRef]
  9. Ouyang, Y.; Li, Z. Adverse Selection, Systematic Risks and Sustainable Development of Policy Agricultural Insurance. Insur. Stud. 2010, 4, 66–71. [Google Scholar] [CrossRef]
  10. Coble, K.H.; Knight, T.O.; Pope, R.D.; Williams, J.R. Modeling Farm-Level Crop Insurance Demand with Panel Data. Am. J. Agr. Econ. 1996, 78, 439–447. [Google Scholar] [CrossRef]
  11. The People′s Republic of China. National Climate Change Adaptation Strategy. Available online: http://www.gov.cn/gongbao/content/2014/content_2620283.htm (accessed on 2 January 2020).
  12. Zhu, Y.; Goodwin, B.K.; Ghosh, S.K. Modeling Yield Risk under Technological Change: Dynamic Yield Distributions and the U.S. Crop Insurance Program. J. Agric. Resour. Econ. 2011, 36, 192–210. [Google Scholar]
  13. Weng, C.; Porth, L.; Tan, K.S.; Samaratunga, R. Modelling the Sustainability of the Canadian Crop Insurance Program: A Reserve Fund Process Under a Public–Private Partnership Model. Geneva Papers Risk Insur. Issues Pract. 2017, 42, 226–246. [Google Scholar] [CrossRef]
  14. Liu, B.; Mei, X. Theory and Practice of Agricultural Insurance; Science Press: Beijing, China, 2010; pp. 189–193. [Google Scholar]
  15. Goodwin, B.K. Problems with Market Insurance in Agriculture. Am. J. Agr. Econ. 2001, 83, 643–649. [Google Scholar] [CrossRef]
  16. Tack, J.B.; Ubilava, D. Climate and Agricultural Risk: Measuring the Effect of ENSO on U.S. Crop Insurance. Agr. Econ. Blackwell 2015, 46, 245–257. [Google Scholar] [CrossRef]
  17. Shen, Z.; Odening, M. Coping with Systemic Risk in Index-Based Crop Insurance. Agr. Econ. Blackwell 2013, 44, 1–13. [Google Scholar] [CrossRef] [Green Version]
  18. Thomä, J.; Dupré, S.; Hayne, M. A Taxonomy of Climate Accounting Principles for Financial Portfolios. Sustain. Basel 2018, 10, 328. [Google Scholar] [CrossRef] [Green Version]
  19. Skees, J.R.; Black, J.R.; Barnett, B.J. Designing and Rating an Area Yield Crop Insurance Contract. Am. J. Agr. Econ. 1997, 79, 430–438. [Google Scholar] [CrossRef]
  20. Alan, P.K.; Keith, C. Modeling Conditional Yield Densities. Am. J. Agr. Econ. 2003, 85, 291–304. [Google Scholar] [CrossRef]
  21. Goodwin, B.K.; Ker, A.P. Nonparametric Estimation of Crop Yield Distributions: Implications for Rating Group-Risk Crop Insurance Contracts. Am. J. Agr. Econ. 1998, 80, 139–153. [Google Scholar] [CrossRef]
  22. Park, E.; Brorsen, B.W.; Harri, A. Using Bayesian Kriging for Spatial Smoothing in Crop Insurance Rating. Am. J. Agr. Econ. 2018, 101, 330–351. [Google Scholar] [CrossRef]
  23. Ren, J.; Li, S. Estimation of the Risk of Crop Disaster Losses in China: Method Selection and Improvement. Insur. Stud. 2017, 75–84. [Google Scholar] [CrossRef]
  24. Zhang, Q.; Wang, K. Integrated Agricultural Risk Management in China; China Agricultural Science and Technology Press: Beijing, China, 2015; pp. 75–82. [Google Scholar]
  25. Liang, L. A Comparison and Choice on the Pure Rate-making Methods of Grain Insurance in China. J. Quant. Tech. Econ. 2011, 28, 124–134. [Google Scholar] [CrossRef]
  26. Urban, D.W.; Sheffield, J.; Lobell, D.B. The Impacts of Future Climate and Carbon Dioxide Changes on the Average and Variability of US Maize Yields under Two Emission Scenarios. Environ. Res. Lett. 2015, 10. [Google Scholar] [CrossRef]
  27. Mar, S.; Nomura, H.; Takahashi, Y.; Ogata, K.; Yabe, M. Impact of Erratic Rainfall from Climate Change on Pulse Production Efficiency in Lower Myanmar. Sustain. Basel 2018, 10, 402. [Google Scholar] [CrossRef] [Green Version]
  28. Xiao, Y. Research on Actuarial Models in Agricultural Insurance; Tsinghua University Press: Beijing, China, 2018; pp. 25–26. [Google Scholar]
  29. Harri, A.; Coble, K.H.; Ker, A.P.; Goodwin, B.J. Relaxing Heteroscedasticity Assumptions in Area-Yield Crop Insurance Rating. Am. J. Agr. Econ. 2011, 93, 707–717. [Google Scholar] [CrossRef]
  30. Ker, A.P.; Tolhurst, T.N. On the Treatment of Heteroscedasticity in Crop Yield Data. Am. J. Agr. Econ. 2019, 101, 1247–1261. [Google Scholar] [CrossRef]
  31. Wang, H.H.; Zhang, H. On the Possibility of a Private Crop Insurance Market: A Spatial Statistics Approach. J. Risk Insur. 2003, 70, 111–124. [Google Scholar] [CrossRef]
  32. Okhrin, O.; Odening, M.; Xu, W. Systemic Weather Risk and Crop Insurance: The Case of China. J. Risk Insur. 2013, 80, 351–372. [Google Scholar] [CrossRef] [Green Version]
  33. Cao, N.; Yang, R.; Luo, S. A Study on Estimation of Premium for Cotton Revenue Insurance based on Clayton Copula Function. Stat. Res. 2017, 34, 92–99. [Google Scholar] [CrossRef]
  34. Paudel, Y. A Comparative Study of Public—Private Catastrophe Insurance Systems: Lessons from Current Practices. Geneva Pap. 2012, 37, 257–285. [Google Scholar] [CrossRef] [Green Version]
  35. Guyon, X. Random Fields on a Network: Modeling, Statistics and Applications; Springer: New York, NY, USA, 1995. [Google Scholar]
  36. Kaas, R.; Goovaerts, M.; Dhaene, J.; Denuit, M. Modern Actuarial Risk Theory Using R; Springer: New York, NY, USA, 2008; pp. 30–36. [Google Scholar]
  37. Huang, J.; Wang, Y.; Wang, J. Farmers′ Adaptation to Extreme Weather Events through Farm Management and Its Impacts on the Mean and Risk of Rice Yield in China. Am. J. Agr. Econ. 2014, 97, 602–617. [Google Scholar] [CrossRef]
  38. Chen, S.; Chen, X.; Xu, J. Impacts of Climate Change on Agriculture: Evidence from China. J. Environ. Econ. Manag. 2016, 76, 105–124. [Google Scholar] [CrossRef]
  39. Ren, J.; Li, X. The Impact of Crop Unit Yield Risk Distribution based on Heteroscedasticity Adjustment on Premium Rates. Insur. Stud. 2019, 74–87. [Google Scholar] [CrossRef]
  40. Ding, S.; Li, Z. Urgency and Development Path of Establishing Agricultural Insurance Catastrophe Risk Decentralization Mechanism. China Insur. 2019, 23–29. [Google Scholar] [CrossRef]
  41. Feng, W. Market Failure and Institution Supply of Agriculture Insurance in China. J. Financ. Res. 2004, 4, 124–129. [Google Scholar]
  42. Yang, R.; Sun, J. Agricultural Insurance Catastrophe Threshold Point and Risk Stratification Calculation. Stat. Decis. 2018, 34, 28–32. [Google Scholar] [CrossRef]
  43. Stohs, S.; LaFrance, J. A Learning Rule for Inferring Local Distributions over Space and Time. In Proceedings of the 2nd Annual Advanced in Econometrics Conference, Louisiana State University, Baton Rouge, LA, USA, 7–9 November 2003. [Google Scholar]
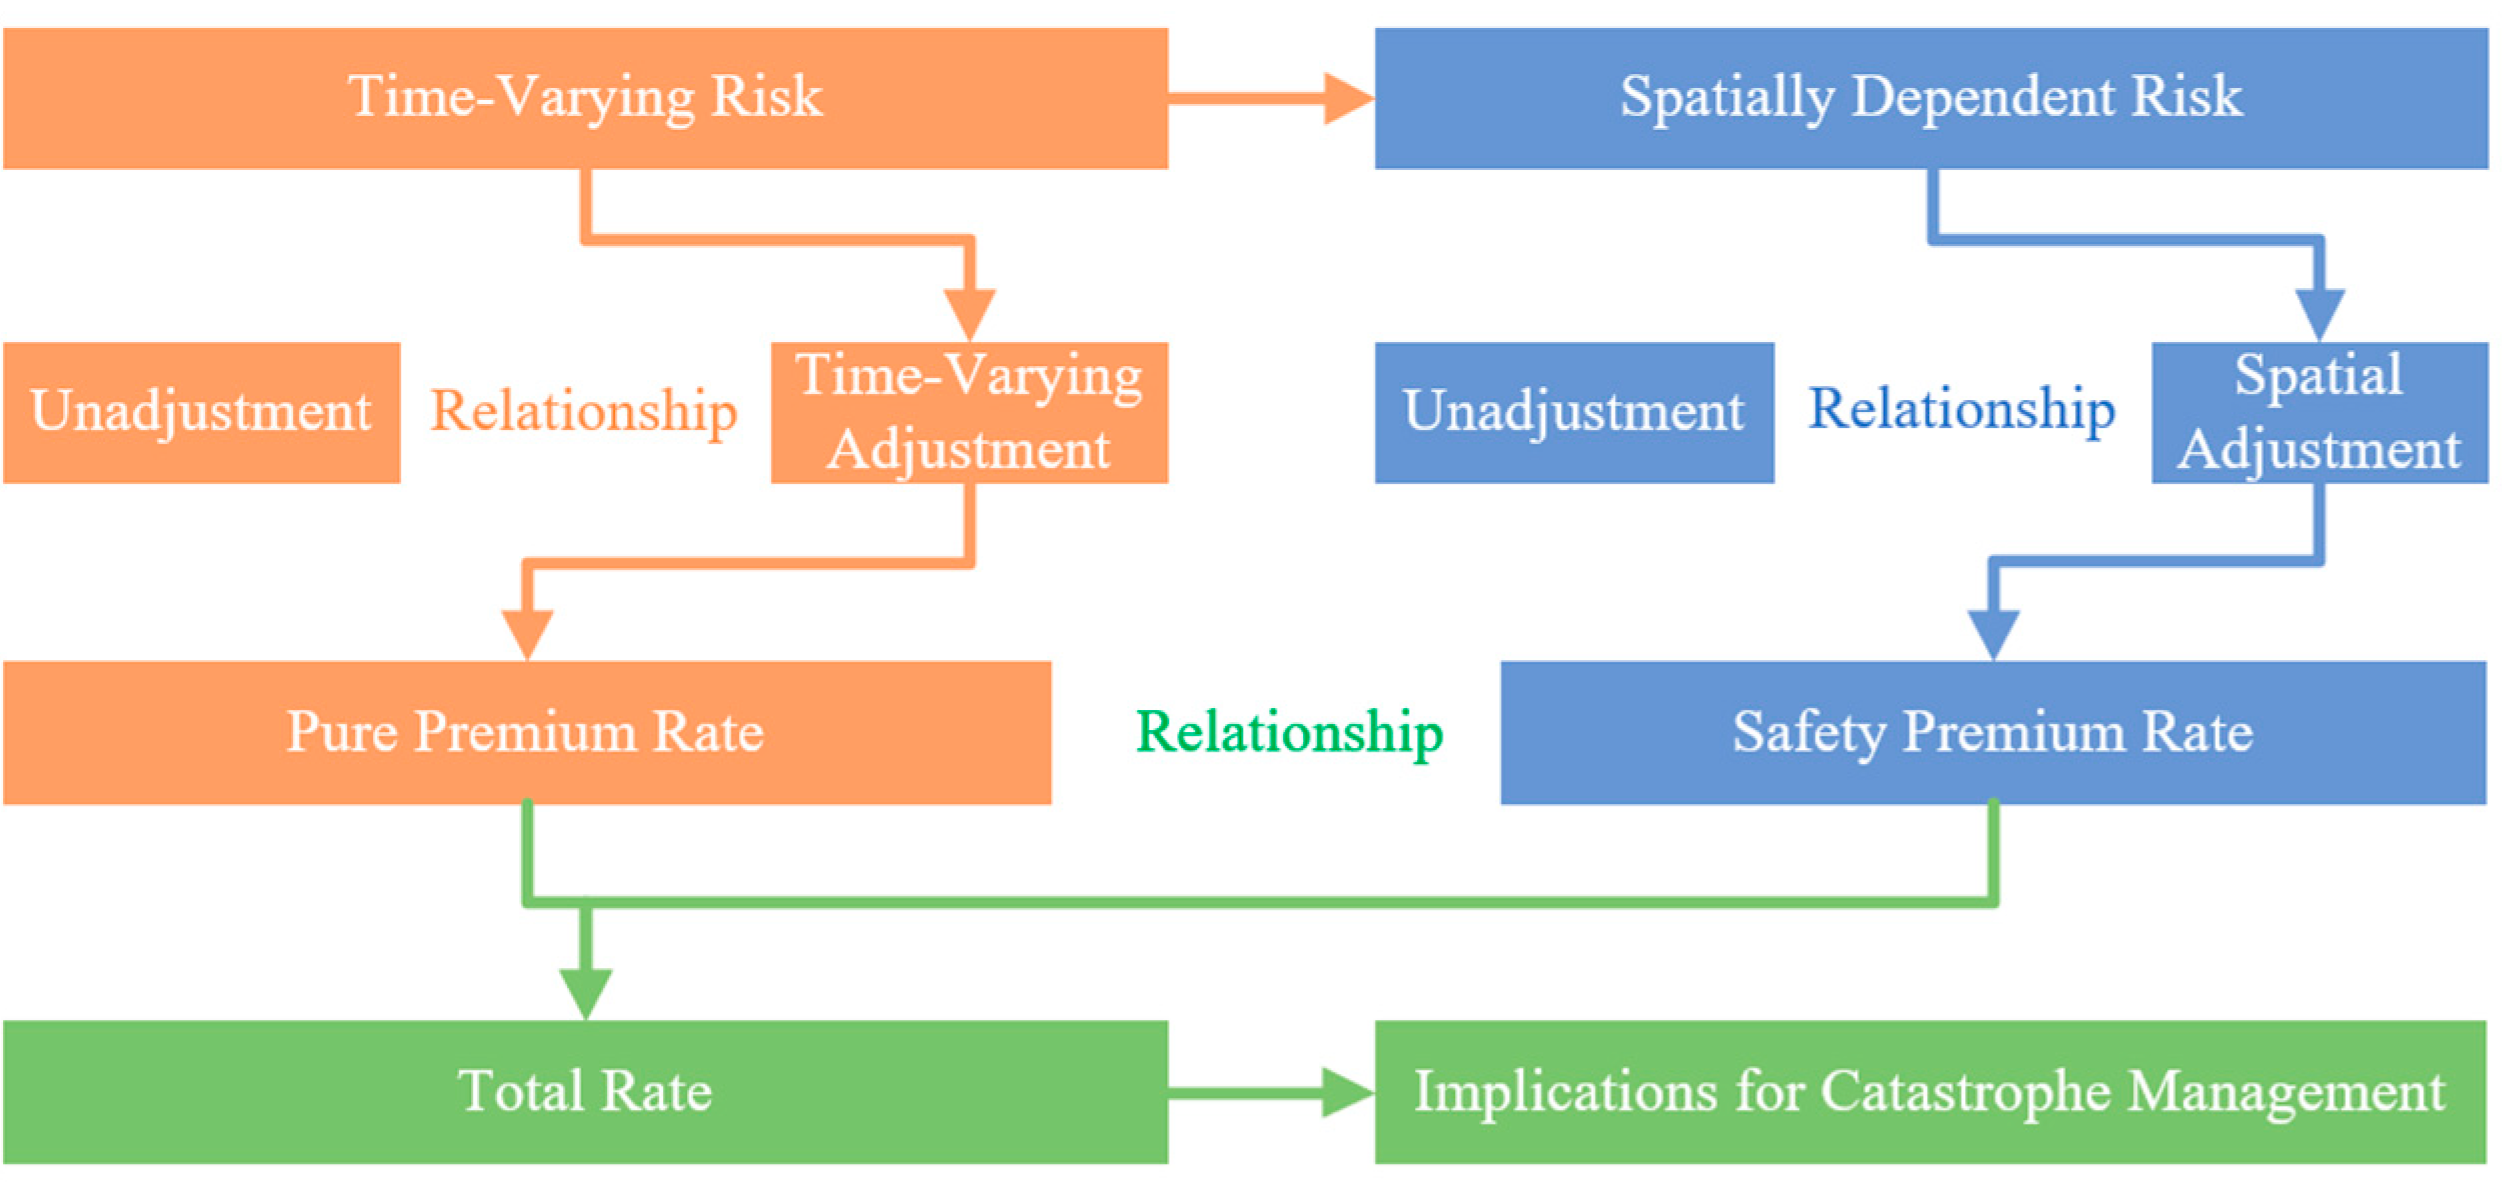
Figure 1. Schematic diagram of the research framework.
Sustainability 12 02491 g001
Figure 2. Distribution1 of θ ^ values in Hebei and Hunan. 1 Vacant areas with white color are non-sample counties. The darker the color, the faster the risk increases with time.
Sustainability 12 02491 g002
Figure 3. Pure rates1 distribution of 625 counties under different adjustment forms. 1 The average rate reduction through θ ^ adjustment and partial adjustment is 1.57% and 0.63%.
Sustainability 12 02491 g003
Figure 4. Adjusted and unadjusted loading factor decomposition. (a) unadjusted loading factor decomposition; (b) adjusted loading factor decomposition.
Sustainability 12 02491 g004
Table 1. Descriptive statistics of counties, the land area of each province, and the grain yield per unit area (YPUA) of the counties.
ProvinceCounties (n)Area
(10,000 km2)
Yield Per Unit Area (kg/Ha)
AverageMaxMin
Henan10816.70 5281.32 7714.33 2880.42
Hebei13518.88 4795.66 7675.55 1185.47
Shanxi11215.67 3642.67 7258.71 1029.40
Hunan11721.18 5613.70 7348.39 3163.69
Jilin4018.74 6052.16 9992.24 2859.93
Zhejiang5510.18 5400.06 6626.36 3757.63
Fujian5812.40 4973.71 6265.97 3950.41
All625113.754976.23 9992.24 1029.40
Table 2. Estimated results of the time-varying risk adjustment coefficient θ 1 (5% significance level).
ProvinceSig-num 2Ratio 3Total- θ ^ Sig- θ ^
n θ ^ > 2 θ ^ < 2
Henan3413331.48%−6.444−9.002
Hebei2391417.04%−0.3000.051
Shanxi3643232.14%−3.297−6.473
Hunan2291318.80%−4.180−11.806
Jilin113827.50%−4.068−5.531
Zhejiang96316.36%0.5951.211
Fujian1111018.97%−4.398−20.781
All1463311323.36%−3.163−7.371
1 In the condition that both β and δ are significant in Equation (4), θ ^ = β   ^ + δ ^ . Otherwise θ ^ = β   ^ , where β   ^ is estimated by l n ( e ^ i t 2 ) = φ i + β i l n ( y ^ i t ) + ϵ i ; 2 “Sig-num” refers to the number of counties with significant estimates in Equation (4); 3 the “ratio” is the ratio of significant counties to total counties.
Table 3. Pure premium rate (%), safety premium rate (%, α = 0.05 ), and total rate (%).
Rate StylesPv-1 1Pv-2Pv-3Pv-4Pv-5Pv-6Pv-7Average Diff 2
Pure premium rate 32.854 3.588 4.322 3.792 3.996 3.776 3.601 0.568
Adj 4-pure premium rate2.289 3.114 3.626 3.230 3.382 3.229 3.083
Loading factor1.659 1.204 0.954 0.842 0.787 0.747 0.735 0.029
Adj-safety factor1.742 1.180 0.912 0.790 0.734 0.689 0.680
Safety premium rate4.735 4.321 4.123 3.191 3.146 2.822 2.647 0.665
Adj-safety premium rate3.987 3.676 3.307 2.552 2.482 2.227 2.097
Total rate7.588 7.909 8.446 6.983 7.141 6.598 6.248 1.233
Adj-total rate6.276 6.790 6.933 5.781 5.864 5.456 5.180
Total rate diff1.312 1.119 1.513 1.202 1.277 1.142 1.068 1.233
1 “Pv-number” refers to the number of sample provinces added in sequence. 2 Diff means the difference between the partial adjusted rates and rates adjusted by “θ = 2”. 3 The overall pure rate π a is slightly different from the average π i a rate obtained in 3.1. In the practical application of county grain yield index insurance, the total rate should be obtained from the county pure rate plus the safety rate. 4 Adj means time-varying risk partial adjustment.
Table 4. Comparison of θ ^ values obtained from quadratic and Locally Weighted Scatterplot Smoothing (Lowess) regression.
Detrending Model (Significant Level)Sig-numInsig-num 1Total- θ ^ Sig- θ ^
num θ ^ > 2 θ ^ < 2RationumRatio
Quadratic (5%)1462911723.36%47976.64%−3.163−7.371
Lowess 2 (5%)1802815228.80%44571.20%−4.437−9.045
Consistency 3 (5%)68.49%55.17%71.80%83.3%
Quadratic (10%)1944514931.04%43168.96%−3.163−6.035
Lowess (10%)2324119137.12%39362.88%−4.437−8.137
Consistency (10%)73.20%57.7877.85%79.1%
1 “Insig-num” refers to the number of counties with insignificant estimates in Equation (4), the meanings of “sig-num” and “Ratio” are same as for Table 2; 2 there are 11 asymmetric counties with both significant β   ^ and δ ^ under the Lowess model, eight of which are negatively skewed. 3 Consistency ratio: (Quadratic ∩ Lowess)/Quadratic.
Table 5. Differences between the unadjusted rate results and the rates adjusted by “θ = 2” and θ ^ .
Unadjust 1-“θ = 2”Unadjust-“ θ ^ θ = 2”-“ θ ^
All counties (625)00.016*** 20.017***
Sig counties (146)00.027***0.027***
1 Unadjusted rates were calculated by averaging the annual loss ratio. 2 Asterisk *** indicates that the pair-T test is significant at the 1% level.