Article

GIS Based Assessment and Design for Areas Vulnerable to Soil Disasters: Case Study of Namhyeun-dong, South Korea

1
Interdisciplinary Program in Urban Design, Seoul National University, Seoul 08826, Korea
2
Department of Landscape Architecture and Rural Systems Engineering, Seoul National University, Seoul 08826, Korea
3
Research Institute of Agriculture and Life Sciences, Seoul National University, Seoul 08826, Korea
4
Interdisciplinary Program in Landscape Architecture, Seoul National University, Seoul 08826, Korea
*
Author to whom correspondence should be addressed.
Sustainability 2020, 12(6), 2516; https://doi.org/10.3390/su12062516
Submission received: 10 January 2020 / Revised: 20 March 2020 / Accepted: 20 March 2020 / Published: 23 March 2020

Abstract

:
Due to climate change, heavy rainfall events that trigger landslips are becoming common. This study investigates patterns in the soil’s response to major rainfall events in mountainous areas and proposes a new approach for resilient disaster prevention technology and recovery based on the effect of soil runoff. Namhyeon-dong within Seoul was selected for the case study because of its vulnerable location between two mountains. A master plan was developed to cope with the predicted soil runoff based on the annual rainfall, local land use and a series of 10-year forecasts covering the period from 2021 to 2100. A total of 22 catchments in the study area were analyzed with Arc Hydro, an ArcGIS plug-in and appropriate technologies proposed to deal with the soil runoff likely to be experienced in each catchment in an extreme disaster. The resulting model was deemed adequate to deal with disasters during the period predicted to represent the highest risk, 2051–2060. The study’s findings will help to forecast disasters from flood that could impact residential areas in mountainous regions, to predict the magnitude of potential soil disasters in individual regions and develop design guidelines for disaster prevention technology based on the predicted amount of soil runoff.

1. Introduction

Natural disasters such as floods, earthquakes, etc., have been increasing all over the world due to climate changes and human activities. In South Korea, more than 50 percent of the annual precipitation falls during the summer season [1]. The irregular, sudden and heavy rainfall events frequently trigger disasters such as flood and landslides, resulting in serious damage that is increasing in scale every year. According to the IPCC (Intergovernmental Panel on Climate Change) [2], these problems will continue to increase; the rate of climate change is accelerating at an increasingly rapid pace [2]. The climatic projections indicated that future heavy rainfall would damage human lives, agriculture and economies [3]. Therefore, it is inevitable to identify areas susceptible to floods in order to minimize the loss of human lives and infrastructures [4]. Government agencies at both the local and national levels, therefore, need to implement active adaptation policies that support resilience in vulnerable communities. Since the IPCC report was published in 2014, the Korean government has adopted its climate change scenarios as a basis for its efforts to research specific ways to cope more effectively with disasters and conduct a national vulnerability analysis [5]. Recent events such as earthquakes in Pohang City and Gyeonju City and wildfires in Inje City have inflicted massive damage. Once a natural environment has been damaged, it is more likely to suffer further damage in the event of another disaster due to shifts in local environmental factors such as ground cover and the type of vegetation. Since the frequency of disasters is expected to increase in the next few decades, the importance of implementing adaptive measures in advance of the initial disaster that could prevent or mitigate its impact is clear.
This study focuses on soil-related disasters. Almost all such events are triggered by an external force, such as an intense rainfall event or an earthquake. For instance, prior to the 2011 Umyun mountain landslide in Seoul City, the amount of rain that fell during the month of July exceeded 60% of the normal total annual rainfall in the area [1]. This massive urban landslide cost 16 lives and inflicted major structural and property damage. This shows the necessity for research on possible adaptation measures as well as ways to raise the awareness of the local population regarding potential hazards [6]. The damage caused by landslides is exacerbated by the ignorance of the general public regarding these events, which occur only infrequently. It can therefore be a starting point for efforts to limit the damage caused by such disasters at the local level by not only preparing for large-scale disasters but also taking steps to reduce local vulnerabilities by managing the outflow of small soil runoff [7]. Soil disasters occur most frequently in mountainous areas, but the great majority of the damage in terms of lives lost and property damaged occurs in nearby residential areas. South Korea is particularly vulnerable to such events: More than 60% of the country is hilly, including the capital Seoul, and the high cost of land has led to the active development of residential communities in the hills surrounding the city. In this study, we therefore investigate the effectiveness of various options for mitigating the impact of soil disasters, focusing on the types of disasters experienced in the mountain communities in and around Seoul where people live and the kinds of damage suffered by different types of housing and land use [8]. In order to select the disaster prevention technologies that are best suited to the local conditions and will help communities recover from soil disasters in mountainous areas that are triggered by rainfall, we must first understand the scale of the problem, the types of technology that are best suited to the local conditions and where the facilities should be located [9]. There have been several studies regarding the planning and analysis for resilient urban areas through spatial planning and strategies.
Soil runoff and loss are mostly caused by complex internal factors. The analysis, therefore, is conducted considering internal factors, which is reference value or weights. Most of them was analyzed using RUSLE model [10]. Amiya et al. [11] evaluated the soil loss in the watershed by building a frequency ratio (FR) model with RUSLE model. Quantified losses were estimated through environmental requirements in terms of annual soil losses predicted by the RUSLE. The areas having the disaster potential were predicted with high risk of soil loss from the FR model in the Pathro River basin in India. Kim [12] attempted to estimate the amount of soil loss in the Sapkyo Basin, located in Dangjin city, South Korea, using GIS (Geographic Information System) and RUSLE (Revised Universal Soil Loss Equation). Using the spatial data in the watershed, she analyzed the loss amount according to the final point by adding the similar movement process to the loss formula [12]. Most studies using RUSLE, however, have done an in-depth analysis of the watersheds of detailed forest streams and lakes. In addition, technologies to prevent such loss tend to aim at reducing non-point pollution of rivers or the discharge of pollutants, rather than the possibility of soil damage. On the other hand, Tang et al. [8] conducted the study on the characteristics and causes of landslides induced by rainfall, which are the main triggers rather than internal factors. Their studies [8] verified the effect of rainfall conditions on landslides through spatial data analysis. Hwang and Ham [13] examined the effect of the weighted rainfall on landslides according to the time and verified the adequacy of existing forecasting systems. In order to estimate the degree of risk for forecasting criteria, the influence of each factor was identified. Currently, the landslide trigger is based on rainfall warnings and alarms in South Korea, but the actual landslide threshold is somewhat different. In addition, there is a research trend to evaluate the spatial distribution using landslide history information. Cha et al. [14] analyzed the risk of landslides caused by torrential rain by collecting heavy rainfall trend data in the metropolitan area. The impact factors were divided into geospatial and meteorological factors to consider the geological and climate characteristics. Rather than presenting specific alternatives or implementation plans for the forecasts, the vulnerabilities were clarified around forecasts and impacts. Woo et al. [6] regressed the landslide occurrence history information in order to derive weighting factors and to construct a national landslide risk map. The factors used in the analysis were derived mainly from the internal factors of the place of origin based on the existing occurrence history.
However, there are still lack of the detailed analyses for the effects and design guidelines for soil disaster prevention methods [15,16,17]. Most studies [6,8,13,14] related to soil loss in watersheds focused on small watersheds and sites and used their own factors or weighted values, which have relatively huge variations. This is because there were limited data for the topographical factors and the external factors that causing the occurrence. Therefore, it is necessary to investigate the major causes and look for alternatives options to minimize the soil disasters.
The purpose of this study is thus to quantify and analyze the effects of disaster mitigation technologies and disaster prevention technologies developed to mitigate the impact of soil disasters and help communities to adapt to disasters in advance. Ultimately, we aim to find the optimum balance between the engineering and urban design aspects by constructing a specific response at the urban level that is beneficial to the residents, minimizing the damage inflicted by soil disasters on communities in mountainous areas by implementing appropriate measures in advance.

2. Materials and Methods

2.1. Study Area and Data

The case study at the heart of this research was Namhyeon-dong, a community with a population of a little over 17,000 people located in the Gwanak-gu administrative subdivision of Seoul (Figure 1). Its name translates as “southern mountain pass”, which gives a good indication of the local terrain and why it was chosen for this study. Our initial site analysis of its landslide risk revealed a high level of risk but also high data availability, placing it among the most densely populated living zones in Seoul. The rainfall projections over the study period, namely the eight decades from 2021 to 2100, were calculated based on the weather history information supplied by the Namhyeon-dong Observatory and the worst case value, RCP (Representative Concentration Pathway) 8.5, used in the IPCC’s 2014 Climate Change Scenarios [2]. Here, RCP represents for Representative Concentration Pathway defined by IPCC, and RCP 8.5 scenario imply that emissions continue to rise throughout the 21st century.
In order to predict the amount of soil runoff, the target site was first classified into a set of catchment areas using the Arc GIS Program. After the amount of rain falling on the site was calculated, the discharge characteristics of the individual catchment areas were identified [18]. Finally, the optimum scale and arrangement of disaster prevention technology was proposed by separating the catchment areas into zones based on the relationships between them to define the final catchments. Data on the amount of rainfall and the local soil characteristics are important when calculating the soil discharge properties, this study utilized three-year monitoring data for Busan City and Sejong City as no suitable measurements were available for Namhyeon-dong [19]. Appropriate disaster prevention technologies and procedures that could be deployed to reduce the impact of soil disasters and minimize the damage caused in residential areas across each catchment area were then determined and their potential impacts examined. The discharge of soil from the catchment was quantified based on the RCP 8.5 projections. The study scheme is shown in Figure 2. The research is divided into four stages: Catchment classification, determination of the design capacity, prediction of soil runoff and design proposals.
The first step is to define the catchment areas, which are the standard units used for installing the technology [20]. The initial analysis of the individual catchments becomes the basis for the subsequent technology installations, establishing the spatial arrangement of the various disaster prevention technologies utilized. Depending on the design scale, the capacity of each technology is determined by the size of the individual catchments, the amount of rainfall and soil runoff each experience. The next step is to calculate the design flow rate by considering the rainfall intensity per hour, duration (24 h) and the catchment land use. In this study, rainfall factors were set as an external factor for each soil disaster event predicted first using the rational formula described below. The third step is to predict the discharge rate of the soil in each catchment in the area surrounding Namhyeon-dong according to the RCP 8.5 scenario path for climate change with time in that catchment, with the resulting soil discharge being added to the value of the daily runoff expected each year, along with an appropriate layout and scale. Finally, the capacity of anti-disaster technology required for each catchment is determined based on the predicted amount of soil runoff per year, again with an appropriate layout and scale.

2.2. Rational Formula for Rainfall Runoff

In order to predict the amount of soil runoff, the volume of the rainfall outflow must be calculated. The flow rate was estimated using the rational method [21] for the estimation of design surface runoff, because rainfall outflow in mountainous and buffer areas are the basis commonly utilized for soil quantity predictions [22]. The rational formula, which is widely used to measure the capacity of watersheds in civil engineering [21], is applied here because the watersheds targeted in this study cover a wide area. This is not limited to cities or forests and also can be subdivided into individual ownership units to calculate the flow amounts [23].
Rainfall discharge refers to the amount of water flowing across a saturated surface without being absorbed by the ground once a certain volume of rain has fallen on a given basin area [24]. Among the models used to calculate the design flow rate when selecting appropriate technology for mountainous areas, the most widely used was first proposed by [21] to calculate the maximum flood quantity, which Kuichling [25] then developed to standardize measurement zones in the United States. The model takes into account the strength of the runoff, the rainfall intensity, the size of the basin and the time taken to reach full capacity [26]. The maximum planned quantity ( m 3 ) method, known as the LauErrberg Method, is generally used in South Korea [27].
Below is the basic rational formula for rainfall [18]:
Q s = 1 360 × C r × I × A
where Q s is the runoff rate of rainfall from the catchments (m3/s); C r is the rainfall coefficient; I is the maximum precipitation (rainfall intensity) ( mm / h ); and A is the size of the catchment ( ha ) .
Equation (1) yields the maximum planned quantity of the volume released by the hourly rainfall intensity. Because the volume of soil displaced is generally due to the cumulative effect of multiple rainfall events, the amount of time was multiplied by a constant representing the number of times. The units are based on the amount of runoff ( Q d ) over a 23 h period.
This gives us a rational formula multiplied by a time factor for the rainfall:
Q d = 60 × 60 × 24 × Q s ,   Q d = 240 × C r × I × A
where Q d is the total amount of the rainfall runoff from the catchments ( m 3 / day ) .
The amount of rainfall runoff that could occur in the catchment area ( ha ) when the rainfall intensity is modified as shown in Equation (2) is then obtained by multiplying the time constant 60 (s) × 60 (min) × 24 (h) or 86,400.
For the rainfall runoff coefficient ( C r ) , the range is divided according to the type of land use within the watershed (Table 1) [28].

2.3. Evidence-Based Soil Data Analysis Methods

The criteria for the soil effluent vary considerably depending on a number of complex factors such as texture, slope and forest physiognomy. This data was not available for the study site, so for the purposes of this study the coefficient used to predict the soil discharge rate was established using data recorded at sites with very similar conditions. Data for six sites in Busan and Sejong, which have similar topographical and soil environments to those in Namhyeun-dong, were averaged and the results used for these calculations.
The field data (Appendix A: Table A1) were collected for an area of 65,000 m 2 in the Mandeok-gu neighborhood in Busan and five residential sections of Sejong. Measurements were conducted from 2016 to 2018. The amount of rainfall and soil released to surface water during rainfall events in the area shown in Table A1 are the average of all the values measured in each catchment.
The value was measured ‘at least once a month’ in the rainy day during the period from April to October, every year. For each day, the total amount of rainfall ( m 3 / day ) leaked within the catchment area, the actual rainfall runoff ( m 3 / day ) derived through the rational formula and the amount of soil runoff ( m 3 / day ) were recorded. Thus, the ratio of soil that could be outflowed per unit volume was suggested by calculating the ratio to soil based on the amount of runoff in the solid rain.
The total amount of rainfall ( m 3 ) occurring within the same area was obtained based on the assumption that the daily volume falling in the basin would be uniform across the target area, which would provide conservative and reasonable results. The predicted total amount of catchment rainfall was then divided by the measured rainfall outflow per day to obtain the outflow ratio; the coefficient was calculated by dividing this ratio by the amount of the rainfall runoff per day [14].
The enhanced soil runoff prediction model (SRP) derived by the rainfall rational formula therefore becomes:
  S n = Q d × C s
where S n is the average daily soil runoff in Year n ( m 3 / day )   and   C s is the coefficient for the soil runoff:
E = Y s X s × 100
where X s is the amount of the soil runoff in the present time ( m 3 / day ); and
Y s = i = 1 n Y si
where   Y s = S n X s   ( m 3 / day ) , the target (or additionally required) capacity of the technologies ( m 3 / day ); Y si is the capacity of each technology ( m 3 / day ); i indicates the type of technology; and E is the effectiveness of the installed technologies (reduction ratio of the soil).
The total effect ( E ) of the technologies is expressed as the percentage of soil runoff that is reduced by the application of the individual prevention technologies minus the soil runoff that is likely to occur under normal conditions during the same period of time. The overall performance of the combined prevention technologies ( Y s ) is the sum of the impact of each individual technology calculated based on the soil effluent. The equation for calculating the soil runoff ( S n ) multiplies the coefficient of soil runoff obtained through observation in the rational formula, which is designed specifically for rainfall runoff. The coefficients obtained ranged from 0.002 to 0.0051 (Table A1). The median of the distribution average and maximum values of the overall monitored data was determined to be:
C s = 0.0042
On average, the threshold for the type of daily rainfall that can lead to large-scale soil disasters such as landslides is from 150 mm to 200 mm [13]. Since the maximum distribution of the rainfall measured never exceeds 180 mm per day, the range of measured rainfall values is limited in predicting the soil values due to extreme rainfall and the same coefficient values are therefore assigned for values greater than 180 mm . In order to take into account the characteristics of the soil runoff, a simplification was utilized to enable the soil runoff coefficient to be applied over broad regions by setting the coefficient based on the type of land use.

2.4. Catchment Analysis Method

Reliable prediction of river flow in catchment is very important due to its complex nature, particularly highly non-linearity [29]. Based on the Digital Elevation Model (DEM), which represents terrain’s surface produced by 3D graphic tools, the data extracted from the contour lines in each of the catchments in the study site was assessed using a hydrologic analysis methodology. After that, the direction of the water flow across the catchment area was assessed based on the slope [30]. The ArcHydro plug-in of the ArcGIS program [31] is mainly used for hydrology, but here, we used it to analyze the effects of rainfall in mountainous regions [32]. For the DEM, the minimum unit (cell size) of Raster data was set to 2.5 m in order to analyze section lengths of the unit grid of elevation data that were larger than the average section length of buildings in the area [33,34]. Figure 3a shows the algorithm chart for the ArcHydro plug-in used in this analysis.
The D8 algorithm adopted in this study is the most commonly used methodology for evaluating the flow direction based on eight neighbor connectivity, where the flow is directed to one of its neighboring cell with the steepest downwards [35,36]. Therefore, a limitation of this Algorithm is to restrict a flow into only one of eight possible directions [37]. Alternatively, the D-Infinity algorithm [38] can compute a multiple flow direction, which allow continuous flow angles but induce another potential problem, over-dispersion. Therefore, our study based on D8 algorithm would provide a conservative (or overestimated) flow volume, which results in the enhanced safety factor for soil-disaster prevention design.
Figure 3a shows the detailed sequence of the method in ArcHydro [31]. By setting up the model for the catchment based on the hydrologic analysis, the individual catchments can be determined as the procedure shown in Figure 3b. Firstly, any lost portion of DEM layer was filled, where the cell value remains empty as the DEM was created. The hydrologic analysis was carried out after modifying the DEM. Secondly, the flow direction was evaluated according to the height values of filled DEM data, which is raster format. Thirdly, the stream area was defined according to the flow way, and the flow accumulation was detected. After that, the water flow directions, which contains the paths of local rivers and the drainage paths, were analyzed. The analysis of the topographical data can be adjusted to take into account the size of the catchment. Some sections within the boundaries of the administrative region do not appear as some of the catchment lies along a province boundary, which affects the overlay of the resulting values. The catchments excluded from the analysis were thus also excluded from the preliminary analysis because they did not have a slope that directly affects the Namhyeon-dong community in Gwanak-gu.

3. Results

3.1. Results of the Catchment Analysis

The results of the analysis with Arc GIS’s Hydro plug-in are presented in Figure 4. There are 17 catchment areas within the boundary of the Namhyeon-dong administrative region, four catchments that overlap with Bangbae-dong in Seocho-gu and one catchment that overlaps with Gwacheon in Gyeonggi Province, for a total of 22 catchment areas. Catchments with areas of less than 1 ha were combined with adjacent catchments for convenience. The catchments were divided into upper, middle and lower sections based on their elevation and the slope direction in the area. Given the problems revealed by the pre-site survey, the scope was limited to mountainous areas and catchments adjacent to residential areas.
The causal relationship between each basin was analyzed and the results are shown in Figure 5, separating out the elevation and gradient results. Given that the path taken by any soil movement consists of a combination of erosion, migration and retreat from the top, the affected areas can be calculated under the following set of assumptions:
  • First assumption: The soil is carried along with the heavy rain.
  • Second assumption: The soil moves from high to low elevation.
  • Third assumption: The soil in one catchment moves in the same direction as the slope.
  • Fourth assumption: The damage caused by the soil is greater in heavily populated residential areas than in unoccupied mountainous areas.
The irregular, sudden and heavy rainfall events frequently trigger disasters such as flood and landslides. The Korea Meteorological Administration defines heavy rain as a case when rainfall is more than 90 mm for three consecutive hours or 12 h of rainfall over 120 mm [39].
As the soil descends into lower parts of the Namhyeon-dong catchment, the flow is largely towards the northeast. As a result, identifying causality is important for subsequent technological installations because from a long-term perspective, the spill impact zone has expanded and the extent of the adjacent catchments affected now also extend from the mountain to include residential areas. The point at which the landslide debris halts is now effectively just a lower part of the mountain area, as the soil mass from the upper part of the spill catchment has moved downhill. This affects the response, as it depends to a great extent on the type of area and the movement of the soil mass.

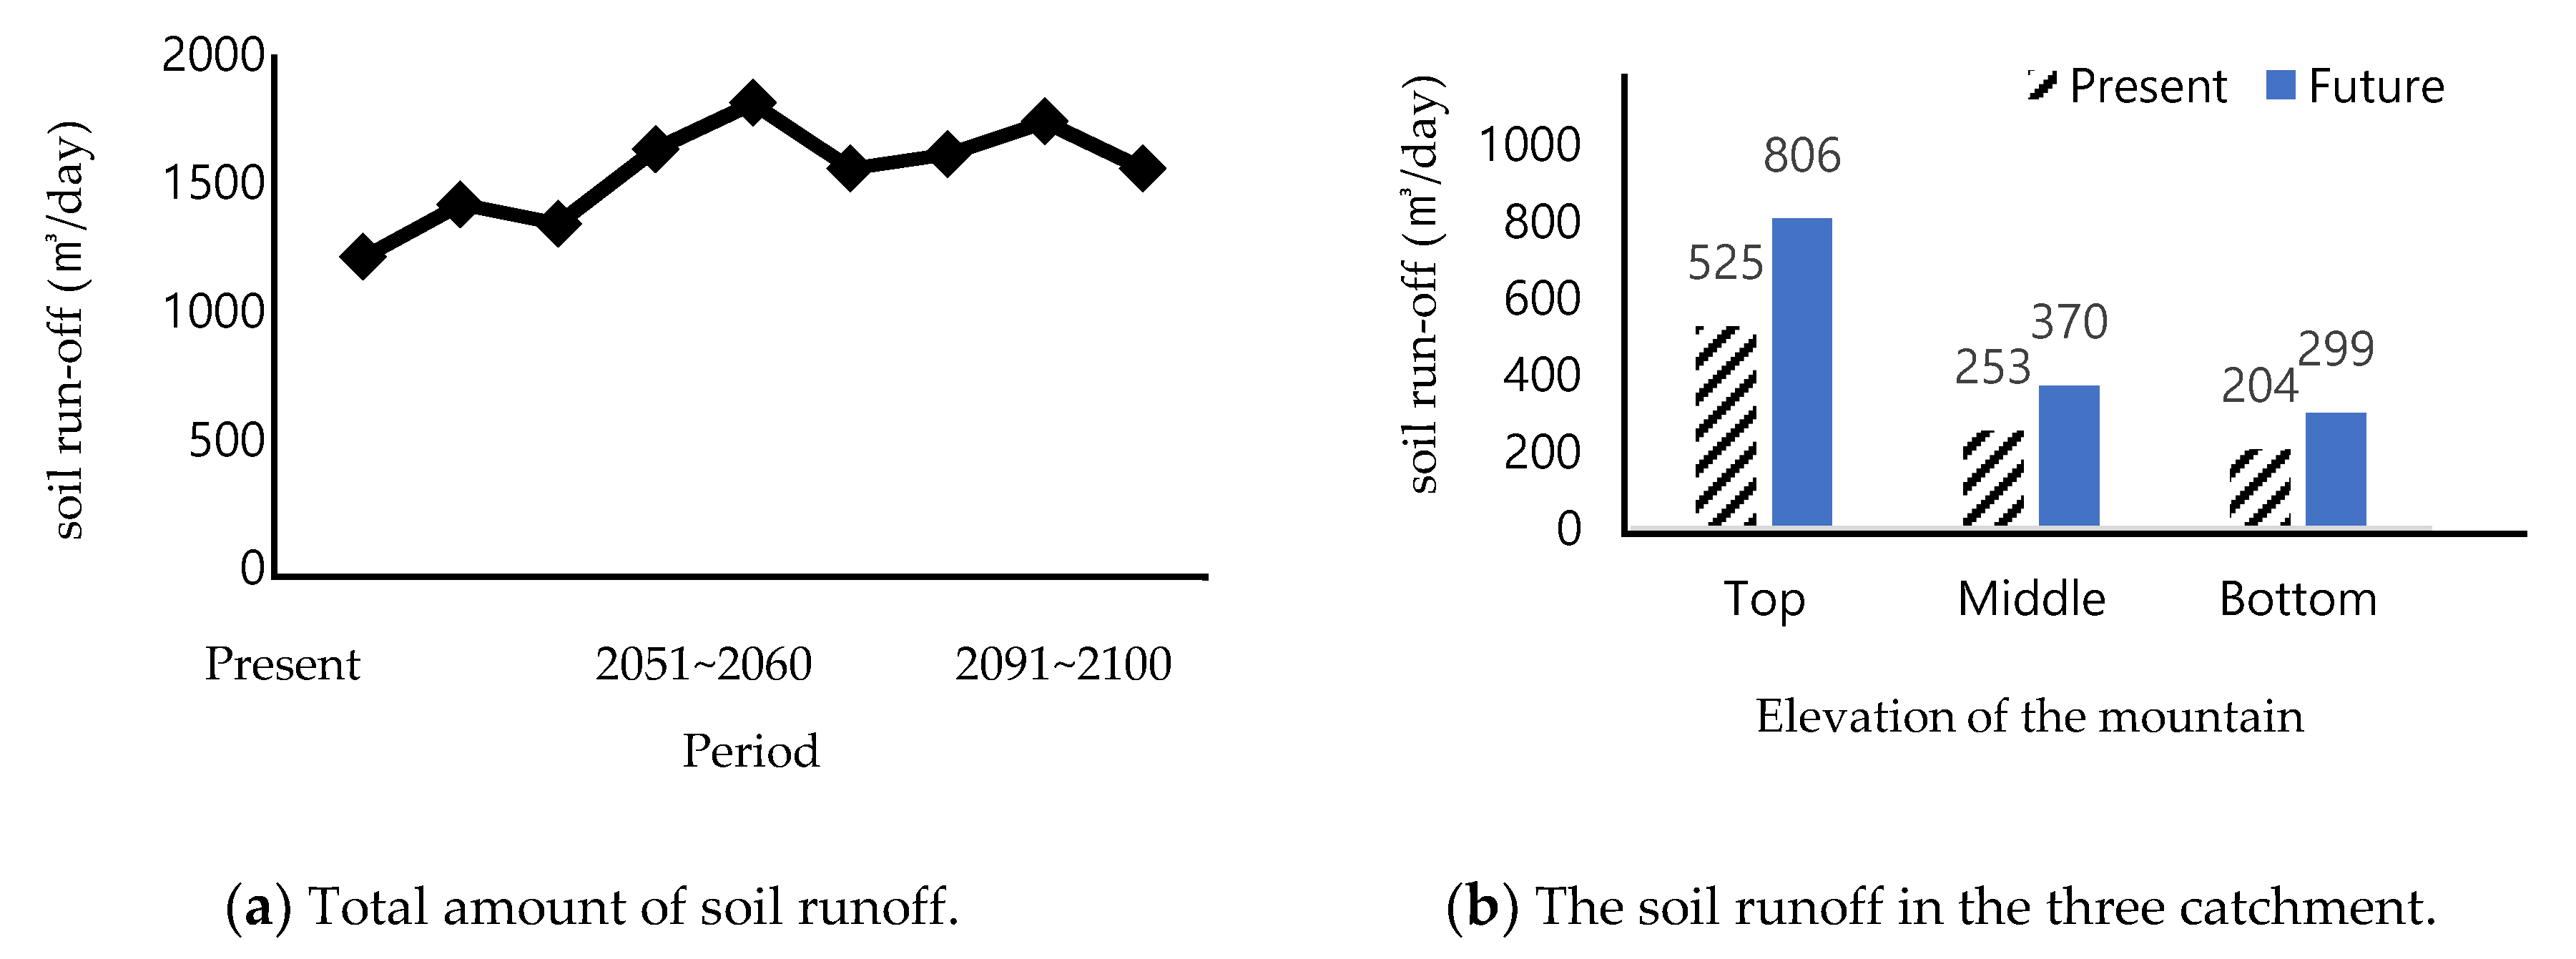
3.2. Results for Soil Runoff

Table 2 and Table 3 show the potential soil runoff for each catchment, based on the individual catchments identified. The data shown in these tables are the results of a series of 10-year probability predictions for the periods 2021 to 2060 (Table 2) and 2061 to 2100 (Table 3). This analysis assumes that 148 mm of rainfall falling over a 24-h period at the Namhyeon-dong Observatory corresponds to an increase of RCP 8.5 in the climate change scenario. The final amount of runoff created was calculated by entering this rainfall data and the spatial land use information in Equation (3).
Figure 6 shows a map of the individual catchments in the study area, which viewed in conjunction with the data in Table 3 and Table 4 reveal the predicted amount of soil discharge for the upper and lower catchments. Based on the highest predicted frequency, about 806 m 3 is expected to occur in the upstream part of the mountainous area and 370 m 3 in the middle and lower parts of Namhyeon-dong that are close to residential areas. The total area of the upstream catchments is 184.1 ha , the middle catchments make up a further 70.8 ha and the downstream catchments 46.9 ha . The remaining 65 ha are in catchments 1 to 5, which are not included in this analysis. As expected, the results predict more runoff from the upstream parts of the study area, where the highest risk occurs.
Figure 7 shows the predicted amount of soil runoff from the present to the year 2100 for the RCP 8.5 scenario, showing a generally increasing trend but with a peak suggesting that the risk of disaster will increase most rapidly in the decade from 2051 to 2060 in Namhyeun-dong. The analysis predicted that approximately 1210.6 m 3 of soil will runoff in a single 24 h period and 1808.8 m 3 over the course of each year from 2051 to 2060, which is approximately 598.2 m 3 more than the current amounts, when other external factors are excluded.
This indicates that the target performance of the technologies deployed to deal with these events should be equal to or greater than 806 m 3 if they are to cope with the type of disaster likely to occur in the most heavily affected decade, 2051–2060. The design capacity required to implement the final design plan according to the catchment classification should thus be appropriate for the upstream, middle and downstream sections of this mountainous area and sufficient space set aside for the disaster prevention technology in a given section to avoid the risk of massive landslides impinging on heavily populated areas. The final design low-dose was calculated based on the results listed in Table 3, which shows the predicted soil effluent from 2051 to 2060. The highest values were predicted from 2021 to 2100 in this study.
Based on the projected discharge amount, the area required for the technology installation in each catchment was finally by comparing the maximum amount of soil discharge that was likely to occur in the catchment with the amount that could potentially be released according to the climate change scenario for each decade. First, the causal relationship of the soil runoff was established according to the type of terrain in the mountain area, by dividing Namhyeon-dong catchment into two types of catchments, namely catchments near residential areas that are largely composed of lowers part of the mountain that are relatively heavily affected by soil spilling down from the upper parts and upper areas of the mountain, so-called “exhaust basins”, where the discharge volume and the altitude of the mountain area are both high.
The detailed design of the study area’s catchment could then be developed based on this analysis of the actual environment in the catchment, since appropriate district-specific design is essential if we are to be able to prevent large-scale soil spillage disasters that could otherwise be causing major problems for many communities by 2100.

3.3. Design Purpose

Based on a comprehensive outflow analysis of the catchments in the study area, the optimum spatial arrangement of the technology can be determined based on the characteristics of each catchment area. The spatial scope is the entire catchment area, consisting of the 16 internal areas and four transverse areas identified by analyzing the terrain in Namhyeon-dong. For the detailed design, the goals were set according to the design capacity and characteristics of the catchment location in Table 4.
Types 1 and 2 were classified according to whether existing technologies need to be supplemented by looking at the presence or absence of existing dam facilities and whether additional capacity is needed [28]. Type 3 includes areas where it would be difficult to install large-scale check dams due to the steep terrain and instead proposes the addition of multiple small-scale dams. In Type 4, the average slope in the mid-stream area of the mountain is lower and the soil from the top is moving more rapidly, hence technology that changes the direction of the flow rate must be placed centrally. Type 5 consists of sections that are adjacent to residential areas, with an average slope gradient of 0 to 20°. Here, it is important to distribute the rainfall runoff by facilitating drainage so that any soil coming down from higher up the mountain does not all arrive at once. However, since installing large-scale facilities very close to people’s houses could have adverse psychological effects on the residents, it may be preferable to create multi-purpose storage spaces such as swales that could reduce water flow by utilizing vacant land in front of apartment buildings. For Type 6, a useful approach would be to create an open space that includes penetration grass to protect the subsoil in stream valleys from being washed away during floods, for example. For Type 7, a multi-purpose gabion sitting wall would prevent over-flooding due to excessive water inflows, while for Type 8 the construction of facilities to stabilize rocky slopes and prevent rock falls would be helpful. In the low gradient/flat areas found in Type 9, small grit chambers should be installed to block/slow down flowing water and prevent soil from being swept away during floods.

3.4. Design Suggestion

Figure 8 shows the masterplan where all the proposed technologies have been implemented and installed. Based on the analysis of the soil discharge and the characterization of the catchment areas according to the site survey, elevation and slope of the mountainous areas conducted for this study, the Namhyeon-dong catchment was classified into three main zones, namely upstream, midstream and downstream. The appropriate prevention technology recommended for each environment is listed in Table 4. Since the areas that would potentially suffer from the greatest damage in the event of a major flood are largely concentrated in the downstream zone, the residential areas at the foot of the mountain should receive the most attention when designing appropriate subdivisions of the space based on the characteristic soil movement experienced in such areas.

3.4.1. Designs for the Upper Catchments of the Mountain

Among the three types of technologies proposed for the upper part of this mountainous area, all involve the creation of new dams or upgrading existing ones in the valley bottoms of upper streams. These dams must be constructed using the G3 method shown below in Figure 9, which is suitable for steep slopes with an average gradient of 10° or greater. G3 blocks are used to block the obstacles, but the water can be released down the central channel as well as percolating downstream through the cracks between the blocks. The soil inflow from nearby areas is deposited in the body of the dam, thus preventing flood damage caused by rapidly rising water levels and soil erosion from steep slopes.
In the example shown in Figure 9, a design of approximately 10 m scale is proposed to accommodate those area with lower gradients in the upper streams. This design introduces additional safety by offsetting the wing walls along the left and right sides of the lower part of the dam in order to prevent rapid flood currents. The bottoms of the sides are reinforced with foundation concrete and the height of the dam should be designed to be 20% higher than the calculated value. After the first cutoff of the soil from the top, inducing soil deposits and suspending the soil to be deposited from mountain streams will ensure a good drainage connection with the existing bracing. The capacity of this technology is the maximum design needed to prevent all possible soil runoff within the catchment basin. For each catchment, the scale is calculated under the assumption that no current technology will be reduced, hence the technology must be sufficient to cope with up to 850 m 3 of soil runoff.

3.4.2. Designs for the Middle Catchments of the Mountain

The technologies installed in the middle zones in the mountainous area will be expected to reduce the soil runoff from the upper part of the mountain to the valley bottoms and will include the expansion of the previously installed set of check dams. While the slope is relatively gentle, the western section of the catchment is relatively low-lying, which means the drainage is often blocked by vegetation and soil, preventing the smooth flow of water. Planting intrusion friendly grass supports the ground’s natural storage function. Planting a large number of broadleaf trees will also enhance the ground’s stability in the long term.
As shown in Figure 10, the ground is initially held in place with a network of wires to ensure that neither rainfall nor soil is easily swept away before the vegetation is firmly established. The ground must be prepared as a series of steps along the slope to hold the vegetation in place while it develops an extensive root system capable of naturally stabilizing the slope.

3.4.3. Designs for the Bottom Catchments of the Mountain

The design of the lower part of the mountain area was established by considering the convenience and value to the residents, as it was not considered beneficial to install large-scale facilities directly adjacent to residential areas. Some examples are shown in Figure 11. Detailed technologies are proposed for the sections marked A, B and C in the figure, each with its own characteristics and challenges that must be addressed.

3.4.4. Proposed Layout for Catchment A

Figure 12 shows a schematic diagram of the technology that will be placed in the A catchment near the residential area. Because the lower catchment is very close to the living area, technologies need to be deployed that provide adequate protection for residents while avoiding the use of large-scale facilities. Given the objective listed for Type 5 facilities, it is proposed that parking lots near apartments located at the bottom of the mountainous area be used as storage, while Type 6 facilities will be installed to create a buffer space between the living area and the areas that are vulnerable to landslides. This could do double duty by also acting as an open green space that acts to reduce soil runoff. Type 7 Gabion-type sitting walls are proposed and will be positioned along the side of the stream to reduce the likelihood of the stream overflowing into inhabited areas.

3.4.5. Proposed Layout for Catchment B

The B catchment shown in Figure 13, which is close to a residential area, has been used as a mining site in the past, leaving a derelict site with rocky terrain that is untended; farmland operated by local residents is located just in front of this rocky slope. Residents fear that this area will be vulnerable to damage from soil rendered unstable by heavy rainfall events, possibly spilling over into their living quarters. Type 8 measures should thus be established and installed to prevent rocks from being displaced in the event of heavy rain. Appropriate technology should be carefully arranged to ensure that the effects of individual Type 6 and Type 9 technologies interact positively, maximizing their impact through careful placement in conjunction with existing storage facilities located on the east side of the catchment.

3.4.6. Proposed Layout for Catchment C

Figure 14 depicts the recommendation that Type 6 greenery should be installed on desolate slopes in order to prevent soil runoff into apartment buildings close to Janggun-hill, which is very vulnerable to landslides. The addition of Type 9 grit chambers will also mitigate the continuing problem of soil runoff due to rainfall, which should be carefully placed to take into account the local geographical features, especially those locations where large quantities of sandy loam tend to be deposited.

3.5. RCP 8.5 Scenario

This study modelled the amount of soil runoff from the present to 2100 based on the IPCC’s RCP 8.5 scenario. The results showed that 1808 m 3 per day of the soil runoff can be reduced when the scale of disaster prevention technology implemented for the study area, the Namhyeong-dong community in the Gwanak-gu administrative subdivision of Seoul, is designed to cope with the projected maximum soil runoff, which is estimated to be for the decade 2051–2060. Looking at the soil runoff from the more mountainous parts of the area, these generated the greatest amounts of soil runoff compared to the more low-lying areas, even though the low-lying catchment area was larger. Since most mountainous terrain is naturally steeply sloping and rugged, a large number of coefficients for these catchments were selected for the calculation process. If the technology is installed in accordance with the suggested design, a reduction of as much as 806 m 3   a   day , 53% of the daily soil runoff, will be achieved. In the middle and lower parts of the mountain, although the size of the entire catchment was larger than upper part, the actual amount of soil runoff was lower. The soil has the highest impact on the more densely populated low lying catchments, but it is more likely to flow down mountain valleys from the top of the mountain and thus cannot be completely excluded. It is therefore necessary to slow down the flow of the soil generated in the upper part of the mountain as it proceeds down through the middle sections and out to the low level inhabited areas. Implementing the technologies recommended for each catchment in the low-lying areas will make it possible to reduce the flow by up to 299 m 3   per   day and 370 m 3 in the middle sections, by deploying the various techniques described in Table 4 to contain and disperse the soil runoff.
The runoff stages are divided into four sections according to their impact and the distribution of the runoff from each catchment is classified. Given the current trend, shown in Figure 15, if no countermeasures or additional mitigation is implemented, the mountain-related hazardous catchment area will gradually spread from the upper to the middle catchment area shown in Figure 15. However, if the projected disaster probability for the decade 2051–2060 is reduced via the deployment of appropriate technology according to the needs of each catchment, as recommended, it is possible to reduce the amount of soil runoff due to rainfall, even with the current trends in climate change. Projections of the effectiveness of the proposed technologies indicate a reduction in the frequency of such events impacting residential areas of 10% by 2031, although by 2051 the likelihood of such disasters occurring has once again risen to 35%. Therefore, preparing measures to deal with the climate change forecast up to 2100 requires us to actively engage in designing appropriate technologies to cope with a range of scenarios, where the greatest disaster may come in the long term (100 years), rather than taking a short-term view (30 years).

4. Conclusions

The analysis conducted for this study quantified the amount of soil runoff up to the year 2100 for the Namhyeon-dong catchment in Gwanak-gu, Seoul, in accordance with the IPCC’s RCP 8.5 climate change scenario. Based on the predicted amount of soil displaced in major rainfall events in various parts of the study area, appropriate technologies to minimize the incidence of soil disasters and mitigate their impact on residential areas were proposed. The results of the study are summarized as follows.
First, the basins were designed taking into account the residential areas. Most, if not all, the catchments have some unused space that can serve as a buffer between the downstream and living areas on the mountain. Each catchment therefore consists of a natural mountain area and a living area. The results showed that the soil runoff could be minimized by ensuring that the facilities have both good drainage and good penetration of surface water. Facilities capable of smoothing the water flow and thus minimizing turbulent flow, can be arranged according to the slope. It is also important to incorporate techniques that allow spatial utilization even in winter, when the amount of rainfall is relatively small.
Second, the risk of a disaster can be predicted for the various climate change scenarios. Based on the rainfall predicted in the IPCC’s RCP 8.5 Path, we estimated the soil runoff at Namhyeon-dong, Gwanak-gu, for the eight decades from the present to 2100.
Third, we developed a design guide for appropriate disaster prevention technology to minimize the impact of soil disasters as well as to maximize the economic benefits on the case study community. Based on the amount of climate change, we classified each catchment according to its characteristics into top, middle and bottom levels of risk. It is important to note that the resulting masterplan was proposed based on the analysis of soil disasters at the macro level.
The main limitation of the study is that it is difficult to accurately reflect the characteristics of rainfall because the cumulative propitiation time was limited to 24 h periods when estimating the rainfall. Research that requires detailed results needs to conduct a more fine-grained methodology that also considers the properties and characteristics of the soil, such as RUSLE and USLE, both of which are used for such studies.
In further research, it is hoped that more detailed studies of the effect of soil disasters on urban areas will be conducted that consider the various types of soil disaster and other relevant factors. In particular, as yet there is no standard for the threshold of soil runoff that is likely to trigger highly dangerous disasters such as landslides and soil debris carried by water. The creation of such a standard would make it possible to establish a set of criteria that could be used to calculate the risk of soil runoff and provide evidence to support further consideration of appropriate policies as well as academic studies.
It should be noted that our assumption and approach are validated and revised through field visits (initial site analysis) indirectly. As the purpose of this study, however, was to quantify and analyze the effects of disaster mitigation technologies and disaster prevention technologies, the validation through well-organized model tests would be a future study. After that, our proposed masterplan could be implemented after completing the future studies suggested.

Author Contributions

J.K. designed and coordinated the study. H.J. performed the analytical and conceptual study under the supervision of J.K. All the authors have written and revised the text of this paper. All authors contributed to writing this paper. All authors have read and agreed to the published version of the manuscript.

Funding

This work is supported by the Korean Environment Industry & Technology Institute (KEITI) through their Climate Change R&D Program, funded by the Korean Ministry of the Environment (MOE). (2018001310002).

Acknowledgments

We would like to thank Hoijin Kim for providing the field data utilized in this analysis. The data in Table A1 was kindly provided by the company ©UBE&C.

Conflicts of Interest

The authors declare no conflict of interest.

Appendix A

Table A1. Data collected in Sejong and Busan.
DatePrecipitationTotal Amount of RainfallActual Amount of Rainfall OutflowActual Amount of Soil RunoffCoefficient of the Soil RunoffC Value
16.4.1328.11826.5547.951.03 0.0019 0.30
16.4.2137.22418773.761.55 0.0020 0.32
16.5.1025.71670.5501.150.94 0.0019 0.30
16.6.2443.32814.5985.0752.16 0.0022 0.35
16.7.4179.111,641.57916.2224.56 0.0031 0.68
16.7.738.82522807.041.61 0.0020 0.32
16.9.822.81482444.60.83 0.0019 0.30
16.9.1797.863573432.7812.42 0.0036 0.54
16.9.2739.72580.5825.761.65 0.0020 0.32
16.10.832.32099.5671.841.34 0.0020 0.32
Total for 2016544.835,41216,906.1848.09--
17.4.615.9 1033.5258.3750.81 0.00310.25
17.4.1726.8 1742487.761.71 0.0035 0.28
17.7.239.52567.5821.63.29 0.0040 0.32
17.7.369.9 4543.52317.1859.21 0.0040 0.51
17.7.434.0 2210707.22.83 0.0040 0.32
17.7.1524.51592.5445.91.56 0.0035 0.28
17.7.2527.6 1794502.321.76 0.0035 0.28
17.7.3129.2 1898607.362.43 0.0040 0.32
17.8.937.3 2424.5727.352.73 0.0038 0.30
17.8.1534.4 2236693.162.69 0.0039 0.31
17.8.2136.1 2346.5750.883.00 0.0040 0.32
17.8.2449.8 32371424.287.20.0051 0.44
17.9.1177.0 50052702.79.82 0.0036 0.54
Total for 2017502.032,63012,446.0749.05--
18.4.1436.7 2385.5763.363.05 0.0040 0.32
18.4.2338.9 2528.5809.123.24 0.0040 0.32
18.5.620.5 1332.5333.1251.04 0.0031 0.25
18.5.1223.4 1521380.251.19 0.0031 0.25
18.6.2630.3 1969.5590.852.22 0.0038 0.30
18.6.2750.4 32761474.27.27 0.0049 0.45
18.6.3022.4 14563641.14 0.0031 0.25
18.7.1119.9 7793.55299.5815.73 0.0030 0.68
18.7.243.9 2853.5970.194.12 0.0042 0.34
18.7.935.5 2307.5738.42.95 0.0040 0.32
18.8.2678.2 50832744.8210.25 0.0037 0.54
18.8.28140.0 9100627918.25 0.0029 0.69
18.8.3073.3 4764.52572.839.85 0.0038 0.54
18.8.3142.6 2769996.844.490.00450.36
18.9.389.9 5843.53330.79511.250.0034 0.57
18.9.2132.9 2138.5684.322.74 0.0040 0.32
Total for 2018878.857,12228,331.6898.76--
Note: this data was provided by the company ©UBE&C.

References

  1. Korea Meteorological Administration. Meteorological Technology & Policy; Korea Meteorological Administration: Seoul, Korea, 2015; Volume 8, pp. 2092–5336. [Google Scholar]
  2. IPCC. Intergovernmental Panel on Climate Change; IPCC: Geneva, Switzerland, 2014. [Google Scholar]
  3. Hayat, H.; Akbar, T.; Tahir, A.; Hassa, Q.; Dewan, A.; Irshad, M. Simulating current and future river-flows in the Karakoram and Himalayan regions of Pakistan using Snowmelt-Runoff model and RCP scenarios. Water 2019, 11, 761. [Google Scholar] [CrossRef] [Green Version]
  4. Rahman, M.; Hingsheng, C.; Islam, M.; Dewan, A.; Iqbal, J.; Washakh, R.; Shufeng, T. Flood susceptibility assessment in Banglandesh using machine learning and multi-criteria decision analysis. Earth Syst. Environ. 2019, 3, 585–601. [Google Scholar] [CrossRef]
  5. Lee, C.; Chung, J. A study on development of the housing guidelines for climate change response—Focused on extreme heat and heat island effect. J. Archit. Inst. Korea Plan. Des. 2017, 33, 77–89. [Google Scholar] [CrossRef]
  6. Woo, C.; Kwon, H.; Lee, C.; Kim, K. Landslide hazard prediction map based on logistic regression model for applying in the whole country of South Korea. J. Korean Soc. Hazard Mitig. 2014, 14, 117–123. [Google Scholar] [CrossRef] [Green Version]
  7. Jebari, S.; Berndtsson, R.; Olsson, J.; Bahri, A. Soil erosion estimation based on rainfall disaggregation. J. Hydrol. 2012, 436–437, 102–110. [Google Scholar] [CrossRef]
  8. Tang, Q.; Xu, Y.; Bennett, S.J.; Li, Y. Assessment of soil erosion using RUSLE and GIS: A case study of the Yangou watershed in the Loess Plateau, China. Environ. Earth Sci. 2015, 73, 1715–1724. [Google Scholar] [CrossRef] [Green Version]
  9. Markose, V.; Jayappa, J. Soil loss estimation and prioritization of sub-watersheds of Kali River basin, Karnataka, India, using RUSLE and GIS. Environ. Monit. Assess. 2016, 188, 1–16. [Google Scholar] [CrossRef] [PubMed]
  10. Renard, K.G.; Foster, G.R.; Weesies, G.A.; McCool, D.K.; Yorder, D.C. Predicting Soil Erosion by Water: A Guide to Conservation Planning with the Revised Universal Soil Loss Equation (RUSLE); Agriculture Handbook; U.S. Department of Agriculture: Washington, DC, USA, 2007; Volume 703.
  11. Gayen, A.; Saha, S.; Pourghasemi, H. Soil erosion assessment using RUSLE model and its validation by FR probability model. Geocarto Int. 2019. [Google Scholar] [CrossRef]
  12. Kim, M. Evaluation of soil loss in the Sapkyo river basin. J. Korean Geotech. Soc. 2002, 3, 19–27. [Google Scholar]
  13. Hwang, S.H.; Ham, D.H. A study on the monthly trend of Seoul hourly rainfall using BLRPM. J. Korean Soc. Hazard Mitig. 2014, 14, 267–278. [Google Scholar] [CrossRef] [Green Version]
  14. Cha, D.; Lee, D.; Jin, C.; Kim, G.; Choi, Y.; Suh, M.; Ahn, J.; Hong, S.; Min, S.; Park, S.; et al. Future changes in summer precipitation in regional climate simulations over the Korean Peninsula forced by multi-RCP scenarios of HadGEM2-AO. Pac. J. Atmos. Sci. 2016, 52, 139–149. [Google Scholar] [CrossRef]
  15. Yiannakou, A.; Salata, K. Adaptation to climate change through spatial planning in compact urban areas: A case study in the city of Thessaloniki. Sustainability 2017, 9, 271. [Google Scholar] [CrossRef] [Green Version]
  16. Huan, W.; Lee, Y. Strategic planning for land use under extreme climate changes: A case study in Taiwan. Sustainability 2017, 8, 53. [Google Scholar] [CrossRef] [Green Version]
  17. Woldemariam, G.; Iguala, A.; Tekalign, S.; Reddy, R. Spatial modeling of soil erosion risk and its implication for conservation planning: The case of the gobele wastershed, East Haraghe Zone, Ethiopia. Land 2018, 7, 25. [Google Scholar] [CrossRef] [Green Version]
  18. Djoukbala, O.; Mazour, M.; Hasbaia, M.; Benselama, O. Estimating of water erosion in semiarid regions using RUSLE equation under GIS environment. Environ. Earth Sci. 2018, 77, 1–13. [Google Scholar] [CrossRef]
  19. Zerihun, M.; Mohammedyasin, M.; Sewnet, D.; Adem, A.; Lakew, M. Assessment of soil erosion using RUSLE, GIS and remote sensing in NW Ethiopia. Geoderma Reg. 2018, 12, 83–90. [Google Scholar] [CrossRef]
  20. Lisboa, E.; Blanco, C.; Maia, R.; Bello, L. A stochastic estimation of sediment production in an urban catchment using the USLE model. Hydrol. Sci. J. 2017, 62, 2571–2586. [Google Scholar] [CrossRef]
  21. Mulvaney, T.J. On the use of self-registering rain and flood gauges in making observations on the relationship of rainfall and runoff and of flood discharges in a given catchment. Trans. Inst. Civ. Eng. (Irel.) 1850, 10, 18–31. [Google Scholar]
  22. Prasannakumar, V.; Shiny, R.; Geetha, N.; Vijith, H. Spatial prediction of soil erosion risk by remote sensing, GIS and RUSLE approach: A case study of Siruvani river watershed in Attapady valley, Kerala, India. Environ. Earth Sci. 2011, 64, 965–972. [Google Scholar] [CrossRef]
  23. Somprasong, K.; Chaiwiwatworakul, P. Estimation of potential cadmium contamination using an integrated RUSLE, GIS and remote sensing technique in a remote watershed area: A case study of the Mae Tao Basin, Thailand. Environ. Earth Sci. 2015, 73, 4805–4818. [Google Scholar] [CrossRef]
  24. Teng, H.; Liang, Z.; Chen, S.; Liu, Y.; Rossel, R.A.V.; Chappell, A.; Yu, W.; Shi, Z. Current and future assessments of soil erosion by water on the Tibetan Plateau based on RUSLE and CMIP5 climate models. Sci. Total Environ. 2018, 635, 673–686. [Google Scholar] [CrossRef] [PubMed]
  25. Kuichling, E. The relation between the rainfall and the discharge of sewers in populous districts. Trans. ASCE 1889, 20, 1–60. [Google Scholar]
  26. Lee, H. General rainfall patterns in Indonesia and the potential impacts of local season rainfall intensity. Water 2015, 7, 1751–1768. [Google Scholar] [CrossRef]
  27. Stancanelli, L.; Peres, D.; Cancelliere, A.; Foti, E. A combined triggering-propagation modeling approach for the assessment of rainfall induced debris flow susceptibility. J. Hydrol. 2017, 550, 130–143. [Google Scholar] [CrossRef] [Green Version]
  28. Saha, S.; Gayen, A.; Pourghasemi, H.; Tiefenbacher, J. Identification of soil erosion-susceptible areas using fuzzy logic and analytical hierarchy process modeling in an agricultural watershed of Burdwan district, India. Environ. Earth Sci. 2019, 78, 1–18. [Google Scholar] [CrossRef]
  29. Yaseen, Z.; Awadh, S.; Sharafati, A.; Shahid, S. Complementary data-intelligence model for river flow simulation. J. Hydrol. 2018, 567, 180–190. [Google Scholar] [CrossRef]
  30. Chen, T.; Niu, R.; Li, P.; Zhang, L.; Du, B. Regional soil erosion risk mapping using RUSLE, GIS, and remote sensing: A case study in Miyun Watershed, North China. Environ. Earth Sci. 2011, 63, 533–541. [Google Scholar] [CrossRef]
  31. ESRI. ArcGIS Desktop 10.5; Environmental Systems Research Institute: Redlands, CA, USA, 2016. [Google Scholar]
  32. Demirci, A.; Karaburun, A. Estimation of soil erosion using RUSLE in a GIS framework: A case study in the Buyukcekmece Lake watershed, northwest Turkey. Environ. Earth Sci. 2012, 66, 903–913. [Google Scholar] [CrossRef]
  33. Farhan, Y.; Nawaiseh, S. Spatial assessment of soil erosion risk using RUSLE and GIS techniques. Environ. Earth Sci. 2015, 74, 4649–4669. [Google Scholar] [CrossRef]
  34. Choi, B. Analysis of the adequacy check dam according to soil loss using rusle. J. Korean Soc. Surv. Geod. Photogramm. Cartogr. 2016, 34, 515–524. [Google Scholar] [CrossRef]
  35. O’Callaghan, J.; Mark, D. The extraction of drainage networks from digital elevation data. Comput. Vis. Graph. Image Process. 1984, 28, 323–344. [Google Scholar] [CrossRef]
  36. Fairfield, J.; Leymarie, P. Drainage networks from grid digital elevation models. Water Resour. Res. 1991, 27, 709–717. [Google Scholar] [CrossRef]
  37. Survila, K.; Yildirim, A.; Li, T.; Liu, Y.; Tarboton, D.; Wang, S. A scalable high-performance topographic flow direction algorithm for hydrological information analysis. In Proceedings of the XSEDE16 Conference on Diversity, Big Data, and Science at Scale, Miami, FL, USA, 17–21 July 2016; Volume 11. [Google Scholar] [CrossRef] [Green Version]
  38. Tarboton, D. A new method for the determination of flow directions and upslope areas in grid digital elevation models. Water Resour. Res. 1997, 33, 309–319. [Google Scholar] [CrossRef] [Green Version]
  39. Available online: https://www.weather.go.kr/weather/warning/standard.jsp (accessed on 15 May 2019).
Figure 1. Location of Namhyeun-dong, Gwanak-gu, the study site.
Sustainability 12 02516 g001
Figure 2. Study flow.
Sustainability 12 02516 g002
Figure 3. Catchment analysis methodology (a) algorithm for the catchment analysis using the ArcHydro plug-in; (b) sequence of the catchment analysis using ArcGIS (DB = database).
Sustainability 12 02516 g003aSustainability 12 02516 g003b
Figure 4. Results of the catchment segmentation of Namhyeun-dong using GIS.
Sustainability 12 02516 g004
Figure 5. Slope aspects (a) and elevation (b) of the Namhyeun-dong catchment areas (unit: m).
Sustainability 12 02516 g005
Figure 6. Elevations of the individual catchments in Namhyeon-dong. More intense colors correspond to the more mountainous parts of the case study area.
Sustainability 12 02516 g006
Figure 7. Changes in the soil runoff according to the RCP 8.5 climate change scenario: (a) The soil runoff with time; (b) comparison of the current and predicted soil runoff for each of the three catchment groups.
Sustainability 12 02516 g007
Figure 8. Masterplan of the technologies suggested for the Namhyeon-dong catchment area.
Sustainability 12 02516 g008
Figure 9. G3 dam concept plan: (a) A front elevation plan of the G3 dam; (b) a side elevation plan of the G3 dam.
Sustainability 12 02516 g009
Figure 10. Green area concept: (a) Sectional elevation of the effects of planting trees and grass; (b) Conceptual design of the planting block.
Sustainability 12 02516 g010
Figure 11. Separation of the lower mountain catchment.
Sustainability 12 02516 g011
Figure 12. Detailed design guidelines for catchment A.
Sustainability 12 02516 g012
Figure 13. Detailed design guidelines for catchment B.
Sustainability 12 02516 g013
Figure 14. Detailed design guidelines for catchment C.
Sustainability 12 02516 g014
Figure 15. Magnitudes of current and projected soil runoff across the study area.
Sustainability 12 02516 g015
Table 1. Coefficients for the various soil uses in the study area.
CategoryDivisionSectionCoefficient
CultivationRice paddyOrganized fields0.7
Unorganized fields0.8
Crop farmCommon, specialty crops0.45~0.60
Orchards, etc.0.5
ForestGrasslandNatural grassland0.25
Artificial grassland0.05~0.10
ForestConiferous forest0.5
Deciduous forest0.5
Mixed forest0.5
RecreationalGolf courses0.50~0.75
Amusement parks0.10~0.25
Cemeteries0.10~0.25
Rock faces and mountains0.7
CityResidential and commercial areasResidential zones0.60~0.70
High rise zones0.50~0.70
Commercial and office zones0.70~0.95
Vacant land0.35
Transportation facilitiesRoads0.70~0.95
Railroad and buffer areas0.7
Airports0.95
Ports0.8
Industrial areasIndustrial zones0.60~0.90
Industrial/vacant zones0.50~0.80
Public areasEducational and military zones0.50~0.70
Public land0.50~0.70
Table 2. The amount of soil runoff for the RCP 8.5 climate change scenario (2021~2060) 1.
Catchment Size ( h a ) Current ( m 3 ) ‘21~’30 ( m 3 ) ‘31~’40 ( m 3 ) ‘41~’50 ( m 3 ) ‘51~’60 ( m 3 )
113.1 49.5 56.8 53.4 65.5 72.5
25.6 19.3 22.1 20.8 25.5 28.3
312.6 44.9 51.4 48.4 59.3 65.7
414.3 51.2 58.7 55.2 67.7 75.0
519.3 63.1 72.3 68.0 83.5 92.4
610.8 33.7 38.6 36.3 44.5 49.3
78.628.2 32.3 30.4 37.3 41.3
88.247.8 54.7 51.5 63.2 69.9
921.868.0 77.9 73.3 90.0 99.6
109.451.6 59.1 55.6 68.2 75.5
119.943.1 49.4 46.5 57.0 63.1
1212.539.7 45.4 42.7 52.5 58.0
1311.5 35.8 41.0 38.6 47.3 52.4
1425.1 109.4 125.4 117.9 144.7 160.2
159.7 30.3 34.7 32.6 40.0 44.3
1623.6 73.2 83.9 78.9 96.9 107.2
1731.1 96.8 110.9 104.3 128.0 141.7
1824.5 76.3 87.4 82.2 100.9 111.7
1954.113.943.449.746.757.4
209.1 28.2 32.3 30.4 37.3 41.3
2114.9 116.4 133.3 125.4 153.9 170.3
2217.1 90.2 103.3 97.2 119.3 132.0
Total366.81210.61414.61339.51629.31808.8
Note: 1 Predicted soil runoff values for the period 2021 to 2060. If the current trend continues, the maximum amount of soil movement that could occur in a single 24-h period in the Namhyeun-dong catchments will increase from 1210.6 m 3 at present to 1808.8 m 3 for 2051–2060.
Table 3. The amount of soil runoff for the RCP 8.5 climate change scenario (2061~2100) 1.
CatchmentSize ( h a ) Current ( m 3 ) ‘61~’70 ( m 3 ) ‘71~’80 ( m 3 ) ‘81~’90 ( m 3 ) ‘91~’00 ( m 3 )
113.149.561.764.469.561.8
25.619.324.025.127.124.1
312.644.955.858.363.056.0
414.351.263.866.671.963.9
519.363.178.682.088.678.8
610.833.741.943.847.342.0
78.628.235.136.739.635.2
88.247.859.462.167.059.6
921.868.084.788.495.584.9
109.451.664.267.172.464.4
119.943.153.756.060.553.8
1212.539.749.451.655.749.5
1311.535.844.646.550.244.7
1425.1109.4136.2142.2153.6136.6
159.730.337.739.342.537.8
1623.6 73.2 91.2 95.2 102.8 91.4
1731.196.8120.5125.8135.9120.8
1824.576.395.099.2107.195.2
1954.113.963.55456.460.9
209.128.235.136.739.635.2
2114.9116.4144.8151.3163.3145.2
2217.190.2112.3117.2126.6112.5
Total366.81210.61553.01609.51736.01554.3
Note: 1 Predicted soil discharge for the period 2061 to 2100. The 21 catchments show the highest discharge into the upper basin of the mountain. The outflow between 2091 and 2100 will increase by a further 343.7 m 3 compared to the current value. If no action is taken to slow this trend, the disaster risk will increase considerably.
Table 4. Detailed planning sheet.
Catchment LocationTypeClimate/Environment DescriptionPurpose of The Design
Upstream
(Design Capacity: 806 m 3 / d a y )
Type 1Zone where soil runoff is predicted to increase OR where an existing dam needs to be modified or redesigned.- Adjust the effective height of the dam to increase its capacity
- Increase the capacity by creating more chambers
Type 2Where a new dam needs to be installed.Build an impermeable dam
Type 3-Average gradient: 30–40°
The valley experiences soil runoff and/or the midstream has steep slopes.
Creation a series of small dams to prevent soil debris and landslides propagating.
Midstream
(Design Capacity: 370 m 3 / d a y )
Type 4- Average gradient: 5~10°
- Slope adjacent to the mountain stream valley
- Areas connected to drainage that are close to both apartments and mountainous areas
Distribute the amount and direction of water flow from the mountain valley via the installation of induction channels.
Downstream
(Design Capacity: 299 m 3 / d a y )
Type 5- Average gradient: 0~5°
- Located at or near the bottom of Gwanak mountain
- Areas that could suffer substantial damage due to their close proximity to apartments in residential areas that are not protected by retaining walls when landslides occur
Creating multi-use water storage via swales or unused parking areas in front of buildings.
Type 6- Average gradient: 10–20°
- Entrance space in the residential area.
- Create open space.
- Penetrating grasses should be planted to protect against flooding in the stream valley during peak rainfall.
Type 7- The midpoint of the mountains where the slope is relatively gentle
- Provide functional improvements of the multi-purpose facilities during dry period
- Installation of multi-purpose gabion walls that protect facilities from incoming soil debris, direct drainage and also serve as park benches, etc.)
Type 8Natural rock slopesInstall facilities to stabilize the rock face and prevent rock falling from unstable slopes.
Type 9Wide, flat, open landInstallation chambers to prevent the outflow of surface soil.

