Article

An Evaluation and Region Division Method for Ecosystem Service Supply and Demand Based on Land Use and POI Data

1
Beijing Research Center for Information Technology in Agriculture, Beijing Academy of Agriculture and Forestry Sciences, Beijing 100097, China
2
Department of Resources and Environment, National Engineering Research Center for Information Technology in Agriculture, Beijing 100097, China
3
Key Laboratory of Agri-informatics, Ministry of Agriculture, Beijing 100097, China
4
Beijing Engineering Research Center of Agricultural Internet of Things, Beijing 100097, China
*
Authors to whom correspondence should be addressed.
Sustainability 2020, 12(6), 2524; https://doi.org/10.3390/su12062524
Submission received: 19 February 2020 / Revised: 18 March 2020 / Accepted: 19 March 2020 / Published: 23 March 2020
(This article belongs to the Section Economic and Business Aspects of Sustainability)

Abstract

:
Mastering the regional spatial differences of ecosystem service supply and ecosystem service demand is of great significance to scientifically planning the development and utilization of national land and maintaining healthy development of ecosystems. Based on the relationship analysis of ecosystem service supply and ecosystem service demand, this study explored the regional ecosystem service supply by ecosystem service value based on grid data and constructed an ecosystem service demand evaluation model that integrated the construction land ecosystem service demand equivalent for static aspects and the point of interest (POI) kernel density estimation for dynamic aspects on the basis of land use and POI data. In the end, it put forward a region division method for ecosystem service supply and ecosystem service demand and conducted an empirical analysis of Haidian District, Beijing. The following results were concluded: (1) the ecosystem service value of different grids in Haidian District was between RMB (Chinese monetary unit, Yuan) 0 and RMB 2.4787 million. In terms of spatial distribution, the ecosystem service supply took on an obvious trend of gradual decrease from the northwest to the southeast, with major ecosystem service supply coming from the northwest. (2) The construction land ecosystem service demand equivalent of Haidian District was characterized by a multicenter cluster: the high equivalent area was in the southeast, while the equivalent of the northwest was relatively low. POI kernel density estimation demonstrated cluster distribution, with a high kernel density estimation in the southeast, a lower kernel density estimation in the central part, and the lowest kernel density estimation in the northwest. The ecosystem service demand index also showed cluster distribution: high index in the southeast, low index in the northwest, and prominent sudden changes from the central part to the south. (3) The bivariate local spatial autocorrelation cluster diagram method was used to divide five types of ecosystem service supply and ecosystem service demand, namely non-significant correlation region, high ecosystem service supply and high ecosystem service demand region, high ecosystem service supply and low ecosystem service demand region, low ecosystem service supply and high ecosystem service demand region, low ecosystem service supply and low ecosystem service demand region. Grids with the highest ratio belonged to the non-significant correlation region; the distribution of low ecosystem service supply and high ecosystem service demand region had the greatest concentration, mainly in the southeast; the grids of high ecosystem service supply and low ecosystem service demand region were mainly present in the northwest and in a continuous way; the grids of low ecosystem service supply and low ecosystem service demand region, and high ecosystem service supply and high ecosystem service demand region were extremely few, with sporadic distribution in the central part. The research results could provide a basis for the adjustment and fine management of regional land use structure.

Graphical Abstract

1. Introduction

Human unceasing pursuit of economic development and changes in land use pattern have influenced the ecosystem structure and process and changed the supply capacity of ecosystems [1,2,3]. It has triggered a series of ecological environment issues that threaten regional ecological safety and lead to an imbalance between ecosystem service supply (ESS) and ecosystem service demand (ESD) [4]. In recent years, scholars have started to explore the relationship between ESS and ESD. ESS means that ecosystems produce products and services for mankind, reflecting the effectiveness of the natural system; ESD represents human expectation, consumption, or use of products and services produced by ecosystems [5,6,7], reflecting human demand and well-being [8]. Concerning different dimensions for ESS and ESD evaluation, it is imperative to critically study how to clarify and demonstrate the regional ESS and ESD conditions in a spatial manner [9]. Some scholars have conducted useful explorations regarding the relation between ESS and ESD. Regional ESS and ESD were evaluated and then divided into different types based on the matching relations. For instance, the spatial variation characteristic of the ESS and ESD relationship was disclosed according to land use and night lighting data [10]. Furthermore, an ESS and ESD service matrix was constructed, along with relevant indexes [11]. Peng used a modified ecosystem service value (ESV) model to calculate ESS and evaluated ESD based on land use and development, population density, and gross domestic product (GDP) [12]. Then, he proposed a greenbelt ecological network construction plan according to different counties of Guangdong Province based on the ESS and ESD space relationship. The majority of existing studies evaluated ESS using land use data and chose representative indexes to appraise ESD. However, scientific indexes are the key to an accurate evaluation. Moreover, most of these studies regarded administrative regions, drainage basins, or topographic conditions as the basic unit of region division for ESS and ESD [13]. The results are of great significance to regional unified planning and management, but large-scale evaluation went against fine management and regulation of land. The development of internet technology has constantly enriched the geographic space big data, which is represented by mobile phone signaling data, especially GPS trajectory data and point of interest (POI) data. Owing to characteristics such as large quantity, easiness to acquire, and explicit spatial location, they have been extensively applied in studies on the identification of urban commercial center [14,15]; coupling analysis of commerce, population, and transportation [16,17]; and the identification of green space service scope [18]. They provide new data sources and thoughts for revealing the relation between ESS and ESD on a small scale. Land use directly affects the regional ESS. Most of the ESS and ESD are extremely mismatched in space. They are even in deficit in many places. Quantitative measurement and division of the ESS and ESD can help grasp the regional ecological level, and thus influence land use planning and formulation of differentiated land use policy services, especially in some regions with serious ESS and ESD conflicts. Given the aforementioned analysis, this paper conducted a case study on the Haidian District and used an evaluation unit of 500 m × 500 m mesh. It assessed regional ESS and ESD based on land use and POI data, and five types of ESS and ESD were determined, with a view to putting forward an evaluation method suitable for small-scale ESS and ESD, providing a reference and basis for regional fine land use and structure adjustment, regional ecological environment protection, and landscape construction.

2. Materials and Methods

2.1. Study Area

Our study region was the Haidian District, which was located in Beijing, China (latitude: 39°53′–40°09′N, longitude: 116°03′–116°23′E). It is adjacent to Xicheng District and Chaoyang District in the east, Fengtai District in the south, Shijingshan District and Mentougou District in the west, and Changping District in the north. Furthermore, its terrain shows a great degree of fluctuation, being high in the west and low in the east. The majority of its land is plains and mountains. It stretches from the third Ring Road to the sixth Ring Road. Its north and south differ greatly in land use and economic development; the southeast is close to Beijing downtown, so it is characterized by a high degree of urbanization and development, as well as distribution of varied commercial organizations and service institutions; in the northwest where the degree of urbanization is low and the economic development lags behind, the land use types mainly include forest land and cultivated land.

2.2. Data

The data used in this study were sourced from the remote sensing image data of China’s Gaofen-1 Satellite with a resolution of 2 m. Through visual interpretation, data on the land use status quo of Haidian District in 2017 was acquired (Figure 1). Additionally, land classification was verified via field survey. Land use types were divided into cultivated land, forest land, water body, unused land, urban green space, and construction land (which was subdivided into management-services land, residential land, commercial land, land for mining and industry, and road). POI data were derived from the 2017 Beijing POI data provided by Beijing Digital View Technology Co., Ltd.

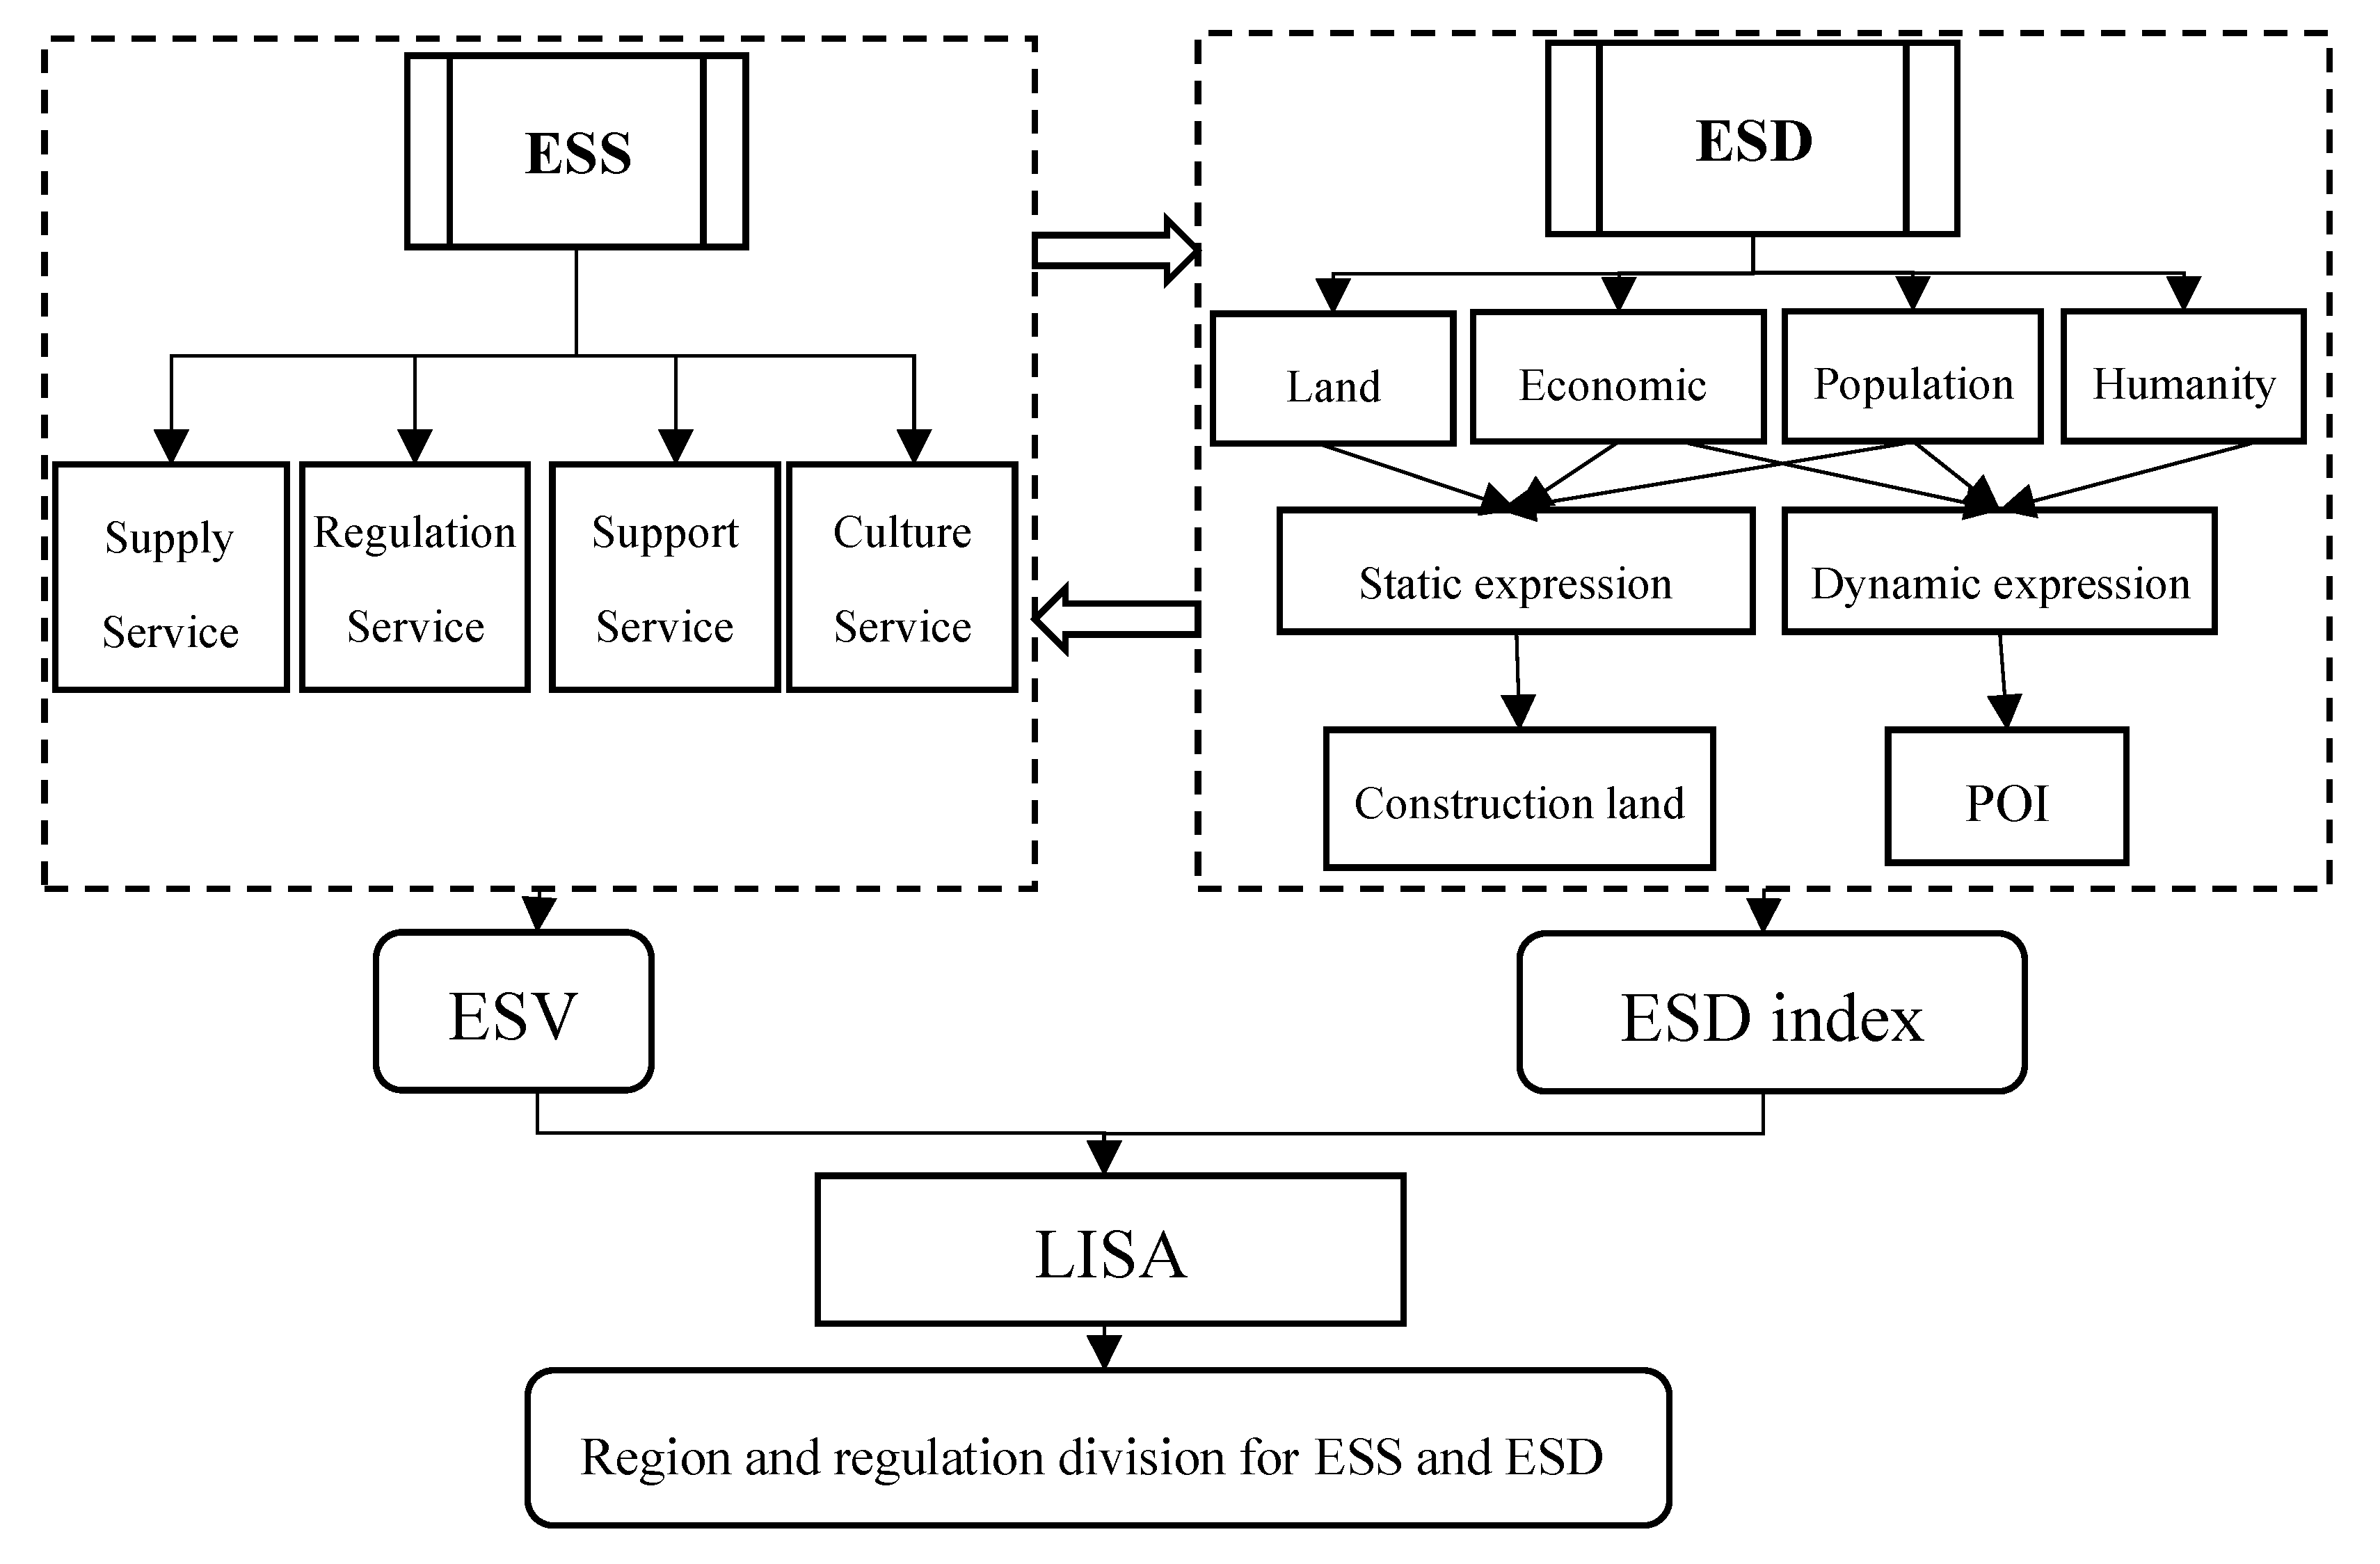
3. Research Methodology

There are a great number of methods related to ESS and ESD. For example, Yan analyzed the connotation of ESS, ESD, and consumption from different perspectives such as consumption, preference, and payment [19]; Ma divided ESS into potential ESS and actual ESS, and classified ESD into fulfilled ESD and total ESD [8]; Peng divided three types of ESD pursuant to actual consumption, human preference, and expected types [12]. This study presented Haidian District in a 500 m × 500 m mesh with 1854 grids, and then respectively calculated the ESS and ESD of each grid. In this study, ESS refers to ecosystems’ capacity to provide ecosystem products and services. It is assessed with the ESV based on land use. ESD includes not only products or services that can be gained (have been consumed) but also includes products or services that are desired. It is the level of human expectation for ecosystem services based on land use. The ESD will be evaluated by means of an ESD model that is constructed based on the proportions of construction land area and POI data. On this basis, this paper analyzed the spatial distribution characteristics of ESS and ESD and used the method of bivariate local spatial autocorrelation (LISA) cluster maps to divide the types of ESS and ESD (Figure 2).

3.1. ESS Evaluation

The study on ESS mainly draws upon the classification system in the Millennium Ecosystem Assessment (MA) and uses methods such as evaluation model and ecological footprint to reveal time and space changes such as substance and value [3,20,21,22]. The ESV represented by the research of Costanza can evaluate the functions of different ecosystem services and compare them in time and space, being widely applied both home and abroad [23]. Xie built a Chinese ecosystem unit area ESV equivalent form based on Costanza’s result [24]. According to the MA classification system and the value equivalent achievements of Xie, this study divided the ESS function into four functions including supply, regulation, culture, and support and nine sub-level functions (Table 1). Considering differences in national and regional dimensions, equivalent coefficients were modified: the supply service equivalent of cultivated land, forest land, and water body was modified by the output value of agriculture, forestry, animal husbandry, and fishery in the statistical yearbook; the regulation and support services by the forest land coverage rate; and culture services by the mean value of supply, regulation, and support services. The detailed method of modification is as follows:
k = h i H i .
In Formula (1), k is the modification coefficient; hi represents the mean value of i function of Beijing; Hi indicates the mean value of i function of China. Eventually, the unit area ESV of Haidian District, Beijing (Table 1) was determined.

3.2. ESD Evaluation

At present, there are three major evaluation methods for ESD. First, representative indexes such as night light, construction land ratio, GDP, and population density are selected to evaluate the degree of ESD [10,25]. Generally speaking, the representative indexes include the following types: first, the proportion of construction land, reflecting land use and population status; second, population density, reflecting population status; third, night-light data, reflecting land use and population. These indicators are generally used alone or as a comprehensive indicator. In general, land use and population need to be considered in the index. Moreover, most of these studies concluded the general regional conditions based on administrative regions but it is hard to achieve fine application and management. Second, the demand of a certain ecosystem services is quantified [26]. In this case, the evaluation results for a single ESD may be accurate but limited guidance is offered for the overall adjustment of regional land use. Third, an ESD matrix is constructed according to the types of land use, which can point out the differences between different land types in terms of ecosystem services [5,11,27]. Being simple and practicable, this approach allows ESS and ESD comparison and applies to the circumstance of large regional differences and data deficiency. However, it mainly considers the types of land use and ignores social and economic factors. Population, land use, economic development level, and human development level all influence the ESD. Hence, based on the first method, this study took into account all these factors and built an ESD index evaluation model. The model integrated the construction land ESD equivalent and the POI kernel density estimation (KDE) including static and dynamic aspects. In which, the “construction land ESD equivalent” was calculated based on the type of the construction land area and ratio. It considered such factors as land use, population, and economic development being the static expression of regional ESD. Furthermore, the POI KDE, as the dynamic expression of regional ESD, involved population, economic development level, and human development. The combination of the two can comprehensively reflect regional ESD from multiple perspectives such as land use, population, and economy from static and dynamic aspects.

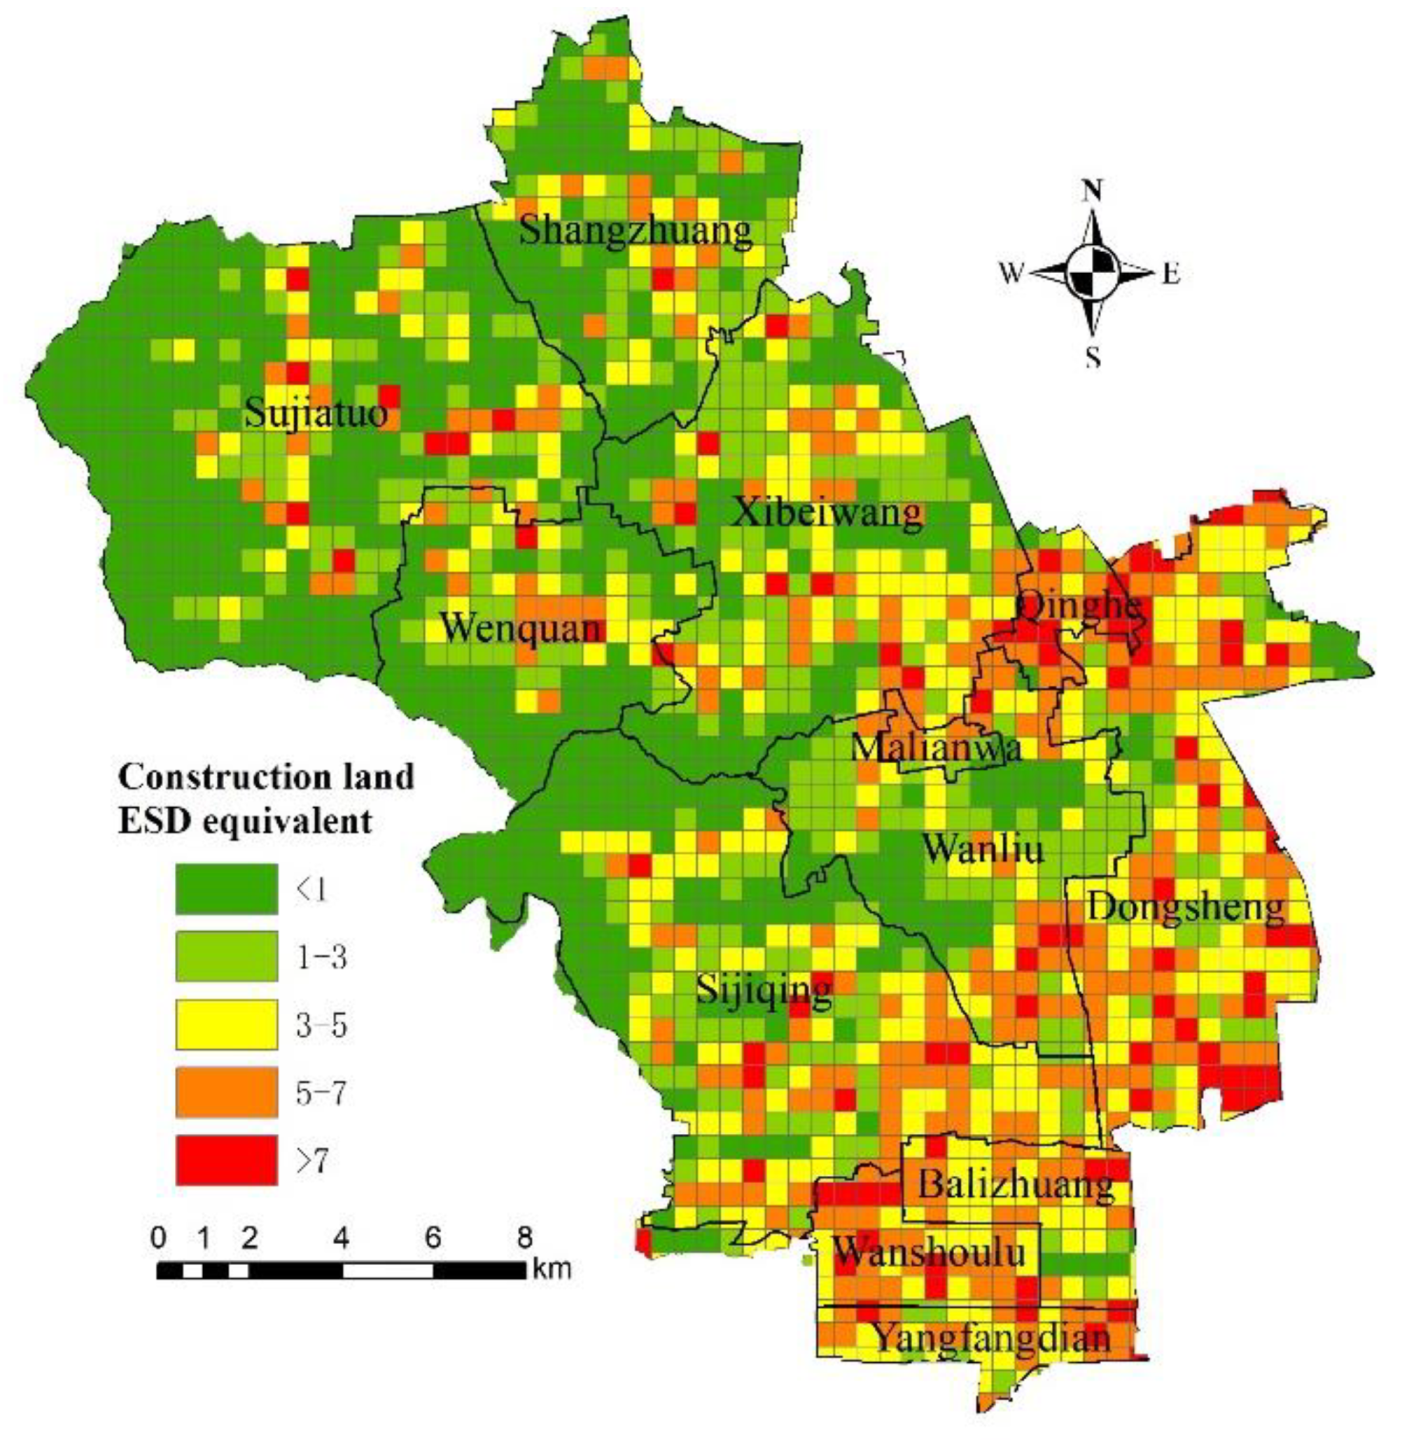
3.2.1. Construction Land ESD Equivalent
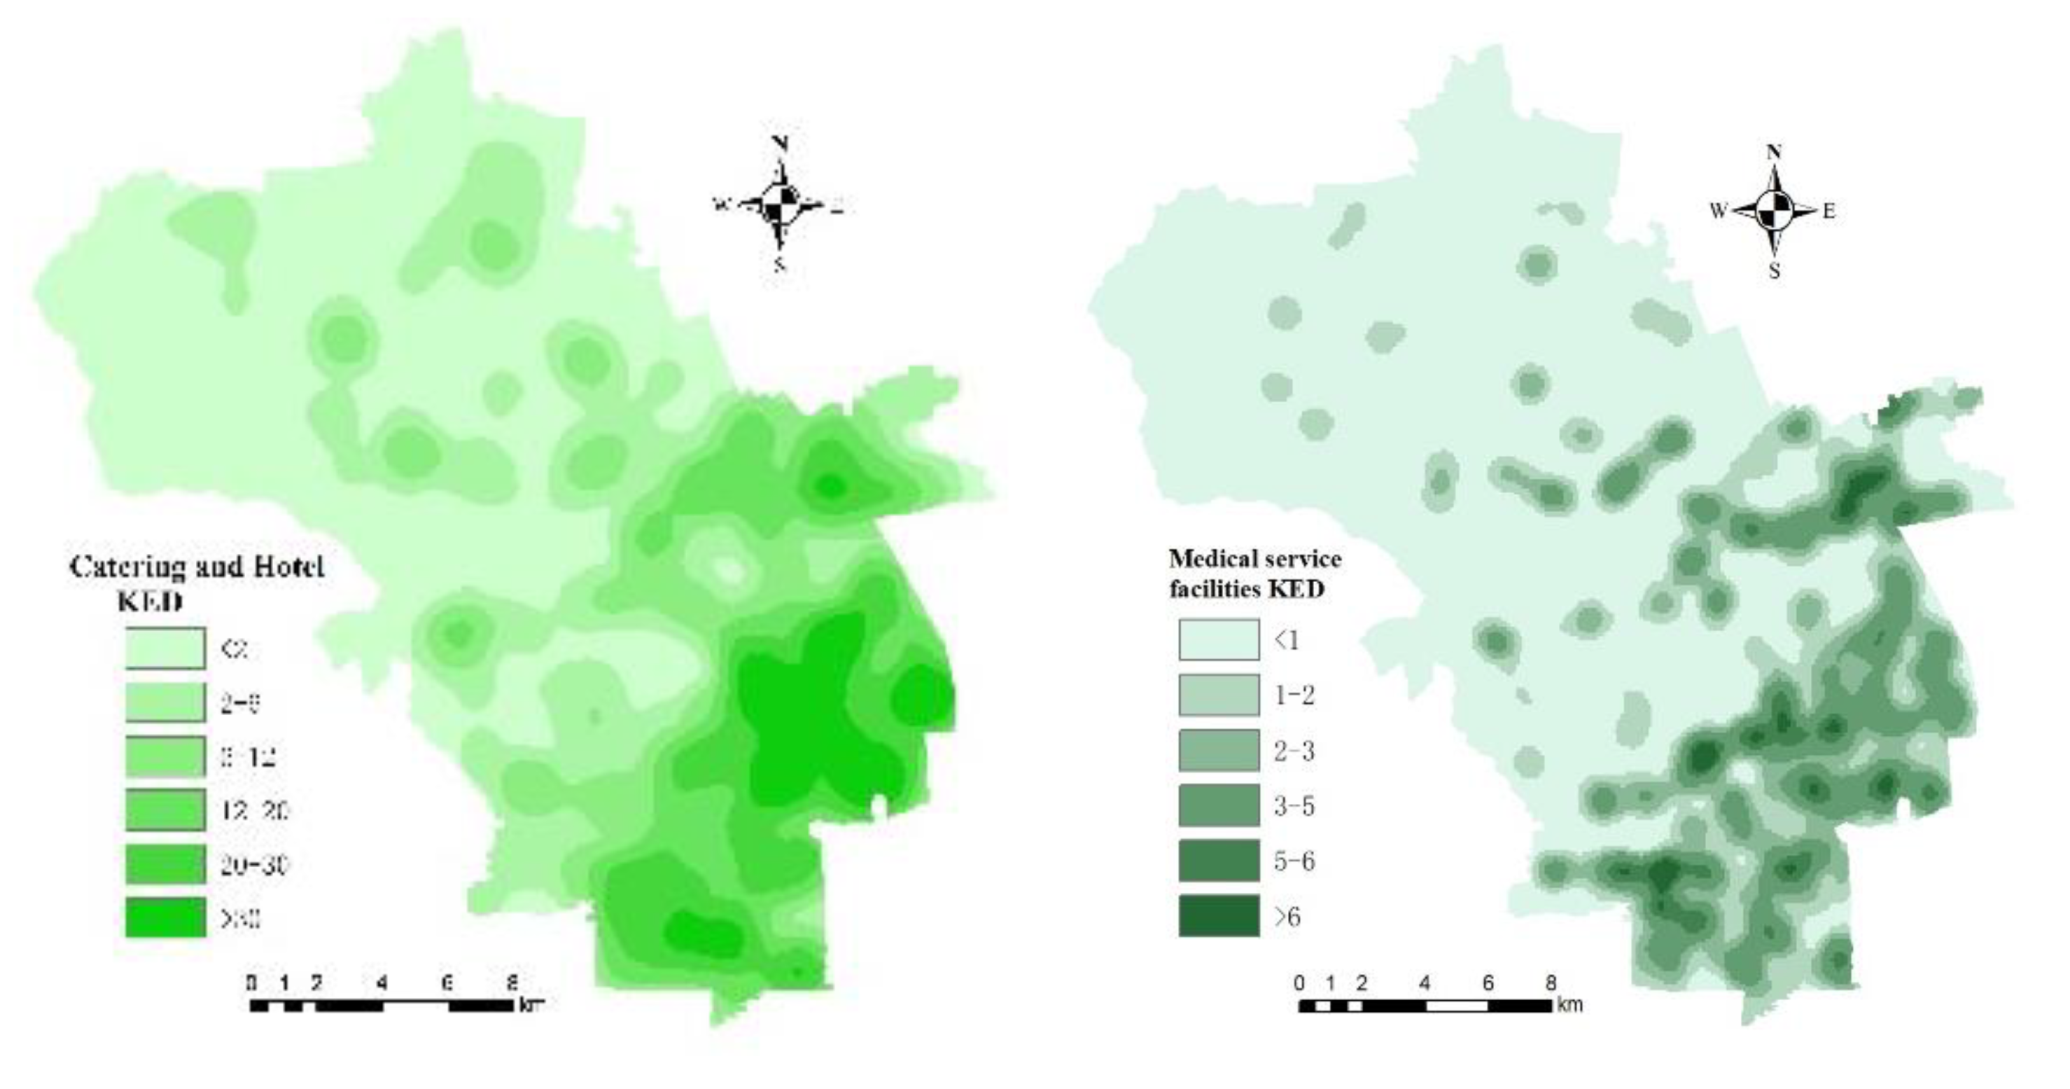
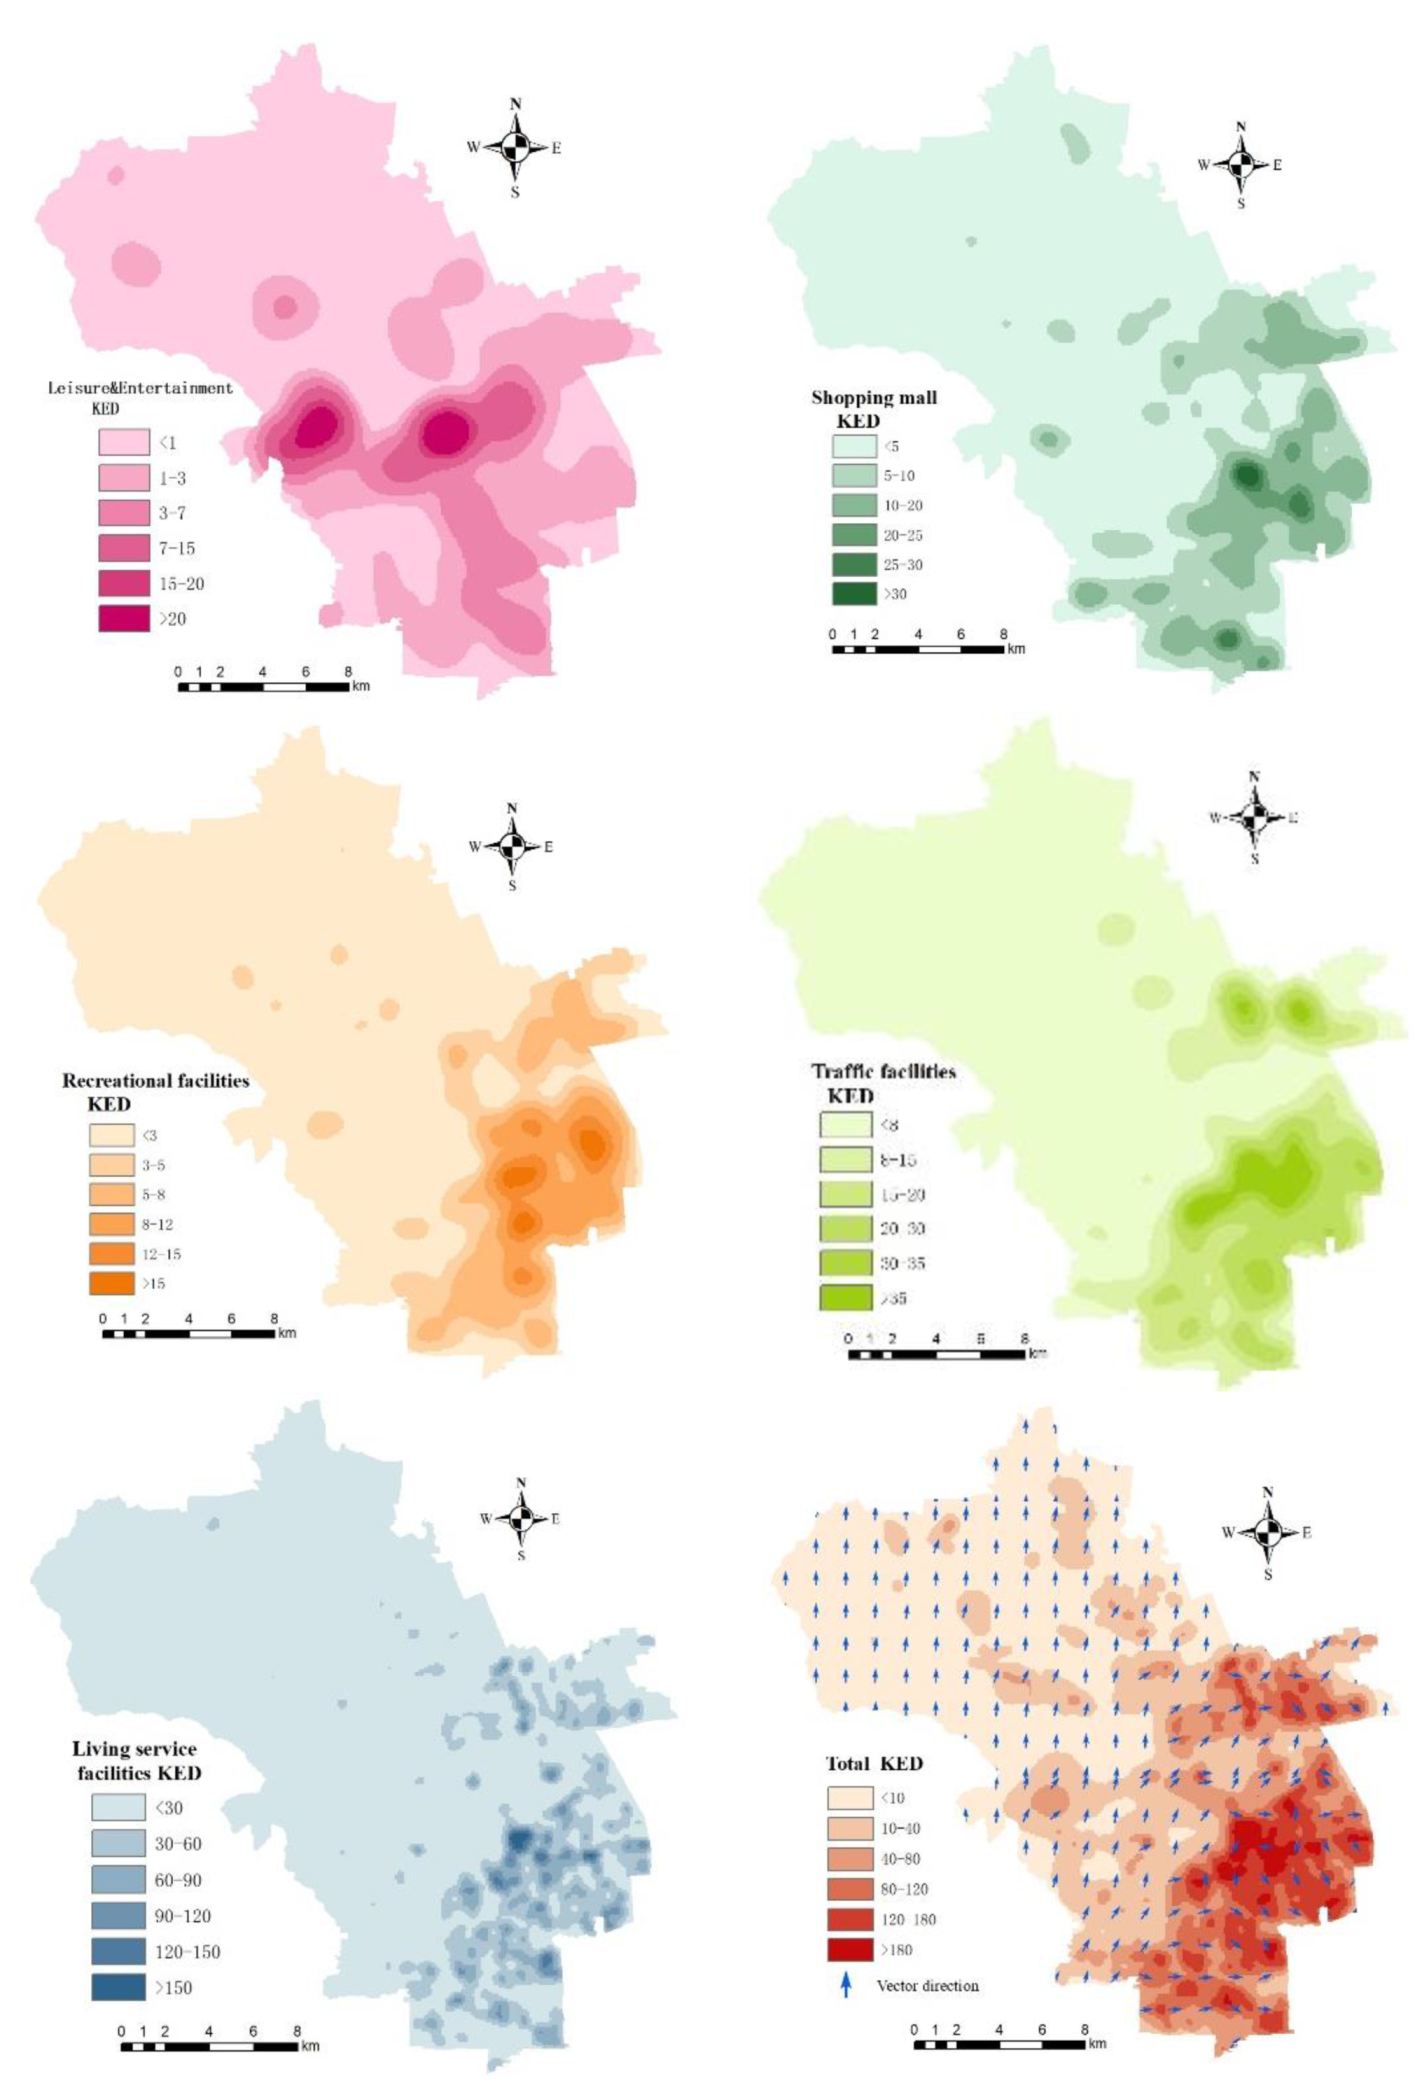
Construction land refers to the land on which buildings and other structures are constructed, reflecting human impact and change in land use. Some scholars assessed its ESV as negative [28,29]. Construction land is the main demand side of ecosystem services, as land that provides ESS is converted to construction land, not only are varying amounts of ESS lost, but the ESD increased and the amount of needed land with the ability to supply ecosystem services also increases. Except for certain cultural services, construction land does not fulfill services of supply, regulation, and support. The negative value evaluation actually indicates the ESD of construction land. The higher the ratio of construction land area, the higher the ESD. Moreover, the ESD of different types of construction land varies largely. This study subdivided construction land into residential land, commercial land, mining and industry land, management-services land, and road. Generally speaking, the degree of ESD was ranked as follows: commercial land > residential land > mining and industry land > management-services land > road. According to the value assignment results and ratios for the ESV of construction land in existing studies, this study consulted with more than ten experts in the field of ESV and proposed the concept of “construction land ESD equivalent”. The road was used as the benchmark. Suppose that the construction land ESD equivalent of road was 1. The construction land ESD equivalent of commercial land, residential land, mining and industry land, and management-services land was determined as 10, 8, 4, and 3, respectively. The degree of regional ESD was represented by the scale of ESD equivalent. The bigger the construction land ESD equivalent value, the higher the proportion of construction land and higher regional ESD.

3.2.2. POI KDE

The service target of ESD is human beings. Human activities show dynamic changes in space so it is hard to effectively express dynamic changes in population flow, economic status, and human development level on a medium and small scale with just the types of construction land and ratios. Therefore, this study used POI KDE to manifest the degree of dynamic regional ESD. The larger the KDE, the more prosperous the regional economy, the higher the degree of human activity, and the greater the ESD. POI data are a kind of spatial big data that represent genuine geographic entities [30]. It covers the location information and attribute information of varied urban facilities and effectively represents urban habitat status. Some studies showed that the density analysis of POI data could reflect urban economic hotspots and urban population distribution [31,32]. Compared to quadrat density and Voronoi diagram density, KDE has more advantages with respect to the expression of POI spatial features [33]. Kernel density estimation (KDE), which mainly uses moving lattice cells to estimate the density of point or broken-line elements in spatial scope can continuously simulate the density value of points or broken lines in unit area [34]. It is a visual tool that describes the cluster characteristics of geographic entity spaces.
f ( x ) = 1 n h j = 1 n k ( x x j h ) ,
where f(x) is the kernel density value of x; k ( x x j h )   is a kernel function; h is the search radius; x - xj is the distance from the valuation point to sample xj. Selecting the right value for h is the key for KDE analysis. China’s existing criteria and the actual conditions of Haidian District were combined to determine the classification and influence scope of different POI types, which was regarded as the value for h (Table 2). Given the aforementioned analysis, this paper chose seven POI types which were closely related with population flow, including catering and hotel facilities, traffic facilities, shopping malls, living services facilities, cultural and educational facilities, recreational facilities, and medical service facilities. Kernel density analysis was conducted on different types of POI on the basis of different h values. Then, they were added to calculate the total POI KDE.

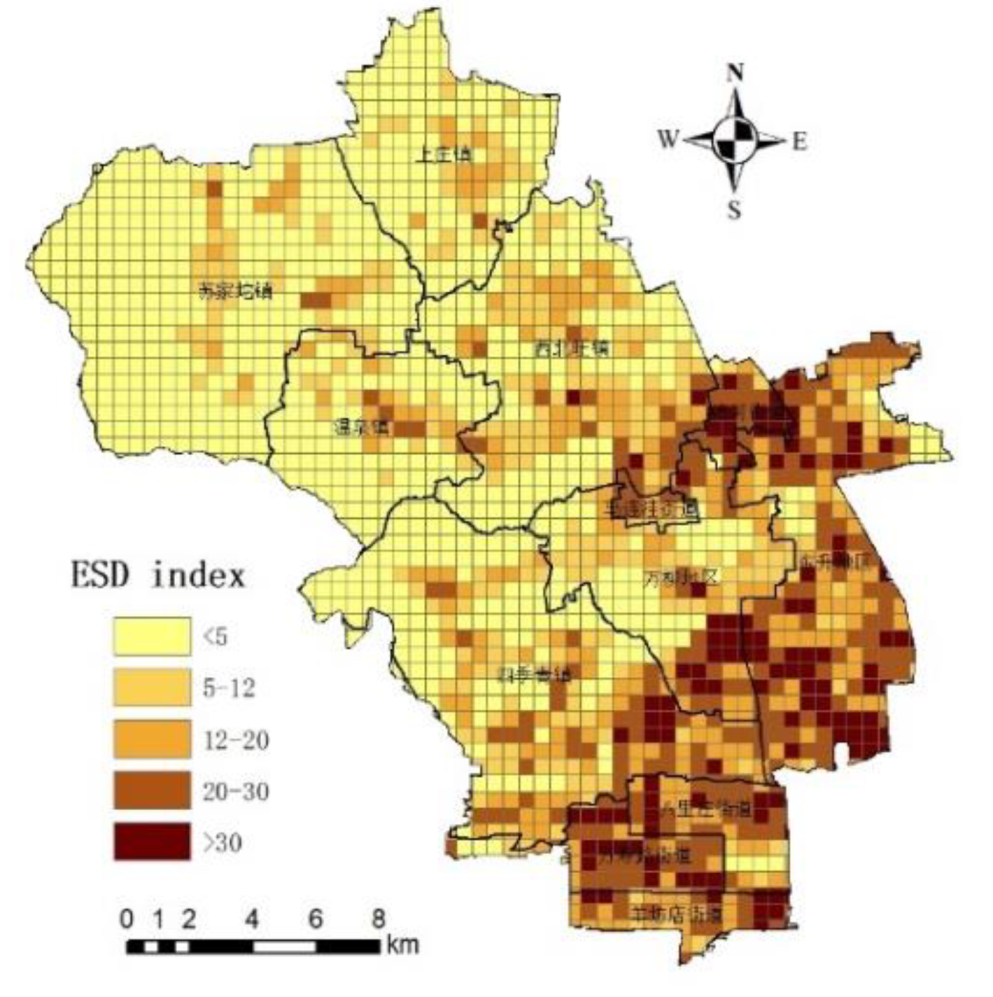
3.2.3. ESD Evaluation

An ESD evaluation model is constructed pursuant to the analysis above:
s = 1 λ P s D s ×   ln   ( f   ( x ) ) .
In the formula, D represents the ESD index of the assessed grid; λ means the total quantity of construction land types in the grid (whose value is between 0 and 5); Ps indicates the ratio between the area of s construction land and the total land area of the grid in which the land is located (whose value is between 0% and 100%); Ds implies the construction land ESD equivalent of s (whose value is 1, 3, 4, 8, and 10); f(x) stands for POI KDE. Concerning the large order of magnitude and dramatic fluctuation in POI KDE, its logarithm was taken in a statistical sense for reasonable and convenient subsequent analysis. The outcome did not affect the overall distribution trend.

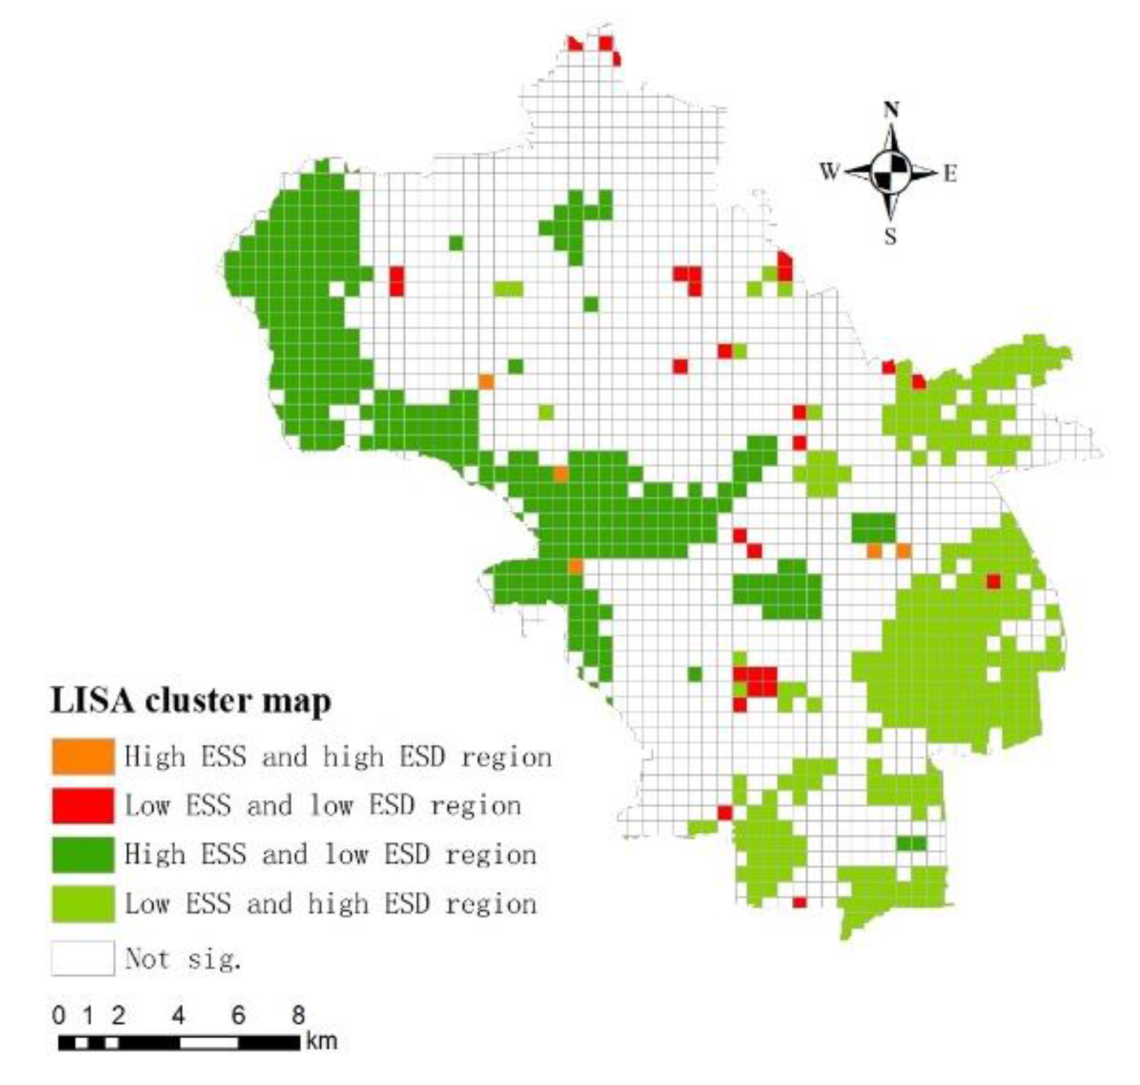
3.3. Region Division for ESS and ESD

This study used bivariate spatial autocorrelation analysis to determine the spatial correlation between ESS and ESD and summarized different types of ESS and ESD [35]. Its formula is shown below:
I l m p = z l p q = 1 n W p q × z m q .
In the formula, z l p   =   X l p X ¯ l σ 1 ; z m p = X m q X ¯ m σ m ; X l p   is the value of the attribute l of space unit p; X m q   is the value of the attribute m of q; X ¯ l and X ¯ m   are respectively the mean value of attribute l and m; σ 1 and σ m   are, respectively, the variance of attribute l and m.

4. Results and Discussion
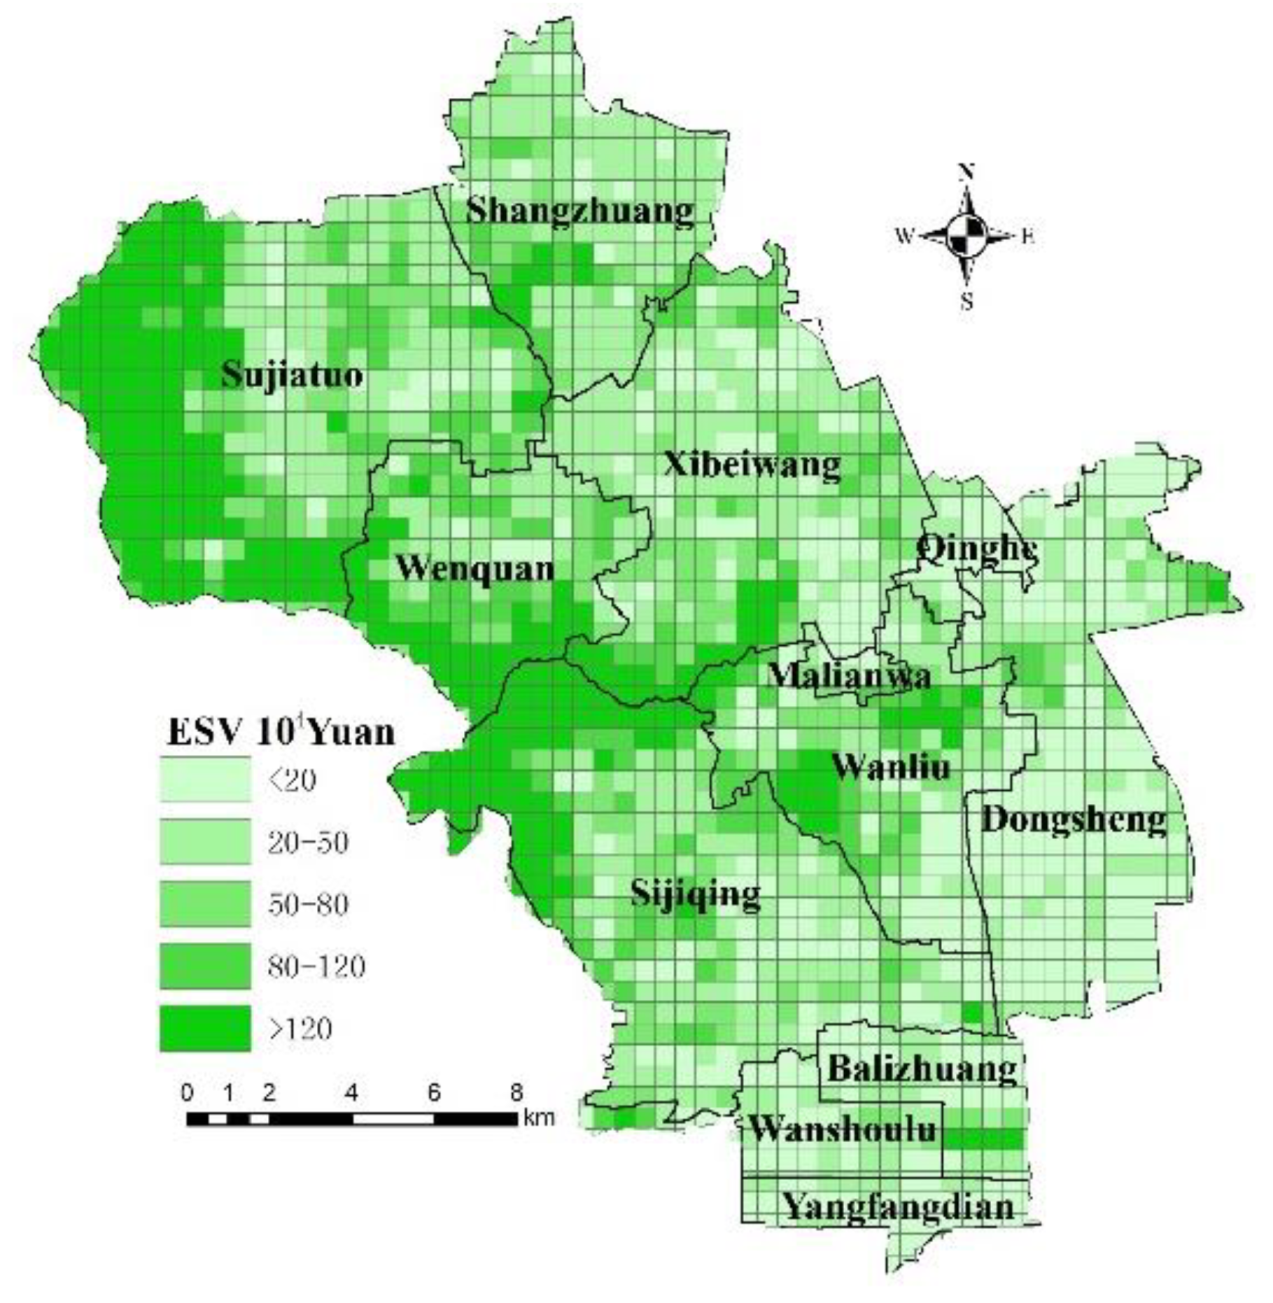
4.1. ESS

The total ESV in Haidian District was RMB (Chinese monetary unit, Yuan) 10.12 × 10⁸. The ESV of each grid was between RMB 0 and RMB 2.4787 million. In terms of space distribution, it took on an obvious trend of increase from the southeast to the northwest (Figure 3). As shown in the picture, the ESV of the south and the midwest in Haidian District was on the low side, and the value of most grids was lower than RMB 200,000; the ESV of the central part and the north was mostly between RMB 200,000 and RMB 500,000 while few grids were between RMB 500,000 and RMB 800,000; the grid value of the northwest was higher, and the value of most grids was more than RMB 1.2 million. On the whole, the region ESS in Haidian District was the northwest; the ESS gradually decreased from the northwest to the southeast. The major reason was as follows: ESS was calculated based on the types of land use, and the major type of land use in the northwest was forest land, whose unit-area ESV was quite high. On the other hand, in the south, the forest land was reduced and the area of construction land occupied a higher proportion, which indicated the total ESV gradually declined.

4.2. ESD

Figure 4 showed the construction land ESD equivalent in Haidian District based on the grid. The construction land ESD equivalent of each grid was between 0 and 10. The high-equivalent grids demonstrated the characteristic of multicenter clusters, mainly located in the south and the east. On the one hand, it was because the proportion of construction land area was high; on the other hand, it was because there were many types of construction land with a high construction land ESD equivalent. The proportion of commercial and residential land was large in the south, while the residential land took up a large area in the east. Therefore, in this area, the construction land ESD equivalent was high. Moreover, it was also high in northern towns because of the concentrated construction land. The northwest is mainly forest land, with less construction land and relatively low ESD equivalent. In addition, a considerably high proportion of construction land was distributed in central towns, which led to a relatively high demand index.
Figure 5 shows the different types of POI KDE corresponded to different kinds of space distribution. Generally speaking, varied POI took on the trend of high POI KDE in the southeast and low KDE in the northwest. The POI KDE of catering and hotel and medical service facilities was similar, reflecting scattered distribution. With the southwest downtown as the center, it expanded to the northwest with multicenter distribution. In particular, Zhongguancun subdistrict and Beixiaguan subdistrict were apparently high-KDE areas, being followed by Xisanqi and Shangdi subdistricts as well as Shangzhuang Town. The POI KDE distribution of cultural and educational facilities was concentrated mainly in the southeast. Moreover, with Zhongguancun, Zizhuyuan, and Huayuan subdistricts as the center, it gradually decreased. The POI KDE distribution of recreational facilities concentrated in the center of the Old Summer Palace and Summer Palace in the central part, the center of Fragrant Hills and Botanical Garden in the west, and the center of Beijing Zoo, Zizhuyuan, and Yuyuantan. The POI KDE space distribution of shopping malls, leisure and entertainment facilities, and traffic facilities was similar, demonstrating obvious clusters. They were mainly distributed in Zhongguancun, Beixiaguan, and Zizhuyuan subdistricts in the southeast, being followed by Qinghe subdistrict and Xisanqi subdistrict, with little presence in other areas. Compared with other types, the POI KDE distribution of living services facilities was loose with multiple dots. It prevailed in the southeast largely because the number of residential buildings and office buildings was large in these areas, which meant convenient living services facilities were provided, and was rare in the northwest. It was found through the overlay analysis of different POI KDEs (Figure 5) that the comprehensive POI KDE of Haidian District was apparently characterized by high value in the southeast and low value in the northwest. The high-value area with dense distribution included Zhongguancun, Beixiaguan, Haidian, and North Taipingzhuang subdistricts in the southeast, being followed by Qinghe, Xisanqi, Shangdi, and Malianwa subdistricts. The vector direction of POI KDE also showed that the high-value areas gather in the southeast and the east; and that the POI KDE distribution in the northwest direction was disperse and balanced.
The ESD index (Figure 6) was calculated pursuant to Formula (3). As shown in the results, the ESD index of Haidian District was between 0 and 52.15, which was a large difference. Cluster distribution was reflected with high value in the southeast and low value in the northwest. In the south, with Zhongguancun Subdistrict as the center, prominent sudden changes took place from the central part to the south. Furthermore, the index of many areas was more than 30, and the number of the majority was over 20. Meanwhile, from the central part to the south, with Wanliu and Qinghe as the demarcation point, the ESD index of the northwest was mostly lower than 5 and only the indexes of the central area of few towns were between 5 and 12.

4.3. Region Division for ESS and ESD

The spatial analysis tool GeoDa was used to build a spatial weight matrix and calculate the global spatial autocorrelation index of ESS and ESD Moran’s I. According to the results, the autocorrelation Moran’s I between ESS and construction land ESD equivalent was 0.5051; the Moran’s I with POI KDE was −0.4811, and the Moran’s I with the ESD index was −0.4976. This means that an obvious spatial negative correlation existed between ESS and ESD. Based on z test (P = 0.05), a LISA cluster diagram (Figure 7) was drawn with the grid as the unit and ESV and ESD index as the variates. It showed a prominent spatial positive correlation of high–high/low–low between ESS and ESD or a prominent spatial negative correlation of low–high/high–low or non-significant spatial correlation (which was spatial randomness). In accordance with the LISA cluster diagram, Haidian District was divided into five types of ESS and ESD, namely non-significant correlation region, high ESS and high ESD region, high ESS and low ESD region, low ESS and high ESD region, low ESS and low ESD region.
The number of grids with non-significant correlation between ESS and ESD was 1216 in Haidian District, accounting for 65.59% of total grids.
The number of grids with significant high ESS and high ESD was only five, with sporadic distribution. The types of regional land use mainly included construction land, forest land, and urban green space, whose ESS capacity was huge. In the meantime, it was characterized by favorable location, developed economy, and active human activities. The region should continue to utilize its desirable location and ecological advantages, attach great importance to green land protection, and strengthen its cultural and entertainment function.
The number of grids with significant low ESS and high ESD was 292, with the greatest concentration mainly in the east and the southwest. Moreover, it was distributed in a continuous concentrated manner, with sporadic distribution in the north. The feature of low ESS and high ESD was the most prominent in the southeast, which was the economic and cultural center of Haidian District and where the ratio of construction land area was extremely high. In addition, commercial land, catering and hotel, and cultural service facilities were centralized there, along with a large population density, prosperous commerce, and a high level of economic development. This region should heighten ecological engineering construction, make the most of idle spaces, increase the area of green land, actively build green land networks, optimize green land allocation, and strengthen connectivity.
The number of grids with significant high ESS and low ESD was 310. They mainly existed in the west with continuous distribution. Additionally, they were present in the Old Summer Palace and the Summer Palace area in the central part, where the major types of land included forest land, garden, and cultivated land, with a small ratio of construction land. There was almost no large commercial institution and human activities were few. However, as the core of ecological protection in Haidian District, it had a high level of ESS and abundant ecological resources. The region should continue to emphasize the protection of ecological land, maintain the high level of ecosystem services, and remain an important ecological shelter of Haidian District.
The number of grids with significant low ESS and low ESD was 31. The major type of land use in this region was construction land and the area of forest land and grassland was small, so its ESS capacity was weak. Meanwhile, it had such characteristics as undesirable location, undeveloped economy, low population density, and insufficient distribution of facilities. This region should actively optimize the structure of land use, promote decrease in construction land based on related policies of Beijing, and construct greenbelts on the land saved from construction land and the idle land, so as to enhance its ESS capacity and improve regional environment.

5. Conclusions

There is a tremendous need to precisely master and effectively measure regional ESS and ESD to optimize the allocation of land. This study proposed an ESS and ESD evaluation method based on land use and POI data, and different regions of ESS and ESD were identified. The main conclusions are listed below:
(1) ESS was principally related with land use types, while the factors considered for quantified ESD measurement should be more comprehensive. While using land use data to assess the spatial differences in ESS, this study constructed an ESD evaluation model based on static construction land ESD index and dynamic POI KDE and explored new thoughts and methods of ESD evaluation. At the same time, evaluation on the basis of grid data was conducive to fine management and regulation on land use.
(2) As shown from the results, an apparent spatial negative correlation existed between ESS and ESD of Haidian District. The major ESS came from the northwest, while the major ESD was derived from the southeast. The main type of land use in the northwest was forest land whose unit area ESV was high. Meanwhile, the ratio of construction land area was small. The general POI KDE was low and the regional ESD was weak. By comparison, the types of land use gradually changed from the northwest to the south downtown: the area of forest land and grassland decreased, while the area of construction land increased. Furthermore, human activities were stronger; the number of POI types went up apparently; the POI KDE became obviously larger; the ESS capacity was weaker; and the ESD was robust.
(3) The results of regional division for ESS and ESD showed that the correlation between ESS and ESD in the majority of grids was not significant. The other four types demonstrated distinct distribution features: the number of grids with high ESS and high ESD and the number of grids with low ESS and low ESD were extremely small, while the distribution of the grids with high ESS and low ESD and the grids with high ESD and low ESS grids was concentrated. Different land use management and regulation measures should be taken for different types of regions to facilitate regional balance between ESS and ESD.
The ESS and ESD relationship is the current research hotspot. Compared with ESS evaluation, the evaluation of ESD is more difficult. It is no doubt insufficient to assess ESD simply based on land use conditions. Comprehensively considering the actual conditions of land use and the results of human activities is more objective and consistent with regional reality. Based on the grid data, this study took into account such aspects as land use, economic development, population distribution, and human development in the evaluation of ESS and ESD, constructed an ESD index from static and dynamic dimensions, and explored the evaluation and region division methods in a beneficial manner. Studies on more abundant systems and quantified ESD will be the research focus in the future. In particular, it is imperative to further investigate and research on the changes and coupling relations of the ESS and ESD pattern in different dimensions.

Author Contributions

Conceiving Research and Designing Research Framework, X.T., Y.L. and Y.P.; Collecting and Analyzing Data, X.T. and Y.L.; Writing the paper, X.T., Y.L. and Y.P. All authors have read and agreed to the published version of the manuscript.

Funding

This research was funded by the Beijing Academy of Agricultural and Forestry Sciences Youth Research Fund of China, grant number QNJ201902; The Beijing Natural Science Foundation surface project of China, grant number 9192 010.

Conflicts of Interest

The authors declare no conflict of interest.

References

  1. Wang, J.; Lin, Y.F.; Zhai, T.L.; He, T. The role of human activity in decreasing ecologically sound land use in China. Land Degrad. 2018, 29, 446–460. [Google Scholar] [CrossRef]
  2. Cerretelli, S.; Poggio, L.; Gimona, A.; Yakob, G.; Black, H. Spatial assessment of land degradation through key ecosystem services: The role of globally available data. Sci. Total Environ. 2018, 628, 539–555. [Google Scholar] [CrossRef] [PubMed]
  3. Arowolo, A.O.; Deng, X.; Olatunji, O.A.; Obayelu, A.E. Assessing changes in the value of ecosystem services in response to land-use/land-cover dynamics in Nigeria. Sci. Total Environ. 2018, 636, 597–609. [Google Scholar] [CrossRef]
  4. Jing, Y.C.; Chen, L.D.; Sun, R.H. A theoretical research framework for ecological security pattern construction based on ecosystem services supply and demand. Acta Ecol. Sin. 2018, 38, 4121–4131. [Google Scholar]
  5. Burkhard, B.; Kroll, F.; Nenkov, S.; Muller, F. Mapping ecosystem service supply, demand and budgets. Ecol. Indic. 2012, 21, 17–29. [Google Scholar] [CrossRef]
  6. Villamagna, A.M.; Angermeier, P.L.; Bennett, E.M. Capacity, pressure, demand and flow: A conceptual framework for analyzing ecosystem service provision and delivery. Ecol. Complex. 2013, 15, 114–121. [Google Scholar] [CrossRef]
  7. Schrter, M.; Barton, D.N.; Remme, R.P.; Hein, L. Accounting for capacity and flow of ecosystem services: A conceptual model and a case study for Telemark, Norway. Ecol. Indic. 2014, 36, 539–551. [Google Scholar] [CrossRef]
  8. Ma, L.; Liu, H.; Peng, J.; Wu, J.S. A review of ecosystem services supply and demand. Acta Geogr. Sin. 2017, 72, 1277–1289. [Google Scholar]
  9. Bai, Y.; Wang, M.; Li, H.; Huang, S.F.; Juha, M.A. Ecosystem service supply and demand: Theory and management application. Acta Ecol. Sin. 2017, 37, 5846–5852. [Google Scholar]
  10. Gu, K.K.; Yang, Q.Q.; Cheng, F.; Chu, J.L.; Chen, X.H. Spatial differentiation of Anhui Province based on the relationship between supply and demand of ecosystem services. J. Ecol. Rural Environ. 2018, 34, 577–583. [Google Scholar]
  11. Guan, Q.C.; Hao, J.M.; Ren, G.P. Ecological indexes for the analysis of the spatial–temporal characteristics of ecosystem service supply and demand: A case study of the major grain-producing regions in Quzhou, China. Ecol. Indic. 2020, 108, 105748. [Google Scholar] [CrossRef]
  12. Peng, J.; Yang, Y.; Xie, P.; Liu, Y.X. Zoning for the construction of green space ecological networks in Guangdong Province based on the supply and demand of ecosystem services. Acta Ecol. Sin. 2017, 37, 4562–4572. [Google Scholar]
  13. Burkhard, B.; Kandziora, M.; Hou, Y.; Müller, F. Ecosystem service potential, flows and demands–concepts for spatial localization, indication and quantification. Landcs. Online 2014, 34, 1–32. [Google Scholar] [CrossRef]
  14. Gao, S.; Janowicz, K.; Couclelis, H. Extracting urban functional regions from points of interest and human activities on location-based social networks. Trans. GIS 2017, 21, 446–467. [Google Scholar] [CrossRef]
  15. Han, H.; Yu, X.; Long, Y. Identifying urban functional zones using bus smart card data and points of interest in Beijing. City Plan. Rev. 2016, 40, 52–60. [Google Scholar]
  16. Lin, Q.; Sun, F.; Wang, X.M.; Liao, C.; Zhang, W.X. Hierarchical system of Beijing commercial center judged from POI data. J. Beijing Norm. Univ. (Nat. Sci.) 2019, 55, 415–424, (In Chinese with English abstract). [Google Scholar]
  17. Hao, F.L.; Wang, S.J.; Feng, Z.X.; Yu, T.T.; Ma, L. Spatial pattern and its industrial distribution of commercial space in Changchun based on POI data. Geogr. Res. 2018, 37, 366–378. [Google Scholar]
  18. Dong, R.C.; Jiang, T.Q.; Li, H.H.; Li, S.Y.; Zhang, Y.L.; Fu, X. Service radii analysis of green space based on electronic navigation map POI in Beijing urban area. Acta Ecol. Sin. 2018, 38, 8536–8543, (In Chinese with English abstract). [Google Scholar]
  19. Yan, Y.; Zhu, J.Y.; Wu, G.; Zhan, Y.J. Review and prospective applications of demand, supply, and consumption of ecosystem services. Acta Ecol. Sin. 2017, 37, 2489–2496. [Google Scholar]
  20. Ling, H.; Yan, J.; Xu, H.; Guo, B.; Zhang, Q. Estimates of shifts in ecosystem service values due to changes in key factors in the Manas River basin, northwest China. Sci. Total Environ 2019, 659, 177–187. [Google Scholar] [CrossRef]
  21. Liu, G.Y.; Yang, Q. Non-monetary accounting on ecosystem services valuation: Theory and methodology. Chin. J. Environ. Manag. 2018, 10, 10–20. [Google Scholar]
  22. Martín-López, B.; Gómez-Baggethun, E.; García-Llorente, M.; Montes, C. Trade-offs across value-domains in ecosystem services assessment. Ecol. Indic. 2014, 37, 220–228. [Google Scholar] [CrossRef]
  23. Costanza, R.; d’Arge, R.; De Groot, R.; Farber, S.; Grasso, M.; Hannon, B.; Limburg, K.; Naeem, S.; O’Neill, R.V.; Paruelo, J.; et al. The value of the world’s ecosystem services and natural capital. Nature 1997, 387, 3–15. [Google Scholar] [CrossRef]
  24. Xie, G.D.; Zhang, C.X.; Zhang, L.M.; Chen, W.H.; Li, S.M. Improvement of the evaluation method for ecosystem service value based on per unit area. J. Nat. Resour. 2015, 30, 1243–1254. [Google Scholar]
  25. Li, J.H.; Jiang, H.W.; Bai, Y.; Alatalo, J.M.; Li, X.; Jiang, H.W.; Liue, G.; Xu, J. Indicators for spatial–temporal comparisons of ecosystem service status between regions: A case study of the Taihu River Basin, China. Ecol. Indic. 2016, 60, 1008–1016. [Google Scholar] [CrossRef]
  26. He, S.; Su, Y.; Shahtahmassebi, A.R.; Huang, L.Y.; Zhou, M.M.; Gan, M.Y.; Deng, J.; Zhao, G.; Wang, K. Assessing and mapping cultural ecosystem services supply, demand and flow of farmlands in the Hangzhou metropolitan area, China. Sci. Total Environ. 2019, 692, 756–768. [Google Scholar] [CrossRef] [PubMed]
  27. Wu, A.B.; Zhao, Y.X.; Shen, H.T.; Qin, Y.J.; Liu, X. Spatio-Temporal pattern evolution of ecosystem service supply and demand in Beijing-Tianjin-Hebei Region. J. Ecol. Rural Environ. 2018, 34, 968–975. [Google Scholar]
  28. Wang, W.T.; Sun, T.; Wang JX Fu, Q.; An, C.Y. Annual dynamic monitoring of regional ecosystem service value based on Multi-source Remote Sensing Data: A case of central plains urban agglomeration region. Sci. Geogr. Sin. 2019, 39, 680–687. [Google Scholar]
  29. Li, J.M.; Feng, C.C. Ecosystem service values and ecological improvement based on land use change: A case study of the Inner Mongolia Autonomous Region. Acta Ecol. Sin. 2019, 39, 4741–4750. [Google Scholar]
  30. Bao, J.; Xu, C.; Liu, P.; Wang, W. Exploring bikesharing travel patterns and trip purposes using smart card data and online point of interests. Netw. Spat. Econ. 2017, 17, 1231–1253. [Google Scholar] [CrossRef]
  31. Li, M.; Kwan, M.P.; Wang, F.; Wang, J. Using points-of-interest data to estimate commuting patterns in central shanghai, china. J. Transp. Geogr. 2018, 72, 201–210. [Google Scholar] [CrossRef]
  32. Xu, Z.N.; Gao, X.L. A novel method for identifying the boundary of urban built-up areas with POI data. Acta Geogr. Sin. 2016, 71, 928–939. [Google Scholar]
  33. Cai, X.J.; Wu, Z.F.; Cheng, J. Analysis of road network pattern and landscape fragmentation based on kernel density estimation. Chin. J. Ecol. 2012, 31, 158–164. [Google Scholar]
  34. Zhang, X.P.; Huang, P.T.; Sun, L.; Wang, Z.H. Spatial evolution and locational determinants of high-tech industries in Beijing. Chin. Geogr. Sci. 2013, 23, 249–260. [Google Scholar] [CrossRef]
  35. Yao, X.W.; Zeng, J.; Li, W.J. Spatial correlation characteristics of urbanization and land ecosystem service value in Wuhan urban agglomeration. Trans. Chin. Soc. Agric. Eng. (Trans. CSAE) 2015, 31, 249–256. [Google Scholar]
Figure 1. Location and land use types of Haidian District.
Sustainability 12 02524 g001
Figure 2. Research framework. ESS—ecosystem service supply, ESD—ecsystem service demand; POI—point of interest; ESV—ecosystem service value; LISA—bivariate local spatial autocorrelation.
Sustainability 12 02524 g002
Figure 3. The ESV of Haidian District.
Sustainability 12 02524 g003
Figure 4. The construction land ESD in Haidian District.
Sustainability 12 02524 g004
Figure 5. Results of POI kernel density estimation (KDE) in Haidian District.
Sustainability 12 02524 g005aSustainability 12 02524 g005b
Figure 6. The measurement outcome of ESD in Haidian District.
Sustainability 12 02524 g006
Figure 7. LISA (bivariate local spatial autocorrelation) cluster diagram for ESS and ESD.
Sustainability 12 02524 g007
Table 1. ESV of per unit area land use in Haidian District, Beijing (RMB/hm2).
FunctionSub FunctionForest LandCultivated LandWater BodyUnused LandUrban Green Space
Supply ServiceFood Production457.982006.27288.4161.062019.45
Raw Material Production4135.78782.45190.47122.133566.94
Regulation ServiceGas Regulation9118.521519.751076.49126.676142.34
Climate Regulation8590.852047.464348.21274.395941.83
Hydrologic Regulation8633.051625.3139619.17147.775920.71
Waste Treatment3630.522933.0431344.96548.823208.36
Support ServiceSoil Maintenance8485.293102.85865.41358.856606.70
Biodiversity Maintenance9519.572152.987239.93844.316733.36
Culture ServiceProvision of Aesthetic Landscape6352.08519.1813559.20732.904504.49
Total58,923.6316,689.2798,532.233216.8944,644.17
Table 2. Data types and influence scope of POI in Haidian District, Beijing.
TypeContentQuantity/Pcs.Influence Scope/m
Catering and hotel facilitiesHotel and restaurant, etc.3542800
Traffic facilitiesExpressway entry and exit, railway station, parking lot, etc.32371000
Shopping mallsShopping mall, supermarket, wholesale market, etc.17721200
Living services facilitiesResidential community, office building, bank, etc.56211000
Cultural and educational facilitiesUniversity, primary and middle school, museum, street service center, etc.11341500
Recreational facilitiesPark, scenic spots and historical sites, cultural square, etc.8911000
Medical service facilitiesHospital, health station, large clinic, etc.4971500

