1. Introduction
Energy security is one of the most intensely debated topics within energy economics. It is an issue for every country in the world regardless of its economic, political or military position. Energy security also seems to be a challenge for energy producers and consumers [
1]. This concept is particularly important in Europe, especially among post-communist countries. Their unique situation results from the fact that before the 1990s, most of those countries either focused on domestic energy production or importing energy resources from Russia. Following the collapse of the USSR, post-communist countries were forced to readjust their energy policies to a new political and economic landscape.
Poland, as one of these post-communist countries, started a new energy chapter in its history at the beginning of 1990s. This is true for all energy commodities Poland currently uses. However, oil and gas imports became an issue in light of uninterrupted energy supply. Additionally, due to rising environmental standards and increasing extraction costs, it has become more difficult for a country to rely on its own emission-intensive energy sources (e.g., domestic coal production). Despite this, Poland has demonstrated strong favor for domestic coal production, perceiving it as an energy independence tool.
The main goal of this paper is to analyze the energy security of Poland in terms of coal supply, especially with respect to relations between the domestic versus international coal and gas markets. In particular, we aim to empirically validate the main hypothesis that energy security in the Polish coal market is not equal in each market segment. We investigate this hypothesis by examining whether the Polish electricity and heat markets exhibit different connections with the world energy markets. We use two coal price indexes to represent the domestic coal market for the Polish electricity and heat markets. The first index we use is the Polish Steam Coal Market Index (PSCMI) 1, which refers to Polish coal prices for power use. The other index we use is the PSCMI 2, which represents the analogous prices for heating purposes. While most previous studies concerning Poland up to this point have covered energy security from the hydrocarbons and natural gas perspectives, we focus on the coal market.
Since Poland has a high self-sufficiency rate for coal, we can learn from our study that if the Polish electricity market is more connected to the international coal market than the gas market, it would be easy for Poland to secure energy in the electricity segment. However, if a domestic coal segment such as the heating market is connected to the international gas market, securing energy for this segment without relying on foreign supplies will be more difficult. This is because if the Polish heating market is affected by the international gas market, it will mean that companies and governments involved in assuring fuel sources for heating have to consider the effects of the international gas market when deciding to purchase fuels to meet the changes in the demand from the heating sector. Therefore, some segments can be managed using the current domestic coal policy, while others might need special treatment to ensure energy security. Thus, the results of this study highlights areas of focus for policy makers who are utilizing coal to secure energy. In this sense, by analyzing energy security in different market segments, our study calls for a market policy tailored to different segments, with separate requirements for different market participants.
The structure of this paper is as follows. First, we provide a review of previous studies on energy security. Second, we describe the coal market in Poland with respect to electricity and heat production. Third, we explain the research methodology and the dataset employed in this study. Then, we present the empirical results. The last section summarizes and concludes.
2. Literature Review
Energy security is a concept with various definitions. Between 2001 and 2014, more than 104 papers were published with 83 different ideas on what energy security truly is [
2]. Researchers have reached a consensus that the energy security concept is “ambiguous” [
3], “ubiquitous” [
4,
5], “widely disputed” [
6] and “remains poorly” or at least “not clearly defined” [
7,
8]. Scientists indicate that they have difficulty in interpreting the energy security definition [
9]. Additionally, researchers claim that “there is little consensus” [
10] over the energy security phenomenon, “there is no common interpretation” [
11] and “exact definition is hard to give as it has different meanings to different people at different moments of time” [
12]. In this sense energy security seems to be a concept that lacks common scientific understanding and therefore is subjected to further discussion. One of the probable reasons for the “fuzzy” nature of the energy security is the fact that it is highly interdisciplinary concept changing in time. Scientists with different research backgrounds tend to use various tools specific to their discipline. Therefore, even though they talk about the same or similar phenomenon they use different notions. At the same time, due to rapidly changing geoeconomic and geopolitical conditions, energy security and its concerns are different nowadays from 50 years ago.
Energy security discussion dates back to oil crises in the 1970s, when supply security first became important. At that time, the world focused on oil supply. However, this situation changed by the end of the 20th century. With rising environmental standards and exacerbating GHG emissions, the world has shifted its attention to fossil fuels and started to recognize natural gas as less harmful for the environment compared to crude oil and coal. Recently, natural gas has appeared at the center of the global energy security discussion. Geopolitical changes in Europe from the late 20th century also intensified the energy security debate. Therefore, a perspective from the natural gas market prevails among published papers on energy supply security [
13,
14,
15,
16].
Because fossil fuels and liquid hydrocarbons are unevenly distributed across the world, most of the nations are forced to import them. Thus, energy importing became one of the most important topics in the energy security discussion. Import diversification appeared as a key concept fueling the debate [
17,
18,
19]. Based on this string of literature, numerous researchers made efforts to establish energy security indicators. Most studies relied on import concentration (e.g., the Herfindahl-Hirschman index) or dispersion (e.g., the Shannon dispersion index) measures as the core of each indicator. Such studies modified the indicators to account for the political stability of supplier, the distance between the importer and exporter, and the level of consumption of imported fuel [
20,
21,
22,
23]. The import diversification perspective of energy security indicators can be found in Kruyt et al. [
12] and Loeschel et al. [
3].
The indicators from those studies indirectly include the perspective of domestic resources, mainly by calculating the share of imported fuel out of the total primary energy supply. To some extent, these studies show that the perspective of the domestic resource base is missing from the energy security debate. Analyzing energy security threats, Mitchell [
24] and Luciani [
14] highlighted that both imports and domestic production may pose similar threats for supply security. Mitchell [
24] accomplishes this by examining the case of British coal miners on strike in 1974, which resulted in a disruption of the coal supply.
In the energy security literature, it is silently but correctly assumed that domestic resources help bolster a country’s energy self-sufficiency. Using this logic, in an extreme case, domestic resources may create quasi-energy-autarky, inhibiting a country from energy imports. However, such circumstances are rare, and more often, energy-rich countries even trade the same energy resource with each other due to its different characteristics. This is true in the case of Poland, among other countries.
Due to the unclear nature of the energy security phenomenon, we decided to use an idea introduced by an internationally recognized body specializing in energy security, the International Energy Agency (hereinafter: agency or IEA). This agency “defines energy security as the uninterrupted availability of energy sources at an affordable price” [
25]. IEA breaks the concept into two time horizons: short and long term. The former pertains to the ability to respond promptly to changes in the balance between energy supply and demand, while the latter refers to timely investments that respond to development and environmental challenges (ibidem). The IEA definition includes two aspects of energy security: physical availability of energy and prices. Using the IEA framework, we focus on the price-dimension of energy security in this study. We study how to promote energy security in the Polish coal market divided into different segments. To our knowledge, no prior studies have examined the price dimension of energy security in a country which is equally an energy importer and exporter in the disaggregated coal market.
3. Polish Coal Market
3.1. Hard Coal Production in Poland
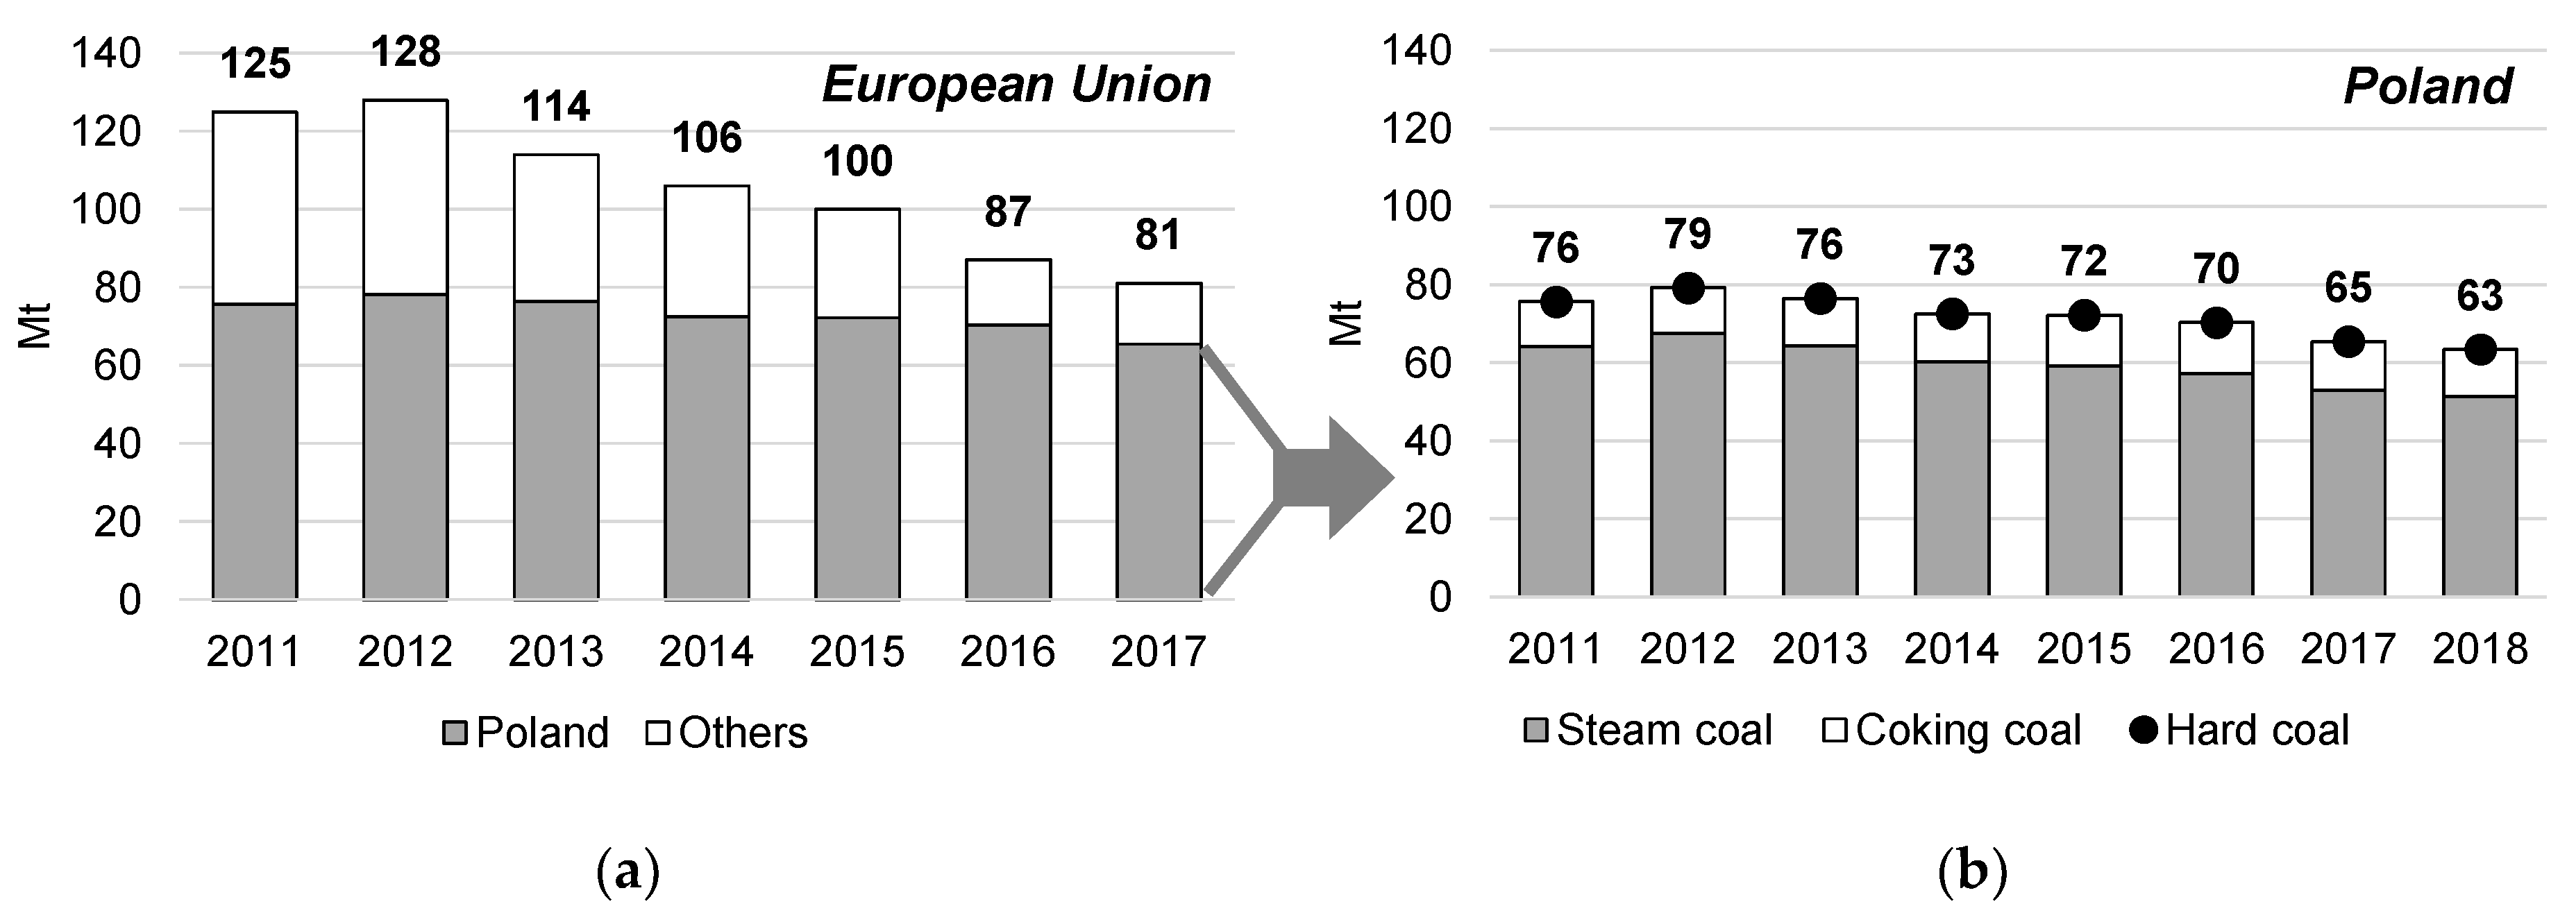
Poland is the largest producer of hard coal in the European Union, as shown in
Figure 1. In the years of 2011–2017, as much as 61%–81% of EU production of hard coal was produced in Poland (see
Figure 1a). In 2018, hard coal production in Poland decreased by approximately 16% from 2011, and amounted to 63 Mt (see
Figure 1b). As a result of the restructuring of the Polish hard coal mining industry (among others), the number of active mines was decreasing, which affected the decline in coal production.
Steam coal accounts for the majority of hard coal production in Poland: 81%–85% (see
Figure 1b). Analyzing the domestic sales of steam coal in the Polish market according to the assortment groups, it should be noted that 83%–87% of such sales consist of fine assortments. The largest recipients of coal fines are power sector (71%–78%) and heat plants (9%–12%). The domestic sales of steam coal according to the assortment groups and major recipients of coal fines in Poland are illustrated in
Figure 2.
3.2. Exports and Imports of Hard Coal to Poland
For many decades, Polish producers have provided hard coal for the domestic market. Hard coal imports were small, and only special grades of coking coal needed for coke production were imported to Poland. For many years, Poland was a significant exporter of hard coal, and in the 1970s, the share of Poland’s hard coal in the international market was approximately 19% [
43]. In 2011–2018, hard coal exports decreased from 10.6 Mt to 3.9 Mt and accounted for 6%–10% of Polish hard coal production. The volume of hard coal imports to Poland and its major exporters is illustrated in
Figure 3.
The domestic production of hard coal in Poland declined, and demand began to be supplemented with imported coal. In 2011–2018, the import of hard coal to Poland changed from 8.3 to 19.7 Mt. Except for the years 2013, 2015 and 2016, Poland was consistently a net importer of hard coal. Hard coal imports to Poland are mainly comprised of steam coal (68%–85% in 2011–2018) (see
Figure 3a). Poland mainly imports its hard coal from Russia (33%–90% in 2011–2018), the U.S. (1%–10%), and Australia (0%–11%) (see
Figure 3b).
Figure 4 shows the users of imported hard coal in Poland. The majority of hard coal sales in Poland (68%–80% in 2012–2018; detailed data on coal imports to Poland are available from 2012) are for steam coal, and the rest are derived from coking coal purchased by coking plants.
The main buyer of imported steam coal is a group of other domestic recipients. This group includes: individual recipients (households), agricultural and horticultural farms, small industry, state administration, health care, a number of unspecified recipients. During 2012–2018, this group purchased 42%–56% of imported hard coal. The total share of sales to the power sector (the power sector includes power plants and combined heat and power plants) and the industrial power sector was 10%–20%, and the share of sales to the public and nonpublic heat plants (in total) was 2%–11%.
3.3. Prices of Steam Coal in Poland
Figure 5a compares the average prices of imported steam coal with the average steam coal prices of Polish producers. During 2011–2018, the average annual price of steam coal was in the range of 9.5–12.9 PLN/GJ (see
Figure 5a). For comparison, the average annual price of imported steam coal varied from 9.1 to 13.9 PLN/GJ. As a result of many years of oversupply of coal, in period 2011–2015 prices of hard coal on the international markets were in a downward trend. The reason for this decline were, among others [
51,
52,
53]: high supply and low demand, especially weakening of the pace of development in countries which are the main users and importers of coal. In subsequent years, prices increased. Several factors contributed to this among others [
52]: increased demand from developing countries, weather difficulties among the world’s major coal exporters (destabilizing the extraction and transport of coal). Coal sales to large users in Poland (e.g., power plants, combined heat and power plants) are concluded in long-term contracts. As a result, the impact of trends in international markets (in
Figure 5a gray line) is observed with an annual shift. The prices of steam coal in Poland reflect trends from international markets.
Figure 5b compares the average annual domestic sales prices of coal fines to the major consumer groups in Poland: the power sector, heating plants (including public and nonpublic heat plants) and other recipients. After a four-year decrease in prices, in 2018, the average annual prices of coal fines in the supply to the power sector compared to the lowest prices in 2016 increased by 6%. The prices in supplies to heat plants increased by 25%, and those to other recipients increased by 41%. In 2018, prices increased by 15%, 22% and 25% year-over-year, respectively. In general, domestic prices are lower than the average price of imported coal by approximately 1–4 PLN/GJ.
3.4. Electricity and Heat Market in Poland
The availability of domestic coal deposits (including hard coal and lignite) leads to their significant use in Polish economy. During 2011–2018, electricity production changed from 159.1 to 170.5 TWh (see
Figure 6a). The largest shares in the production were hard coal-fired power plants (49%–53%) and lignite coal-fired power plants (30%–34%) (see
Figure 6b). At the same time, the share of power plants using renewable sources constantly increased (from 4% to 6%).
Figure 7 shows the structure of fuel consumption for electricity production in Poland for 2011–2018. The largest share had hard coal (55%–59%, 796–908 PJ) and lignite (33%–35%, 466–539 PJ) (see
Figure 7a). In terms of volume, hard coal consumption ranged from 37.0 to 42.6 Mt, and lignite from 58.0 to 63.3 Mt (see
Figure 7b). Notably, Polish hard coal-fired power plants use steam coal for electricity production. The average calorific value of hard coal consumed in hard coal-fired power plants in 2011–2018 was in the range: 21,072–21,673 kJ/kg (5033–5175 kcal/kg), and in lignite-fired power plants: 8022–8365 kJ/kg (1916–1998 kcal/kg). To produce the same amount of energy, coal with a lower calorific value needs to be burned in greater amount than coal with a higher calorific value. Therefore,
Figure 7b shows a significant difference between the volume of used hard coal and lignite. The years 2014–2016 deserve attention in generating electricity in coal-fired power plants in Poland. In 2014, a decrease in electricity production in coal-fired power plants in Poland (both for hard coal and lignite) was observed [
54,
55,
56,
57,
58,
59,
60,
61,
62,
63,
64,
65,
66,
67,
68,
69,
70]. This decrease was caused by renovation and decommissioning of few coal units. Continued renovation of some lignite units made in 2015–2016 contributed to a decrease in production in these power plants by 1% and 4% year-over-year, respectively. Lower production in lignite-fired power plants was offset by increased electricity generation in hard coal-fired power plants. As a result, in 2015–2016 production in hard coal-fired power plants increased annually by 2%.
In addition to the power sector, another important recipient of hard coal is heat plants. In the years of 2011–2017, heat production (gross) in Poland varied from 475 to 521 PJ, with the largest share of 40%–42% of the public power plant and the public combined heat and power plant (hereinafter: combined heat and power plant—CHP plant) (see
Figure 8a). Heat production relies mainly on solid fuels (83%–86%) and natural gas (8–12%) (see
Figure 8b). Natural gas alone accounted for an average of 86%–96% of gaseous fuels used in public and nonpublic heat plants in the period 2011–2017. The structure of producers presented in
Figure 8a is used in Polish statistical publications (for example [
54,
55,
56,
57,
58,
59,
60,
61,
63,
64,
65,
66,
67,
68,
69,
70,
71,
72,
73,
74,
75,
76,
77,
78,
79]). Autoproducing power plant produce power for its own needs opposed to public power plants and public CHP plants.
In the heating sector, the largest recipient of hard coal (more precisely, steam coal) is comprised of public heat plants (see
Figure 9a). In 2011–2017, they consumed 71–81 PJ of coal, which accounted for 90%–91% of all fuels used for heat production. The second major fuel was natural gas, whose share of total fuel consumption was 6%–8% (5–7 PJ). In the case of nonpublic heat plants, the consumption of steam coal was at the level of 3–5 PJ, and its share in the fuel mix was 42%–68% (see
Figure 9b). The second important energy carrier was also natural gas: 1–2 PJ (14%–23%).
In this context, it should be noted that the heating market in Poland also includes municipal heating plants. According to CSO [
79], between 2011 and 2017 the number of plants increased from 14.4 to 24.6 thousand boiler-houses, and sales of thermal energy changed from 186 to 205 TJ [
80,
81,
82,
83,
84,
85,
86,
87]. In the structure of fuels used for the production of thermal energy for heating purposes, coal is the most dominant fuel sources (56%–62%) [
80,
81,
82,
83,
84,
85,
86,
87]. Another important energy carrier were gas fuels (mainly natural gas). By 2012, their share was at the level of 28%–29%, and in later years, the share exceeded 30% (in 2015, it was 35%).
The share of imported coal in the power industry in recent years was approximately 1% of the total coal used by this sector. Thus, it can be noted that Polish power plants mainly used coal from domestic production. In the case of public and nonpublic heat plants, the share of imported coal amounted to approx. 5%–6%. It can be concluded that heat plants bought coal from imports more often than power plants.
The above data shows the coal market in Poland with its supply and price structure. The existence of a clear division between the electricity and heat markets will be exploited in our further analysis.
4. Methodology and Data
4.1. Stationarity Tests
To assess the price dimension of energy security in the Polish coal market, we have carried out a cointegration analysis between the coal and natural gas markets. Cointegration tests require the order of the test variables to be consistent. Thus, before performing cointegration tests, the Augmented Dickey-Fuller (ADF), Phillips-Perron (PP), Kwiatkowski–Phillips–Schmidt–Shin (KPSS), and Lee-Strazicich (LS) [
88] stationarity tests were applied on the PSCMI1, PSCMI2, coal, and natural gas series. The ADF, PP, and KPSS tests do not consider the effects of structural breaks; thus, we used the LS test, which considers the existence of such effects in the model.
In our LS unit root test, we allowed to have two structural breaks in the model. We used the LS test including both level and trend changes in the model. Let
be a time period when a break occurs,
be a dummy variable for a shift in level such that
for
and zero otherwise, and
be a dummy variable for a shift in trend such that
for
and zero otherwise. Then, the LS test performed in our study has the following data generating process:
where
P is the vector of time series variables tested for their stationarity,
, and
The lagged augmentation terms are also included in our LS model. The order of the lag is identified by the general-to specific procedure [
89].
4.2. Johansen and Bierens-Martins Tests
After the order of integration among the test variables is determined by the stationarity tests, we performed the Johansen [
90] and Bierens and Martins (BM) [
91] tests to investigate the nexus between the Polish coal market and the international coal and natural gas markets.
Both the Johansen and BM tests are performed using the following vector error correction model of order p:
where
is a k-dimensional column vector of test variables,
and
are
matrices with r cointegrating ranks,
is a constant vector,
and T is the number of observations.
and
are
fixed matrices. Denoting
, the Johansen test identifies cointegration relationships by the rank of the
matrix. In our study, we focus on the bivariate cointegration test, so when the rank of
is one, it implies that the variables are cointegrated. The rank is identified by the following trace and maximum eigenvalue test statistics:
where
denotes the estimated values of the eigenvalues. The lag order of the Johansen cointegration model is determined by the Schwarz information criterion.
The Johansen test assumes the
matrix in (2) is fixed and does not consider the dynamics of the cointegration relationship. To analyze the dynamics of the cointegration, the BM test defines a new cointegrating vector
and undertakes a time varying component in the VECM. Specifying a cointegrating vector by a finite sum of Chebyshev time polynomials
such that:
is defined as
where
for
. Here, m is the maximum order of Chebyshev polynomials and this value is set to four in our study. Substituting Equation (6) into Equation (2) gives
. Then, the time varying VECM can be presented as
Hence, the BM cointegration model can be expressed as:
where
is an
matrix of rank r, and
is defined as
Using Equation (8), we test the null hypothesis of time invariant cointegration such that , meaning , against the alternative hypothesis of time varying cointegration. Finally, because the BM test requires the test series to be cointegrated, we perform this test only between the series that were cointegrated based on the results of the Johansen test.
Since the BM test can be expected to reveal that the cointegration relationships among our test variables are time varying, we also performed the recursive Johansen test on those variables that were cointegrated. We used the trace statistics as explained in Equation (3) for this purpose. The trace statistic is first estimated over an initial sample and this statistic is re-estimated recursively at each iteration as an additional observation is added to the sample. The estimation is performed until it covers the last sample and the results are shown graphically.
4.3. Gregory-Hansen Test
To consider the effects of a structural break in the cointegration relationships, we applied the Gregory-Hansen cointegration test [
92]. In this cointegration test, a single structural break is included in the model. The break is incorporated in the model with a dummy variable
, which is defined as:
where
is the date of the break point. Using this variable, we tested the cointegration with the following model with a level shift and trend:
where
and
are our test variables,
is a constant term,
through
are the coefficient parameters, and
is an error term assumed as I(0). The cointegration analysis is performed by testing for the stationarity of
in Equation (9). The following modified ADF and PP (
and
) test statistics are used for this purpose:
4.4. Data
The Polish Steam Coal Market Index (PSCMI) is a group of price indexes for standard steam coal fines generated by Polish producers, that are sold for the production of electricity and heat in Poland. The PSCMI 1 index refers to steam coal fines sold to the power sector and industrial power plants. The PSCMI 1 reflects the coal price for electricity use. The PSCMI 2 index refers to steam coal fines sold to industrial and municipal heating plants, other industrial consumers and others. The PSMCI 2 reflects the coal price for heating purposes. The values of these indexes (expressed in PLN/t and PLN/GJ) are obtained both from the exchange information platform (GPI) established by the Polish Power Exchange, and published as the Polish Steam Coal Market Index [
45].
Figure 10 shows the data used in the calculations: prices of PSCMI 1, PSCMI 2, prices of German gas, and Australian thermal coal.
The gas price in this study is the monthly Russian natural gas border price in Germany. The unit of this price is US
$ per million metric British thermal unit and the data are obtained from the IMF (IMF primary commodity prices). This price reflects the imported Russian natural gas price in Europe and is used as the major imported gas price in Europe. The coal price used in this study is the monthly Australian thermal coal price in US dollars per metric ton. The reason of using Australian coal price as the indicator for international coal market is because Australian has been the world’s largest coal exporting country [
96]. The coal price data is procured from the World Bank [
95]. Data covered the period 2011:1–2019:1.
For convenience of analysis, we used the natural logarithm of the PSMCIs, coal, and natural gas prices in our study.
5. Results and Discussions
To investigate the order of integration of our test variables, we performed stationarity tests on these variables.
Table 1 illustrates the results of these tests. The table demonstrates that, in general, all the test variables are integrated at order one (I(1)) meaning that their first differenced series are stationary. Hence, the results suggest that our variables of interest meet the preliminary condition for performing cointegration tests.
Table 2 illustrates the results of the Johansen test. The table indicates that both PSCMI1 and PSCMI2 are not cointegrated with the natural gas price. It also presents that PSCMI1 and PSCMI2 markets are not cointegrated. Meanwhile, we find cointegration between the international coal and gas markets and among coal and the two PSCMI markets.
Since we detected cointegration relationships between can and gas and between coal and the PSCMIs, we performed the Bierens-Martins tests on these relationships.
Table 3 illustrates the BM test results. It can be inferred from the table that the cointegration relationship between the international coal and gas markets is time invariant, while those between the coal and the two PSCMI markets have time-varying relationships. This suggests that the cointegration relationships between coal and the PSCMI markets were not stable during the test period.
To understand the dynamics of the cointegration test from another perspective, we performed the recursive Johansen test between coal and gas and between coal and the two PSCMIs. This result is depicted in
Figure 11. The figure shows that coal and gas are mostly cointegrated after late 2015. On the other hand, we can see that PSCMI1 and coal were not cointegrated for most of the periods investigated in this study. Finally, it is discernible that PSCMI2 was also not cointegrated with the coal market for most of the periods, but it started to exhibit a cointegration relationship after late 2017.
The previous results investigating the dynamics of the cointegration relationships suggest the importance of considering the effect of a structural break when identifying the cointegration between our variables of interest. Hence, we performed the Gregory-Hansen test to understand the effects of structural change in the cointegration relationship. The results of this test, presented in
Table 4, indicate that when the effect of a structural break was considered, the two test statistics suggest that both PSCMI markets were cointegrated with the natural gas market. It is noticeable from the table that the significance level for rejecting the null hypothesis of no cointegration was higher for the PSCMI2 than the PSCMI1. This implies that the PSCMI2 had a stronger connection to the gas market.
On the other hand, it is also noticeable from the table that while the PSCMI1 market was cointegrated with the coal market, the PSCMI2 market did not have a cointegration relationship with the coal market. Hence, this finding suggests that PSCMI1 market is more strongly linked to the coal market compared to the PSCMI2.
6. Conclusions and Policy Implications
Energy security analysis presents a scientific challenge both from the theoretical and empirical points of view. We know that theoretical aspects of energy security require a separate in-depth study, but revealing the overall factors involved with Polish energy security was not our goal. Instead, we have decided to use the IEA concept, defining energy security as an uninterrupted availability of energy sources at an affordable price. Employing this idea, we have described energy security through its price dimension.
To do so, we have used an example of the Polish coal market disaggregated into different segments. The Polish case is interesting for further analysis as this country is both importing and exporting coal. Between 2011 and 2018, Polish hard coal exports decreased and were supplemented with imported coal. At the same time, Poland became a net importer of hard coal (with an exception in the year 2013). Polish coal imports were dominated by steam coal (68%–85% in 2011–2018). Prices of coal used in the domestic market were represented by the PSCMI 1 and 2 indexes. The former described coal prices in electricity production, while the latter signified prices in the heating sector. Using those indexes, our results of the Gregory-Hansen test revealed that during 2011:1–2019:1, the PSCMI1 had a relatively stronger market linkage with the international coal market compared to the PSCMI2. The results also proved that the PSMCI2 is more linked to the international gas market than that of the coal market. These results shed a new light on the energy security of Poland.
To date, it has been recognized that for natural gas and crude oil, Poland faces many challenges for energy security. In the coal market overall, Poland is self-sufficient because it is both a coal producer and exporter. However, within the various coal markets, our results, which demonstrate price linkages between the PSCMI1 index and the international coal market and between the PSCMI2 index and the international gas market, indicate that the Polish energy security might differ among particular coal segments. Since our result of the market linkage between PSCMI1 and international coal markets implies that the Polish electricity sector is more connected to the coal market (and resembles international coal markets) than the natural gas market, it is likely that the Polish electricity sector exhibits energy security, assuming that Polish domestic coal continues to be self-sufficient. On the other hand, we found that the heating sector, despite using insignificant quantities of imported coal, is more connected to the natural gas market. Hence, the energy security in this market might be questioned because Poland relies on other countries for its natural gas supply. By claiming this, our study confirms the result of Kruyt et al. [
12] that energy security analysis is highly context dependent.
The future energy policy of Poland is described in the draft of Energy Policy of Poland until 2040 [
97] and draft of the National Plan for Energy and Climate for 2021–2030 [
98]. The former, among others, assumes the construction of new cogeneration units in technologies: coal, gas and biomass. Additionally, local government authorities will play a special role in the implementation of state policy in the field of district heating. The National Plan for Energy and Climate for 2021–2030 [
98] clearly admits that some of the heating plants in Poland are energy inefficient. In the light of applicable legal regulations, these systems will either have to end work or adapt to CO2 emission standards. Considering the rising prices of CO2 emission allowances, one solution will be to change energy carriers. Coal can be replaced, for example, with renewable energy sources or natural gas. In the year 2040, in the heating plants, the consumption of RES (and waste) as fuel input will increase to 568 ktoe (compared to the base year 2015 increase of 13.5 times). Coal consumption is expected to drop by 82% to 437 ktoe, and natural gas will decrease by 85 ktoe to 124 ktoe. The increase in the share of natural gas in heating sector is expected to adversely influence Poland’s energy security.
Like any study, our empirical investigation has its limitations. Our results are limited by the analytical approach and data availability. First, looking at energy security only from the price perspective is a restricted approach. As shown above, it does not consider energy policy goals. Second, since we used the full range of monthly data from 2011 and 2018, the results for our energy security analysis might have been different when employing the natural gas series from other time periods. We view further energy market analyses in different market segments as a promising approach delivering interesting energy security conclusions and policy recommendations.
Author Contributions
Conceptualization, H.N.-Ł., K.A., and K.S.-S.; methodology, K.A.; formal analysis, H.N.-Ł., K.A., and K.S.-S.; investigation, H.N.-Ł. and K.A.; data curation, H.N.-Ł., K.A., and K.S.-S.; writing—original draft preparation, H.N.-Ł., K.A., and K.S.-S.; writing—review and editing, H.N.-Ł., K.A., and K.S.-S.; supervision, H.N.-Ł., and K.A. All authors have read and agreed to the published version of the manuscript.
Funding
This research received no external funding.
Acknowledgments
This publication was partially prepared within the statutory research of the Mineral and Energy Economy Research Institute Polish Academy of Sciences.
Conflicts of Interest
The authors declare no conflict of interest.
References
- Nyga-Łukaszewska, H. Energy Security in the International Gas Market; SGH: Warsaw, Poland, 2009. (In Polish) [Google Scholar]
- Ang, B.W.; Choong, W.L.; Ng, T.S. Energy Security: Definitions, Dimensions and Indexes. Renew. Sustain. Energy Rev. 2015, 42, 1077–1093. [Google Scholar] [CrossRef]
- Loeschel, A.; Moslener, U.; Ruebellke, D.T.G. Indicators of energy security in industrialised countries. Energy Policy 2010, 38, 1665–1671. [Google Scholar] [CrossRef]
- Chester, L. Conceptualising energy security and making explicit its polysemic nature. Energy Policy. 2010, 38, 887–895. [Google Scholar] [CrossRef]
- Sovacool, B.K.; Mukherjee, I. Conceptualizing and measuring energy security: A synthesized approach. Energy 2011, 36, 5343–5355. [Google Scholar] [CrossRef]
- Kisel, E.; Hamburg, A.; Haerm, M.; Leppiman, A.; Ots, M. Concept of energy security matrix. Energy Policy 2016, 95, 1–9. [Google Scholar] [CrossRef]
- Glynn, J.; Chiodi, A.; Gallachoir, B.O. Energy security assessment methods: Quantifying the security co-benefits of decarbonising the Irish Energy System. Energy Strateg. Rev. 2017, 15, 72–88. [Google Scholar] [CrossRef]
- Winzer, C. Conceptualizing energy security. Energy Policy 2012, 46, 36–48. [Google Scholar] [CrossRef] [Green Version]
- Li, Y.; Shi, X.; Yao, L. Evaluating energy security of resource-poor economies: A modified principle component analysis approach. Energy Econ. 2016, 58, 211–221. [Google Scholar] [CrossRef]
- Holley, C.; Lecavalier, E. Energy governance, energy security and environmental sustainability: A case from Hong Kong. Energy Policy 2017, 108, 379–389. [Google Scholar] [CrossRef]
- Checchi, A.; Behrens, A.; Egenhofer, C. Long-term energy security risks for Europe: A sector specific approach. CEPS Work. Pap. 2009, 309. [Google Scholar] [CrossRef] [Green Version]
- Kruyt, B.; van Vuuren, D.P.; de Vries, H.J.M.; Groenenberg, H. Indicators for energy security. Energy Policy 2009, 37, 2166–2181. [Google Scholar] [CrossRef]
- Stern, J. Security of European Natural Gas Supplies: The Impact of Import Dependence and Liberalization; Royal Institute of International Affairs: London, UK, 2002. [Google Scholar]
- Luciani, G. Security of supply for natural gas markets. What is it and what is it not? INDES Work. Pap. 2004, 2. [Google Scholar] [CrossRef] [Green Version]
- Wright, P. Liberalisation and the security of gas supply in the UK. Energy Policy 2005, 33, 2272–2290. [Google Scholar] [CrossRef]
- Cabalu, H. Indicators of security of natural gas supply in Asia. Energy Policy 2010, 38, 218–225. [Google Scholar] [CrossRef] [Green Version]
- Vivoda, V. Diversification of oil import sources and energy security: A key strategy or an elusive objective? Energy Policy 2009, 37, 4615–4623. [Google Scholar] [CrossRef]
- Cohen, G.; Joutz, F.; Loungani, P. Measuring Energy Security: Trends in the Diversification of Oil and Natural Gas Supplies. Energy Policy 2011. [Google Scholar] [CrossRef] [Green Version]
- Tufail, M.M.B.; Ibrahim, J.A.; Melan, M. Conceptualizing energy security and the role of diversification as the key indicator Against energy supplydisruption. J. Adv. Res. Bus. Manag. Stud. 2018, 11, 1–9. [Google Scholar]
- Blyth, W.; Lefevre, N. Energy Security and Climate Change: Policy Interactions; IEA: Paris, France, 2004. [Google Scholar]
- Jansen, J.C.; van Arkel, W.G.; Boots, M.G. Designing Indicators of Long-term Energy Supply Security; Energy Research Centre of the Netherlands: Petten, The Netherlands, 2004. [Google Scholar]
- Neumann, A. Security of Supply in Liberalised European Gas Markets. Diploma Thesis, European University Viadrina, Frankfurt, Germany, 2004. Available online: https://tu-dresden.de/bu/wirtschaft/bwl/ee2/ressourcen/dateien/dateien/ordner_publikationen/neumann_security_of_supply_diplomarbeit.pdf?lang=en (accessed on 16 July 2019).
- Coq, C.; Paltseva, E. Measuring the Security of External Energy Supply in the European Union. 2009. Available online: http://www.paltseva.com/Index%20paper.pdf (accessed on 16 July 2019).
- Mitchell, J. Renewing Energy Security; Royal Institute of International Affairs: London, UK, 2002. [Google Scholar]
- IEA. Energy Security. 2019. Available online: https://www.iea.org/topics/energysecurity/ (accessed on 16 July 2019).
- Euracoal. Euracoal Statistics. 2019. Available online: https://euracoal.eu/info/euracoal-eu-statistics/ (accessed on 4 April 2019).
- IDA. Basic Information about the Market and the Hard Coal Sector in Poland; Industrial Development Agency JSC: Katowice, Poland, 2012. (In Polish) [Google Scholar]
- IDA. Basic Information about the Market and the Hard Coal Sector in Poland; Industrial Development Agency JSC: Katowice, Poland, 2013. (In Polish) [Google Scholar]
- IDA. Basic Information about the Market and the Hard Coal Sector in Poland; Industrial Development Agency JSC: Katowice, Poland, 2014. (In Polish) [Google Scholar]
- IDA. Basic Information about the Market and the Hard Coal Sector in Poland; Industrial Development Agency JSC: Katowice, Poland, 2015. (In Polish) [Google Scholar]
- IDA. Basic Information about the Market and the Hard Coal Sector in Poland; Industrial Development Agency JSC: Katowice, Poland, 2016. (In Polish) [Google Scholar]
- IDA. Basic Information about the Market and the Hard Coal Sector in Poland; Industrial Development Agency JSC: Katowice, Poland, 2017. (In Polish) [Google Scholar]
- IDA. Basic Information about the Market and the Hard Coal Sector in Poland; Industrial Development Agency JSC: Katowice, Poland, 2018. (In Polish) [Google Scholar]
- IDA. Basic Information about the Market and the Hard Coal Sector in Poland; Industrial Development Agency JSC: Katowice, Poland, 2019. (In Polish) [Google Scholar]
- IDA. Sales Prices and Sales Volume of Coal, Medium and Fine Assortments and Fine Coal to Selected Groups of Recipients; Industrial Development Agency JSC: Katowice, Poland, 2012. (In Polish) [Google Scholar]
- IDA. Sales Prices and Sales Volume of Coal, Medium and Fine Assortments and Fine Coal to Selected Groups of Recipients; Industrial Development Agency JSC: Katowice, Poland, 2013. (In Polish) [Google Scholar]
- IDA. Sales Prices and Sales Volume of Coal, Medium and Fine Assortments and Fine Coal to Selected Groups of Recipients; Industrial Development Agency JSC: Katowice, Poland, 2014. (In Polish) [Google Scholar]
- IDA. Sales Prices and Sales Volume of Coal, Medium and Fine Assortments and Fine Coal to Selected Groups of Recipients; Industrial Development Agency JSC: Katowice, Poland, 2015. (In Polish) [Google Scholar]
- IDA. Sales Prices and Sales Volume of Coal, Medium and Fine Assortments and Fine Coal to Selected Groups of Recipients; Industrial Development Agency JSC: Katowice, Poland, 2016. (In Polish) [Google Scholar]
- IDA. Sales Prices and Sales Volume of Coal, Medium and Fine Assortments and Fine Coal to Selected Groups of Recipients; Industrial Development Agency JSC: Katowice, Poland, 2017. (In Polish) [Google Scholar]
- IDA. Sales Prices and Sales Volume of Coal, Medium and Fine Assortments and Fine Coal to Selected Groups of Recipients; Industrial Development Agency JSC: Katowice, Poland, 2018. (In Polish) [Google Scholar]
- IDA. Sales Prices and Sales Volume of Coal, Medium and Fine Assortments and Fine Coal to Selected Groups of Recipients; Industrial Development Agency JSC: Katowice, Poland, 2019. (In Polish) [Google Scholar]
- Stala-Szlugaj, K.; Grudziński, Z. Energy efficiency and steam coal transport over long distances. In Proceedings of the E3S Web of Conferences, Krakow, Poland, 17–19 May 2016; Volume 10. [Google Scholar]
- IDA. Import and Intra-EU Acquisition of Hard Coal; Industrial Development Agency JSC: Katowice, Poland, 2013. (In Polish) [Google Scholar]
- IDA. Import and Intra-EU Acquisition of Hard Coal; Industrial Development Agency JSC: Katowice, Poland, 2014. (In Polish) [Google Scholar]
- IDA. Import and Intra-EU Acquisition of Hard Coal; Industrial Development Agency JSC: Katowice, Poland, 2015. (In Polish) [Google Scholar]
- IDA. Import and Intra-EU Acquisition of Hard Coal; Industrial Development Agency JSC: Katowice, Poland, 2016. (In Polish) [Google Scholar]
- IDA. Import and Intra-EU Acquisition of Hard Coal; Industrial Development Agency JSC: Katowice, Poland, 2017. (In Polish) [Google Scholar]
- IDA. Import and Intra-EU Acquisition of Hard Coal; Industrial Development Agency JSC: Katowice, Poland, 2018. (In Polish) [Google Scholar]
- IDA. Import and Intra-EU Acquisition of Hard Coal; Industrial Development Agency JSC: Katowice, Poland, 2019. (In Polish) [Google Scholar]
- Lorenz, U.; Ozga-Blaschle, U. The influence of changing conditions of forecast prices of coal in international trade (in Polish). Przegl. Gorn. 2016, 5, 3–12. [Google Scholar]
- Stala-Szlugaj, K. International steam coal market—Current status and perspectives. Zeszyty Naukowe IGSMiE PAN 2018, 105, 25–40. (In Polish) [Google Scholar]
- Grudzinski, Z. International steam coal market—supply, demand, prices. Zeszyty Naukowe IGSMiE PAN 2019, 108, 5–19. (In Polish) [Google Scholar]
- ARE. Polish Power Sector Statistics; Energy Market Agency SA: Warsaw, Poland, 2012. (In Polish) [Google Scholar]
- ARE. Polish Power Sector Statistics; Energy Market Agency SA: Warsaw, Poland, 2013. (In Polish) [Google Scholar]
- ARE. Polish Power Sector Statistics; Energy Market Agency SA: Warsaw, Poland, 2014. (In Polish) [Google Scholar]
- ARE. Polish Power Sector Statistics; Energy Market Agency SA: Warsaw, Poland, 2015. (In Polish) [Google Scholar]
- ARE. Polish Power Sector Statistics; Energy Market Agency SA: Warsaw, Poland, 2016. (In Polish) [Google Scholar]
- ARE. Polish Power Sector Statistics; Energy Market Agency SA: Warsaw, Poland, 2017. (In Polish) [Google Scholar]
- ARE. Polish Power Sector Statistics; Energy Market Agency SA: Warsaw, Poland, 2018. (In Polish) [Google Scholar]
- ARE. Polish Power Sector Statistics; Energy Market Agency SA: Warsaw, Poland, 2019. (In Polish) [Google Scholar]
- PSE. The Polish Power System Operation. 2019. Available online: https://www.pse.pl/web/pse-eng) (accessed on 4 April 2019).
- ARE. Statistical Information about Electricity; Energy Market Agency SA: Warsaw, Poland, 2012. (In Polish) [Google Scholar]
- ARE. Statistical Information about Electricity; Energy Market Agency SA: Warsaw, Poland, 2013. (In Polish) [Google Scholar]
- ARE. Statistical Information about Electricity; Energy Market Agency SA: Warsaw, Poland, 2014. (In Polish) [Google Scholar]
- ARE. Statistical Information about Electricity; Energy Market Agency SA: Warsaw, Poland, 2015. (In Polish) [Google Scholar]
- ARE. Statistical Information about Electricity; Energy Market Agency SA: Warsaw, Poland, 2016. (In Polish) [Google Scholar]
- ARE. Statistical Information about Electricity; Energy Market Agency SA: Warsaw, Poland, 2017. (In Polish) [Google Scholar]
- ARE. Statistical Information about Electricity; Energy Market Agency SA: Warsaw, Poland, 2018. (In Polish) [Google Scholar]
- ARE. Statistical Information about Electricity; Energy Market Agency SA: Warsaw, Poland, 2019. (In Polish) [Google Scholar]
- CSO. Energy Statistics; Central Statistical Office: Warsaw, Poland, 2012. [Google Scholar]
- CSO. Energy Statistics; Central Statistical Office: Warsaw, Poland, 2013. [Google Scholar]
- CSO. Energy Statistics; Central Statistical Office: Warsaw, Poland, 2014. [Google Scholar]
- CSO. Energy Statistics; Central Statistical Office: Warsaw, Poland, 2015. [Google Scholar]
- CSO. Energy Statistics; Central Statistical Office: Warsaw, Poland, 2016. [Google Scholar]
- CSO. Energy Statistics; Central Statistical Office: Warsaw, Poland, 2017. [Google Scholar]
- CSO. Energy Statistics; Central Statistical Office: Warsaw, Poland, 2018. [Google Scholar]
- CSO. Energy Statistics; Central Statistical Office: Warsaw, Poland, 2019. [Google Scholar]
- CSO. Local Data Bank; Central Statistical Office: Warsaw, Poland, 2019. Available online: https://bdl.stat.gov.pl/BDL/dane/podgrup/temat (accessed on 15 May 2019).
- CSO. Municipal Infrastructure; Central Statistical Office: Warsaw, Poland, 2012. (In Polish) [Google Scholar]
- CSO. Municipal Infrastructure; Central Statistical Office: Warsaw, Poland, 2013. (In Polish) [Google Scholar]
- CSO. Municipal Infrastructure; Central Statistical Office: Warsaw, Poland, 2014. (In Polish) [Google Scholar]
- CSO. Municipal Infrastructure; Central Statistical Office: Warsaw, Poland, 2015. (In Polish) [Google Scholar]
- CSO. Municipal Infrastructure; Central Statistical Office: Warsaw, Poland, 2016. (In Polish) [Google Scholar]
- CSO. Municipal Infrastructure; Central Statistical Office: Warsaw, Poland, 2017. (In Polish) [Google Scholar]
- CSO. Municipal Infrastructure; Central Statistical Office: Warsaw, Poland, 2018. (In Polish) [Google Scholar]
- CSO. Municipal Infrastructure; Central Statistical Office: Warsaw, Poland, 2019. (In Polish) [Google Scholar]
- Lee, J.; Strazicich, M. Minimum LM unit root test with two structural breaks. Rev. Econ. Stat. 2003, 85, 1082–1089. [Google Scholar] [CrossRef]
- Ng, S.; Perron, P. Unit root tests in ARMA models with data-dependent methods for the selection of the truncation lag. J. Am. Stat. Assoc. 1995, 90, 268–281. [Google Scholar] [CrossRef]
- Johansen, S. Estimation and hypothesis testing of cointegration vectors in gaussian vector autoregressive models. Econometrica 1991, 59, 1551–1580. [Google Scholar] [CrossRef]
- Bierens, H.J.; Martins, L.F. Time-varying cointegration. Econom. Theory 2010, 26, 1453–1490. [Google Scholar] [CrossRef] [Green Version]
- Gregory, A.W.; Hansen, B.E. Residual-based tests for cointegration in models with regime shifts. J. Econom. 1996, 70, 99–126. [Google Scholar] [CrossRef] [Green Version]
- PSCMI. Polish Steam Coal Market Index. 2019. Available online: https://polskirynekwegla.pl/o-indeksie (accessed on 4 April 2019).
- IMF. IMF Primary Commodity Prices. 2019. Available online: https://www.imf.org/en/Research/commodity-prices (accessed on 18 July 2019).
- The World Bank. World Bank Commodity Price Data. 2019. Available online: https://www.worldbank.org/en/research/commodity-markets (accessed on 18 July 2019).
- Morgan, W. Pacific islands on collision course with Australia over emissions. Pac. J. Rev. 2017, 23, 25–31. [Google Scholar]
- Ministry of Energy (ME). The Draft of Energy Policy of Poland until 2040 v. 1.2. 2018; (In Polish). Available online: https://www.gov.pl/documents/33372/436746/PEP2040_projekt_v12_2018-11-23.pdf/ee3374f4-10c3-5ad8-1843-f58dae119936 (accessed on 22 May 2019).
- Ministry of Energy (ME). The Draft National Plan for Energy and Climate for 2021–2030. Annex 2–Impact Assessment of Planned Policies and Measures. 2019; (In Polish). Available online: https://www.gov.pl/web/energia/projekt-krajowego-planu-na-rzecz-energii-i-klimatu-na-lata-2021–2030 (accessed on 5 May 2019).
© 2020 by the authors. Licensee MDPI, Basel, Switzerland. This article is an open access article distributed under the terms and conditions of the Creative Commons Attribution (CC BY) license (http://creativecommons.org/licenses/by/4.0/).


