Article

Sustainability Assessment of Construction Technologies for Large Pipelines on Urban Highways: Scenario Analysis using Fuzzy QFD

Department of Civil Engineering, College of Engineering, Qassim University, 51452 Buraydah, Qassim, Saudi Arabia
*
Author to whom correspondence should be addressed.
Sustainability 2020, 12(7), 2648; https://doi.org/10.3390/su12072648
Submission received: 29 February 2020 / Revised: 22 March 2020 / Accepted: 22 March 2020 / Published: 26 March 2020
(This article belongs to the Special Issue Sustainable Assessment in Supply Chain and Infrastructure Management)

Abstract

:
Urban highways users frequently face disruptions due to construction and maintenance of buried infrastructure. In conventional open cut construction, social costs (vehicle operating and traffic delay costs) are generally high at work zone construction areas (WZCA). Municipalities also bear additional costs due to early maintenance of alternate routes, i.e., non-work zone construction area (NWZCA). Besides, work zone and non-work zone areas together experience significant potential socio-economic and environment impacts. In addition to minimal disturbance to existing socioenvironmental setting and user cost savings, trenchless construction result in agency cost savings by avoiding early maintenance at NWZCA. Past studies primarily focused on social costs associated to WZCA. In present research, a sustainability assessment framework has been developed that includes agency and user costs at both the work zone and non-work zone area. The framework evaluates various traffic detoured scenarios (for open cut construction) and trenchless technology scenario based on all three dimensions of sustainability. Fuzzy Quality Function Deployment (Fuzzy QFD) method has been used to incorporate the interaction between the agency’s sustainability objectives and public expectations for large-sized pipeline construction projects in urban areas. The framework effectively handles the uncertainties associated to data limitations and vagueness in expert opinion for subjective assessment criteria. To evaluate the pragmatism of proposed framework, it was applied on the case of a storm sewer construction project in Qassim Region, Saudi Arabia. Trenchless technology was found to be the most sustainable construction scenario followed by the open cut scenario with 50% traffic detoured to NWCA. The proposed methodology is also sought to enhance decision making process pertaining to the viability of trenchless technologies in KSA and elsewhere.

1. Introduction

Most countries around the world, including Kingdom of Saudi Arabia (KSA), are facing major challenging in managing their buried infrastructure [1]. The majority of these buried infrastructure are constructed under the paved roads in urban areas [2]. Construction phase of the large-sized pipeline projects spans over long period and affect both the natural environment and socio-economic setting of the surrounding area. The projects are owned either by the municipalities (in case of public infrastructure) or the developers (in case of privately owned neighbourhoods). In their individual capacity, both of them intend to achieve all the three dimensions of sustainability, i.e., economic, environment, and social, throughout the construction period of these projects.
Typically, conventional open cut (OC) methods are the most widely used methods for constructing and repairing the underground utilities because of their low cost compared to trenchless technology (TT). When the OC methods are used on paved roads, they typically cut the pavements that might be in a good condition. Open cutting might adversely impact pavement condition and ultimately result in high pavement restoration cost. The OC method also cause significant disruption to the traffic due to its need for a large work zone construction areas (WZCA). In addition to environmental impacts (e.g., air and noise pollution), OC methods affect the businesses and other socioeconomic activities at and around the project location [3].
Most underground utilities are constructed in urban settings and can raise significant environmental and socioeconomic concerns by the users. In the recent past, the municipalities have been shifting to the wide adoption of TT for large-sized pipelines construction projects where social costs and environmental concerns are of high importance. Trenchless construction methods have proven to minimize traffic disruptions significantly and to cause less impact on pavement condition resulting in major agency and user cost savings [3,4]. These cost savings typically are directly related to the minimization of WZCA. However, TT methods may result in cost savings (benefits) that possibly result from the non-work zone construction area (NWZCA) such as the saving in maintenance expenditures and vehicle operating cost on alternate routes. When alternate routes (urban highways) are faced with unexpected high traffic volumes due to the traffic avoiding WZCA, these roads are prone to premature pavement deterioration, which possibly increases the needs for maintenance and repair activities. Furthermore, the trenchless technology minimizes environmental impacts directly in WZCA as well as in the NWZCA by avoiding the diverted traffic in case of OC construction.
Hundreds of studies have been conducted in the past on sustainability assessment of buildings while the literature on the sustainability of core public infrastructure is relatively scanter [4,5]. In particular, very limited studies on sustainability of pipelines during the construction phase are available to date. In some of the studies, TT methods were compared with the conventional OC methods on the basis of engineering, capital, and social costs for WZCA. Detailed review of all these studies is out of scope of present research; here some relevant studies, conducted in the last two decades or so, are briefly outlined to identify the research gaps.
We found three types of studies on this topic. The first type of the studies focused on estimating the agency and user costs at the WZCA. The main limitation of such studies is that various qualitative social and environmental impacts cannot be included in the assessment process. Najafi and Kim [6] reported that TT methods are more cost-effective than traditional OC methods based on their analysis, including social costs, for construction of pipelines in urban centers. Qualitative social impacts, such as loss of business and nuisance in the NWZCA due to diverted traffic, were not considered. Matthews and Allouche [7] developed a social cost calculator, with a user friendly interface, to evaluate the construction projects involving TT methods. This work gathered useful information at a single platform and facilitates decision-making for evaluating the feasibility of TT method. However, the calculator only estimates the agency and user costs for WZCA which primarily addresses the economic dimension of sustainability.
The second type of studies conduct an overall sustainability performance assessment of infrastructure projects over their lifecycle. In these studies, typically the selected indicators, covering the three dimensions of sustainability, are aggregated into indices (or key performance indicators) to assess the overall (including operations) sustainability of infrastructure projects [8,9]. Yu et al. [10] developed a construction project sustainability assessing system for Taiwan which essentially is a four level hierarchical framework consisting of main pillars of sustainability at Level 1 and their categories, sub-categories, and indicators in the three subsequent levels. Recently, Alnoaimi and Rahman [11] developed a methodology for assessing the sustainability of sewer pipeline projects over their lifecycle. Such studies are not focused on various agency and user costs at WZCA and NWZCA during the construction phase and thus are not directly applicable to evaluate different construction methods.
Third types of studies focused on sustainability of pipeline projects during the construction phase and are most relevant to present research. Matar et al. [5] developed a sustainability assessment model for infrastructure construction projects. Their methodology was based on the system engineering concepts using flow balance of materials and energy during the project’s timeline. They applied the proposed model on a TT method named horizontal directional drilling for a pipeline construction project. De la Fuente et al. [12] developed a decision tree consisting of 10 criteria (indices) and 14 indicators for sustainability assessment of sewer construction projects. They developed value functions for all the indicators and aggregated them to develop a global sustainability index. They also performed scenario analysis for eight alternatives. However, the uncertainties associated to data limitations and vagueness in expert judgment on qualitative impacts were not addressed in these studies. Hojjati et al. [4] carried out a review of sustainability assessment tools available for infrastructure projects, including TT and OC, and highlighted the need for a more comprehensive sustainability costing model. Koo et al. [13] covered all three dimensions of sustainability to evaluate different design alternatives of underground utilities’ construction projects. They used Analytical Hierarchical Process (AHP) for estimating the indicators’ weights and used weighted sum method for finding the overall performance index for an alternative.
Based on the review of past efforts, we have identified the following three main research gaps. Firstly, past studies were primarily focused on estimating social cost savings associated with the WZCA. NWZCA cost savings may be significant and affect the TT viability assessment process but these costs have not yet been considered in the overall cost-benefit analysis. Secondly, the uncertainties associated to qualitative environmental and social impacts have not been adequately considered in most of the methodologies. Finally, the interaction between the user (public) expectations and the agency’s defined sustainability objectives has not been included in in the decision-making process. Hence, the main goal of this paper is to develop a sustainability assessment methodology which can address the above stated issues for large-sized pipeline construction projects on urban highways. We used Fuzzy Quality Function Deployment Method (Fuzzy-QFD) for evaluating different possible scenarios of ‘detoured traffic with OC method’ and the ‘TT method’. Eventually, we applied the developed methodology on an actual storm sewer construction project in Unayzah city, Qassim, KSA.

2. Methodology

2.1. Sustainability Assessment Framework

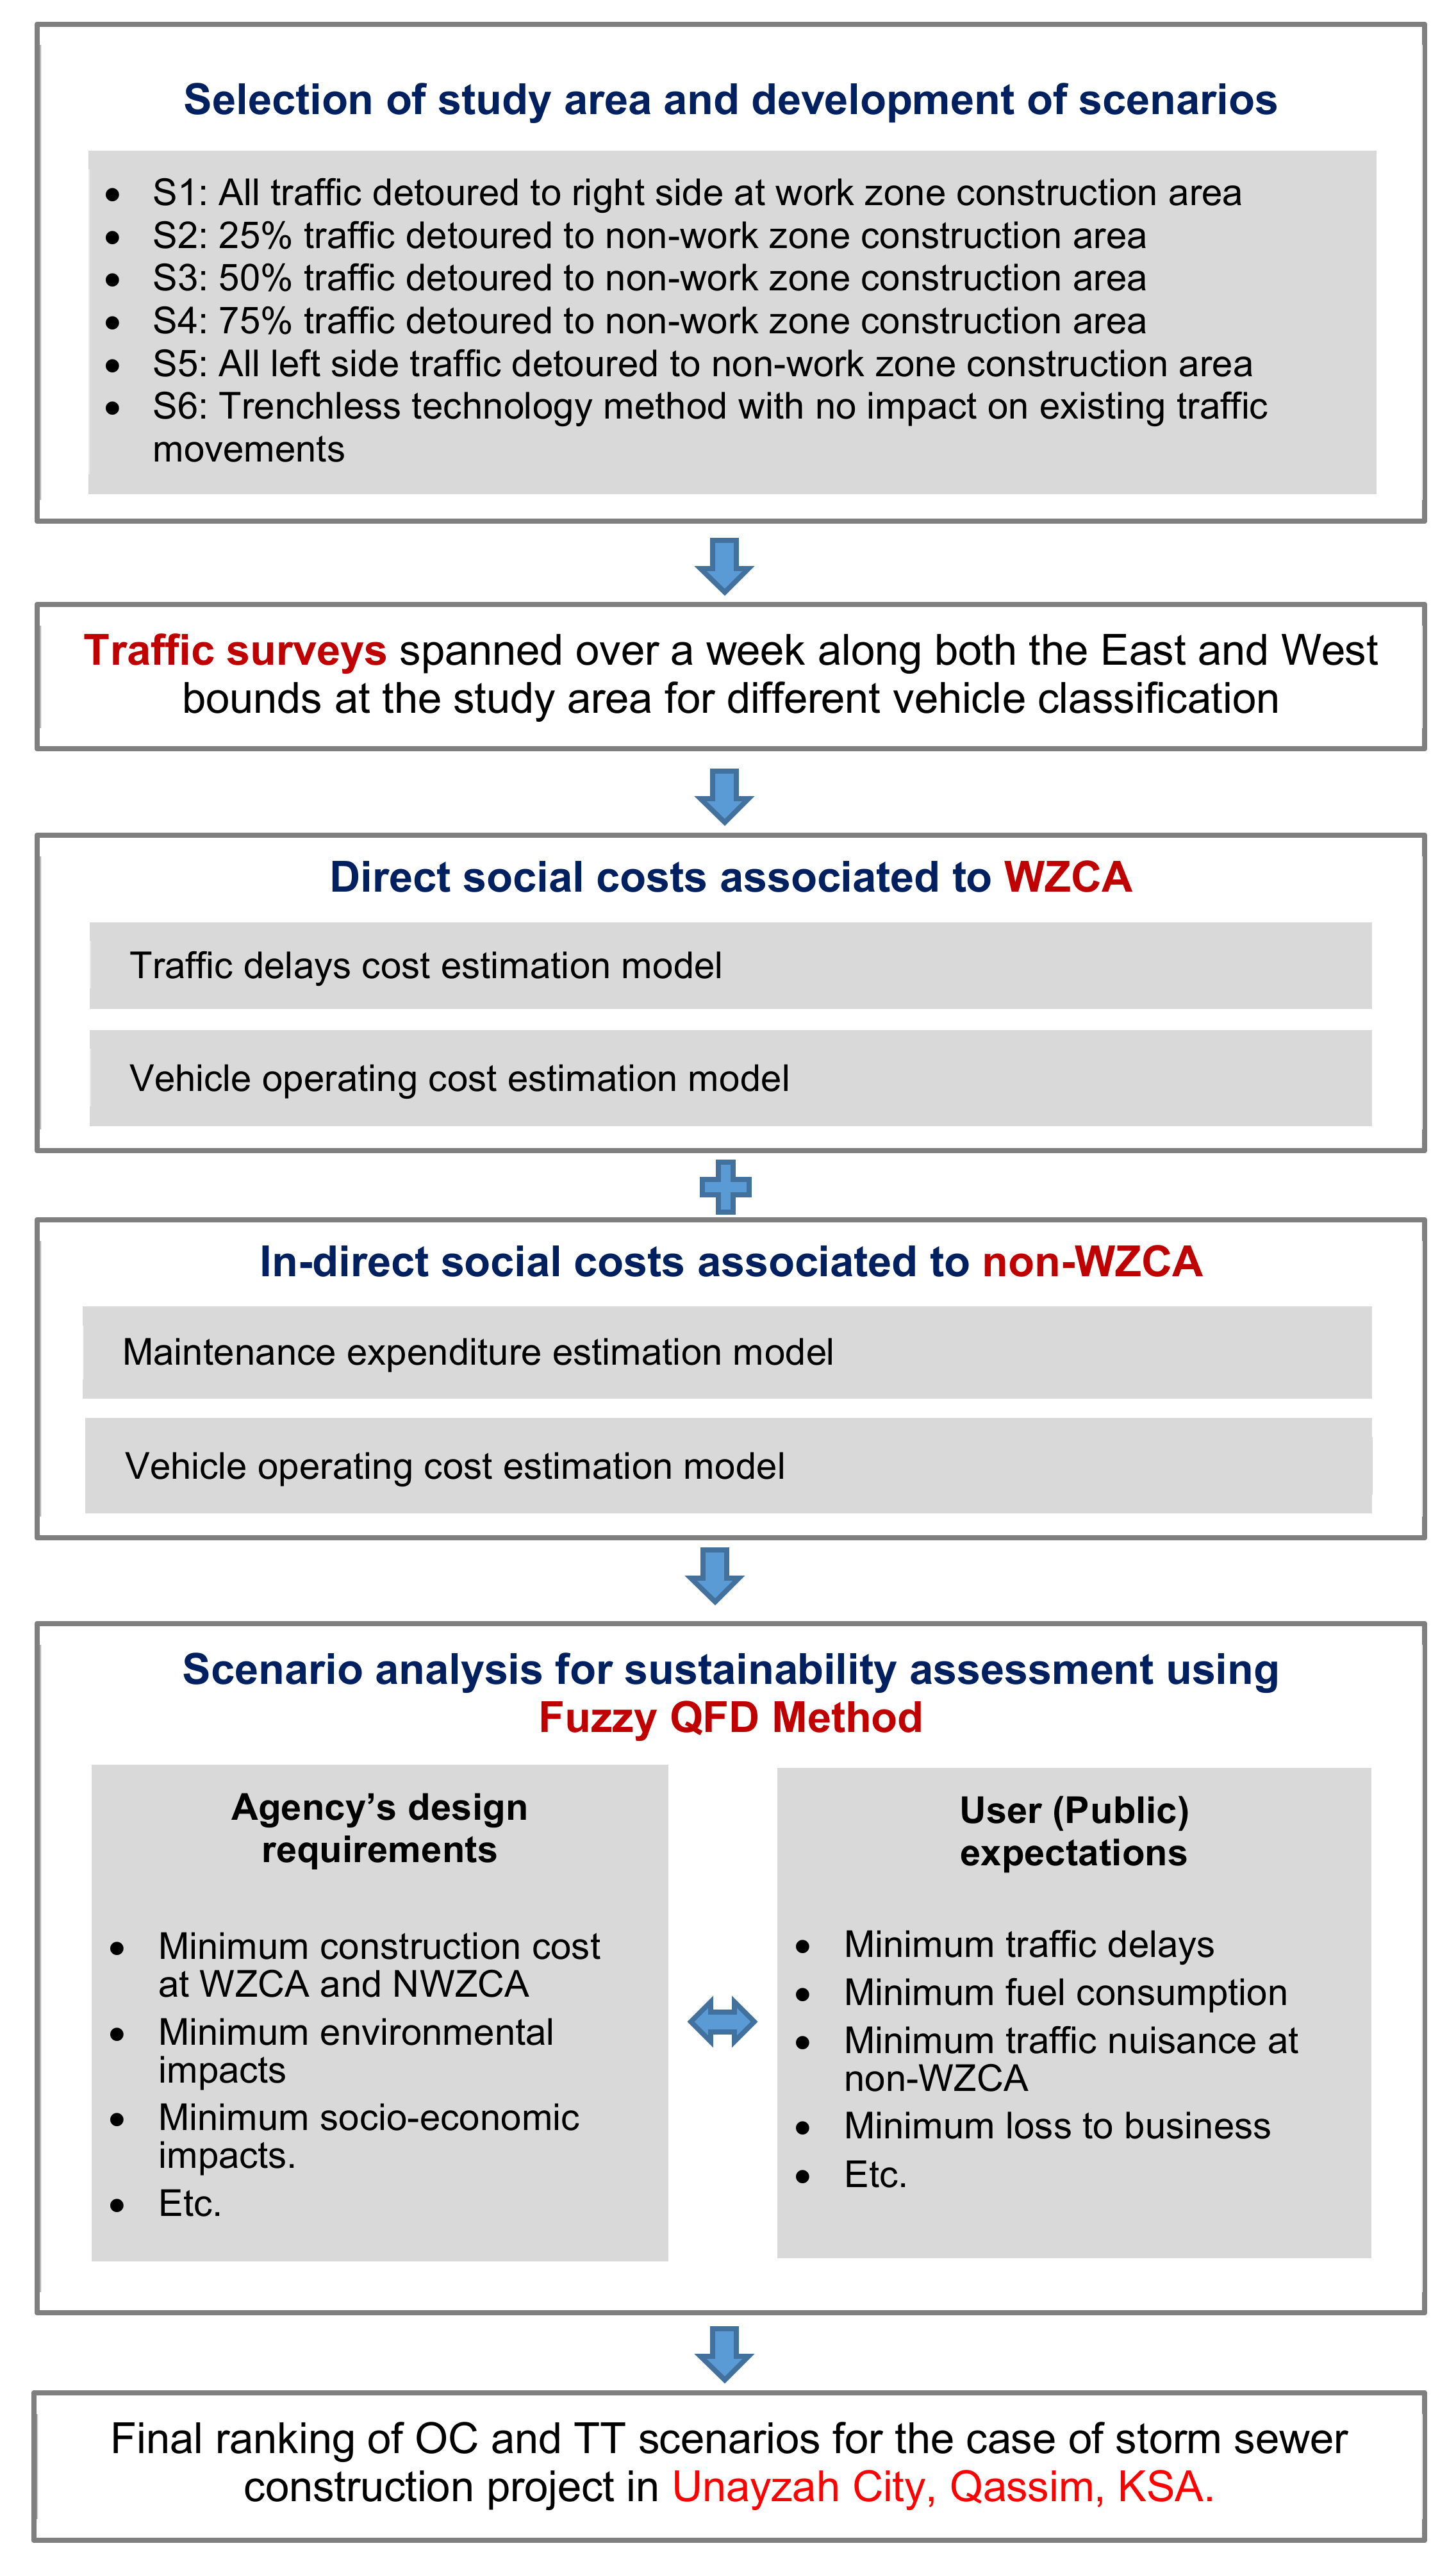
The methodological framework developed for sustainability assessment of pipeline construction projects is presented in Figure 1. The framework initiates with the development of different traffic movement scenarios for both the OC and TT options for construction of a large-sized storm sewer. After defining the boundaries of the study area, traffic surveys were conducted to find out annual average daily traffic (AADT) which is an important input to scenario analysis. In the subsequent steps social costs (both agency and user) were estimated for both the WZCA and NWZCA. Data of construction costs was obtained from the relevant agencies. Finally the framework culminates are scenario analysis using Fuzzy-QFD. This methodology is expected to overcome the limitations of previous studies by accounting for the impact of work zone areas, during an open cut, on the performance of adjacent roads in NWZCA. The method also was found effective in terms of handling uncertainties associated to vagueness in expert judgment while assessing the qualitative parameters. All the steps of the proposed framework are discussed in detail in the ensuing sections.

2.2. Social Costs at Work Zone Construction Area

Performing a utility cut requires the establishment of work zones, which are known to influence traffic mobility. In most cases, work zones delay traffic due to lane closures or block access to certain locations, forcing traffic to reroute and travel longer distances. These impacts often result in costs to the traffic users. Such costs depend mainly on the characteristics of the established work zone, for example, the lane closures and speed limits necessitated by the work zone. Existing models can be used to estimate the travel delay costs and vehicle operating costs, such as the model for travel delay costs in Equation (1) [14,15,16].
U C t t d = W Z d     j J V j     T T D j   D C j  
where U C t t d is work zone travel delay cost, W Z d is work zone duration in days, V j is the number of vehicles delayed by the speed change for vehicle class j , T T D j is the travel time difference resulting from the speed changes due to the work zone for vehicle class j in hours, D C j is the delay cost rate for vehicle class j in dollars/mile, and j is vehicle class (truck or auto).
The work zone vehicle operating costs incurred due to increased fuel consumption can be estimated using AASHTO methodology, as shown in Equation (2) [14].
U C v o c = W Z d j J V j     T T D j F g j F p j  
where U C v o c is work zone vehicle operating cost, F g j is the amount of fuel consumed due to delay in gallons/hour for vehicle class j , and F p j is the average fuel price in dollars/gallon consumed by vehicle class j .

2.3. Social Costs at Non Work Zone Construction Area

Pavement performance models are statistical models developed to represents the deterioration mechanism of pavements under different factors. These performance models are functions of the significant factors that are believed to have an influence on pavement condition. One of these factors that is proven to have an impact on pavement condition is the cumulative traffic loading. The amount of cumulative traffic loading, correlates positively with the accelerated pavement deterioration rates. Accordingly, unexpected high traffic volume on alternate routes can potentially cause these roads to have a higher deterioration rate. Therefore, to assess this reduction in pavement condition caused by increasing traffic volume, a pavement performance model needs to be developed. The general form of the performance model is termed in Equation (3).
P = f   X i ; β i
where P is the response variable of the performance model that represent the level of pavement condition and likely denoted in term of performance indices, X i = X 1 , X 2 , , X i   is a vector of predictor variables (such as material type, accumulated traffic loading, weather severity), β i = β 1 + β 2 , , β i is a set of parameters to be estimated and f   X i ; β i is a mathematical form used to describe the variation of the response as function of the predictor variables.
The cost of maintaining pavements relies significantly on its condition or state. The worse the pavement conditions get, the more likely agencies are to spend money on maintaining it [17]. Therefore, in order to estimate maintenance expenditures, the conditions of the pavement need to be assessed using Equation (3). Then, associated maintenance expenditures corresponding to those pavement conditions are estimated. The general form of the maintenance expenditures model is termed in Equation (4).
M E i = f X i ;   P i ;   β i
where M E is the maintenance expenditures for pavement section (i); X i = x 1 , x 2 , , x i is a vector of predictor variables (such as traffic level and weather severity); P i = p 1 , p 2 , , p i is pavement performance level at treatment application time; β i = β 1 ,   β 2 , ,   β i is a set of parameters to be estimated and f X i ;   P i ;   β i is a mathematical form used to describe the variation of the response as a function of the predictor variables.
User costs, typically, are those incurred by users due to their normal use of the asset over its service life. An example of these user costs is vehicle operating costs (VOC). VOC is typically represented by the amount of money (typically is expressed in cents) spent for each mile traveled by each vehicle. These costs consist of fuel, tires, repairs and, car depreciation cost due to high mileages. One of the significant factors that increases these costs is the pavement roughness level [18]. An example of the effect of poor pavement condition (very rough pavement) on VOC is that road users might drive slowly which possibly results in high fuel consumption [19]. Typically, pavement roughness is measured in term of Present Serviceability Rating (PSR) and International Roughness Index (IRI), which are typically modeled as the response (dependent) variable of a pavement performance model using Equation (3). Having pavement roughness determined, the corresponding VOC can be then estimated using the VOC model presented in Equation (5).
V O C i = f X i ; P i ; β i
where V O C is vehicle operating cost estimated for vehicle (i); X i = x 1 , x 2 , , x i is a vector of predictor variables (such as vehicle type and age); P i = p 1 , p 2 , , p i is pavement performance level; β i = β 1 ,   β 2 , ,   β i is a set of parameters to be estimated and f X i ;   P i ;   β i is a mathematical form used to describe the variation of the response as a function of the predictor variables.

2.4. Social Cost Savings with Trenchless Technology

The reduction in maintenance expenditures could cause significant agency cost savings. An example of these can be the possible reduction in maintenance expenditures that result from employing TT methods. Adopting TT, which requires no or minimal work zone areas, results in almost no traffic increase on adjacent local streets. Conversely, open cut methods typically require large work zone areas which often cause/force traffic to detour to adjacent roads resulting in unexpected traffic volume on those roads. Since the pavement deterioration rate is impacted significantly by the amount of traffic volume, the needs for maintenance and rehabilitation activities on those adjacent roads might increase. Therefore, by adopting TT, transportation agencies might minimize their maintenance expenditures on these adjacent roads.
To estimate reduction/savings in an agency’s maintenance expenditures on alternative roads, the comparison of alternative construction techniques (i.e., TT vs. open cut methods) needs to be conducted. In the case of employing TT, traffic volume on alternative roads are expected to remain unchanged. On the other hand, open cut method is expected to increase traffic volume on adjacent roads. Therefore, the extra maintenance expenditures incurred due to unexpected high traffic volume are quantified by taking the difference between the estimated maintenance expenditures on alternative roads for the open cut and TT scenarios. This difference in maintenance expenditures represents agency cost savings and can be calculated using Equation (6).
A C S s = i = 1 n [ G N O C ] i i = 1 n [ G H T V ] i
where A C S s is agency cost savings; G N O C is maintenance expenditures under normal operating condition corresponding to route i; G H T V   is maintenance expenditures under high traffic volume corresponding to route i; i = 1 ,   2 ,   ,   n represents number of adjacent routes.
Savings in VOC can be seen as a type of user cost savings. User cost savings can be estimated as the reduction in VOC when TT is implemented compared to the case where open cut method is considered. The general form of estimating user cost savings is presented in the following equation:
U C S s = i = 1 n [ V O C N O C ] i i = 1 n [ G H T V ] i
where U C S s is user cost savings; V O C N O C is vehicle operating cost under normal operating condition corresponding to vehicle i; V O C H T V   is vehicle operating cost under high traffic volume corresponding to vehicle i; i = 1 ,   2 ,   ,   n represents number of vehicles impacted by pavement condition.

2.5. Fuzzy Quality Function Deployment Method

During the recent past, QFD has been widely recognized as a decision-making tool for site selection process [20]. According to the fundamental idea of QFD, consumer needs are translated into technical requirements of the product by developing a House of Quality (HoQ) (see Figure 2). The HoQ is essentially a combinations of various matrices that translate the data or information obtained by the experts on: (i) What should be done related to the customer requirements?, (ii) How to relate customer requirements with the product requirements?, and (iii) What is the relationship between product requirements and the desired benchmarks? [21].
In present research, the agency’s objectives are essentially the design requirements (DR) while the customer requirements (CR) are the expectations of public (e.g., road users, visitors of the commercial area, and residents of both the WZCA and non-WZCA) during the period of construction. Subjective assessment of some of the agency requirements and public expectations introduce uncertainty in the decision-making process due to vagueness in expert judgment. In present research, this limitation has been addressed by integrating the fuzzy set theory with conventional QFD.
Following is the step-by-step procedure of Fuzzy-QFD for analyzing different scenarios for traffic movements due to open cut and trenchless technologies [20]:
Step 1: The customer requirements (CR) or the public expectations (PE) are defined as: (i) minimum travel time, (ii) minimum fuel consumption, (iii) minimum air and noise pollution, (iv) minimum traffic nuisance at NWZCA (e.g., increase risk of accidents and stress level in residents of a calm neighbourhood), and v) minimum loss in business. This step correspond to the component “A” of HoQ shown in Figure 2.
Step 2: The design requirements (DR), i.e., the component “C” of HoQ shown in Figure 2, are defined below as the following sustainability objectives (SO) which the agency or the private contractor require to obtain:
Low Agency Cost—this includes total cost of material, labour, and other miscellaneous costs. This also includes the pavement restoration cost in case of open cut construction along with the pavement maintenance cost at NWZCA.
Low User Cost at WZCA—This includes travel delay and vehicle operating costs at the work zone construction area.
Low User Cost at non-WZCA—It includes vehicle operating cost at NWZCA.
Low Environmental Impacts—This includes the possible increase in impacts of air and noise pollution at both the work zone and non-work zone during the construction period.
Low Socio-economic Impacts—This includes the impacts on socio-economics setting of the area, such as loss of business and increase in traffic congestion during the construction period.
Step 3: Determine the priorities of public expectations (PE) by using Triangular Fuzzy Numbers (TFNs) for defining the priority of each requirement.
Step 4: Determine the weight of each decision-maker. As all the decision-makers in present research were highly qualified and experienced with ample indigenous know-how of the study area, equal weights were allocated to all of the four decision-makers.
Step 5: Estimate the aggregated weights ( ω p ) assigned by the decision-makers for PE using the following Equation (8):
ω p = r 1 ω p 1 r 2 ω p 2   r N ω pN
where p is the number of CR (p = 1, 2,..., P).
Step 6: Ascertain the relationships among the PE and SO using linguistic scales for the TFNs illustrated in Figure 3. This step completes the component “D” of HoQ in Figure 2.
Step 7: Estimate the aggregated weights (apm) between PE and SO with the help of Equation (9).
a pm = r 1 a p m 1 r 2 a pm 2   r N a pm N
where N denotes the number of decision makers (n = 1, 2,…, N) and M is the number of DR (m = 1, 2,..., M). This Equation (9) fills component (B) of Figure 3.
Step 8: Determine the prioritized technical descriptors to complete the matrix. Equation (10) estimates the weights of the SO (fm) from the aggregated weight for PE (wp) and aggregated weights between the SO and PE (apm).
f m = ω 1 a 1 m   ω p a p m
Step 9: Evaluate each scenario (refer to Figure 1) against all the SO and the combine the results with the weight of each SO for final ranking of the scenarios. Subsequently, calculate the rating of each scenario (SR) using Equation (11).
S R k m = r 1 l r k m 1 r 2 l r k m 2   r N l r k m N
where K presents the number of scenarios (k = 1, 2, …, K).
Step 10: Calculate the fuzzy index (FI) using Equation (12) for expressing the degree to which a scenario complies with the desired SO.
F l k = 1 M L R k 1 f 1   L R k M f M
Step 11: Finally, use Equation (13) to de-fuzzify the TFNs obtained from Step 10 to rank all the pipeline construction scenarios.
R k = a + 2 b + c 4
where Rk is the priority rank of each SHP site and a,b,&c are the upper, middle, and lower bounds of the aggregated TFN.
3. Results and Discussion

3.1. Study Area

The selected study area presented in Figure 4 is Umar Ibn AlKhattab Road in Unayzah city, Qassim region, KSA. The area affected by the project is about 5 km2 and the reach of the selected urban highway for application of proposed methodology is about 2.4 km. It can be seen in the figure that starting point is 670 m higher than the mean sea level while the ground elevation is 658 m at the end of sewer line. The horizontal drilling technique was used for constructing a storm sewer of 3900 mm diameter. Some salient features of the project are presented in Table 1. This data was obtained from the Ministry of Environment, Water and Agriculture in Saudi Arabia, i.e., the client of this project. As stated above that inclusion of the economic, social, and environmental impacts of OC construction on NWZA is an important contribution of this research, some possible routes of the diverted traffic to the NWZCA are also shown in light blue colour in Figure 4.
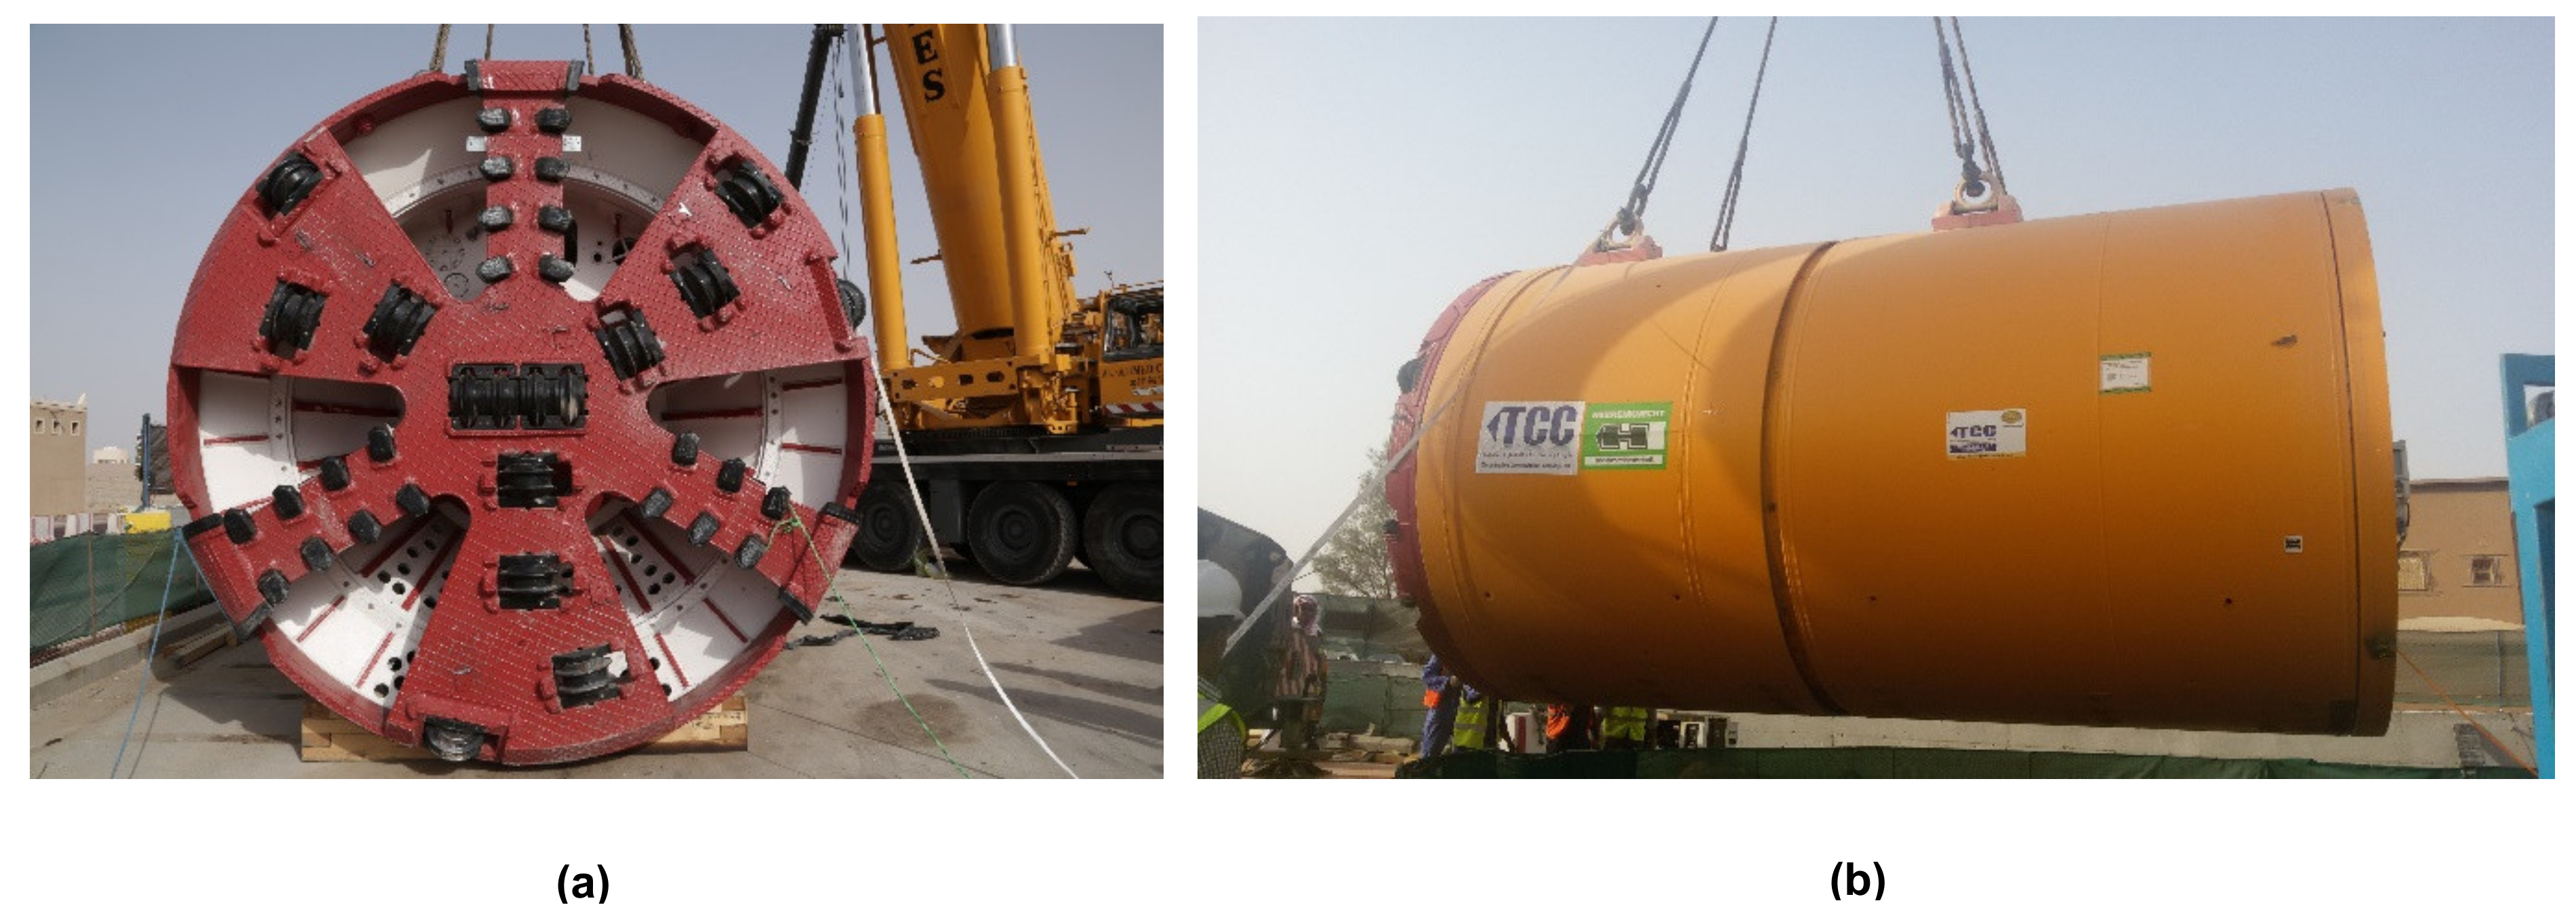
Generally, TT methods are classified into two types. The first type is known as trenchless construction methods, such as utility tunneling, pipe jacking, horizontal auger boring, micro-tunneling, pipe ramming, horizontal directional drilling, and pilot tube micro-tunneling. The second type of TT methods are trenchless renewal methods which include cured-in-place pipe, pipe bursting, close-fit pipe, thermoformed pipe, slip-lining, in-line replacement, localized repair, lateral renewal, coating and linings, and manhole renewal [22]. Figure 5 shows cross-section and side views of the equipment of TT method used for the construction of storm sewer in the study area. In addition to opening all the road lanes for normal traffic operations and commercial activities, the use of trenchless technology reduced the load on the urban roads network in the vicinity of project area. Trenchless technology also improved the road safety by avoiding the possibility of accidents due to increased number of conflicts which could have occurred with open trench construction option. TT also reduced the impacts of air and noise pollution in the study area during the construction phase.
In this study, we developed six scenarios as illustrated in Figure 1. First four scenarios (S1 to S4) appraise various percentages of both sides traffic is detoured to NWZCA in case of the OC construction on left side of the urban highway under study (details given in the following sections). In the fifth scenario (S5), all the left side traffic is detoured to NWZCA while the right side traffic continue its routine operations with all the three lanes functional. Finally, S6 evaluates the trenchless technology with minimal disturbance to both sides traffic.

3.2. Traffic Count Survey

A screen line traffic count survey spanned over one week was conducted at the locations (west bound and east bound) highlighted in Figure 4. Pneumatic road tubes were used to count the number and types of the vehicles passed through the screen line. A burst of air pressure is sent through the sensors along a rubber tube when the tires of a specific vehicle class pass over tube. The pressure pulse produces an electrical signal which is transmitted to the analysis software. These portable pneumatic tubes were fixed on the road surface with the help of a specific gel. These tubes obtain energy from rechargeable batteries. Their main advantages include quick installation and easy maintenance [23]. A photograph of the tubes used at the study area is shown on the right bottom of Figure 4.
Traffic data was collected for the thirteen vehicles classes defined by American Association of State Highway and Transportation Officials (AASHTO) [23]. The results for both the west and east bounds are presented in Table 2.

3.3. Agency and Social Costs Estimation

3.3.1. Work Zone Construction Area

In case of open cut construction, agency costs include the construction cost of pipeline and pavement restoration cost at the WZCA. A tentative cost for large-sized stormwater was obtained from the relevant agency working in the study area while the cost for TT case is given in Table 1. The first social cost at WZCA is travel delay cost (UCttd) which was estimated using Equation (1) for each scenario (see Figure 1). Work zone duration was 720 days (see Table 1). Instead of considering individual vehicle class listed in Table 2, C2 and C3 were classified under light transport vehicle (LTV) class and C4 to C13 under the heavy transport vehicle (HTV) class, i.e., Vj in Equation (1). At west bound, the ADDT for LTV was found to be 11,032 while the estimated HTV was 332. Similarly, the AADT for east bound were estimates as 9,300 for LTV and 423 for HTV. These values are used to estimate social costs at WZCA and NWZCA in the following sub-section. The travel time difference resulting from the speed changes due to the work zone (i.e., TTDj) were estimated for LTV and HTV. The urban highway under study has a design speeds of 80 kph (for LTV) and 50 kph (for HTV) which were reduced to 50 kph and 30 kph during the constriction period. The delay cost rates for LTV and HTV were estimated based on average per hour salary in the country.
The second social cost at WZCA is the vehicle operating costs (UCVOC) which was estimated using Equation 2. Based on reduced speeds at WZCA, the average amount of fuel consumed due to delay (i.e., Fgj) was estimated to be 0.0264 gallon/km for LTV at 50 kph and 0.058284 gallons/km for HTV at 30 kph. The average fuel price ( F p j ) was obtained from market.

3.3.2. Non Work Zone Construction Area

The needed input data for estimating the social cost at NWZCA are presented in Table 3. This data mainly consists of data related to road physical and environment attributes. Road physical attributes include maintenance expenditures and pavement condition while the road environmental attributes composed of traffic loading and climate severity. A deterministic pavement performance model, capable of predicting pavement performance as a function of cumulative traffic loading and freezing index [16], is used to predict pavement condition in terms of IRI (in/mi). Therefore, pavement performance subject to normal operating conditions and high traffic volume can be estimated. Having determined pavement conditions, a cost model (Al-Mansour and Sinha 1994) capable of estimating agency maintenance expenditures as a function of pavement condition is employed. Therefore, maintenance expenditures for pavement under normal operating condition and under high traffic volume can be estimated.
The relation between pavement performance in terms of IRI (in/mi) and VOC (cents per vehicle-mile) developed by Opus [24] is implemented in this study. Thus, VOCs corresponding to pavement under normal operating condition and under high traffic volume can be estimated.
The savings in agency and user cost as a result of applying TT compared to the open cut method scenarios where estimated using Equation (4) and (5) respectively. Figure 6a,b shows the savings in terms of maintenance expenditures and vehicle operating cost, respectively. In order to determine the effect of varying traffic volume on maintenance expenditures and vehicle operating cost values, the above described methodology was tested by increasing the initial traffic volume each time by 1% until it reaches 10%, for different traffic scenarios (S1 to S6) while other factors are kept constant.
With increase in detoured traffic, both the maintenance and vehicle operating costs increase at the NWZA. With respect to VOC the traffic volume has no impact when using TT. The reason is that TT requires no or minimal work zone area and thus no traffic need to detour to adjacent roads. It can be seen that the highest values of maintenance expenditures and vehicle operating cost is when 100% of traffic is detoured and decrease as the percentage of detoured traffic is reduced. It is noteworthy that these values of user costs compared to agency costs are consistent with past studies in the literature [16,19,25].

3.4. Scenario Analysis using Fuzzy QFD

The urban highway is a 3-lane dual carriageway (see photograph in Figure 4). Due to construction of a large size storm sewer (i.e., 3900 mm), the municipality had to close the entire left side of the highway. A hypothetical section of the urban highway showing WZCA area and left (westbound) traffic diverted to half of pavement width occupied from the right side is illustrated in Figure 7a. The photograph shown in the figure was taken for another open cut project in the city to describe the practical constraints of open cut scenarios. Figure 7b shows the total estimated cost including construction cost and social cost at both the WZCA and NWZCA for all the scenarios with different traffic detouring conditions. In first five scenarios of open cut construction, the agency cost includes construction cost of pipeline, pavement restoration cost at WZCA and early pavement maintenance requirements at NWZCA. User cost at WZCA includes the VOC and traffic delay costs (see Section 3.3.2 for details). User cost at NAZCA is primarily the VOC. Total social cost in the Figure 6a is essentially the sum of user costs at both the WZCA and NWZCA.
It can be seen in the scenarios defined in Figure 7b that a certain percentage of the traffic detoured in first five scenarios to NWZCA. There are two possible reasons of such diversion: i) drivers intentionally moved to other possible routes to avoid traffic delays and other possible hazards (e.g., dust and construction noise), and ii) drivers were compelled to use the alternate routes as WZCA had obstructed the direct access to their destinations.
As mentioned earlier, opinion of four decision-makers with indigenous knowhow of the project site was used for scenario analysis. Decision-makers had high educational levels and extensive experience in the fields of environmental management (DM1), asset management (DM2), construction management (DM3), and transportation management (DM4). Firstly, the customer requirements (CR) or the public expectations (PE) and the design requirements (DR) or the agency’s sustainability objectives (SO) are defined (see Step 1 and Step 2 of fuzzy QFD methodology). In Step 3, the public expectations were prioritized by all the decision-makers. Equal importance weights were allocated to all the four decision-makers, i.e., r1 = r2 = r3 = r4 = 0.25, in Step 4 of the methodology. Next, the overall aggregated weights of the PE were estimated using Equation (8) and the results are presented in Table 4, i.e., Step 5.
Next in Step 6, the decision-makers established the relationships between all the PE and SO using the TFNs given in Figure 2. In the following Steps 7 and 8, we used Equation (9) to aggregate the weights (apm) between the PE and SO and Equation (10) to estimate the prioritized technical operators (fm). The complete HoQ is illustrated in Table 5.
Finally, decision makers scored the SO for all the scenarios. The first three agency’s sustainability objectives (low agency cost, low user cost at WZCA, and low user cost at NWZCA) were scored, using TFNs, based on the estimated costs given in Figure 7b. While the last two SO (low environmental impacts and low socio-economic impacts) were subjectively scored based on expert judgment. In the next Steps 9 and 10, Equation (11) was applied to determine the performance ratings of each scenario (SRkm) and Equation (12) estimated the fuzzy index (Flk). The fuzzified performance scores and the Flk are presented in Table 6. Finally, Equation (13) de-fuzzified the aggregated TFNs and all the scenarios were ranked. Final ranking of all the scenarios is presented in Table 7.

3.5. Discussion

It can be seen in Table 4 that almost equal aggregated weights ( ω p ) were assigned to all the five public expectations (or design objectives to meet such expectations). This shows that the decision-making team was well balanced with experts from the essential fields of expertise, i.e., environment, construction, traffic, and asset management, required for such multidisciplinary projects. The relationships between the agency’s SO and PE are given in the complete HoD presented in Table 5. The scores shows that overall environmental and socioeconomic impacts are highly related to the public expectations. For example, ‘minimum travel time’ will not only result in low user cost and time savings, it will lead to low vehicular emissions as well. Likewise, traffic diversions to NWZCA can increase air pollution and noise levels in the clam neighbourhood environment during the construction phase (in case of OC method) and may also lead to other types of nuisances, such as increased risk of accidents and stress levels in the residents.
Actually, development of technical descriptors (component “F” of HoD shown in Figure 2) is the most important outcome of the complete matrix of HoD. These operators combine the information available on the aggregated weight for PE (wp) and the aggregated weights between the SO and PE (apm). It can be seen in Table 5 that the highest numbers were obtained for environmental and socio-economic aspects of sustainability. In economic dimension, user costs at WZCA and NWZCA were found more important, with higher values of technical descriptors, than the agency cost. Subsequently, decision-makers scored all the scenarios against the agency’s sustainability objectives and the ‘Fuzzy Index’ was developed by combining the outcomes of the HoD and the scoring of scenarios. Based on the defuzzified index, final ranks for all the options are given in Table 7.
It can be seen in Table 7 that trenchless technology was found to be the most sustainable option, i.e., top ranked scenario. The primary reasons of such a high rank are low user cost as well as low environmental and socioeconomic impacts at both the WZCA and NWZA. In case of open cut method, the scenario with 50% traffic (i.e., S3) diverted to NWZCA was found to be the most sustainable scenario; however, overall it is ranked at second place in Table 7. In the first two scenarios (S1 and S2), both the user cost and environmental and socioeconomic impacts were found to be very high at WZCA. While in case of S4 and S5, these costs and impacts were supposed to be shifted to the NWZA which essentially is a calm neighbourhood. The reason for S5 being at third place is that at least the right side traffic will perform its routine operations without delays which certainly can only be obtained at the cost of diverting the entire left side traffic to the NWZCA. These findings justify the need of evaluating the sustainability of traffic diversion scenarios for different construction technologies instead of taking decisions merely on economic basis. The results presented in Table 7 also manifest the reliability of proposed fuzzy-QFD based methodology for evaluation of construction technologies for buried infrastructure. The outcomes are also consistent with the past studies that emphasized on the importance of socio-economic aspects for sustainability assessment of construction projects [26].
Municipalities, water directorates, and the Ministry of Water, Agriculture, and Environment are responsible for construction of water supply, sewerage, and stormwater pipelines in the urban areas of Saudi Arabia. Decision-makers in these organizations can implement the proposed framework for sustainability assessment of construction technologies for all types of buried infrastructure. The proposed methodology can also take in additional site specific agency and user requirements. Fuzzy QFD can be integrated with Fuzzy AHP method in case of a large number of customer and technical requirements [27].
The responsible transportation agency can develop effective traffic management plan during the construction period of the pipeline projects in collaboration with other concerned agencies. Traffic counts data (including directional counts) can be used to identify the peak hours and the portion of traffic generated from nearby NWZCA. Then, the traffic from the nearby NWZCA along with some general traffic can be diverted to NWZCA through directional and informative sign (i.e., a legibly printed and very perceptible placard to inform the users that how they can minimize the traffic delays and user costs by using NWZCA). It is expected that the proposed framework will facilitate the decision makers in selection of more sustainable pipeline construction method and traffic management scenarios with minimal user costs and socioeconomic and environmental impacts.

4. Conclusions and Recommendations

Users of urban highways, particularly passing through central business districts, face disruptions during the long construction phases of large-sized buried infrastructure projects. Construction of these projects, using conventional open cut method, results in high social costs at work zone construction areas. In addition, municipalities are supposed to endure additional costs due to early maintenance of alternate routes in non-work zone construction area. Users of both the work zone and non-work zone construction areas also suffer through socioeconomic losses and environmental disturbances due to open cut construction. Overlooking these issues, municipalities still prefer to adopt these methods predominantly because of their low direct agency costs.
Sustainability assessment with the help of a more rational approach that value both the users’ expectations and supposed agency’s sustainability objectives produce more balanced and useful findings. Fuzzy Quality Function Deployment method allows the decision-makers to give appropriate attention to all the three dominations of sustainability instead of relying on pure economic analysis for selecting the construction technology for large-sized pipeline construction projects on urban highways. The method effectively incorporates the likely expectations of the users and residents, of both the WZCA and NWZCA, in the decision-making process.
In open cut construction, a significant portion of the highway (generally one full side in case of a large pipeline) is blocked for traffic movement at the work zone area. There are various possible scenarios of the percentages of total traffic detoured to non-work zone area, e.g., 0%, 25%, 50%, and 75%. Each of these scenarios results in varying degrees of social and environmental impacts on the WZCA and NWZCA. For example, 0% detoured traffic will impact only the work zone area while shifting 75% of the total traffic lead to significant disturbances in the NWZCA.
Scenario analysis using Fuzzy QFD ranked trenchless technology on the top due to its insignificant impacts on vehicle operating and traffic delay costs, and socioeconomic and environmental settings of both the WZCA and NWZCA, i.e., essentially negligible social costs. Among the scenarios of various percentages of detoured traffic to NWZCA due to open cut construction, 50% detoured traffic was found to be the second most sustainable scenario that somehow establishes a balance between socioeconomic and environmental impacts of work zone and non-work zone areas.
Comparison of the proposed method with other decision-making methods in future studies can further enhance the reliability of fuzzy-QFD applications to infrastructure projects. It is expected that the proposed methodology will facilitate the engineers, traffic planners, and construction manager in the municipalities and relevant agencies for more effective decision-making for sustainability assessment (particularly viability of trenchless technologies) of large sized pipeline construction projects in cities of Saudi Arabia, rest of gulf region, and elsewhere.

Author Contributions

M.A. developed the methodology, performed social cost estimation, and was involved in analysis, and prepared the manuscript. H.H. performed detailed cost estimates, developed methodology for multicriteria analysis, and prepared the manuscript. M.A and F.A conducted traffic surveys and performed traffic analysis. S.A reviewed the manuscript and was helped in data collection. All the authors shared their expert opinion and indigenous knowledge for performing scenario analysis.

Funding

The authors gratefully acknowledge Qassim University presented by Deanship of Scientific Research, on the material support for this research under the number (5094-qec-2018-1-14-S) during the academic year 1441 AH/2020 AD.

Acknowledgments

Authors acknowledge the municipalities in Qassim Region of Saudi Arabia for sharing the information of the trenchless pipeline construction project.

Conflicts of Interest

The authors declare no conflict of interest.

References

  1. Too, E.G. A capability model to improve infrastructure asset performance. J. Constr. Eng. Manag. 2012, 138, 885–896. [Google Scholar] [CrossRef] [Green Version]
  2. Jung, Y.J.; Sinha, S.K. Evaluation of trenchless technology methods for municipal infrastructure system. J. Infrastruct. Syst. 2007, 13, 144–156. [Google Scholar] [CrossRef]
  3. Hunt, D.V.L.; Nash, D.; Rogers, C.D.F. Sustainable utility placement via multi-utility tunnels. Tunn. Undergr. Sp. Technol. 2014, 39, 15–26. [Google Scholar] [CrossRef] [Green Version]
  4. Hojjati, A.; Jefferson, I.; Metje, N.; Rogers, C.D. Sustainability assessment for urban underground utility infrastructure projects. In Proceedings of the Institution of Civil Engineers-Engineering Sustainability, March 2017; Thomas Telford Ltd.: London, UK, 2017; Volume 171, pp. 68–80. [Google Scholar]
  5. Matar, M.; Osman, H.; Georgy, M.; Abou-Zeid, A.; El-Said, M. 20 A systems engineering approach for realizing sustainability in infrastructure projects. HBRC J. 2017, 13, 190–201. [Google Scholar] [CrossRef] [Green Version]
  6. Najafi, M.; Kim, K.O. Life-cycle-cost comparison of trenchless and conventional open-cut pipeline construction projects. Pipe Eng. Cons: What’s on the Horizon? 2004, 1–6. [Google Scholar]
  7. Matthews, J.C.; Allouche, E.N. A social cost calculator for utility construction projects. In Proceedings of the North American Society for Trenchless Technology Paper F-4-03, Chicago, IL, USA, 2–7 May 2010. [Google Scholar]
  8. Umer, A.; Hewage, K.; Haider, H.; Sadiq, R. Sustainability assessment of roadway projects under uncertainty using Green Proforma: An index-based approach. Int. J. Sustain. Built Environ. 2016, 5, 604–619. [Google Scholar] [CrossRef] [Green Version]
  9. Shen, L.; Wu, Y.; Zhang, X. Key assessment indicators for the sustainability of infrastructure projects. J. Constr. Eng. Manag. 2011, 137, 441–451. [Google Scholar] [CrossRef] [Green Version]
  10. Yu, W.D.; Cheng, S.T.; Ho, W.C.; Chang, Y.H. Measuring the Sustainability of construction projects throughout their lifecycle: A Taiwan lesson. Sustainability 2018, 10, 1523. [Google Scholar] [CrossRef] [Green Version]
  11. Alnoaimi, A.; Rahman, A. Sustainability Assessment of Sewerage Infrastructure Projects: A Conceptual Framework. Int. J. Environ. Sci. Dev. 2019, 10. [Google Scholar] [CrossRef]
  12. De la Fuente, A.; Pons, O.; Josa, A.; Aguado, A. Multi-Criteria Decision Making in the sustainability assessment of sewerage pipe systems. J. Clean. Prod. 2016, 112, 4762–4770. [Google Scholar] [CrossRef] [Green Version]
  13. Koo, D.H.; Ariaratnam, S.T.; Kavazanjian, E. Development of a sustainability assessment model for underground infrastructure projects. Can. J. Civ. Eng. 2009, 36, 765–776. [Google Scholar] [CrossRef]
  14. AASHTO (American Association of State Highway and Transportation Officials). User Benefit Analysis for Highways; AASHTO: Washington, DC, USA, 2003. [Google Scholar]
  15. Labi, S.; Sinha, K.C. Life-cycle evaluation of flexible pavement preventive maintenance. J. Transp. Eng. 2005, 131, 744–751. [Google Scholar] [CrossRef]
  16. Irfan, M.; Khurshid, M.B.; Labi, S.; Flora, W. Evaluating the cost-effectiveness of flexible rehabilitation treatments using different performance criteria. J. Transp. Eng. 2009, 135, 753–763. [Google Scholar] [CrossRef]
  17. Al-Mansour, A.I.; Sinha, K.C. Economic analysis of effectiveness of pavement preventive maintenance. Transp. Res. Rec. 1994, 1442, 31–37. [Google Scholar]
  18. Sinha, K.C.; Labi, S. Transportation Decision Making Principles of Project Evaluation and Programming; Wiley: New York, NY, USA, 2007. [Google Scholar]
  19. Khurshid, M.B.; Irfan, M.; Labi, S. Optimal performance threshold determination for highway asset interventions: Analytical framework and application. J. Transp. Eng. 2011, 137, 128–139. [Google Scholar] [CrossRef]
  20. Tavakkoli-Moghaddam, R.; Hassanzadeh Amin, S.H.; Zhang, G. A proposed decision support system for location selection using fuzzy quality function deployment. In Decision Support Systems, Advances in; Ger, D., Ed.; INTECH: Rijeka, Croatia, 2010; p. 342. [Google Scholar]
  21. Hauser, J.R.; Clausing, D. The house of quality. Harvard Bus. Rev. 1988, 66, 63–73. [Google Scholar]
  22. Hashemi, S.B. Construction cost of underground infrastructure renewal: A comparison of traditional open-cut and pipe bursting technology. Master Thesis of Science in Civil Engineering, The University of Texas, Arlington, TX, USA, 2008. [Google Scholar]
  23. Federal Highway Administration (FHWA). Vehicle Classification, US Department of Transportation. Available online: https://www.fhwa.dot.gov/policyinformation/tmguide/tmg_2013/vehicle-types.cfm (accessed on 25 February 2020).
  24. Opus Central Laboratories in association with Transport Research Laboratory. Review of VOC-Pavement Roughness Relationships Contained in Transfund’s Project Evaluation Manual; Opus Central Laboratories: Lower Hutt, New Zealand, 1999. [Google Scholar]
  25. Labi, S.; Sinha, K.C. Life-cycle evaluation of flexible pavement preventive maintenance. J. Transp. Eng. 2005, 131, 744–751. [Google Scholar] [CrossRef]
  26. Reizgevičius, M.; Ustinovičius, L.; Cibulskienė, D.; Kutut, V.; Nazarko, L. Promoting sustainability through investment in Building Information Modeling (BIM) technologies: A design company perspective. Sustainability 2018, 10, 600. [Google Scholar] [CrossRef] [Green Version]
  27. Feili, H.; Molaee-Aghaee, E.; Jahed-Khaniki, G.; Rezaie, S.; Kohkheil, M. Applying fuzzy quality function deployment and fuzzy analytical hierarchy process approach in industrial bread production. J. Food Saf. Hyg. 2015, 1, 53–58. [Google Scholar]
Figure 1. Methodology for sustainability evaluation of large-size storm sewer construction projects.
Sustainability 12 02648 g001
Figure 2. House of Quality for Quality Function Deployment Method.
Sustainability 12 02648 g002
Figure 3. Triangular fuzzy numbers used in this study.
Sustainability 12 02648 g003
Figure 4. Study area in Unayzah city (Umar Ibn AlKhattab Road), EL stands for elevation at start and end of storm sewer.
Sustainability 12 02648 g004
Figure 5. Trenchless technology equipment used in construction of storm sewer at the urban highway in study area shown in Figure 4. (a) cross-sectional view, (b) side view.
Sustainability 12 02648 g005
Figure 6. Non-work zone construction area (NWZCA) costs for different scenarios, (a) Maintenance expenditure, (b) Vehicle operating cost.
Sustainability 12 02648 g006
Figure 7. Cost estimates for different scenarios, (a) Plan describing West bound traffic diverted to East bound due to work zone construction area resulted in speed reduction, congestion, and traffic delays (The photograph shown in the figure was taken for another open cut project in the city), (b) Summary of total cost considering both the work zone construction area (WZCA) and non-work zone construction area (NWZCA). The percentage of traffic (e.g., 50%) is a tentative value, actual percentage could vary between say 40–60%.
Sustainability 12 02648 g007
Table 1. Project description in brief.
ItemDescription
ClientMinistry of Environment, Water and Agriculture in Saudi Arabia
Type of ProjectStorm Sewer
Total duration of the projectApproximately 2 years (720 days)
Total cost 77,000,000 SR
Type of constructionTrenchless technology (see Figure 5)
LocationUmar Ibn AlKhattab Road, Unayzah, AlQassim Region
Length of sewer2.4 km
Depth of sewer 9–29 m
Sewer Size (diameter) 3900 mm
Pipe materialReinforced Cement Concrete (RCC)
Weight of the machinery used200 t
Area characteristicsVariation in depths up to 35m—high population density
Area affectedApproximately 5 km2
Table 2. Summary of traffic counts.
Vehicle Class 1Vehicle TypeTraffic Counts at West BoundTraffic Counts at East Bound
C1Motorcycle2834
C2Passenger car10,7498664
C34 tire single unit283624
C4Bus9599
C5Two-axel, six tire, single unit4740
C6Three-axel single unit1525
C7Four or more axel single unit1715
C8Four or less axel single trailer2994
C95-axel tractor semi-trailer122139
C10Six or more axel single trailer58
C11Five or less axel multi-trailer12
C12Six axel multi-trailer11
C13Seven or more axel multi-trailer00
1 Federal Highway Administration [23].
Table 3. Summary of Input Variables.
VariablesDescriptionValues
Pavement current performancePavement current performance is estimated in terms of IRI (in/mi).PIcurrent = 150 (in/mi)
αConstant term of pavement performance model(4.082)
β & γEstimated coefficients of pavement performance model(0.017) & (0.054)
aConstant term of pavement maintenance expenditures model.4.0283
bEstimated coefficient of pavement maintenance expenditures model.-0.462
AADTAverage annual daily traffic volume (thousand)The mean values of AADT = 11.3
ANDXAverage annual freezing index (thousands)The mean values of ANDX = 0.40
Table 4. Aggregated weights of design objectives (DOs).
Public Expectations (PE)DM1DM2DM3DM4 Aggregated   Weights   ( ω p )
Importance Weights (wi)0.250.250.250.25
Minimum travel time579579135710104.56.88.3
Minimum fuel consumption5793570035793.34.87.0
Minimum air and noise pollution710100033575793.85.57.3
Minimum traffic nuisance at NWZ5795791353573.55.57.5
Minimum loss to business 3571355793573.05.07.0
Table 5. Complete House of Quality (HoQ) for sustainability evaluation of pipeline construction scenarios.
Sustainability 12 02648 i001
Low agency costLow user cost at WZCALow user cost at NWZCALow environmental impactsLow socioeconomic impacts
abcabcabcabcabc
Minimum travel time0.51.54.06.59.39.86.08.59.54.56.88.35.58.09.04.56.88.3Aggregated wt. (amp)
Minimum fuel consumption0.51.54.05.57.89.34.56.88.36.59.39.85.57.89.33.34.87.0
Minimum air and noise pollution2.84.36.50.51.54.00.82.34.56.08.59.54.57.08.03.85.57.3
Minimum traffic nuisance at NWZCA3.05.07.04.06.37.83.05.07.05.58.09.04.57.08.03.55.57.5
Minimum loss to business 0.82.34.50.51.54.02.04.06.01.02.04.56.59.39.83.05.07.0
277919265149260611492638619030495214325
Prioritized technical operators (fm)
Table 6. Aggregated fuzzy performance matrix and fuzzy index for all the scenarios for pipeline construction project.
Scenarios 1Sustainability Objectives (SO)Fuzzy Index (FI)
Low Agency CostLow User Cost at WZCALow User Cost at NWZCALow Environmental ImpactsLow Socioeconomic Impacts
abcabcabcabcabcabc
S13.05.07.00.00.03.06.59.39.82.04.06.00.81.84.51445831596
S23.05.07.01.03.05.05.07.09.03.55.57.52.03.56.01887371850
S33.05.07.03.05.07.03.55.57.54.56.58.53.55.07.52418542033
S43.05.07.05.07.09.02.04.06.03.55.57.52.54.06.52137881933
S53.05.07.07.010.010.00.51.54.03.05.07.04.06.07.52408701914
S61.32.85.07.010.010.06.08.59.54.56.58.56.08.09.536111862348
1 Details of scenarios can be seen in Figure 7.
Table 7. Defuzzified Criteria Numbers of Sites and Ranking.
ScenariosDefuzzified Performance ScoreFinal Ranking
S6: Trenchless technology 12701
S3: 50% traffic diverted to alternate route at NWZCA9962
S5: All left side traffic diverted to NWZCA9743
S4: 75% traffic diverted to alternate route NWZCA9314
S2: 25% traffic diverted to alternate route at NWZCA8785
S1: All traffic diverted to right side at WZCA7266