1. Introduction
With the rapid development of civil aviation, flight delays have become an important subject and problem for air transportation systems all over the world. The aviation industry is continuing to suffer from economic losses associated with flight delays all the time. According to data from the Bureau of Transportation Statistics (BTS) of the United States, more than 20% of U.S. flights were delayed in 2018 [
1]. In China, the abnormal flights rate for 2018 was 80.13%, which means more than 850,000 flights were delayed during that year [
2]. These flight delays have a severe economic impact in the U.S. that is equivalent to 40.7 billion dollars per year [
3], while a similar cost is expected for China. Passengers suffer a loss of time, missed business opportunities or leisure activities, and airlines attempting to make up for delays leads to extra fuel consumption and a larger adverse environmental impact. In order to alleviate the negative economic and environmental impacts caused by unexpected flight delays, and balance increasing flight demand with growing flight delays, an accurate prediction of flight delays in airports is needed.
Fundamentally, flight delays occur due to the lack of supply of airspace capacity that meets demand for air travel [
4,
5]. Some researchers have noted that insufficient air traffic control and irregularity of airline operations can also lead to flight delays [
6,
7], while adverse weather could also be a dominant factor that can cause nearly 75% of system delays [
8,
9]. Flight delays can be generated by many different reasons involving multiple different civil aviation agents. Any disruption in the air traffic system caused by these factors can lead to more subsequent delays for flights involving numerous airports and airlines [
10,
11,
12].
Generally, current research methods for delay prediction can be divided into two groups: delay propagation-based methods and data-driven methods. Delay propagation-based methods focus on studying the phenomenon of flight delay propagation in the air transportation network, and attempt to predict flight delay based on the underlying mechanism of that network [
13,
14,
15]. Beatty et al. studied the propagation of delays by examining the initial delay, the frequency of delays and airline schedule connectivity [
16]. Allan et al. studied the principal causes of aviation delays using the Integrated Terminal Weather Forecast System (ITWS) [
10]. Xu et al. proposed using Bayesian networks to model the delay generated and procedures to absorb delays in airports [
17,
18]. Pyrgiotis et al. developed a queuing network model to study the delay propagation [
19]. Some other models used agent-based methods to simulate the potential delay propagation [
20,
21].
Data driven analyses have been very popular methods in recent years, which attempt to predict flight delay directly by using data mining, statistical analysis and/or machine learning techniques, rather than by exploring the delay propagation mechanisms. Many popular data driven methods have been used to predict flight delay, including the random forest algorithm, artificial neural network, logit probability and deep learning. The critical aim of these methods is to extract appropriate influential factors from the real system to build reliable and high-efficient prediction models. Abdel-Aty et al. [
4] used mathematical frequency analysis and statistical analysis techniques to identify the periodic patterns of arrival delay, including multinomial logistic regression and binary logistic regression methods. The time of day, day of the week, season, flight distance, precipitation and scheduled time intervals were considered to be significantly correlated with arrival delays. Rebollo et al. [
3] proposed network-based air traffic delay prediction models, which consider both temporal and spatial delay states as explanatory variables, and used random forest algorithms to predict departure delays. Khanmohammadi et al. [
22] introduced a multi-level input layer artificial neural network (ANN) to predict the delays of incoming flights. The day in a month, day of the week, original airport, scheduled departure time and actual departure time were used as inputs in the model. Lee et al. [
23] used parallel algorithms to predict flight arrival delays along with consideration of both flight information (scheduled departure and arrival times) and weather conditions in departure and arrival airports. Rodriguez et al. [
24] used an asymmetric logit probability model to estimate and predict the daily probabilities of delays in aircraft arrivals. They identified that the origin-departure delay and distance between airports are significant delay factors distinct from the departure delay, the size of airline, the size of airport and the day of the flight. Yu et al. [
25] employed a deep belief network method to mine the inner patterns of flight delays. Some new variables that have been introduced, such as the delay of the previous flight, the air route situation and airport crowdedness are now considered to be important influential factors for flight delay prediction accuracy.
Flight delay prediction has already been investigated by many researchers. However, most of the previous research focuses on the prediction of expected departure delays from an aircraft aspect. Also, the main influence elements considered in these models are the time and weather-related factors, while some aggregate characteristics involving flight plans and airport delays have not yet been studied closely. Due to the excellent self-learning ability of machine learning, which can analyze bigger, more complex data and deliver faster, more accurate results, it is now easier and much quicker to extract new knowledge from the latest available information using machine learning than when using conventional methods, especially when there is complexity and uncertainty in air transportation systems. Thus, the goal of this paper is to propose a methodology that can be used to predict flight departure delays in airports by exploring supervised learning methods considering aggregate flight data and local weather information in airports. Firstly, we collected raw data of realistic operational flights with meteorological information for airports. Then, the expected departure delay time in the airport was set as the prediction target, and the individual flight data and meteorological information were processed to obtain four types of airport-related aggregate characteristics for prediction modeling. Finally, several popular machine learning methods include multiple linear regression, support vector machine, extremely randomized trees and LightGBM were investigated to improve the predictability and accuracy of the proposed model. The methodology was applied to Nanjing Lukou International Airport in China for case study.
The rest of paper is organized as follows:
Section 2 briefly introduces the flight delays definition followed by the research objective.
Section 3 describes the process of data collection and preprocessing, as well as the basic process of prediction methods based on machine learning.
Section 4 discusses the performance of alternative machine learning algorithms according to the prediction results, and analyzes the impacts of different features.
Section 5 summarizes conclusions and indicates next research steps.
2. Problem Statement
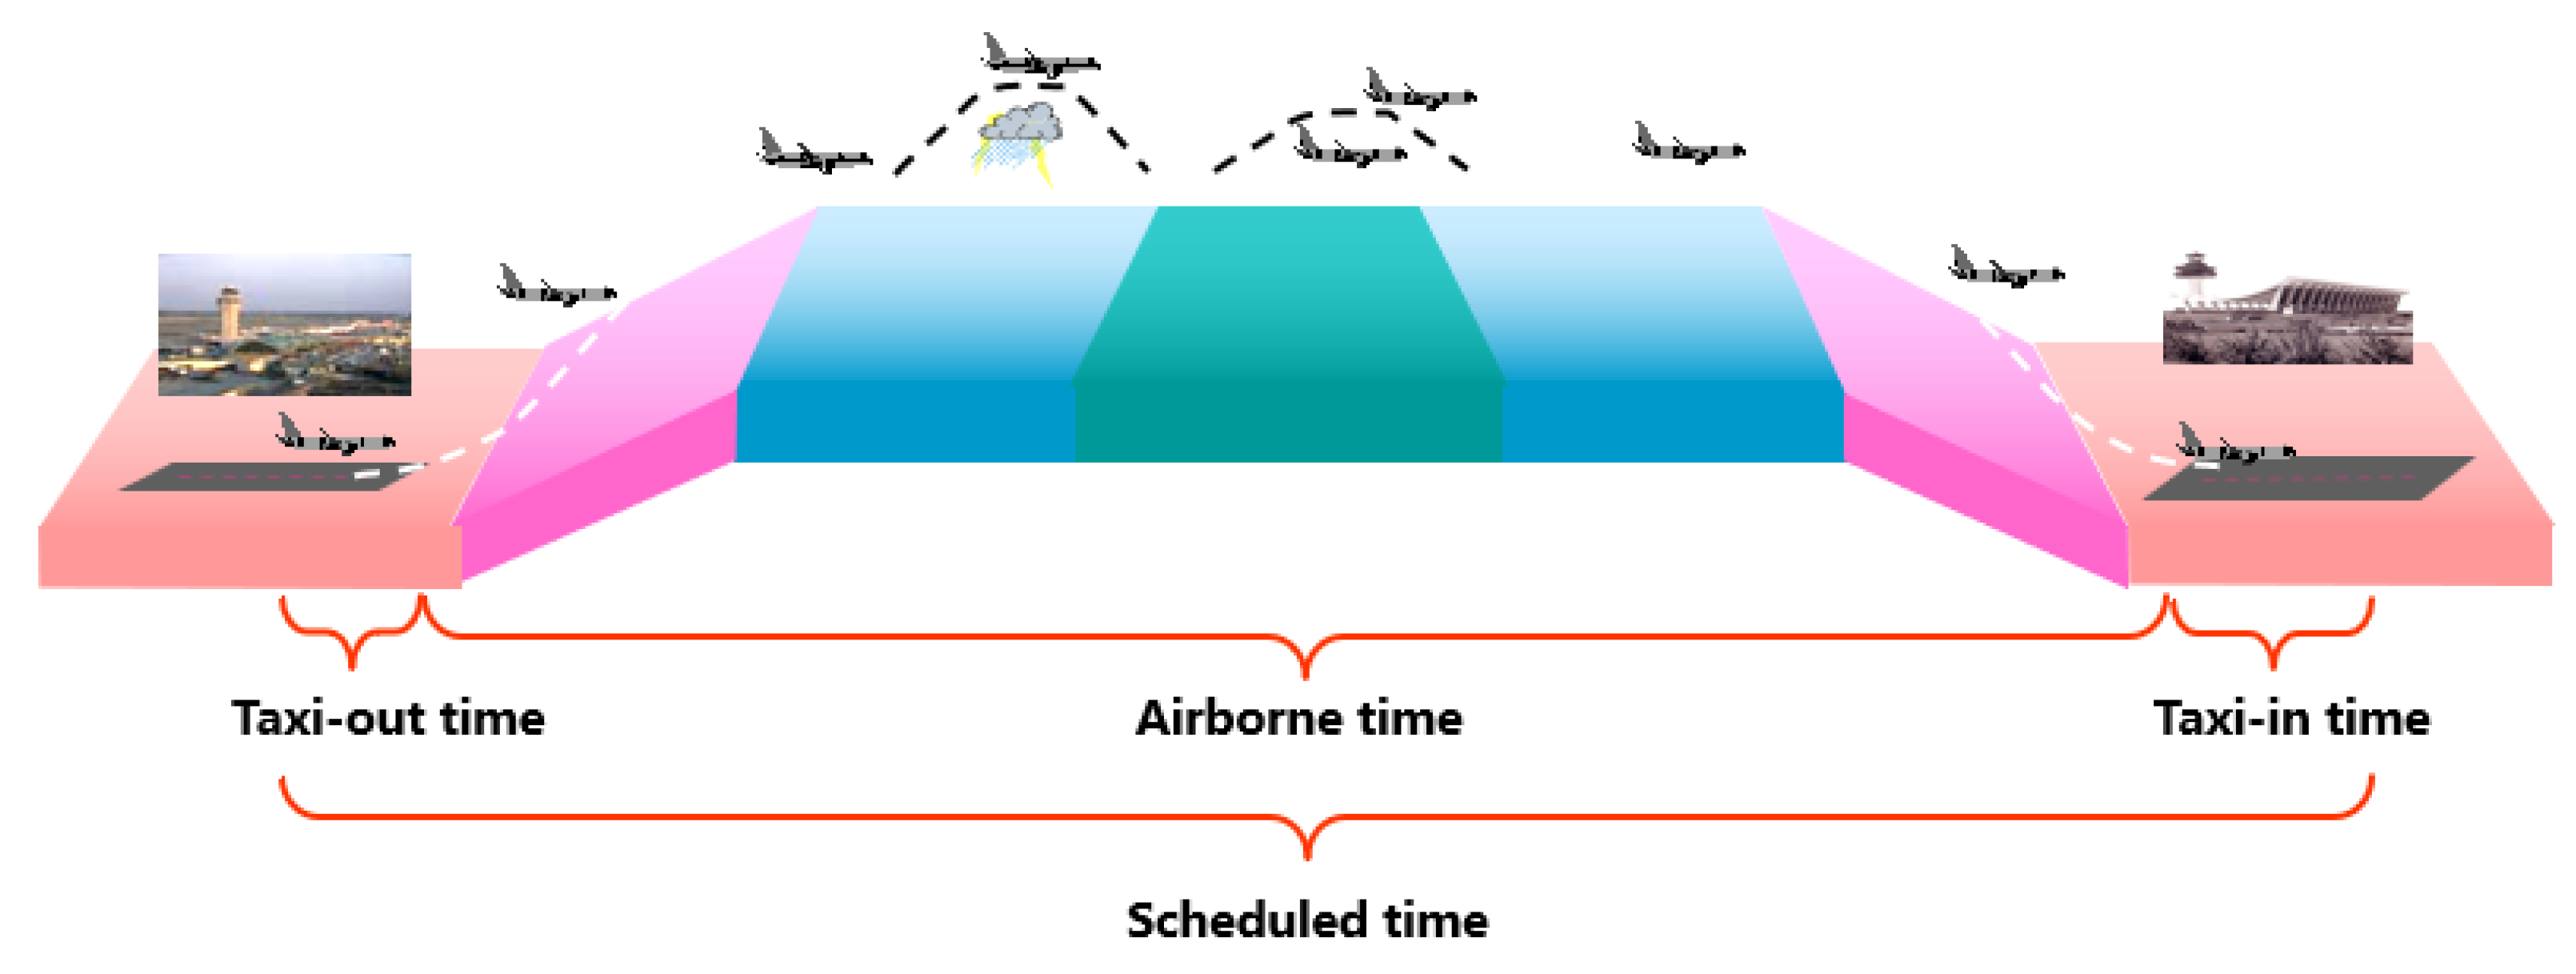
A flight delay is defined as an airline flight taking off and/or landing later than its scheduled time. The scheduled time is comprised of taxi-out time, airborne time and taxi-in time, as shown in
Figure 1. Usually, a flight will be considered as delayed if it is 15 min later than its scheduled time [
26], and currently approximately 95% of the delays occur at the airports.
Airport delays may result from airlines operations, air traffic congestion, weather, air traffic management initiatives, etc. Most of the reasons are stochastic phenomena which are difficult to predict timely and accurately.
Table 1 illustrates the reasons of abnormal flight delays in China in 2018 released by Civil Aviation Administration of China (CAAC), among which weather and airlines are two major reasons that account for 68.6% of the total delays.
In this research, we focus on the prediction of flight departure delays in airports, determining how long the flights may be delayed in airports instead of whether some flights would be delayed. The expected flight departure delayed time per hour in airports was selected as the concerned metric. Noticeable, all flight departure delay time (actual departure time minus planned departure time) was counted in, not just for the delayed flights in actual operations (flights delayed more than 15 min). Also, some new aggregate characteristics for airport states such as flight plan characteristics and delay characteristics are proposed in this research.
3. Methods
This section elaborates the methodology framework, starting with data collection (
Section 3.1), followed by characterization of airport states (
Section 3.2) and prediction modeling (
Section 3.3).
3.1. Data Collection
Nanjing Lukou International airport (ZSNJ) was selected as the study case in this research. As the main airport serving Nanjing in China, it handled approximated 25.8 million passengers and 374.2 million tons of freight with more than 270 routes in 2017, as shown in
Figure 2. An archive of detailed data for individual flights and the local weather of ZSNJ airport were collected for a one-year period from March 2017 to February 2018.
The individual flights data were obtained from the Civil Aviation Administration of China (CAAC), and the critical data fields include the operational date, flight number, aircraft type, planned/real departure airports, planned/real arrival airports, planned/real departure time and planned/real arrival time, etc., as shown in
Table 2. The difference between real departure time and planned departure time is calculated as the departure delays for each flight.
Figure 3 shows that there were 105,993 flights departing from ZSNJ between 1 March 2017 and 28 February 2018, including 68,165 (64.3%) flights delayed for more than 15 min, 41,693 (39.3%) flights delayed for more than 30 min, 28,183 (26.6%) flights delayed for more than one hour, and 8697 (8.2%) flights delayed for more than 2 h. The most severe delay for a flight lasted for 957 min.
The meteorological data were collected in a historical archive that is publicly accessible from the website of WEATHER UNDERGROUND:
https://www.wunderground.com/. The data set includes 8860 pieces of meteorological data of each hour of the airport ZSNJ every day. The data fields used include observation time, air temperatures, dew point temperatures, humidity, wind directions, wind speeds, gust rates, pressures and weather conditions. Some formats of the raw weather data are shown in
Table 3.
Initial data cleaning was also conducted to remove some irrelevant characteristics and to delete some exception data. For example, the cancelled and returned flight records were also removed from the raw data because the flight delays cannot be computed properly. In total there were 388 departure flights cancelled and 32 flights returned due to the thunderstorms, heavy snow and other severe weather in the raw data.
3.2. Characterization of Airport States
The aggregate of flight states in airports with weather information may reflect not only the current delay situation at the airport, but also changing trends and repetitive traffic patterns. Accordingly, some aggregate characteristics for airport states were extracted from the raw data for prediction modeling after investigating experts and air traffic controllers working in airports.
Based on the obtained raw data, four types of aggregate characteristics were considered in this research, including the time characteristics, flight plan characteristics, delay characteristics and local weather characteristics as shown in
Table 4. The flight plan characteristics and delay characteristics for airports are two new types of features proposed in this paper and not well studied in previous research.
The time characteristics are the month, day of the week and hour of the day, for the purpose of embracing multiple time granularities.
Flight plan characteristics include eight sub-characteristics for the purpose of embracing flight plan execution information. Notice that the number of planned arrivals/departures before the prediction period represent the two aggregate flight states (arrivals and departures) just one time period before the prediction one. These two characteristics are extracted from the scheduled flight plan determined by civil aviation administration and airlines at least one day before execution, reflecting the number of flights supposed to arrive in and depart from the target airport in one time period (e.g., 1 h). These characteristics may also reflect some demand and capacity information for the airport. The number of planned arrivals/departures in the prediction period is similar to the metric one time period before the prediction one, but using the data for the predicted time period instead of the prior time period. The accumulated number of arrival/departure demand in the prediction period represents the sum of the delayed flights and original planned flight in the prediction period. Different from the number of planned arrivals/departures proposed above, these characteristics are usually larger than the planned values, due to some previous planned flights encountering unexpected delays and having to postpone the departure or arrival time. The number of affected flights can be obtained in advance and could be very useful information.
The delay characteristics include four sub-characteristics in order to include more detailed flight delays information for the airport. The number of delayed arrival and departure flights before the prediction period contain the delay situation of the delayed flights (delayed more than 15 min) for the airport in the prior time period. The expect delay time of arrival/departure flights before the prediction period could capture more detailed delay time information for the airport.
The local weather characteristics include all seven sub-characteristics, and the weather conditions include fair, cloudy, mostly cloudy, fog, haze, rain, heavy rain, snow, heavy snow and thunderstorm. Note that two weather characteristics, the wind direction and weather condition, are categorical attributes which cannot be computed directly. Thus, these two types of text labels were converted into numbers for model building. Also, since different characteristics have very different scales, features scaling was applied to transform these characteristics to new ones with the same scale. The standardization method was selected for data transformation according to the formula (1).
where
represents the original value of a characteristic sample,
represents the expected value,
represents the variance, and
represents the standardized characteristic value. The standardization method does not bound values to a specific range but is much less affected by outliers.
3.3. Prediction Modeling
The research purpose of this paper is to make a prediction of the flight departure delays in airports based on the proposed multiple aggregate characteristics.
According to the characterization of airport states proposed above, four types of aggregate characteristics including 22 features in total were considered as inputs for the prediction modeling. The expected delay time for departing aircraft per hour in airports was considered as the label and prediction target which were calculated based on the raw data. Thus, the problem proposed in this research can be treated as a typical supervised learning task.
In order to provide an unbiased evaluation of the proposed model, the data used for modeling were split into three datasets which are the training dataset, validation dataset and test dataset. The training dataset is a set of examples used to fit the parameter of the model, the validation dataset is used for an unbiased evaluating of the model and the tuning of the hyperparameters, and the test dataset is used for providing an unbiased evaluation of the final model. The dataset division method of this study is illustrated in
Figure 4. Approximately 20% of the original data were split as the test datasets, while the remains were divided into the training and validation dataset by a 5-fold cross validation method. The green parts in the figure represent training datasets, while the yellow ones are the validation datasets.
The aggregate characteristics proposed in the
Section 3.2 were set as explanatory variables, the expected delay time for departing aircraft per hour in airports were set as labels. Several supervised learning methods including the multiple linear regression (LinearR), support vector machine (SVM), extremely randomized trees (ExtraRT) and LightGBM were tested for prediction modeling. ExtraRT and LightGBM are two popular machine learning models developed in recent years.
The ExtraRT is similar to random forest model. However, in the extreme case, it builds total randomized trees whose structures are independent of the output values of the learning sample. While similar to ordinary random forests in that they are an ensemble of individual trees, there are two main differences: First, each tree is trained using the whole learning sample (rather than a bootstrap sample), and second, the top-down splitting in the tree learner is randomized. Instead of computing the locally optimal cut-point for each feature under consideration (based on, e.g., information gain or the Gini impurity), a random cut-point is selected. This value is selected from a uniform distribution within the feature’s empirical range (in the tree’s training set). Then, of all the randomly generated splits, the split that yields the highest score is chosen to split the node. The strength of the randomization can be tuned to problem specifics by the appropriate choice of a parameter [
27,
28].
LightGBM is a gradient boosting framework that uses tree based learning algorithms. It contains two novel techniques: Gradient-based One-Side Sampling and Exclusive Feature Bundling to deal with large number of data instances and large number of features respectively. It is designed to be distributed and efficient with the parallel training. The main advantages include the support of parallel and graphics processing unit (GPU) learning, faster computing speed, higher prediction accuracy and capability of handling large-scale data [
29].
4. Analysis of Experimental Results
The performance of the supervised learning-based prediction models was evaluated for the ZSNJ airport with the expected departure delay time within a 1-h prediction window.
4.1. Performance Measures
The mean square error (MSE) and mean absolute error (MAE) were selected as performance measures for comparing the prediction results of different models. MSE is the ratio of the square sum of the deviation between the estimated value and the actual value. It can measure the average of the squares of the error. The smaller the MSE value indicates the higher the prediction accuracy. MAE is the mean of the absolute error, which may better reflect the actual situation of predicted value error. The calculation formulas of MSE and MAE are as Equations (2) and (3).
where
represents the original data,
represents the forecast data and m is the number of prediction samples.
Table 5 shows the performance results in terms of prediction accuracy on the validation set and test set, separately. Generally, the performance of models on the validation set was slightly worse than that on the test data. The LightGBM model provided the best accuracy result, giving 0.8655 R-score on the test data while the SVR model provided the worst result with only 0.8603 R-score.
Table 6 shows the performance measures for different supervised learning models. The MAEs range from 6.64 min to 6.82 min, implying the LightGBM model provided the best performance while the extremely randomized trees model showed the worst result.
Figure 5 shows the distribution of error values for the proposed four models on the test set.
Figure 5a shows the distribution of the prediction error values of the proposed four methods with the actual delay values. It can be seen that the prediction errors increased with the growth of actual delay values. Additionally, most of the prediction errors were less than 15 min when the actual delays were less than 60 min. However, if the actual delays were larger than 60 min, the prediction errors show obvious divergences, implying the increase of errors.
Figure 5b shows the cumulative distribution of error values on the test set; it can be seen that all models show similar trends, but the ExtraRT model reached its maximum error first while the LightGBM reached its maximum last.
4.2. Characteristic Analysis
The analysis of feature importance enables us to discriminate and study the most impactful features on the proposed methods. Since the LightGBM model obtained the best performance in this study, it was used to extract the features for further analysis. Feature importance provides a score that indicates how valuable each feature was in the construction of the LightGBM within the model, and the higher score implicates the more important the feature in modeling.
Figure 6 shows the importance for all 22 characteristics used in the prediction model. The description of characteristics can be found in
Section 3.2. It can be seen that accumulated number of departure demand in the prediction period was the dominating factor in the LightGBM model, implicating the delayed flights in previous time period have significant influence on the final results. The more flights delayed from previous time, the more delays may happen in the following period.
The number of planned departures in the prediction period and the expected delay time of departures before the prediction period are two others obvious factors in the model. This implies that once some delay happened in airports, the delays can hardly be released in short term; delays in airports have some time correlation.
The expected delay time of arrivals before the prediction period, hour of the day, and the number of planned departures before the prediction period are three following characteristics in the model. The results indicate that although the concerned metric is the departure delays, the arrivals information could also bring some important information for the final results. The hour of the day reveals that some “busy hours” may be more likely to generate delays than others, while the planned departures before the prediction period sometimes affect the delay generation and release in the following time period. The balance between capacity and demand could be a reasonable explanation.
Of special note is that most local weather characteristics in airports show no obvious effect on the final results, which seems inconsistent with the reality in airports. One major reason is that all cancelled and returned flight records were removed from the training data due to calculating inability as delays, but these flights are usually affected by the severely local weather conditions. Another reason could be that most of flight departure delays in airports may be affected by the severe weather en-route and/or in other related airports. Thus, the weather characteristics in local airports have limited effects on the final prediction results.
Table 7 shows the test error with and without local meteorological data for prediction modeling. The table shows that the model performances with local weather characteristics were not as good as those without meteorological data. Two potential reasons are that the cancelled and returned flight records caused by local weather characteristics can hardly be translated into specific delay time in departing airports, and the local flight delays are often caused by weather condition en-route or in the airports of the previous flights, not just in local airports.
Furthermore, we compared the results with previous research in 2019 [
25], which used a deep belief network method to mine the inner patterns of flight delays with different characteristics including air route situation, delay of previous flight, airline properties, number of passengers for a flight, aircraft capacity, boarding option, air traffic control, crowdedness degree of airport and other factors. The MAE obtained by the LightGBM model in this study was 6.58 while the result was 8.41 with the DBN-SVR method for delay prediction of departure flights from PEK to HGH.
4.3. Example Validation
Using the LightGBM prediction model trained above, the real flight departure delays in ZSNJ in March 2018 were also tested for example validation.
Figure 7 shows the prediction samples with the with the actual data within a 1-h prediction window on 1 March 2018. The time of the day ranges from 6:00 to 24:00, and the predicted expected departure delay time is plotted with the blue dotted line while the actual data is plotted with the red one. It can be seen that the predicted values fluctuated with the actual data, and most of the prediction errors were within 8 min.
All test results for the whole month of March 2018 in ZSNJ are displayed in
Figure 8 by heat maps, which are graphical representation of data where the individual values contained in matrix are represented as colors. The horizontal axis of each chart represents the date and the vertical axis represents the hour of the day, the unit of the right axis is minute.
Figure 8a shows the actual expected departure delay time while
Figure 8b shows the predicted values. In general, the two heatmaps are similar especially in severely delayed time blocks, which implies the feasibility and reliability of the proposed model.
5. Conclusions
This paper presented a methodology for predicting aggregate flight departure delays in airports by exploring supervised learning methods. The proposed new model was enabled by four types of airport-related aggregate characteristics, including time characteristics, flight plan characteristics, delay characteristics and local weather characteristics. The results obtained show that for a 1-h forecast horizon, LightGBM model provides the best result, giving 0.8653 accuracy with 6.58 min mean absolute error, which is 1.83 min less than previous research.
Analysis also found that accumulated number of departure demand in the prediction period is the dominating factor in the LightGBM model. The number of planned departures in the prediction period and the expected delay time of departures before the prediction period are two other obvious factors, while the expected delay time of arrivals before the prediction period, hour of the day, and the number of planned departures before the prediction period are three following characteristics. Of special note is that the model performances with local weather characteristics are not as good as those without meteorological data. Two potential reason are that the cancelled and returned flight records caused by local weather characteristics can hardly be translated into specific delay time in departing airports, and the local flight delays are often caused by weather conditions en-route or in the airports of the previous flights, not just in local airports.
The prediction model presented in this paper yields a better understanding of delays interactions between time, flight plan and previous delay. Since we predict the flight departure delays from the airport aspect, the model could be used for reminding airport managers, air traffic controllers and passengers to deal with the impending congestion in airports. Future works include exploring some other explanatory characteristics such as national weather, city-pair, and network states, etc., and extending forecast horizon with more accuracy results.


