Abstract
The current paper aims to explore consumers’ preferences for wine attributes related to tradition, sustainability, and innovation. A total of 419 regular wine consumers participated in an online survey that took place in Italy. Consumers’ preferences were assessed through a Best-Worst experiment with 11 wine attributes drawn from the literature. The result shows that the wine attributes, more important for consumers, are mainly related to tradition and sustainability. More specifically, the most important attributes for consumers when purchasing wine are “geographical indications”, “grape variety”, “sustainable certification”, “vintage”, and “price”. By contrast, the innovative wine attributes investigated were ranked among the least important ones, namely “canned wine”, “alcohol-free wine”, and “vegan wine”. The study findings offer several implications for wineries and marketers involved in the wine sector. They specifically provide suggestions on the wine attribute wineries should focus on to meet the current consumers’ preferences.
1. Introduction
Over the last decade, the wine industry became a highly competitive sector due to the coming of the new world wine countries (e.g., Chile, New Zealand, Argentina) on the market and the changes in consumers’ consumption habits towards different alcoholic beverages [1,2]. To address this competitive environment, wineries have to rethink their offer, adapting their business strategies and production processes. More specifically, they have to focus on consumers and their preferences to implement effective differentiation strategies. Acknowledging the role of consumers enables to embed their favourite characteristics in the product to convey a widely accepted wine on the market.
The current study goes in this direction by investigating consumers’ preferences towards several wine attributes.
Literature on consumers has widely explored their preferences towards different food products [3,4,5,6]. When it comes to wine, scholars examined consumer preferences for specific wine attributes [7]. These studies differ mainly for the types of wines considered [8,9,10,11], the countries investigated [7,12,13,14], and the wine attributes assessed [15]. As for the latter, those mainly analysed in previous studies refer mostly to traditional wine attributes (e.g., price, grape variety, vintage). To this extent, the wine attributes “previous experience”, “someone recommended it”, “the origin of the wine”, and “grape variety” arose as crucial in driving consumers’ purchasing decisions [12,16,17,18,19,20,21].
Recently, the focus is moving to the sustainability issues related to wine production [10,22,23,24]. Prior studies detected consumers’ preferences and willingness to pay for different sustainable wine attributes [1,25,26]. However, despite the growing consumer’s interest for certified sustainable wines, the lack of consumers’ awareness towards sustainability in the wine sector is noteworthy [27].
While literature largely analysed consumers’ preferences towards traditional and sustainable wine attributes, innovation in the sector was only marginally addressed. For instance, few studies uncovered consumers’ preferences for alcohol-free or low-alcohol wines [9,11,14,28], revealing a negative association in the consumer’s mind between alcohol content and product quality [11].
This study aims to fill this gap by exploring consumers’ preferences for wine attributes related to tradition, sustainability, and innovation. Further, to the best of our knowledge, it is the first study addressing-jointly-traditional, sustainable, and innovative attributes of wine.
The remainder of the paper is structured as follows: the next session outlines the questionnaire administered, the wine attributes assessed, as well as the methodology adopted in the study. Then, the outcomes are presented in the Results section. Lastly, the Discussion and Conclusion section fully discuss the study findings and draw the conclusions, while the study limitations and the need for future research are summarized in the end section of the paper.
2. Materials and Methods
2.1. Data Collection and Questionnaire
The study was carried out by interviewing a convenient sample of regular wine consumers (i.e., consumers who drink wine at least once a month) older than 18 years (the minimum legal age for drinking alcoholic beverages in Italy). Data gathering took approximately five months (from August 2019 to December 2019). Participants were invited to take part at the study through different messaging and social media platforms (e.g., email, WhatsApp, Facebook, Twitter). Specifically, a link redirecting to the online questionnaire was attached to a message introducing the aim of the study. The initial message also explicated that the questionnaire was anonymous and that all the information collected were used exclusively for the purpose of the study and in an aggregated way. Questionnaire completion lasts 15 minutes on average and no monetary incentives were provided to participants to encourage participation. Overall, 452 Italian wine consumers participated at the study, while 419 questionnaires were deemed full and used for the statistical and descriptive analysis.
The administered questionnaire consists of three sections detecting consumers’ consumption habits and preferences towards several wine attributes. In the first section, a set of seven questions were posed to detect wine habits of Italian consumers: frequency of consumption (six-points semantic scale for frequency ranging from 1 = every day to 6 = once per month), place of purchase (i.e., supermarket/hypermarket/discount, directly at the producer, wine bar, and online), and consumption (i.e., at home, at friends’ homes, restaurant, lounge bar/wine bar), consumption occasions (i.e., lunch, aperitif, dinner, after dinner, and party), expenditure on alcoholic beverages and wine in the last month (six price levels starting from below €10.00 and ending with above €50.00, with an interval of €10.00 between each level), wine purchase by price point (six price levels starting from below €5.00 and ending with above €25.00, with an interval of €5.00 between each level). The second section of the questionnaire explored consumers’ preferences for wine attributes related to tradition, sustainability, and innovation. Consumers’ preferences were assessed through a Best-Worst (B-W) experiment with 11 wine attributes drawn from the literature [10,11,12,15,17,19,21,29]. Lastly, in the end section of the questionnaire, respondents’ socio-demographics characteristics were collected (i.e., gender, age, household size, education level, occupation, and family monthly income).
2.2. Wine Attributes Investigated
The 11 wine attributes assessed in the study refer mainly to the traditional, sustainability, and innovative characteristics of wine (Table 1). Specifically, “price”, “grape variety”, “vintage”, and “geographical indications (i.e., PDO, PGI)” are among the traditional attributes considered by consumers when purchasing a bottle of wine [15]. Since an emerging body of literature uncovered the effect of sustainability on consumers’ wine preferences, four sustainable wine attributes were addressed, namely “sustainable certification (i.e., organic, VIVA sustainable wine)” [30], “lightweight glass bottle (environmentally friendly packaging)”, “bottle in 100% recycled PET”, and “environmental-friendly caps (i.e., glass, sugarcane)”. Lastly, the study uncovered the preferences of regular wine consumers towards three innovative attributes: “canned wine”, “vegan wine”, and “alcohol-free wine”.

Table 1.
The wine attributes assessed in the study.
2.3. Best-Worst Method
Consumers’ preferences for the 11 wine attributes were detected applying the Best-Worst Scaling (BWS) method. The BWS—also known as maximum difference scaling—was applied for the first time by Finn and Louviere [31] in a study on food safety. Recently, due to its advantage (i.e., it is free of bias), it was implemented in several studies on consumers’ behavior [32,33], food preferences [34], and wine marketing [12,15,17]. Indeed, compared to other rating scales, BWS does not undergo cultural bias due to respondent background [17]. Accordingly, it results in a valid and precise method for drawing up a ranking of consumers’ preferences.
In the Best-Worst Scaling method, respondents were asked to choose the most and the least important attributes, comparing a finite and different set of alternatives (choice sets). In the current study, the experimental design is based on a balanced incomplete block design (11,5,5,1) in which 11 wine attributes are assessed in 11 choice sets, with five attributes each, and with every attribute repeated five times. According to the B-W experimental design of the study, each participant expressed 11 best and 11 worst as the B-W choice sets outlined. Table 2 presents an example of the choice sets showed to participants.
Table 2.
Example of a B-W choice set presented to respondents.
3. Results
3.1. Sample Description
Table 3 illustrates the descriptive statistics of participants. Interviewees result equally distributed among gender (50% of the sample is female), and within an age range of 19 and 80 years (mean age: 38.9; ± 12.1). On average, respondents live in families consisting of three members (± 1.1) and are highly educated. As for the latter, more than a third of the sample (39.9%) hold a high school degree, while the 37.9% hold a university degree. The majority of respondents are employed (50.1% of the sample) and has a family monthly income falling into two main groups: below than €2000 (36%) and between €2001 and 4000 (31.3%).
Table 3.
Sample descriptive statistics (N = 419).
3.2. Wine Consumption Habits
The study findings show that respondents drink wine regularly (Table 4). More than 70% of participants stated that they drink wine on regular basis during the week (13.8% every day, 9.8% 4–5 times per week, 23.4% 2–3 times per week, and 25.8% once a week). The analysis revealed that the preferred place for wine purchasing is directly at the producer (35.6% of the sample). In addition, a large part of respondents purchase wine in large retail stores (30.5%) or in wine bar (25.3%). As for the place of consumption, the majority of respondents favor to consume wine at home (51.1%), particularly at dinner time (47.7%). The last month expenditure on alcoholic beverages is about €30.00 (21.2% < €10.00, 24.1% between €10.01–20.00 and 17.7% between €20.01–30.00), with wine as the main expense. Lastly, consumers spend, between 5 and 10 euro (38.4%) on average for a 750ml bottle of wine.
Table 4.
Respondents’ wine consumption habits.
3.3. Best-Worst Scaling Analysis
Consumers’ preferences for traditional, sustainable, and innovative wine attributes are obtained calculating the individual Best-Worst (B-W) score. The latter is computed by subtracting the number of times an attribute is chosen as the least important from the number of times it is chosen as the most important (Table 5). Indeed, since the study applied a balanced experimental design, the results obtained through the difference of the frequencies do not differ from those provided by running a multinomial logit model [17]. Since each attribute appeared overall five times in the 11 choice sets, the individual B-W score for the attribute is comprised in a range from +5 to −5. The total B-W score for each attribute is calculated by adding up the individual score assigned to the attribute assessed. A positive B-W score implies that the times an attribute is chosen as the most important are more than those it is selected as the least important one. The latter implies a great interest of consumers toward the attribute. By contrast, a negative score suggests that consumers’ preferences are not affected by it. In this case, the number of times an attribute is chosen as the least important exceed the times it is chosen as the most important. Table 5 presents the B-W scores of the wine attributes investigated.
Table 5.
Respondents’ preferences for the eleven wine attributes (ranked by B-W score).
The results show that five out of 11 wine attributes were valued more positively than negatively by respondents (Figure 1). The wine attributes more important for consumers are the traditional and sustainable ones as suggested by the positive B-W scores. As for the former (traditional), the attributes with a higher score are “geographical indications” (0.523), “grape variety” (0.385), “vintage” (0.100), and “price” (0.057), while the sustainable attribute is “sustainable certification” (0.211). Rather, the wine attributes related to innovation such as “vegan wine” (−0.212), “alcohol-free wine” (−0.372), and “canned wine” (−0.431) were ranked as less important by consumers when purchasing a bottle of wine.
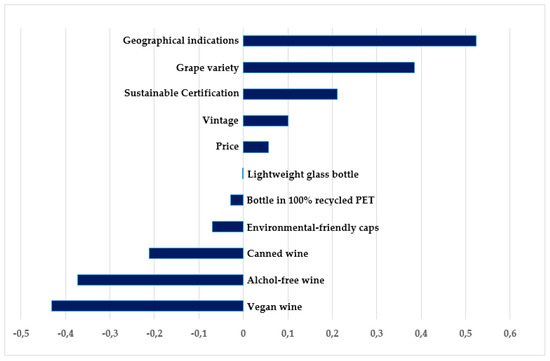
Figure 1.
B-W average scores of wine attributes affecting consumers’ preferences.
Lastly, a paired-samples t-test was performed across all pairs of wine attributes to evaluate if the means of the ranked attributes were statistically significant different (Table 6). Few pairs of attributes are significantly different as shown by a p-value higher than 0.05. The difference in the attributes is not equal to zero between “price”, “lightweight glass bottle (environmentally friendly packaging)”, and “bottle in 100% recycled PET” as well as between “vintage” and “price”.
Table 6.
Mean comparison of the wine attributes for respondents.
4. Discussion and Conclusion
For the first time, the current study investigates consumers’ preferences for 11 wine attributes related to tradition, sustainability, and innovation. The main aim of the study is to go beyond the limitation occurring in previous studies which focus mostly on traditional or sustainable characteristics of wine. By detecting consumers’ preferences, wineries may rethink their strategies and product offer relying on the wine attributes most appealing to consumers.
To address the study aim, a web-based structured questionnaire was administered to regular Italian wine consumers.
The study findings show that the regular wine consumer in Italy is, on average, 39-years old, well-educated and employed, and lives in a family with a monthly income of up to €4000. As for the purchasing habits, respondents stated to purchase wine directly at the producer. This behaviour suggests that on one hand, the preference of consumers towards local food product characterized by high social benefits [35,36,37,38], whilst on the other hand, their willingness to support the economic growth of local community [39,40]. Further, the study uncovered that consumers spend roughly €10.00 per a bottle of wine and up to €20.00 in wine monthly. These results are in accordance with those observed by Lerro et al. [8] investigating consumers’ expenditure on sparkling wines and revealing a spending up to €20.00 for a bottle of wine. The current study also unveiled that participants mainly consume wine weekly, at home and at dinner time. These consumption habits are in line with previous studies carried out in different countries [7,15].
As shown by the Best-Worst experiment, Italian consumers assign a positive evaluation to traditional wine attributes, ranking “geographical indications (i.e., PDO, PGI)”, “grape variety”, “vintage”, and “price” as the most important ones. As for the former (geographical indications), the importance attached to this attribute differs between countries. For instance, Italian consumers pay great attention to wine geographical indications. Indeed, the strict agricultural and oenological practices considered in the PDO and PGI regulations can affect consumer quality perception of wine [41]. Geographical indications are crucial for Portuguese consumers as well [7], while in the US, they seem to be unimportant in driving consumers’ purchasing decisions [15]. Grape variety also appears important to consumers. It is in accordance with previous results [7,12,15,17] and may be affected by past experience with the product or by a specific preference towards the vine [21]. Likewise, the attribute “vintage” that Schäufele and Hamm [27] identified as a sign of wine quality considered by consumers along with “region of origin” and “wine producers”. Price was also positively assessed by consumers, however its effect seems limited compared to the other. Prior research is consistent with this finding, arguing that “price” may result less important for consumers when it is assessed together with other product characteristics [7,42,43].
Regarding the sustainable and innovative wine attributes, the study uncovered the effects only of the “sustainable certification (i.e., organic, VIVA sustainable wine)”. Schmit et al. [44] pointed out that eco-labelled wines are more preferred by consumers who are also willing to pay more for these wines. However, in a recent study, Sogari et al. [1] revealed that if, on one hand, the eco-label may drive consumers’ decisions, on the other hand, consumers are unwilling to trade it for the product quality and price. Lastly, the innovative wine attributes investigated in the study obtained negative evaluations by consumers who place them among the last positions in terms of preferences. The latter may likely be due to the unwillingness of Italian consumers towards innovation in a traditional product. Indeed, traditional attribute may be perceived by consumers as a sign of quality strongly tied with the typicality of the product. Accordingly, either product or process innovations might negatively affect consumers’ evaluation and purchasing decisions.
The study findings offer several implications for wineries and marketers involved in the wine sector. Considering the place of purchase preferred by consumers (i.e., directly at the producer), wineries should strengthen this sale channel. The latter may turn into an opportunity for wineries to promote not only their product offer but also the territory and the local tradition. Taking into account consumers’ consumption habits, such as at home and at dinner time, marketers may advertise the product displaying people in an informal and relaxing environment. Further, since the wine is consumed mainly at dinner time, wineries may offer suggestions to pair wine and food to facilitate consumer in their choices. Based on the wine attributes most preferred by consumers when purchasing wine, producers should focus undoubtedly on quality productions. Geographical indications, in fact, are perceived as synonymous of product quality that improve when the regulation underlying the certification become stricter [41]. Since geographical indication regulations link the wine to a territory, they ensure about the traceability of grapes and the uniqueness of the product. The latter are mainly due to the strict agricultural and oenological practices considered in the PDO and PGI regulations. In addition, given the interest shown by consumers towards the sustainable certifications, wineries should make an effort to decrease their impact in the production process as well as certify their production. Lastly, the ineffectiveness of the innovative attributes in driving consumers’ preferences suggests that wineries should rely mainly on typicality and quality production to differentiate their product offer.
5. Limitations and Further Research
Few limitations occurring in the study limit the generalization of these findings. Indeed, the results observed are not representative of the preferences of Italian wine consumers due to the sampling method adopted and the limited number of participants. Accordingly, future studies may, on one hand, widen the sample to increase its representativeness or, on the other hand, focus on specific consumer segment identified on the basis of consumers’ sociodemographic and psychographic characteristics. A further limitation of the study resides in the selection of the wine attributes investigated as well as in the frame of some of them. Lastly, the hypothetical nature of the study and the scenario outlined in the B-W experiment (i.e., grocery store) may also have affected consumers’ preferences for some wine attributes (e.g., price). As a consequence, future research may replicate the study with a different frame or implement an incentive compatible mechanism to detect consumers’ preferences.
Author Contributions
Introduction, M.L.; Material and Methods and Results, M.S.; Discussion and conclusion and Limitations and further research, G.M. All authors have read and approved the final manuscript.
Funding
This research received no external funding.
Conflicts of Interest
The authors declare no conflict of interest.
References
- Sogari, G.; Mora, C.; Menozzi, D. Factors driving sustainable choice: The case of wine. Br. Food J. 2016, 118, 632–646. [Google Scholar] [CrossRef]
- Sajdakowska, M.; Jankowski, P.; Gutkowska, K.; Guzek, D.; Żakowska-Biemans, S.; Ozimek, I. Consumer acceptance of innovations in food: A survey among Polish consumers. J. Consum. Behav. 2018, 17, 253–267. [Google Scholar] [CrossRef]
- Nazzaro, C.; Lerro, M.; Marotta, G. Assessing parental traits affecting children’s food habits: An analysis of the determinants of responsible consumption. Agric. Food Econ. 2018, 6, 23. [Google Scholar] [CrossRef]
- Nazzaro, C.; Lerro, M.; Stanco, M.; Marotta, G. Do consumers like food product innovation? An analysis of willingness to pay for innovative food attributes. Br. Food J. 2019, 121, 1413–1427. [Google Scholar] [CrossRef]
- Lerro, M.; Raimondo, M.; Stanco, M.; Nazzaro, C.; Marotta, G. Cause Related Marketing among Millennial Consumers: The Role of Trust and Loyalty in the Food Industry. Sustainability 2019, 11, 535. [Google Scholar] [CrossRef]
- Lombardi, A.; Caracciolo, F.; Cembalo, L.; Lerro, M.; Lombardi, P. How does corporate social responsibility in the food industry matter. New Medit. 2015, 14, 2–9. [Google Scholar]
- Lerro, M.; Vecchio, R.; Nazzaro, C.; Pomarici, E. The growing (good) bubbles: Insights into US consumers of sparkling wine. Br. Food J. 2019. [Google Scholar] [CrossRef]
- Nunes, F.; Madureira, T.; Oliveira, J.V.; Madureira, H. The consumer trail: Applying best-worst scaling to classical wine attributes. Wine Econ. Policy 2016, 5, 78–86. [Google Scholar] [CrossRef]
- Chan, S.M.; Adzahan, N.M.; Ab Karim, S.; Karim, R.; Lasekan, O.; Regenstein, J.M. Consumer Preferences and Perceptions on Dealcoholised Wine. J. Food Prod. Mark. 2012, 18, 65–77. [Google Scholar] [CrossRef]
- Pomarici, E.; Vecchio, R. Millennial generation attitudes to sustainable wine: An exploratory study on Italian consumers. J. Clean. Prod. 2014, 66, 537–545. [Google Scholar] [CrossRef]
- Stasi, A.; Bimbo, F.; Viscecchia, R.; Seccia, A. Italian consumers’ preferences regarding dealcoholized wine, information and price. Wine Econ. Policy 2014, 3, 54–61. [Google Scholar] [CrossRef]
- Goodman, S.; Lockshin, L.; Cohen, E.; Fensterseifer, J.; Ma, H.; d’Hauteville, F.; Jaeger, S. International comparison of consumer choice for wine: A twelve country comparison. In Proceedings of the 4th international conference of the academy of wine business research, University of Siena Academy of Wine Business Research, Siena, Italy, 17–19 July 2008. [Google Scholar]
- Sellers-Rubio, R. Would you Pay a Price Premium for a Sustainable Wine? The Voice of the Spanish Consumer. Agric. Agric. Sci. Procedia 2016, 8, 10–16. [Google Scholar]
- Saliba, A.; Ovington, L.; Moran, C. Consumer demand for low-alcohol wine in an Australian sample. Int. J. Wine Res. 2013, 5, 1. [Google Scholar] [CrossRef]
- Pomarici, E.; Lerro, M.; Chrysochou, P.; Vecchio, R.; Krystallis, A. One size does (obviously not) fit all: Using product attributes for wine market segmentation. Wine Econ. Policy 2017, 6, 98–106. [Google Scholar] [CrossRef]
- Gil, J.M.; Sánchez, M. Consumer preferences for wine attributes: A conjoint approach. Br. Food J. 1997, 99, 3–11. [Google Scholar] [CrossRef]
- Cohen, E. Applying best-worst scaling to wine marketing. IJWBR 2009, 21, 8–23. [Google Scholar] [CrossRef]
- Casini, L.; Corsi, A.M.; Goodman, S. Consumer preferences of wine in Italy applying best-worst scaling. Int. J. Wine Bus. Res. 2009, 21, 64–78. [Google Scholar] [CrossRef]
- Lockshin, L.; Cohen, E. Using product and retail choice attributes for cross-national segmentation. Eur. J. Mark. 2011, 45, 1236–1252. [Google Scholar] [CrossRef]
- De-Magistris, T.; Groot, E.; Gracia, A.; Albisu, L.M. Do Millennial generation’s wine preferences of the “New World” differ from the “Old World”? Int. J. Wine Bus. Res. 2011, 23, 145–160. [Google Scholar] [CrossRef]
- Chrysochou, P.; Krystallis, A.; Mocanu, A.; Lewis, R.L. Generation Y preferences for wine. An exploratory study of the US market applying the best-worst scaling. Br. Food J. 2012, 114, 516–528. [Google Scholar] [CrossRef]
- Gassler, B. How green is your ‘Grüner’? Millennial wine consumers’ preferences and willingness-to-pay for eco-labeled wine. Jahrbuch der Österreichischen Gesellschaft für Agrarökonomie 2015, 24, 131–140. [Google Scholar]
- D’Amico, M.; Di Vita, G.; Monaco, L. Exploring environmental consciousness and consumer preferences for organic wines without sulfites. J. Clean. Prod. 2016, 120, 64–71. [Google Scholar] [CrossRef]
- Sogari, G.; Corbo, C.; Macconi, M.; Menozzi, D.; Mora, C. Consumer attitude towards sustainable-labelled wine: An exploratory approach. Int. J. Wine Bus. Res. 2015, 27, 312–328. [Google Scholar] [CrossRef]
- Vecchio, R. Determinants of willingness-to-pay for sustainable wine: Evidence from experimental auctions. Wine Econ. Policy 2013, 2, 85–92. [Google Scholar] [CrossRef]
- Tait, P.; Saunders, C.; Dalziel, P.; Rutherford, P.; Driver, T.; Guenther, M. Estimating wine consumer preferences for sustainability attributes: A discrete choice experiment of Californian Sauvignon blanc purchasers. J. Clean. Prod. 2019, 233, 412–420. [Google Scholar] [CrossRef]
- Schäufele, I.; Hamm, U. Consumers’ perceptions, preferences and willingness-to-pay for wine with sustainability characteristics: A review. J. Clean. Prod. 2017, 147, 379–394. [Google Scholar] [CrossRef]
- Bucher, T.; Deroover, K.; Stockley, C.S. Low-Alcohol Wine: A Narrative Review on Consumer Perception and Behaviour. Beverages 2018, 4, 82. [Google Scholar] [CrossRef]
- Kelley, K.; Hyde, J.; Bruwer, J.U.S. wine consumer preferences for bottle characteristics, back label extrinsic cues and wine composition. Asia Pac. J. Mark. Logist. 2015, 27, 516–534. [Google Scholar] [CrossRef]
- VIVA Sustainable Wine Project was Launched in 2011 by the Italian Ministry for the Environment, Land and Sea, for Measuring Sustainability Performance in Vineyards and Wine Production through the Analysis of Four Indicators: Air, Water, Vineyard and Territory. (“VIVA: La Sostenibilità nella Vitivinicoltura in Italia”). Available online: http://www.viticolturasostenibile.org/ (accessed on 19 March 2020).
- Finn, A.; Louviere, J.J. Determining the Appropriate Response to Evidence of Public Concern: The Case of Food Safety. J. Public Policy Mark. 1992, 11, 12–25. [Google Scholar] [CrossRef]
- Auger, P.; DeVinney, T.M.; Louviere, J. Using Best–Worst Scaling Methodology to Investigate Consumer Ethical Beliefs Across Countries. J. Bus. Ethic 2006, 70, 299–326. [Google Scholar] [CrossRef]
- Burke, P.; Eckert, C.; Davis, S. Segmenting consumers’ reasons for and against ethical consumption. Eur. J. Mark. 2014, 48, 2237–2261. [Google Scholar] [CrossRef]
- Lusk, G. Food values. Science 1917, 45, 345–350. [Google Scholar] [CrossRef][Green Version]
- Henseleit, M.; Kubitzki, S.; Teuber, R. Determinants of consumer preferences for regional food. In Proceedings of the 105th EAAE Seminar “International Marketing and International Trade of Quality Food Products”, Bologna, Italy, 8–10 March 2007. [Google Scholar]
- Marotta, G.; Nazzaro, C. Responsabilità Sociale e Creazione di Valore Nell’impresa Agroalimentare: Nuove Frontiere Di Ricerca; Economia Agro-Alimentare: Franco Angeli, Milano, 2012. [Google Scholar]
- Marotta, G.; Nazzaro, C.; Stanco, M. How the social responsibility creates value: Models of innovation in Italian pasta industry. IJGSB 2017, 9, 144–167. [Google Scholar] [CrossRef]
- Nazzaro, C.; Stanco, M.; Marotta, G. The Life Cycle of Corporate Social Responsibility in Agri-Food: Value Creation Models. Sustainaility 2020, 12, 1287. [Google Scholar] [CrossRef]
- Weatherell, C.; Tregear, A.; Allinson, J. In search of the concerned consumer: UK public perceptions of food, farming and buying local. J. Rural. Stud. 2003, 19, 233–244. [Google Scholar] [CrossRef]
- Stanco, M.; Lerro, M.; Marotta, G.; Nazzaro, C. Consumers’ and farmers’ characteristics in short food supply chains: An exploratory analysis. Stud. Agric. Econ. 2019, 121, 67–74. [Google Scholar] [CrossRef]
- Costanigro, M.; Scozzafava, G.; Casini, L. Vertical differentiation via multi-tier geographical indications and the consumer perception of quality: The case of Chianti wines. Food Policy 2019, 83, 246–259. [Google Scholar] [CrossRef]
- Lockshin, L.; Corsi, A.M. Consumer behaviour for wine 2.0: A review since 2003 and future directions. Wine Econ. Policy 2012, 1, 2–23. [Google Scholar] [CrossRef]
- Duarte, F.; Madeira, J. & Barreira, M.M. Wine purchase and consumption in Portugal-an exploratory analysis of young adults’ motives/attitudes and purchase attributes. Ciência e Técnica Vitivinicola 2010, 63–73. [Google Scholar]
- Schmit, T.M.; Rickard, B.J.; Taber, J. Consumer Valuation of Environmentally Friendly Production Practices in Wines, considering Asymmetric Information and Sensory Effects. J. Agric. Econ. 2012, 64, 483–504. [Google Scholar] [CrossRef]

© 2020 by the authors. Licensee MDPI, Basel, Switzerland. This article is an open access article distributed under the terms and conditions of the Creative Commons Attribution (CC BY) license (http://creativecommons.org/licenses/by/4.0/).